The goal of this study was to test the feasibility of implementing the proposed reconfigurable joints as a haptic device with force feedback. In the considered configuration, the haptic device was used to control a special 2-RFR ultraflexible parallel manipulator, developed in a CompMech research group (
http://www.ehu.eus/compmech, accessed on 26 December 2021), as shown in
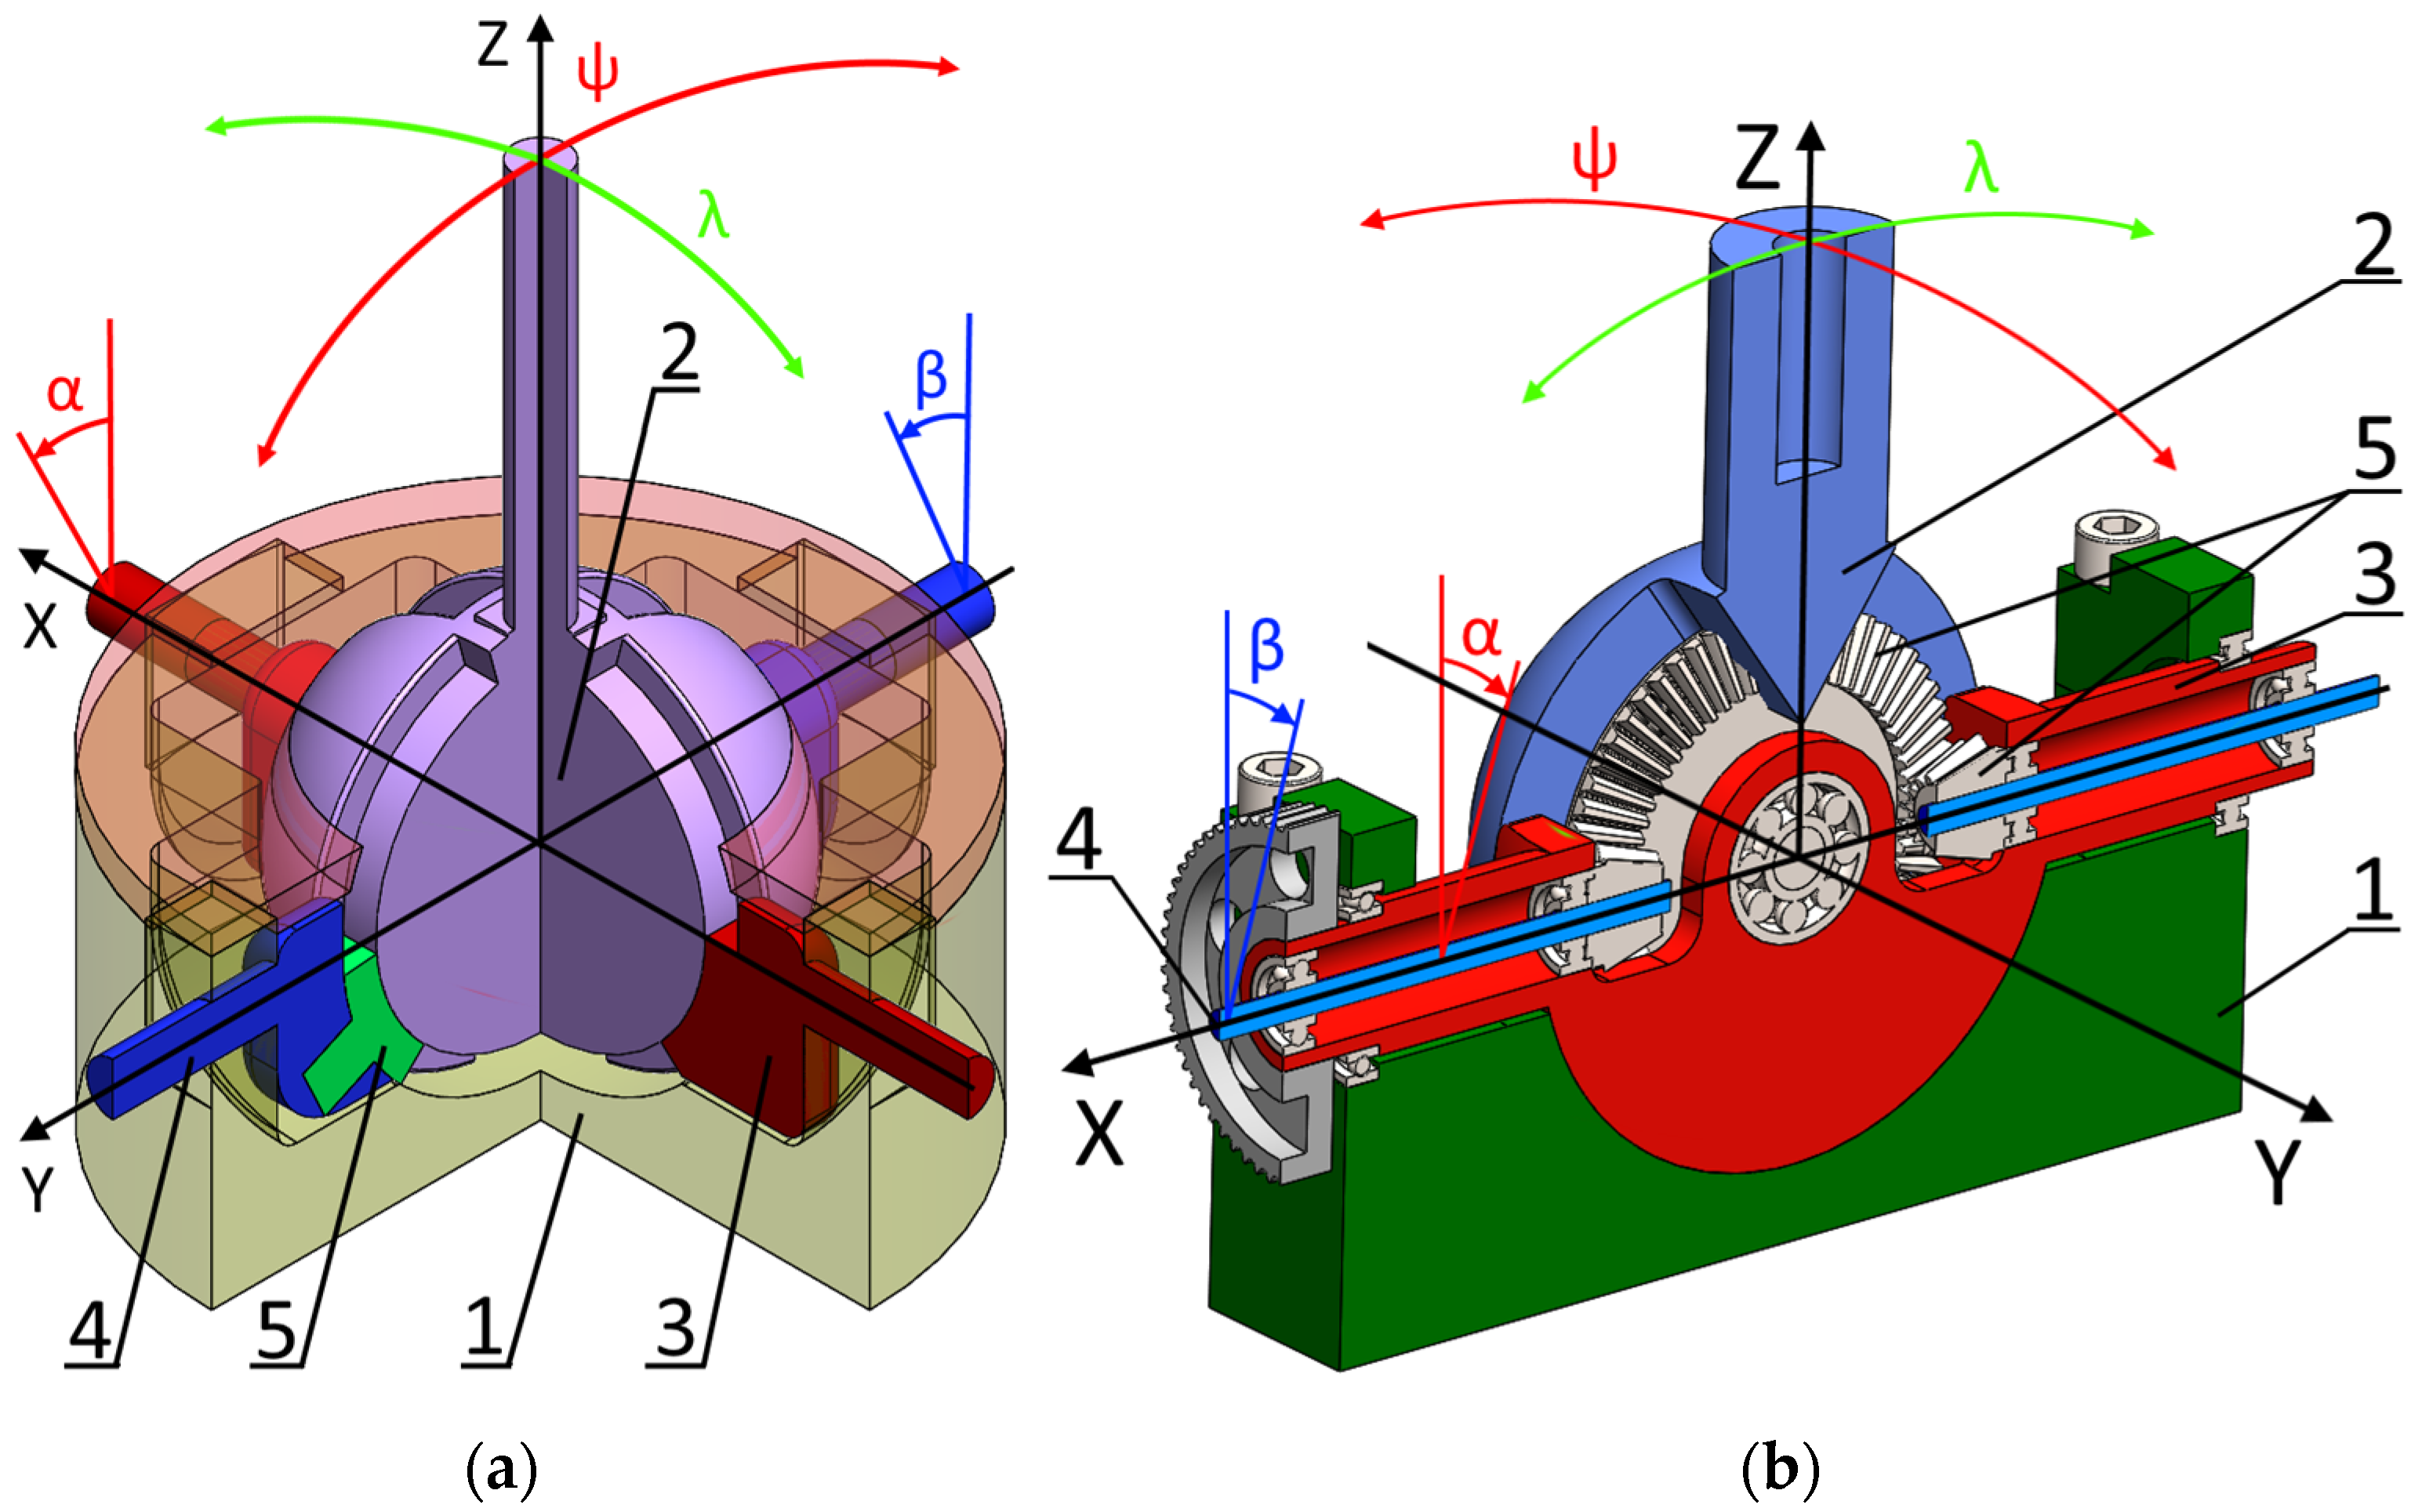
Figure 2b. The force feedback system in this haptic device is useful in indicating the proximity to singular positions that appear in this manipulator and to special areas of the workspace, where the mechanical energy is accumulated in the flexible bars and can be released in an uncontrollable way. In this kind of ultraflexible manipulator, when certain types of singular configurations are reached, an instability phenomenon occurs [
30]. For instance, it occurs when the end-effector of the mechanism makes a rapid transition from one aspect of the workspace to the other. As the exact moment of this “release” is hard to predict based only on visual feedback, the force feedback system was introduced. This system generates force in order to resist the operator’s attempts to approach the “unsafe” workspace area. The force increases as the end-effector gets closer to the undesirable zone.
The second objective of the current research was to identify the optimal working mode for the proposed application of the haptic device. Two working modes were proposed for the parallel manipulator control: velocity mode and position mode. In the velocity mode, the controlled parameter is the velocity vector of the end-effector. In the position control mode, the position of the haptic device handle is directly related to some position of the end-effector within the workspace. It was expected that the velocity control mode could provide better precision, as it is less dependent on the operator’s skill and haptic device resolution; meanwhile, the position mode would be more intuitive and faster.
3.1. Experimental Task Planning
Testing haptic devices involves a large number of operators as the performance of the device depends on human skill. In different studies, the number of participants has ranged from 10 [
31] to more than 50 [
32]. The tasks that are usually performed during the tests can be divided into objective and subjective tasks. The objective tests results are normally numerical and can be easily subjected to any kind of statistical analysis without further preparation. The subjective test results are based on human opinion and in order to put them into a form suitable for numerical assessment, special questionnaires are used. The National Aeronautics and Space Administration Task Load Index Assessment (NASA TLX) [
33] and After-Scenario Questionnaire—International Business Machines (ASQ IBM) [
34] are the questionnaires that are normally used in haptic device research. In these questionnaires, the operator is asked to grade several aspects of the test. In NASA TLX seven questions with a scale from 0 to 20 are used, and in ASQ IBM three questions with a scale from 1 to 7 are used. The obtained grade can be used in statistical tests. Among the most widespread tests in studies of haptic devices are the analysis of variance (ANOVA) [
35,
36,
37], the Mann–Whitney U test [
38,
39,
40,
41] and the Friedman test [
42,
43].
Considering the information provided, the requirements for the experiment were established. The group of testers should consist of 15–25 participants. The 2-RFR mechanism should be controlled in two modes: velocity and position. In order to obtain testers’ feedback, the NASA TLX questionnaire should be used, as it can provide more information.
In both working modes, a set of four tasks should be performed:
Defining the workspace boundaries/singular positions without force feedback.
Defining the workspace boundaries/singular positions with force feedback.
Execution of the proposed trajectory.
Following the leading object within a certain tolerance.
Of these tasks, the third and the fourth are the most important as they are intended to evaluate the general performance of all the haptic device parts and systems.
In addition, the reconfigurability should be tested by blocking one of the DOFs of the proposed joints. It was expected that this feature could provide precise straight motion in a horizontal or vertical direction, depending on the experimental setup. As this test produces a positive or negative result, it was decided that it would not be included in the tasks performed by the group of testers.
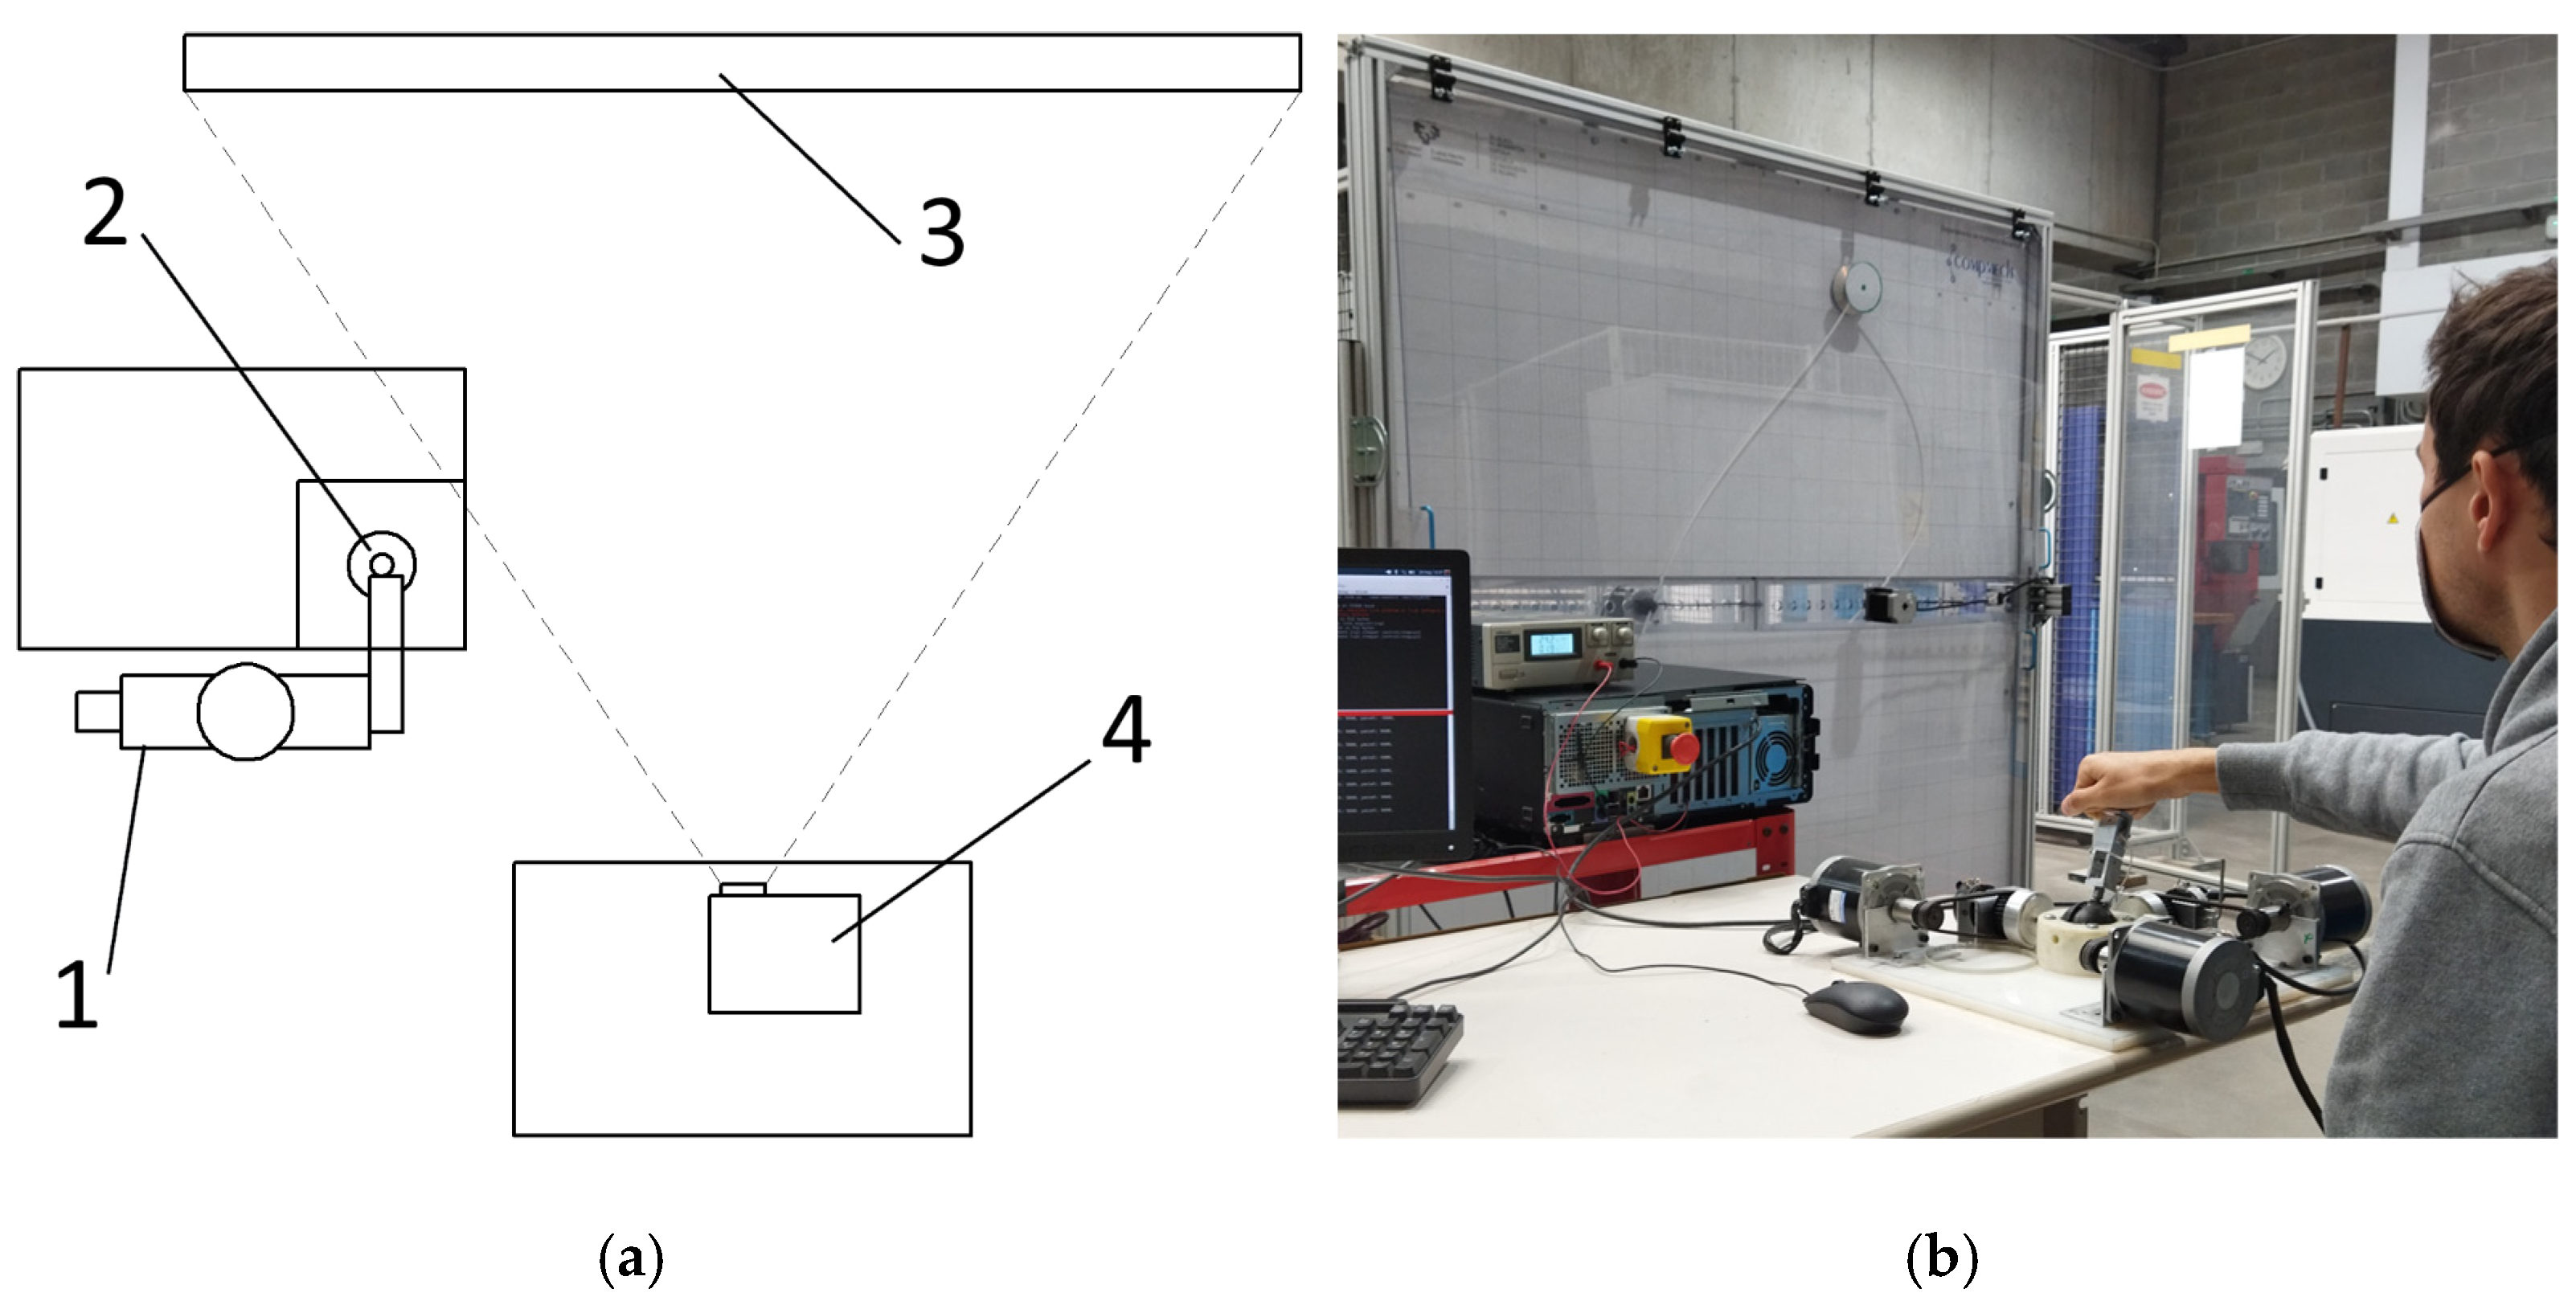
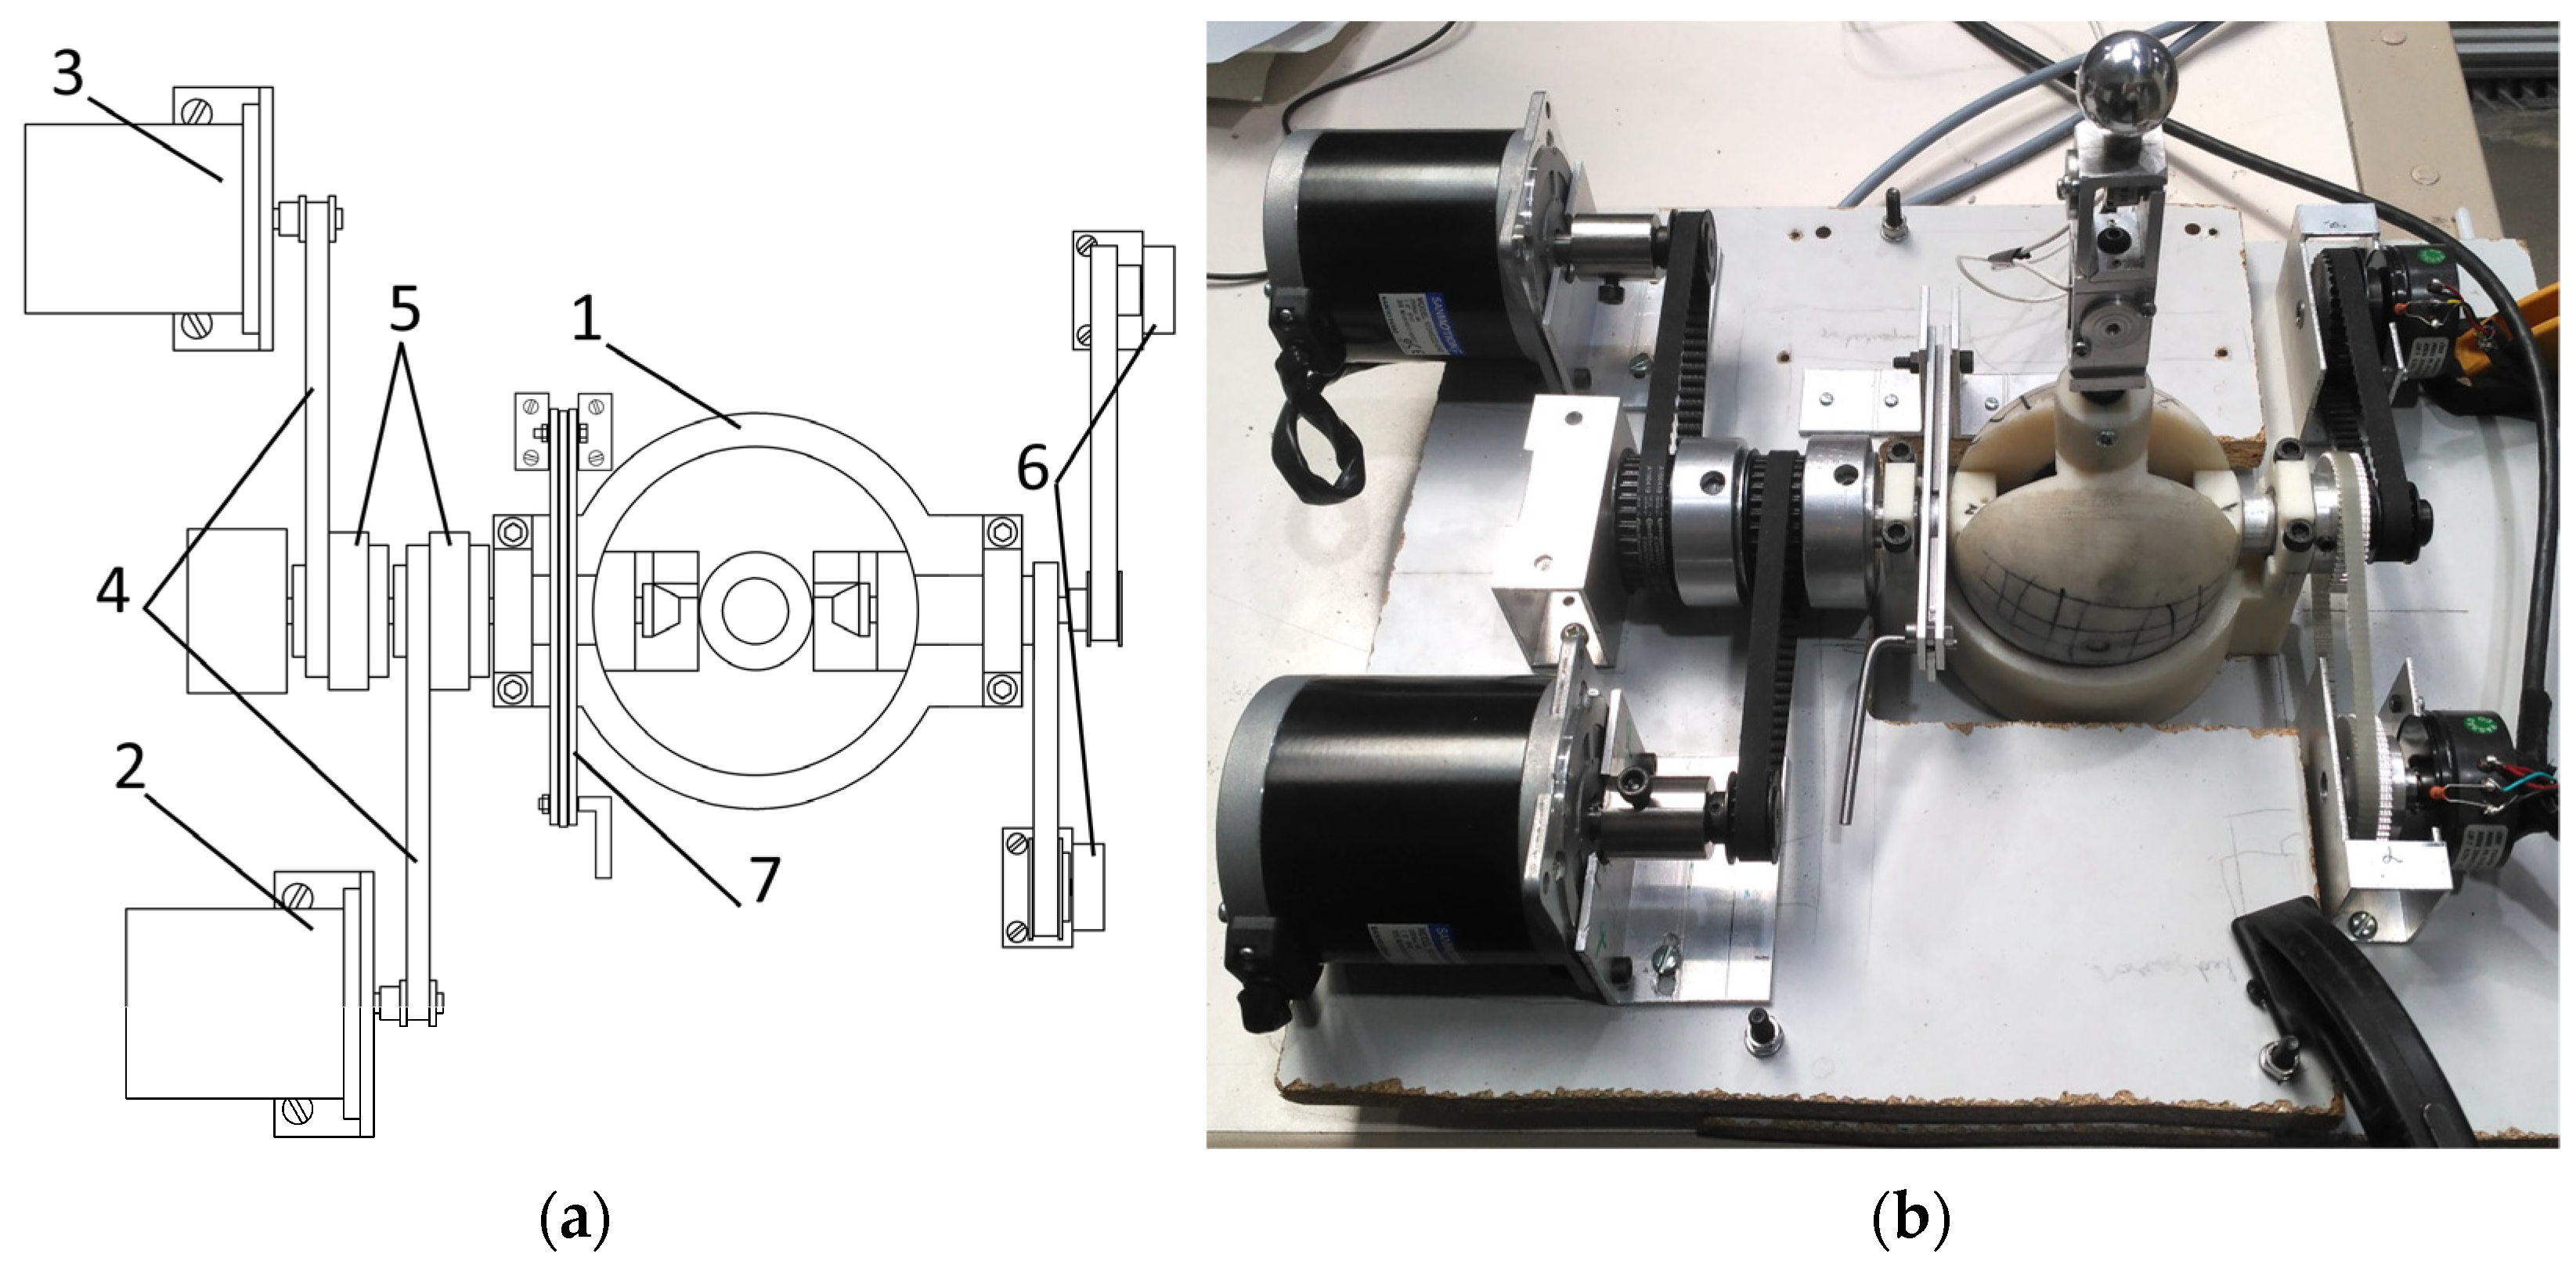
As the tasks require the visualization of different images (trajectory line, moving object) on the background of the controlled parallel mechanism, a digital projector was used. A schematic representation of the experimental setup is presented in
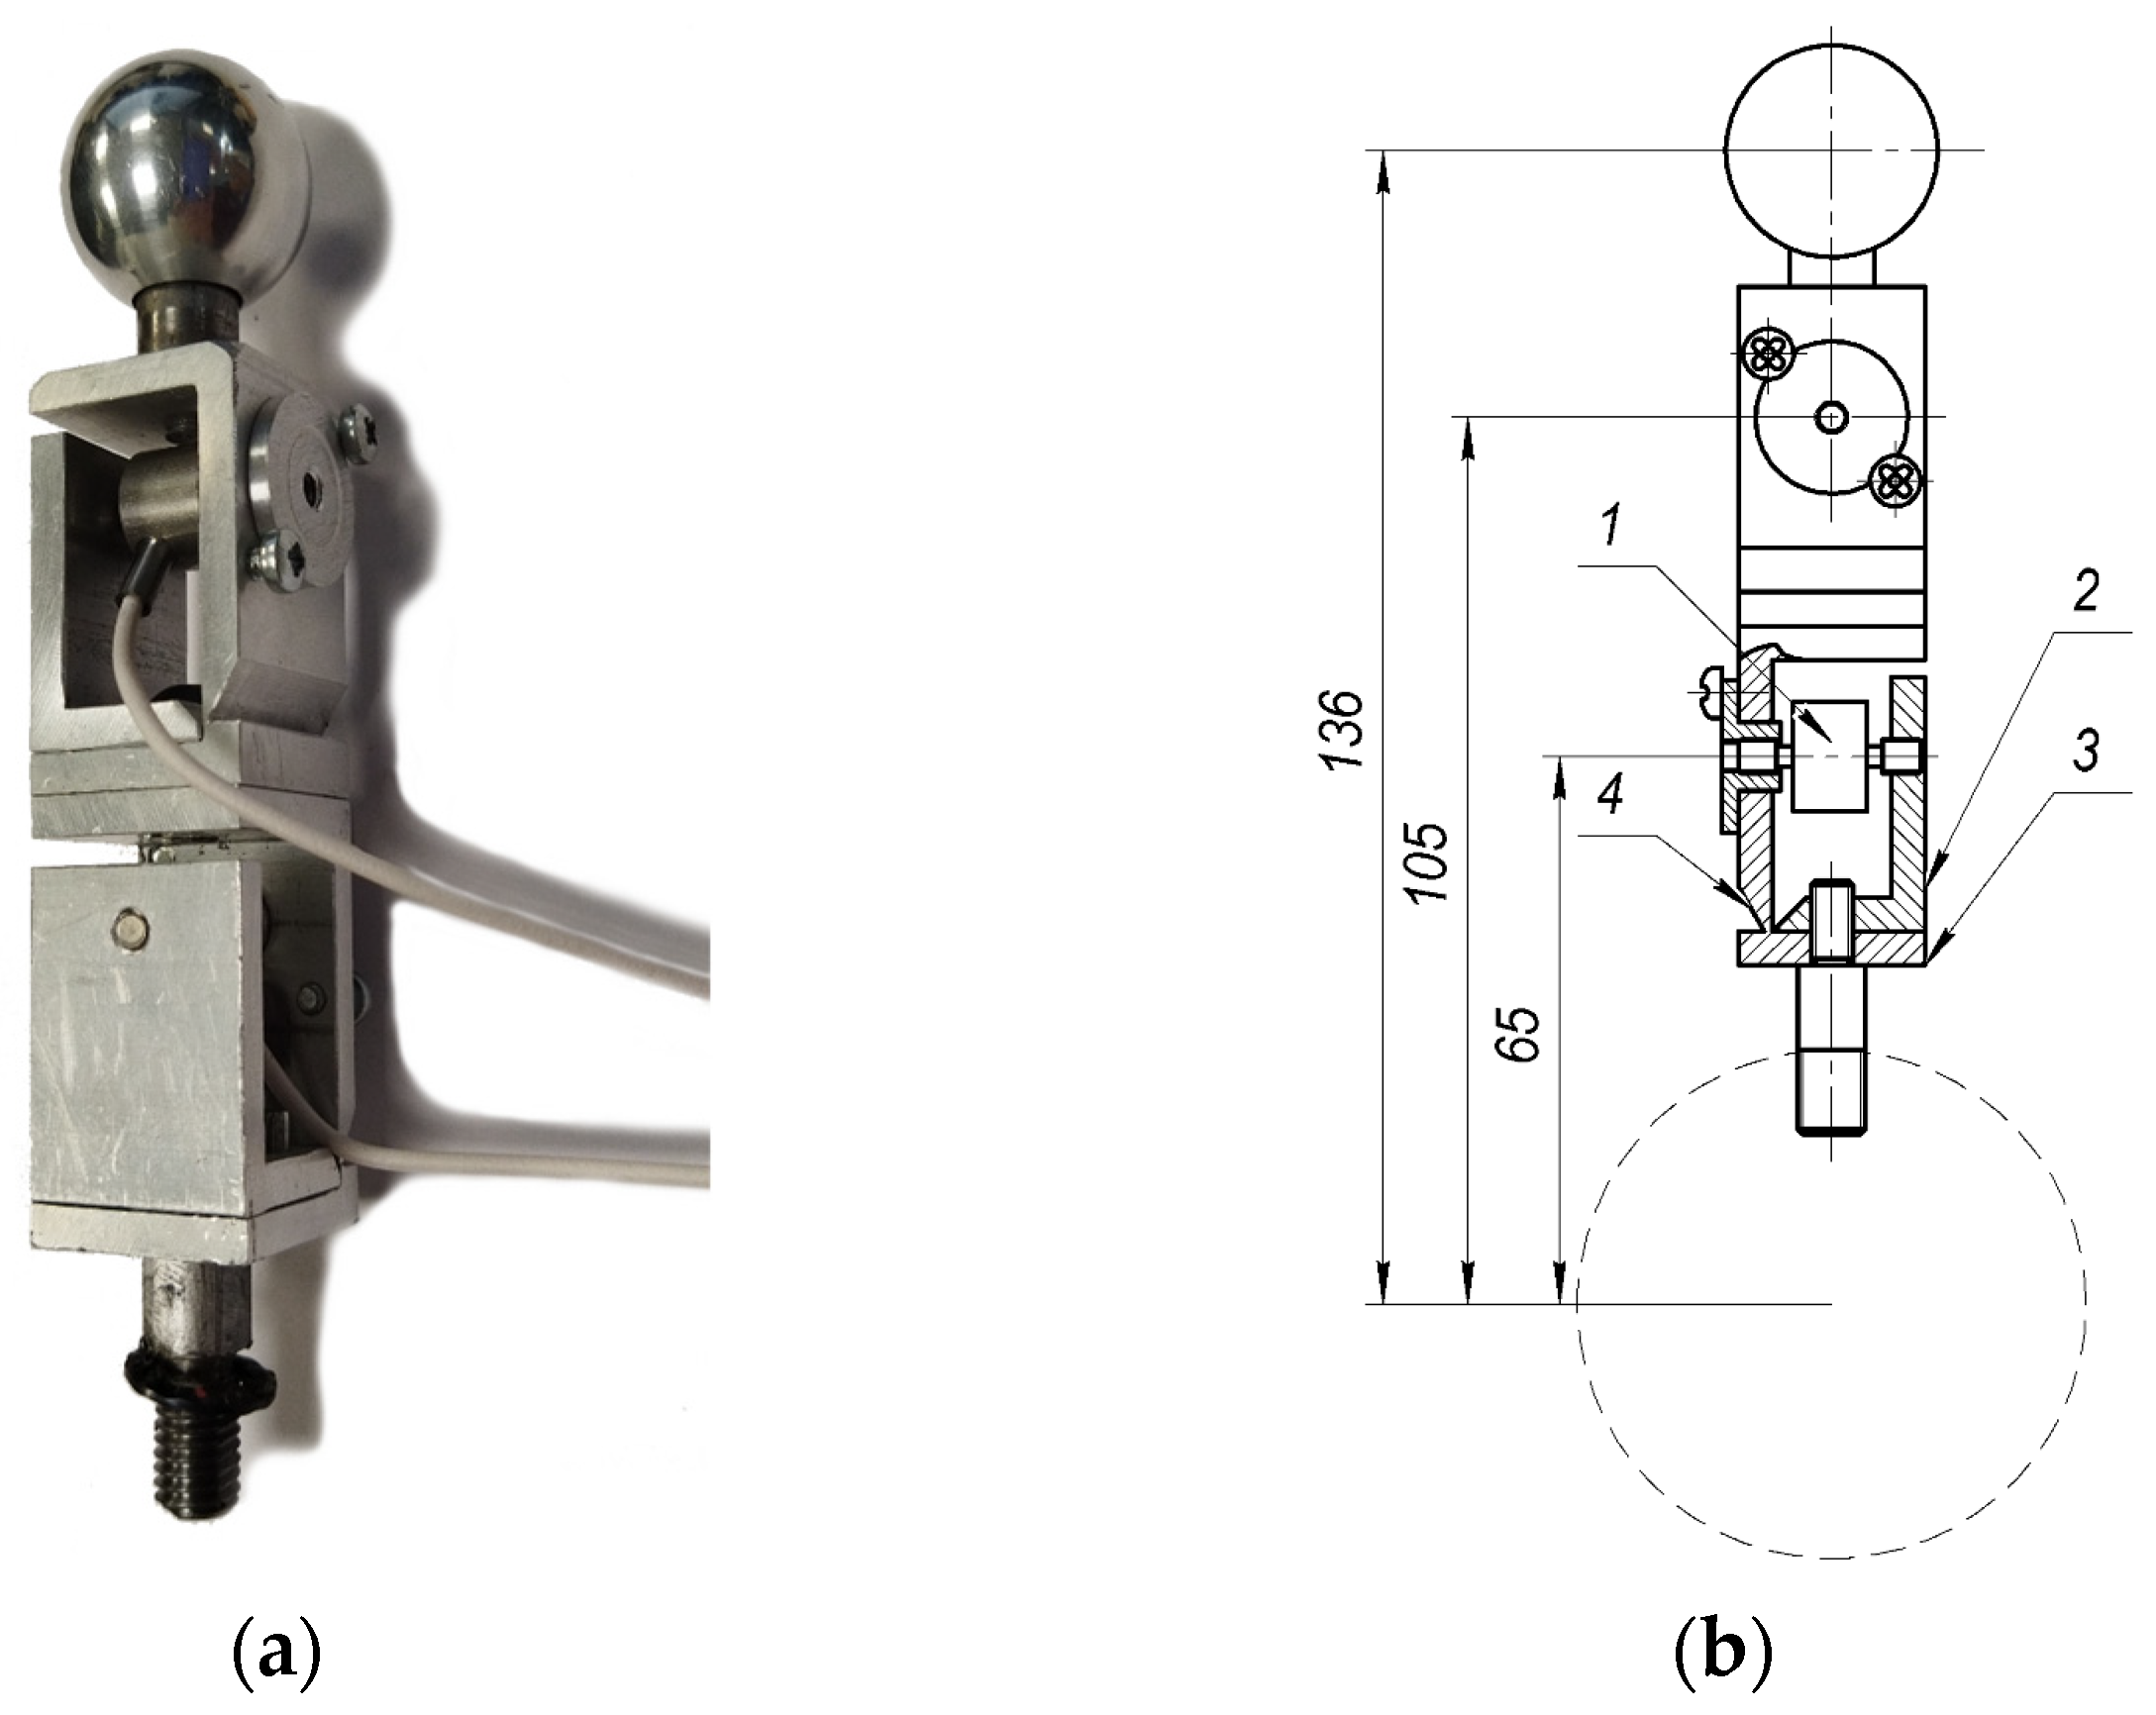
Figure 2a. The operator 1 holds the handle of the haptic device 2 and looks at the 2-
RFR parallel manipulator 3, where the image corresponding to the current task is projected with the projector 4. In the
Figure 2b the real experimental arrangement can be seen.
The main goal of tasks one and two was to estimate the performance of the force feedback system. It was necessary to draw conclusions on how helpful this system is for the operator. The second objective of these tasks was to introduce the testers to the haptic device controls. In the first test, the operator was asked to find the workspace limits intuitively, based only on visual feedback. In the second test the goal was the same; however, the force feedback system was turned on. As the workspace of the mechanism had a high amount of positions that were close to boundaries, several directions of end-effector motion were proposed for the operator: two vertical and two horizontal lines. This measure was also an attempt to save time. The operator was asked to choose. Starting with one of them, the operator moved the end effector along it until the boundary was reached, causing the end effector to stop. After that, the direction of motion should be changed to the opposite one. Once the first line was completed, the operator moved to the second line. When the test was completed, the operator was asked to fill out a NASA TLX form, where in the “Performance” section he/she was prompted to assess how successful he/she was in predicting the workspace border.
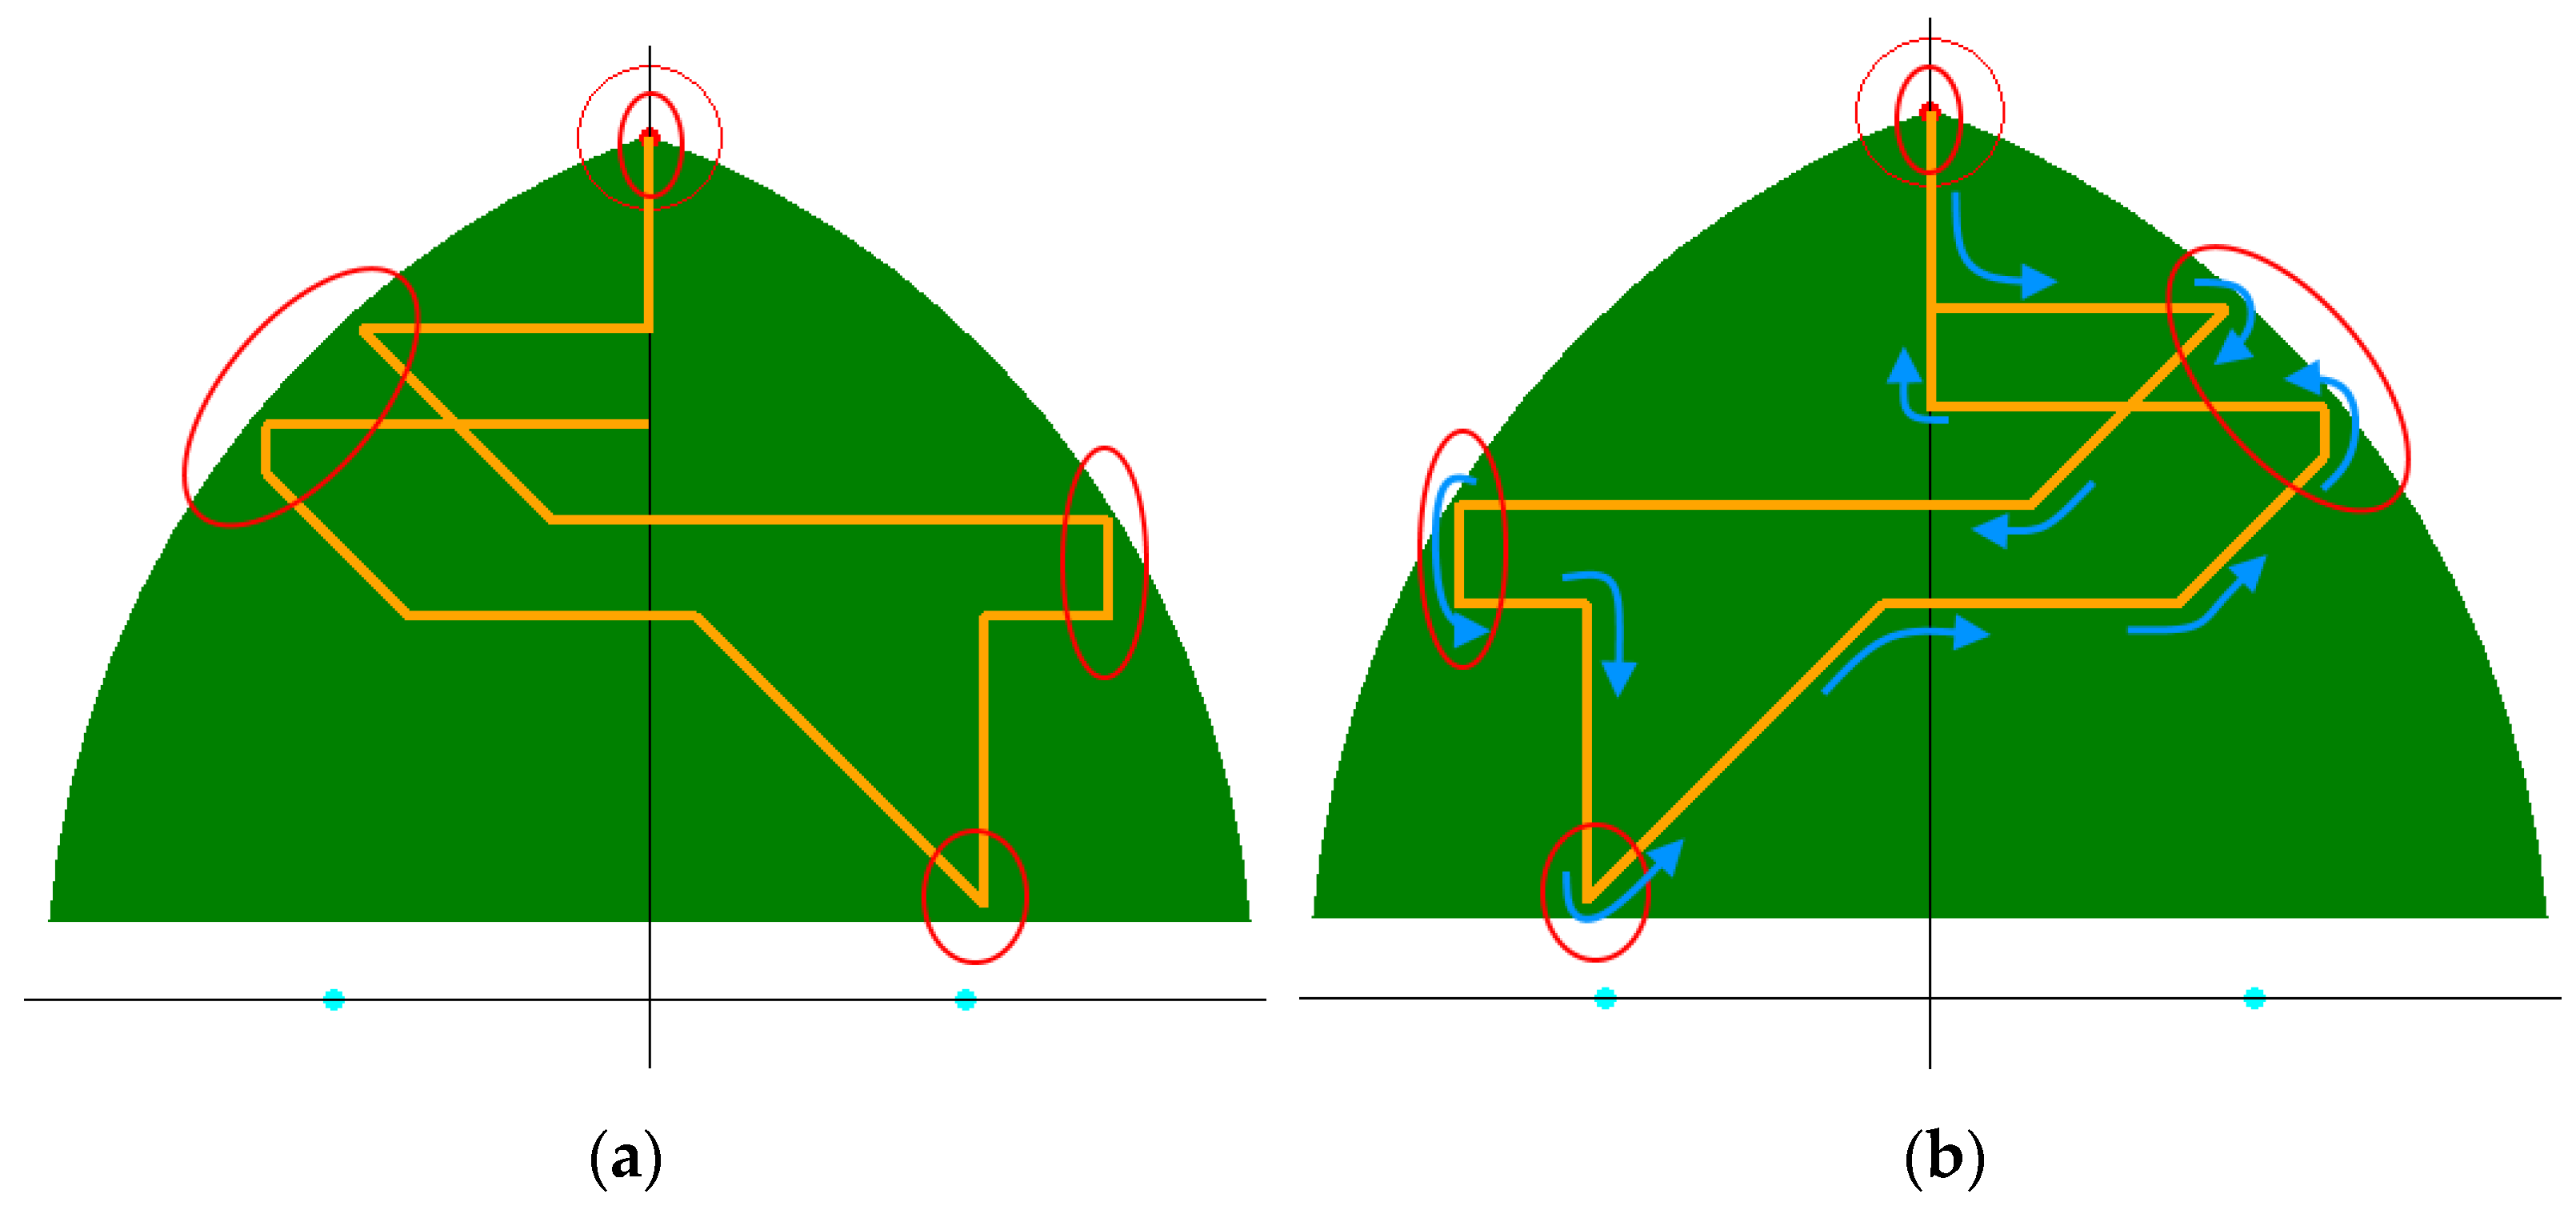
In task three, the accuracy of the control was assessed. The operator was asked to complete a predefined trajectory (indicated in orange in
Figure 3a).
The tester could see only the trajectory, but not the workspace (shown in green in
Figure 3a) or the parts of the trajectory that were close to the workspace border (shown in red ovals in
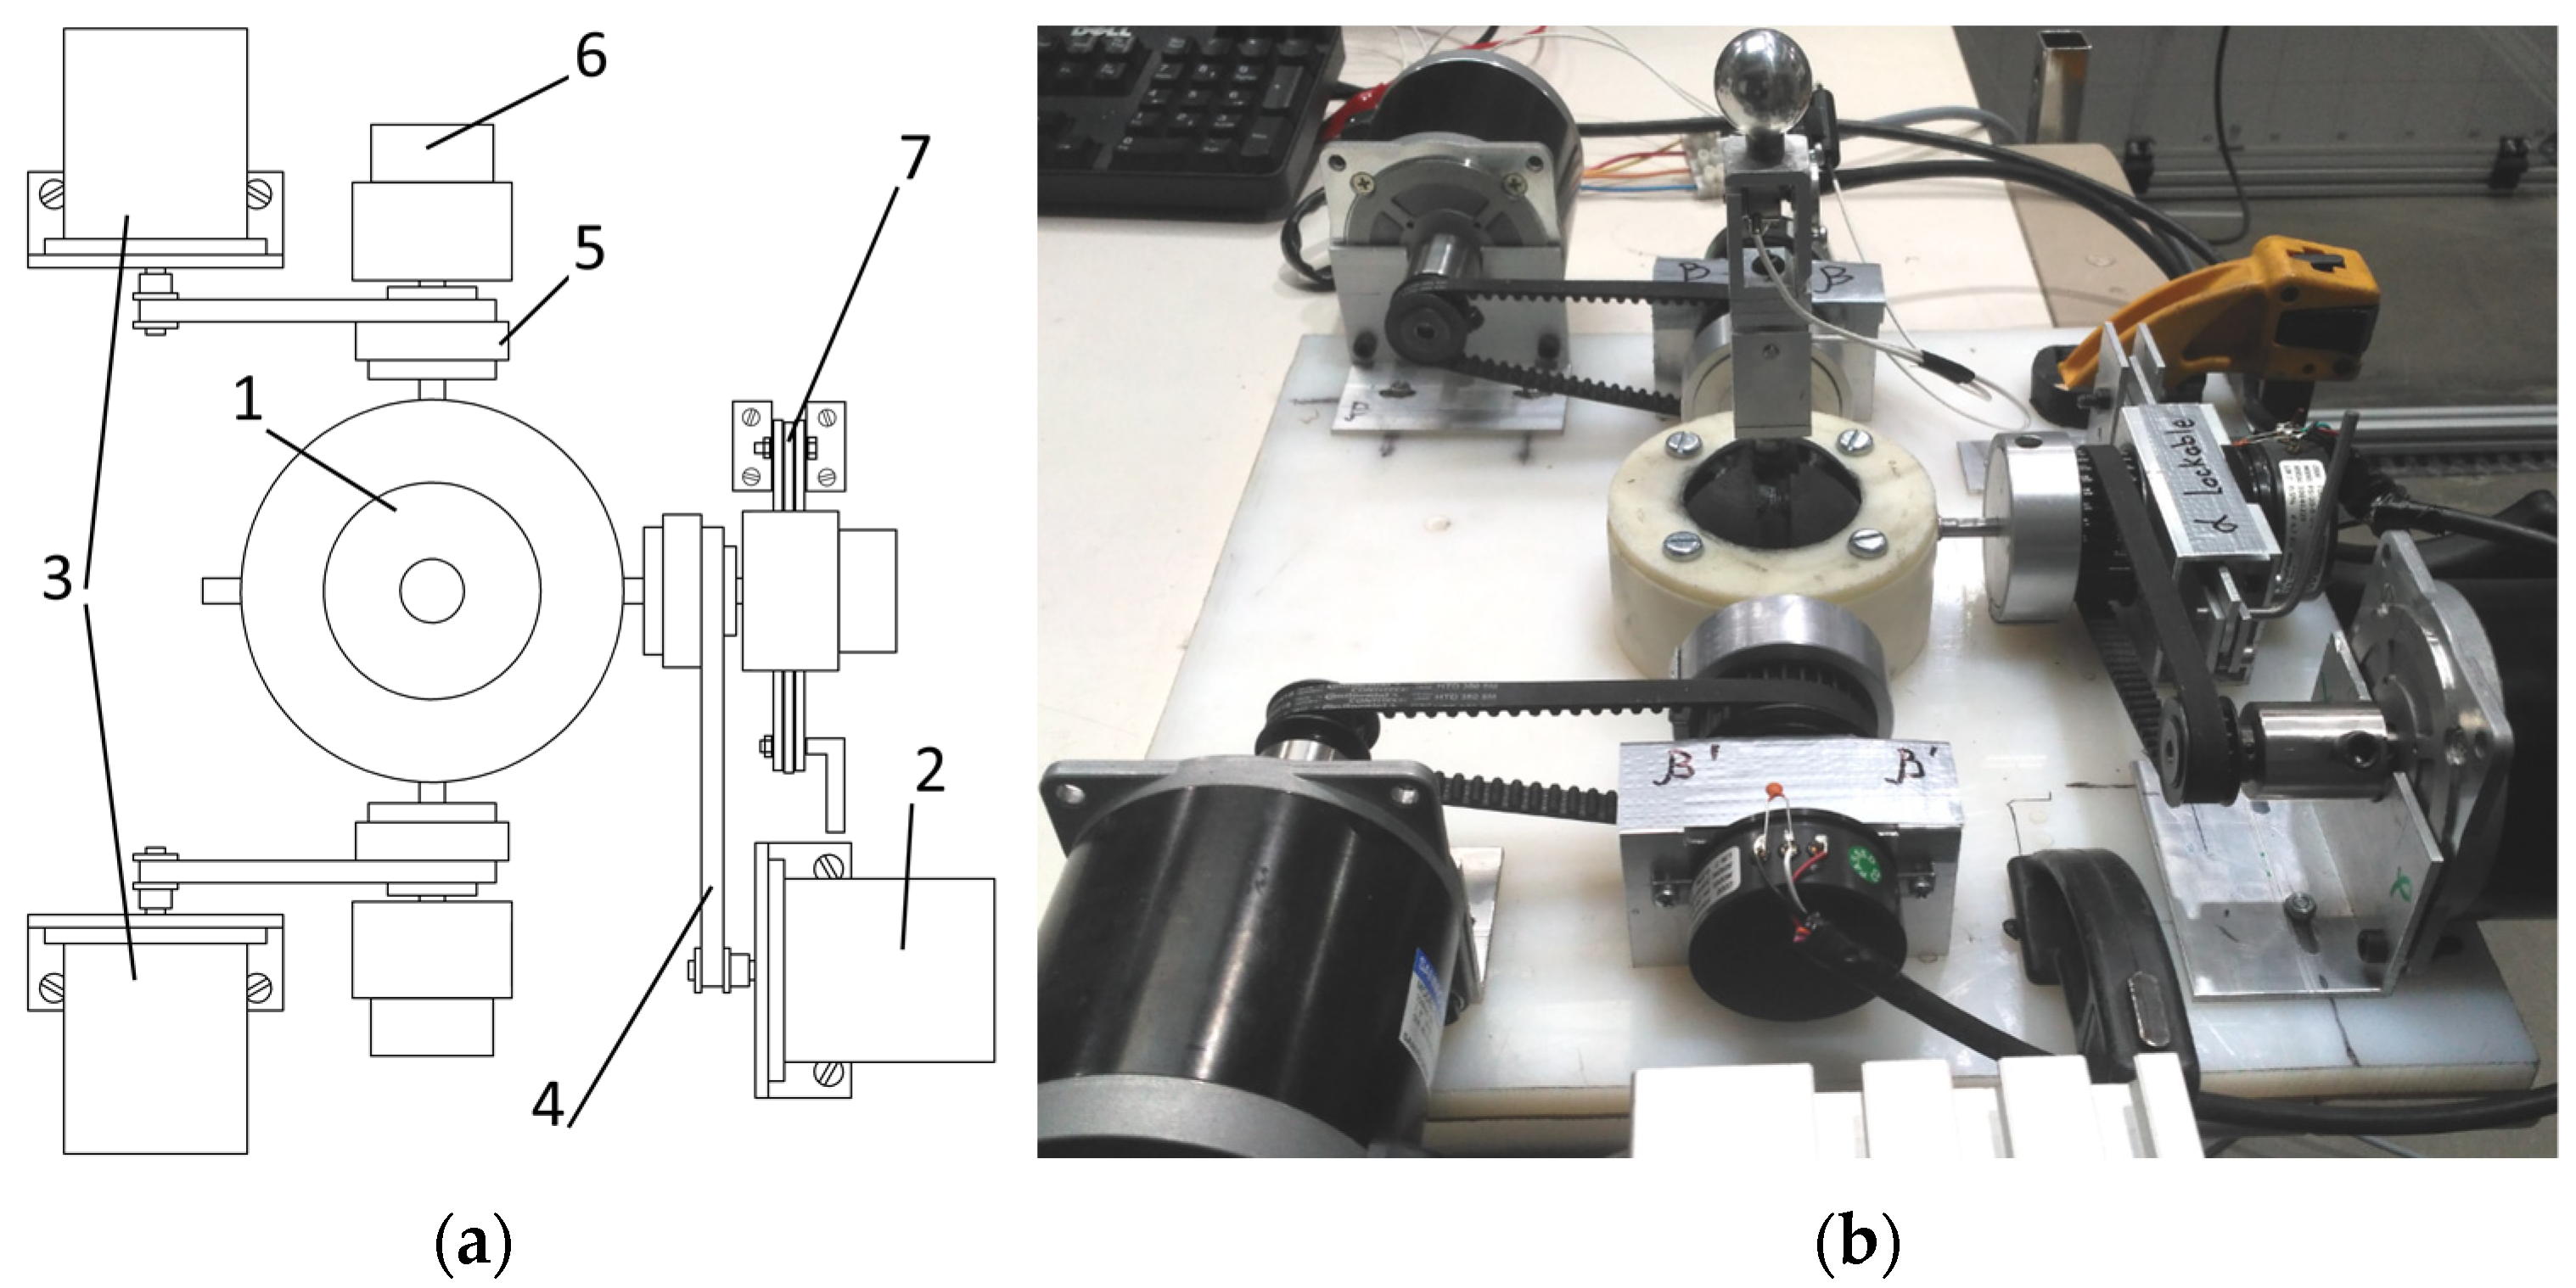
Figure 3a). The coordinates of the beginning and the end of the trajectory were (0, 90) cm and (0, 60) cm, respectively. There was no time limit in this task; the operator was to complete the trajectory as precisely as he/she was able to do. The task execution was filmed for further evaluation. The grading process involved counting the number of deviations from the proposed trajectory. It was decided that for the simplicity of counting, a deviation was defined as a case when the trajectory line left the borders of the CD disk that was attached to the end-effector of the 2-
RFR mechanism (see
Figure 2b). The radius of the standard CD disk is 6 cm; thus, this is the maximum distance between the trajectory line and the end-effector, and this was not counted as a deviation.
In task four, the tester followed the moving object within a certain tolerance. The main objective of this task was to evaluate the controllability of the haptic device in rapidly changing conditions. The task was assessed based on the precision of its execution. The moving object was a red dot with a red circle around it. The trajectory of the motion (shown in orange) of this object is presented in
Figure 3b, with the direction of motion indicated in blue arrows. The first and last points of the trajectory coincided at (0, 90).
During the test, the operator could only see the moving object. In the beginning, the end effector and the object stayed at the same point. When the test started, the operator needed to keep the center of the end-effector within the red circle of the moving object, which had a radius of 10 cm. The velocity of the object was in the range of 1–4 cm/s.
The execution of this task was also filmed for further evaluation. The number of cases when the center of the end-effector went out of the circle was counted. In order to make the results of all the tests uniform, tasks three and four were graded from 0 to 20. Here, 20 is the maximum number of deviations, representing a complete failure, and 0 represents a perfect result. If the amount of deviations exceeds 20, the maximum number is assigned.
3.2. Statistical Tools
In order to process the large amount of data that were obtained during the experiment, statistical analysis tools were used. These tools can indicate if the difference between compared sample means is statistically significant. In order to do this, the probability of means being the same is calculated. If this probability is smaller than a certain number
, the difference between the sample means is considered to be significant. In most cases a value of
equal 0.05 [
44] is acceptable.
In order to select proper statistical tools, the analyzed data distribution type should be identified. If the data have a normal distribution, parametric methods should be used; in the other case, or when the samples have a mixed data type—non-parametric methods should be used. The normality check can be implemented in two ways—graphical and numerical. The graphical method consists of a comparison of the sample distribution graph with the normal distribution graph. It is simple and fast; however, in some cases it cannot provide a definite result. The numerical methods are more reliable and provide definite results. There are many variations of numerical normality checks. In this study, the Shapiro–Wilk test was used as it provides higher statistical power [
45,
46] than the most commonly used Kolmogorov–Smirnov test (KS-test) [
47]. The Shapiro-Wilk test can be defined as
where
is the
-th smallest value of the sample (not to be confused with
, the
-th value of the sample);
is a coefficient, taken from the special tables related to this test; and
is the sample mean.
In this test, the null hypothesis, or the first assumption, was that the studied sample had a normal distribution. If the value of that was obtained from the calculation exceeds the critical value appropriate for the test, the null hypothesis has to be rejected and the data distribution is not normal. The critical value is taken from special tables, depending on the sample size and the value of .
In this study, the tasks required the analysis of two samples at a time, which was accomplished using paired and unpaired
t-tests for data with a normal distribution and Wilcoxon’s signed rank test and tge Mann–Whitney test for the mixed and non-normally distributed data [
48]. In the comparisons which involved samples with interconnected data (such as tasks 1 and 2, the control mode comparisons), the paired
t-test and Wilcoxon’s signed rank test were used. In cases where data did not have any connection (joint performance comparison), the unpaired
t-test and the Mann–Whitney test were used.


