3.2. Results of ANOVA
ANOVA is a standard statistical tool for determining the effects of a single parameter from all input process parameters. In this analysis, the percentage contribution of each parameter is used to measure its corresponding effect on the output response. In this study, ANOVA was used to analyze the influence of milling parameters, that is, spindle speed, feed rate, cutting depth, and milling spacing will affect the surface roughness.
Table 7,
Table 8,
Table 9 and
Table 10 list ANOVA results for surface roughness and four input parameters.
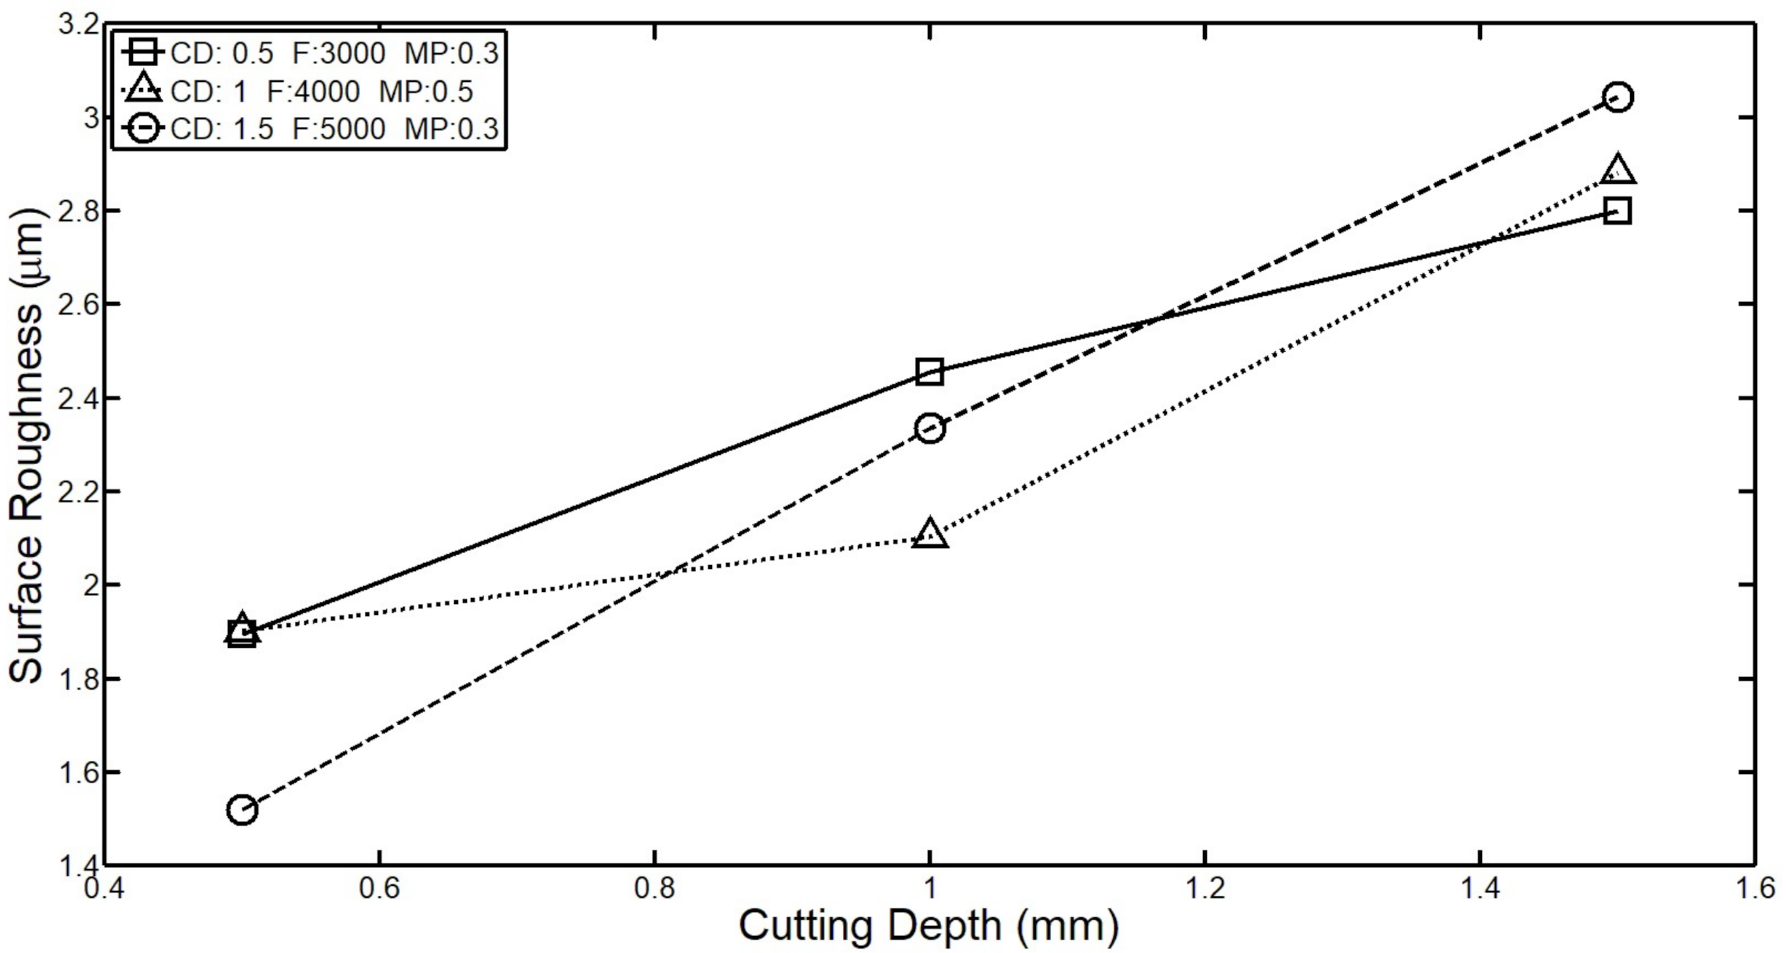
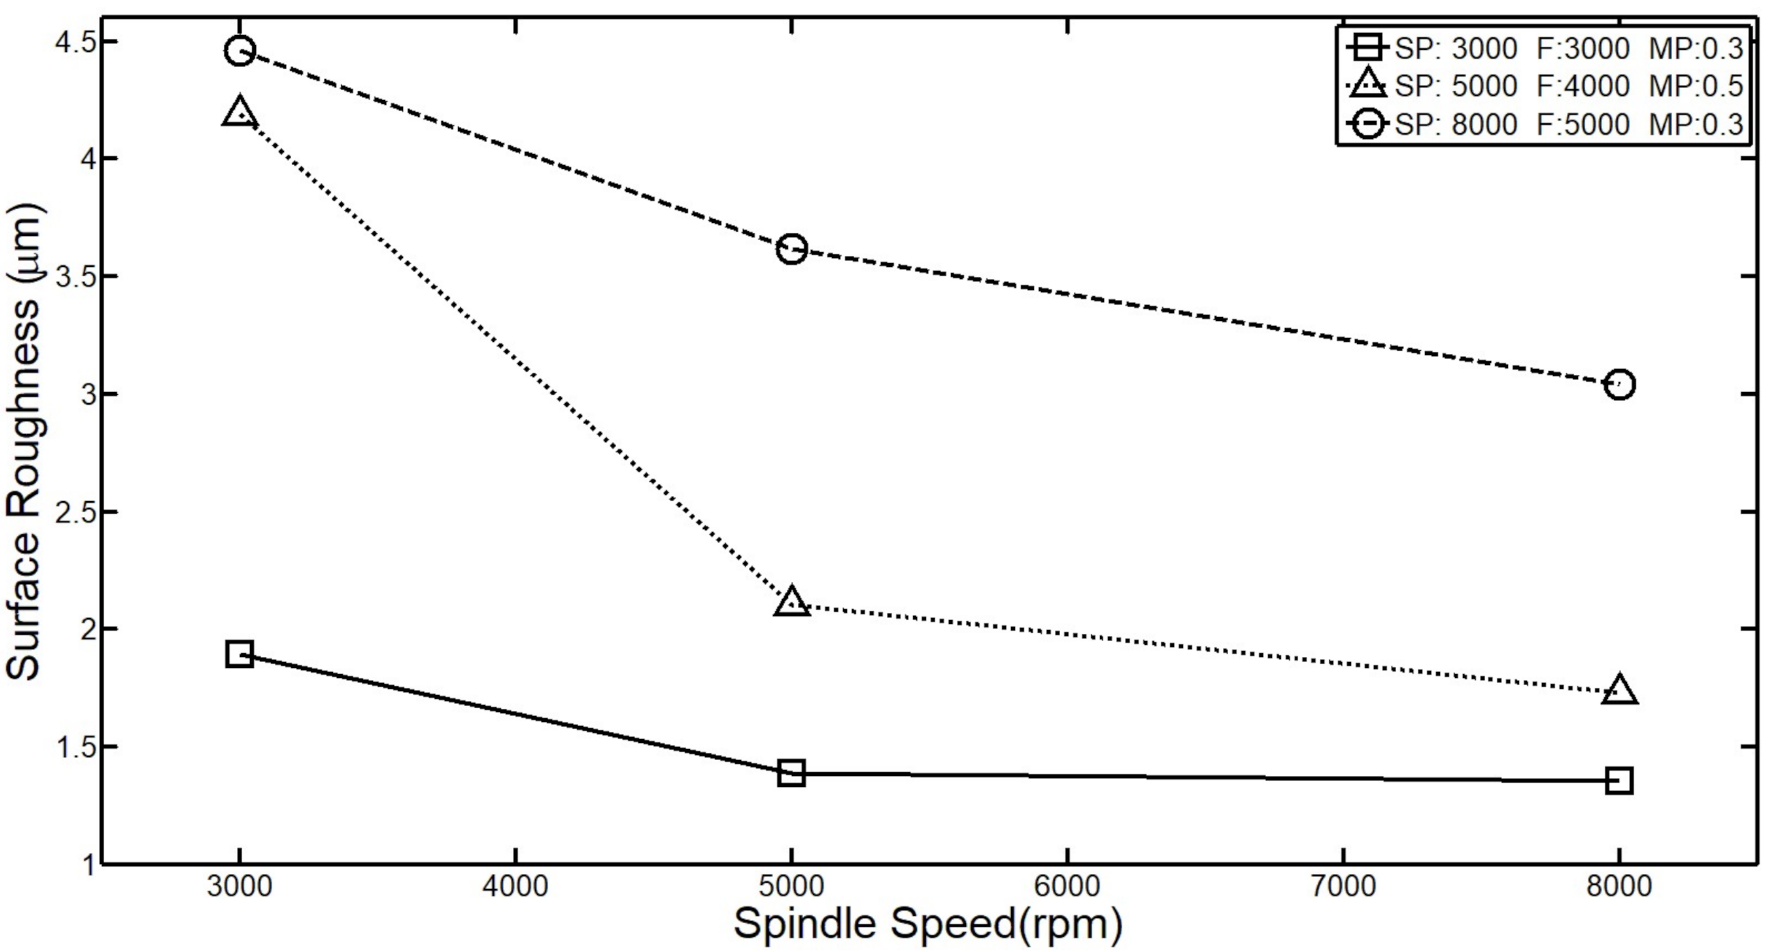
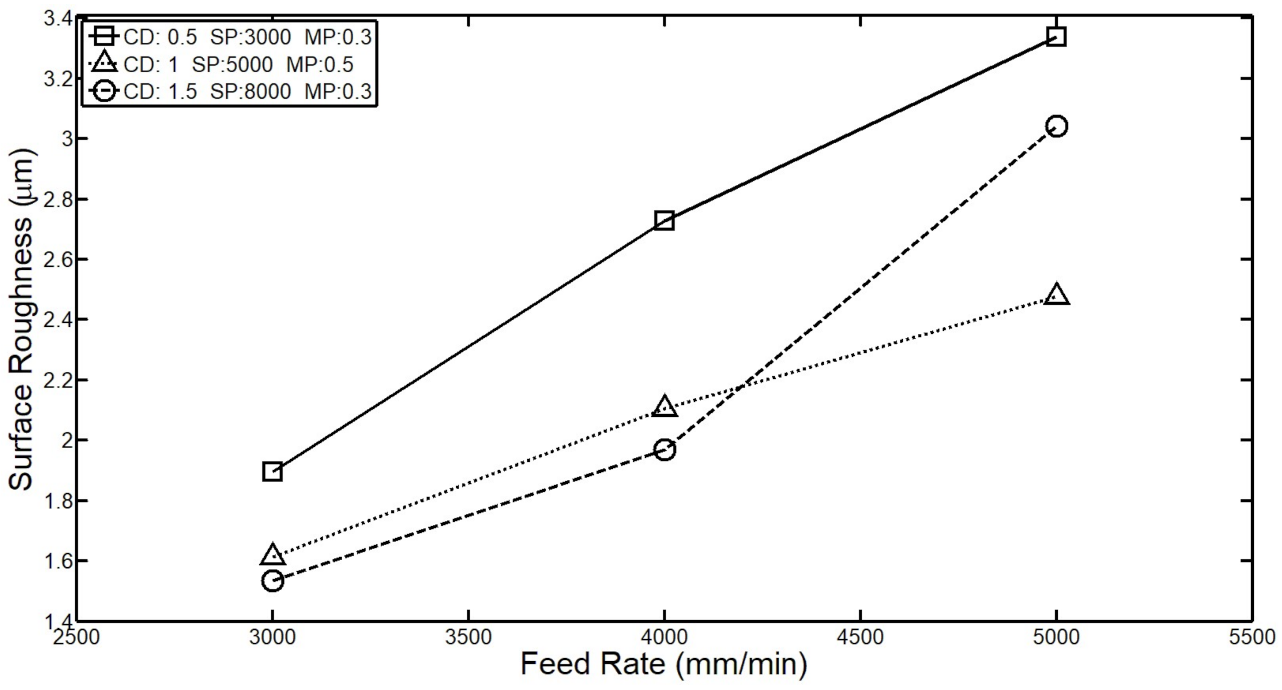
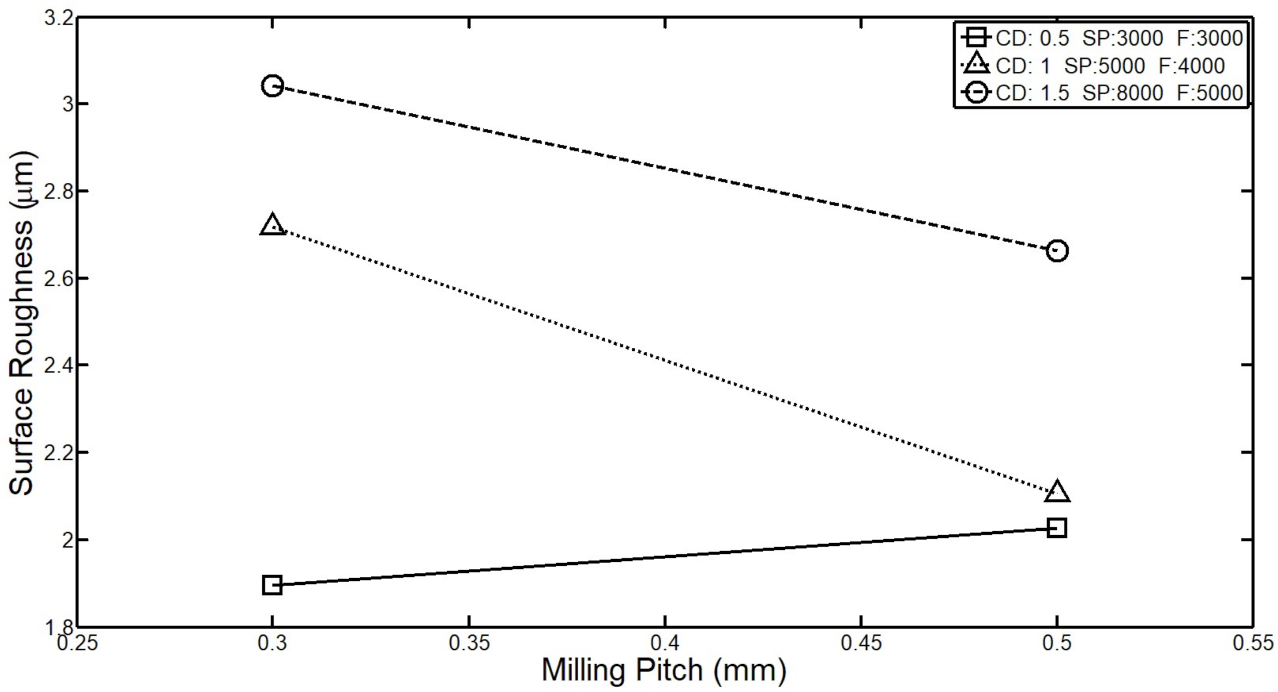
For the cutting depth, spindle speed, feed rate, and milling distance, p-values are far less than 0.0001, which means that these four processing parameters and surface roughness have a first relation. The main contribution of cutting depth was 51.86%. The contribution of spindle speed was 77.48%. The contribution of feed was 92.3%. The contribution of milling spacing was 71%. ANOVA statistics show that the cutting depth is a parameter with low contribution. From the value of F, it was found that the model is meaningful. In general, surface roughness is measured as a function of feed speed. Therefore, it has the physical significance and the greatest contribution. The contribution of spindle speed and milling spacing is similar.
3.3. Parameter Analysis of BPNN
The back propagation neural network is a multi-layer feedforward network with learning ability. It is a method to train the artificial neural network, including at least three layers (input layer, hidden layer, and output layer). Its learning is a kind of supervised learning. The training data and the target output data were input into the neural network, and the weights were adjusted repeatedly by using the gradient steepest descent method to minimize the error between the neural network output and the actual value. Next, we will introduce the theory and mathematical derivation of back propagation neural networks.
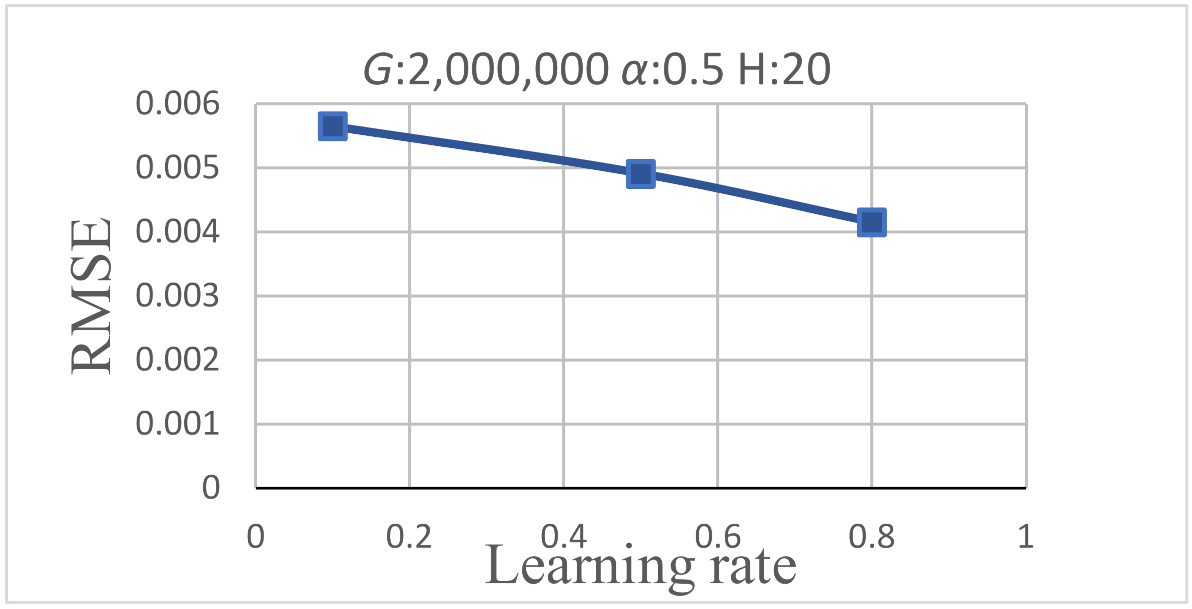
When the learning rate is too small, it can avoid network vibration. However, this phenomenon leads to slow convergence, which results in a slow learning rate. If the learning rate is too large, the target value can be approached faster. However, too much correction can result in network vibration, or even lead to network weight value divergence.
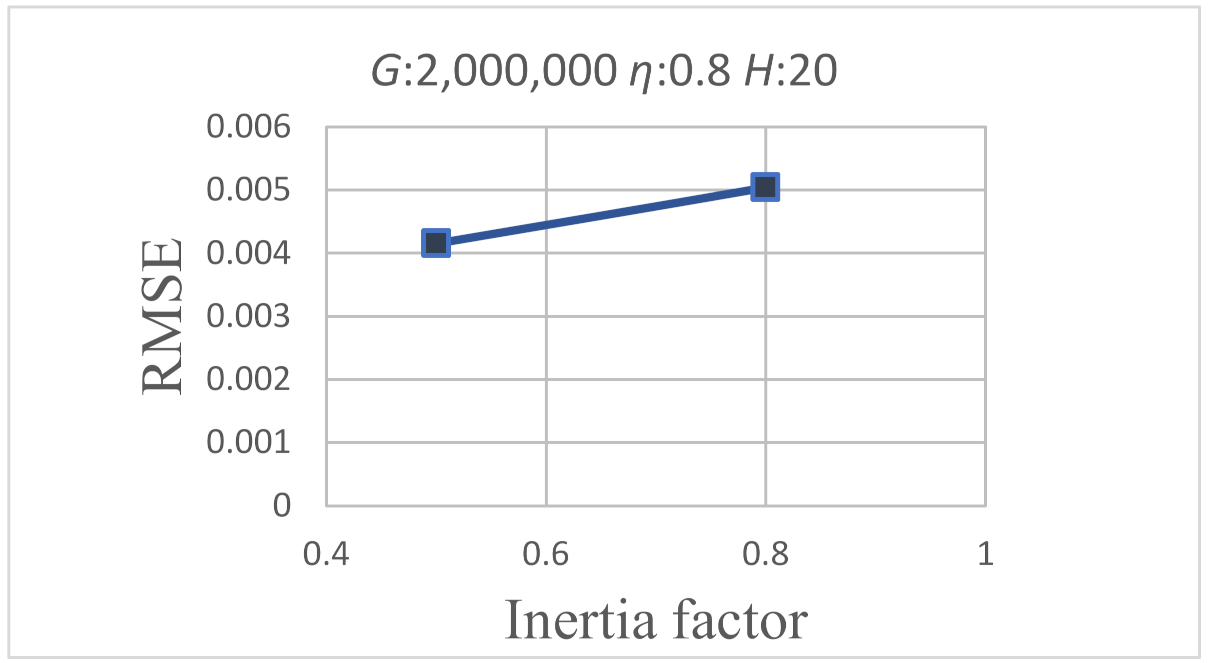
The inertia factor is the change from the previous weighted value to the next weighted value. Typically, the value is between 0 and 1. The weights should be moved in the same direction.
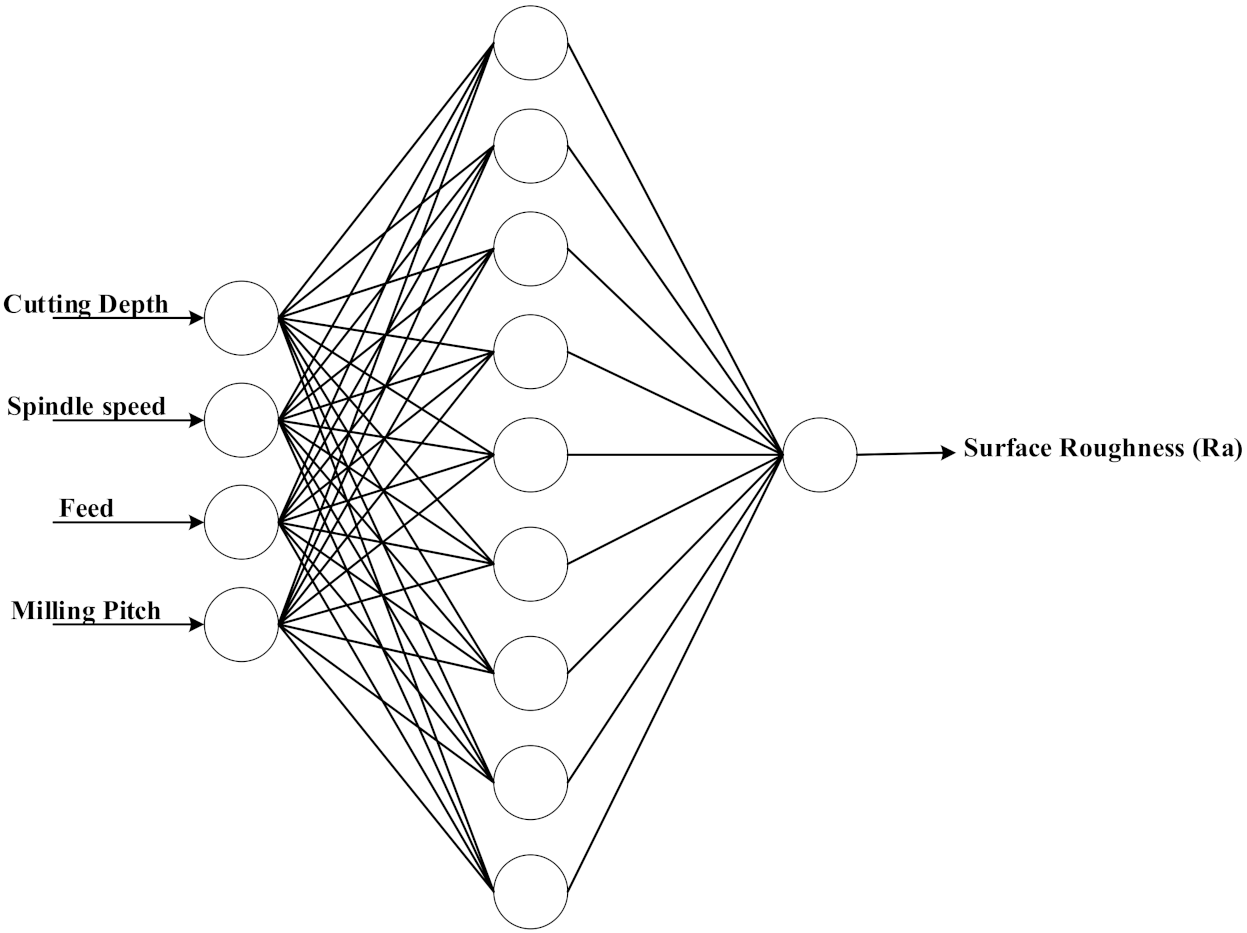
In this study, a three-layer BPNN was proposed (
Figure 7). The input layer had four neurons, including the feed, spindle speed, cutting depth, and milling spacing. According to the experiment, the hidden layer was divided into 20 and 30 neurons. The following experiment was conducted to analyze the number of hidden layer neurons. One neuron in the output layer was surface roughness.
The target value of each training data back propagation neural network (Tn) and back propagation neural network output prediction (Yn), calculation error, and RMSE were calculated between two calculations.
The RMSE is the square root of MSE and denotes the accuracy of the prediction and the degree of deviation between the predicted and target values. The smaller the value is, the higher the accuracy is.
The RMSE is calculated as follows:
where
N is the total number of data.
We analyzed these parameters in
Table 11. The iteration of the RMSE (
g), vector (
η, eta), inertial factor (
α, alpha), and the number of hidden layer neurons (H
n) are depicted, and the RMSE values are listed in in
Table 11.
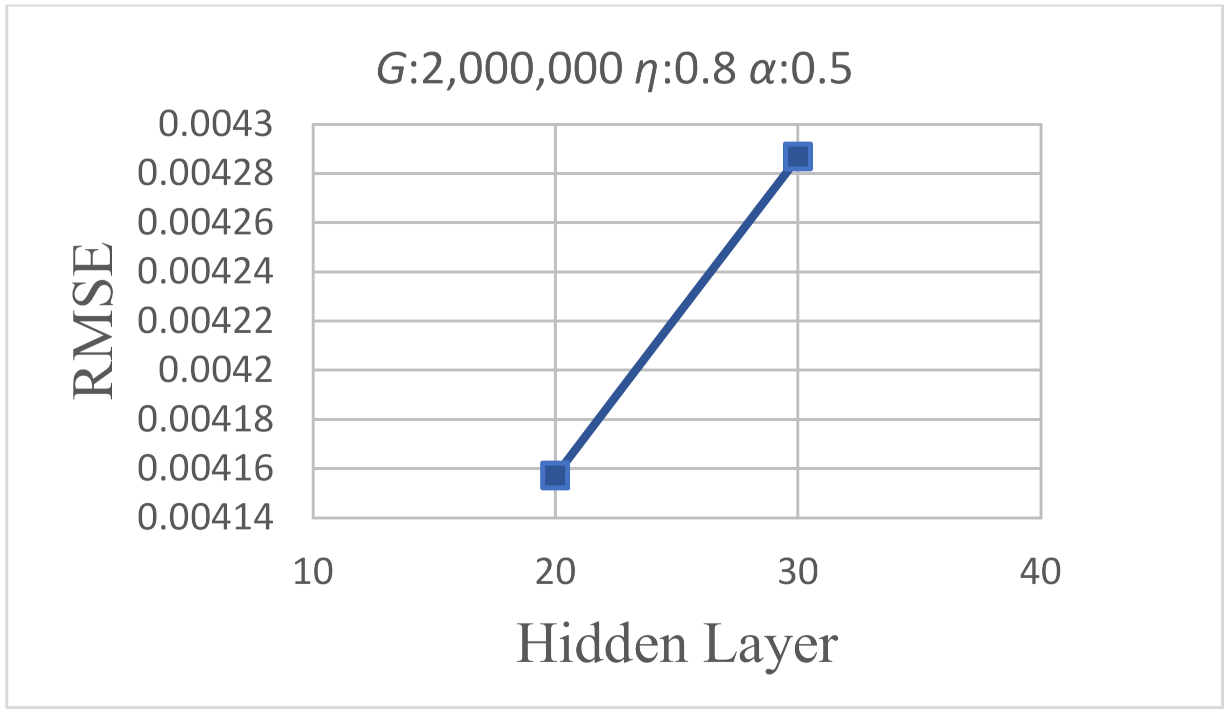
Too few neurons in the hidden layer can lead to large errors. Here, the number of hidden layer neurons was too large. Although the error value can be reduced, this slows the convergence rate.
Table 12 indicates that the lowest RMSE was obtained for experiment 36. The inertia factor for all the experiments was 0.8. Next, we analyzed the RMSE changes for the four parameters (
Figure 8,
Figure 9,
Figure 10 and
Figure 11).
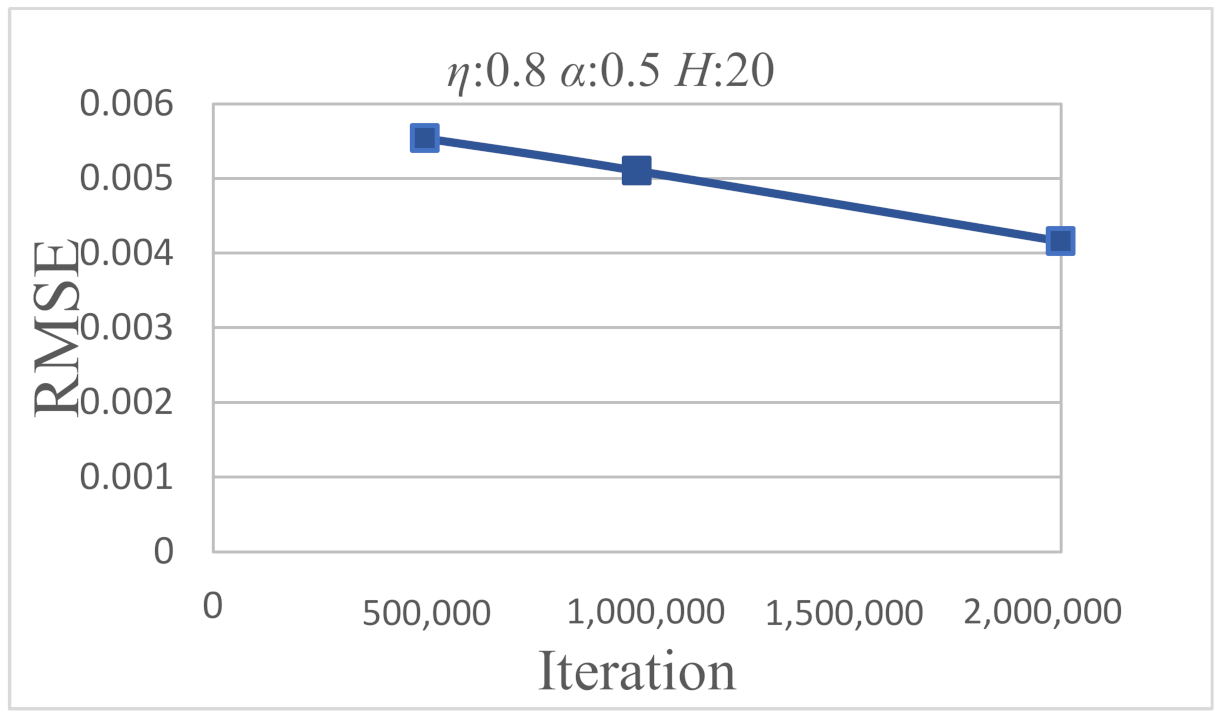
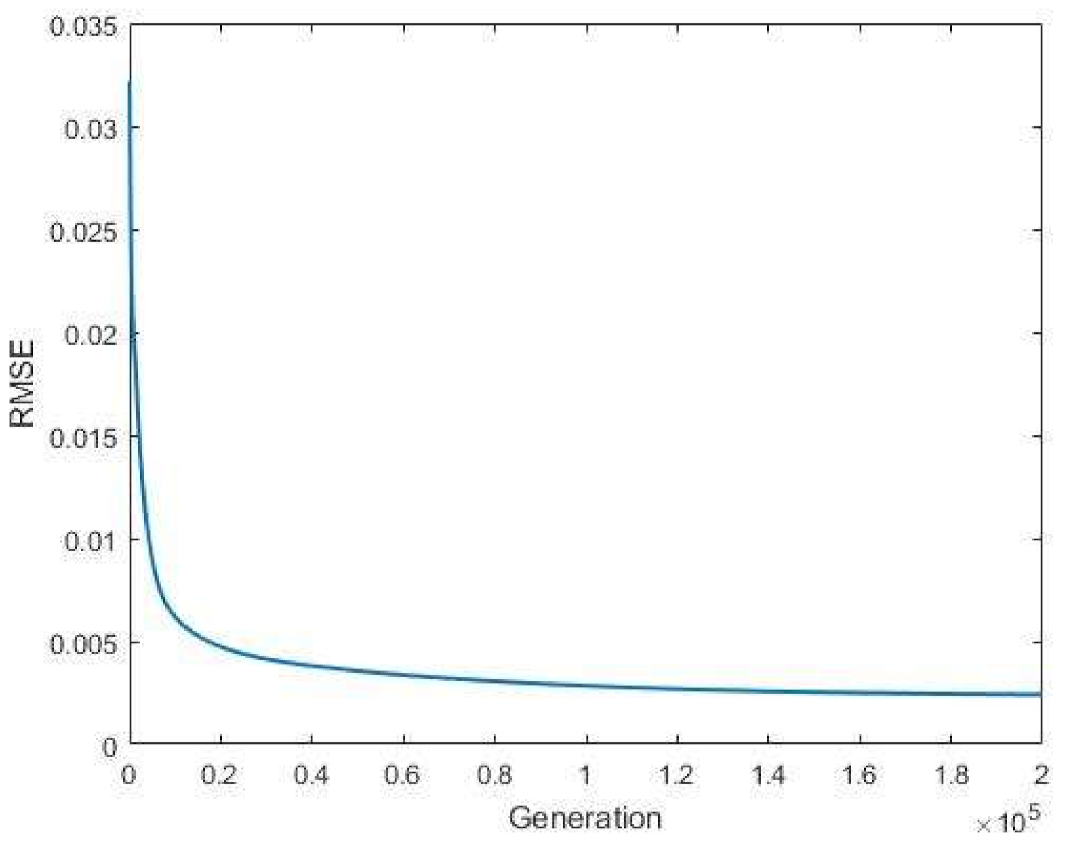
The results of the experiments indicated that the number of iterations increased from 500,000 to 1,000,000 and then to 2,000,000. The RMSE decreased with the increase in the number of iterations. However, iterations did not affect the training time, learning rate, and inertia factor.
According to
Figure 10, the higher the learning rate is, the lower RMSE is.
The experiment result indicated that an increase in the inertia factor reduces the RMSE. If the value is too small, the error does not converge, resulting in the RMSE being too large.
The results in
Figure 11 indicate that number of neurons in the hidden layer has a negligible effect on the RMSE. Too many neurons can result in divergence and can increase the training time, leading to increased errors.
3.4. Predictive Results of BPNN
According to
Table 12, the lowest RMSE was obtained for experiment 36.
Figure 12 illustrates the learning rate curve of each experiment and presents a representation of the convergence process and MSE. The learning rate graph was obtained by calculating the average value of 10 experiments.
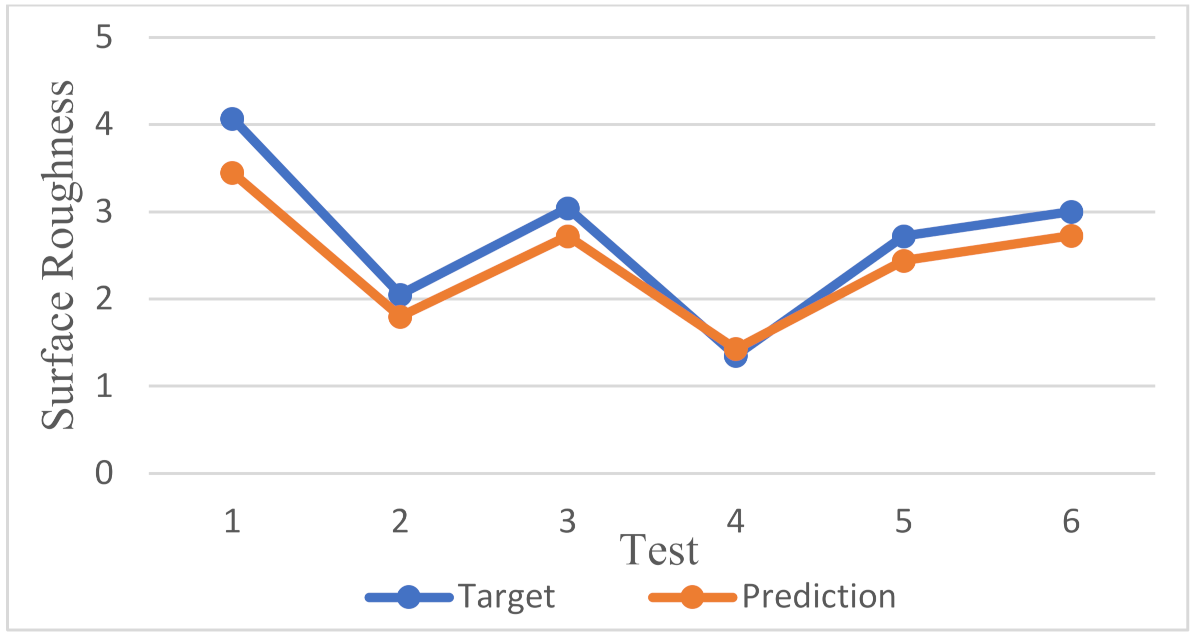
The measured value of the surface roughness instrument used in this experiment is the third place after the decimal point, and thus, the error value is required to be as small as possible. The changes in the target and predicted values listed are shown in
Figure 13.
The coefficient () is used to measure the dependent variable and independent variables in statistical differences and explains the relationship between the target and predicted values. Typically, the value is between 0 and 1, and the value is closer to 1, which indicates excellent predictive power.
The determination coefficient is as follows:
where
is the sum of the residual square target and predicted values.
is the sum of the target and average error.
is the predicted value,
is the target value, and
T is the target of the average.
The predication performance of linear regression was compared with that of BPNN. We substituted an input parameter into the equation to obtain the linear regression equation of surface roughness, which is expressed as follows:
where
Y is the surface roughness,
is cutting depth,
is spindle speed,
is feed rate,
is milling pitch
Table 13 indicates that the RMSE of the BPNN was less than that of linear regression and that the
value reached 0.9995, which is higher than that (0.7794) of linear regression, indicating that the BPNN is more accurate than linear regression.


