Author Contributions
Conceptualization, M.K. and B.W.; methodology, M.K. and B.W.; software, D.R. and J.G.; validation, M.K., B.W. and Ł.W.; formal analysis, M.K., B.W. and Ł.W.; investigation, M.K., B.W., Ł.W., D.R. and J.G.; data curation, M.K. and B.W.; writing—original draft preparation, M.K.; writing—review and editing, M.K. and B.W.; visualization, M.K. and B.W.; supervision, M.K. and B.W.; project administration, B.W.; funding acquisition, M.K., B.W. and J.G. All authors have read and agreed to the published version of the manuscript.
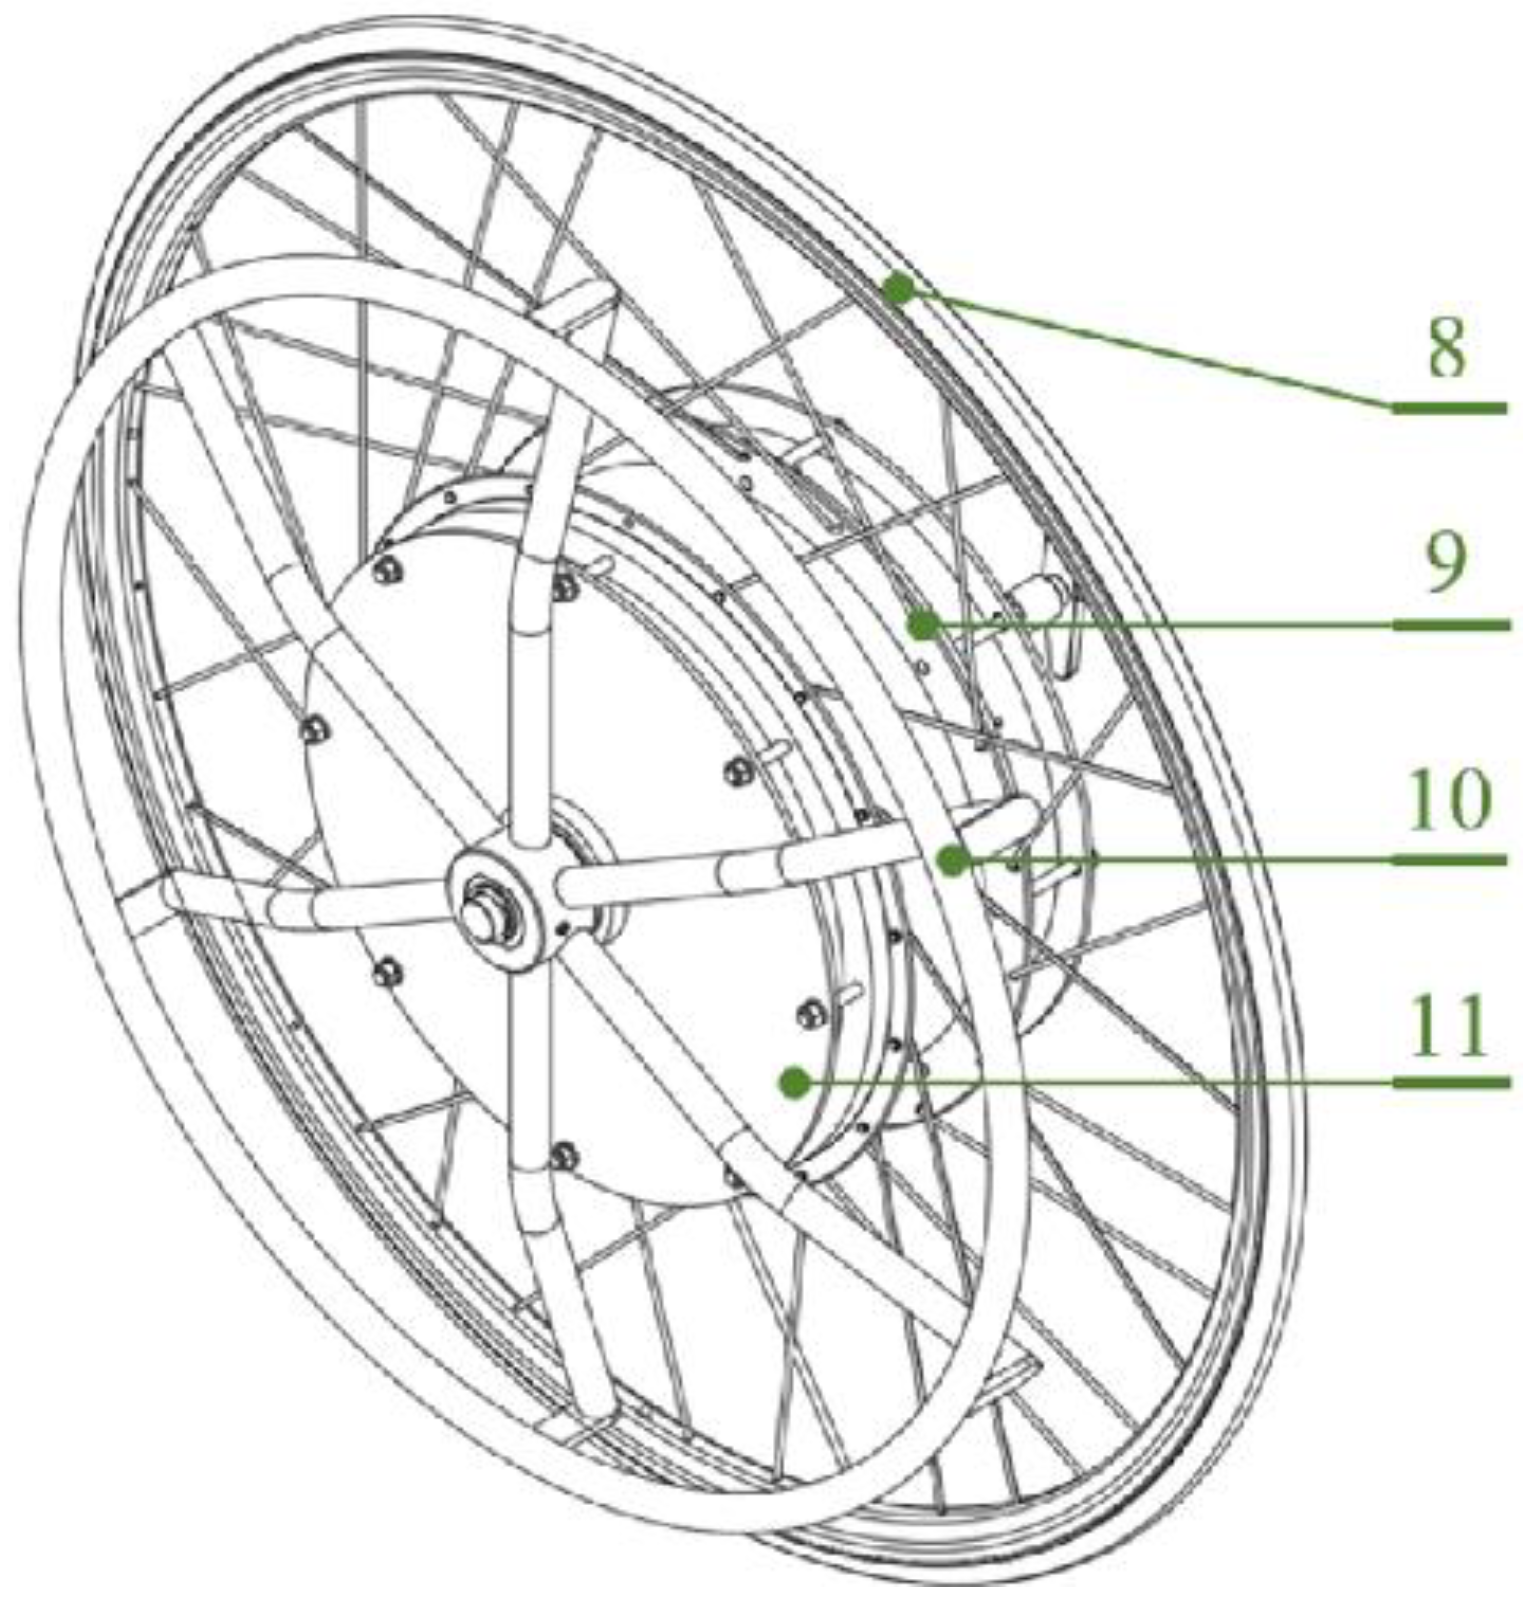
Figure 1.
View of the assembled system: 8—tire, 9—system of spokes mounted to the hub flange, 10—handrims and 11—internal gear hub.
Figure 1.
View of the assembled system: 8—tire, 9—system of spokes mounted to the hub flange, 10—handrims and 11—internal gear hub.
Figure 2.
View of the diagram of the constructed planetary gear: (a) view of the internal gear hub and methods of coupling the planetary gear; 1—splined disc, 2—splined ring, (b) view of the bearing system of the carrier inside the planetary gear; 3—carrier, 4—sun gear, 5—radial bearing, 6—axial bearing and 7—ring gear (internal teeth).
Figure 3.
Diagrams of planetary gears for different ratios: (a) first gear, (b) second gear, (c) third gear; 12—internal teeth, 13—planetary gear, 14—sun gear, 15—carrier, nin—input rotational speed and nout—output rotational speed.
Figure 3.
Diagrams of planetary gears for different ratios: (a) first gear, (b) second gear, (c) third gear; 12—internal teeth, 13—planetary gear, 14—sun gear, 15—carrier, nin—input rotational speed and nout—output rotational speed.
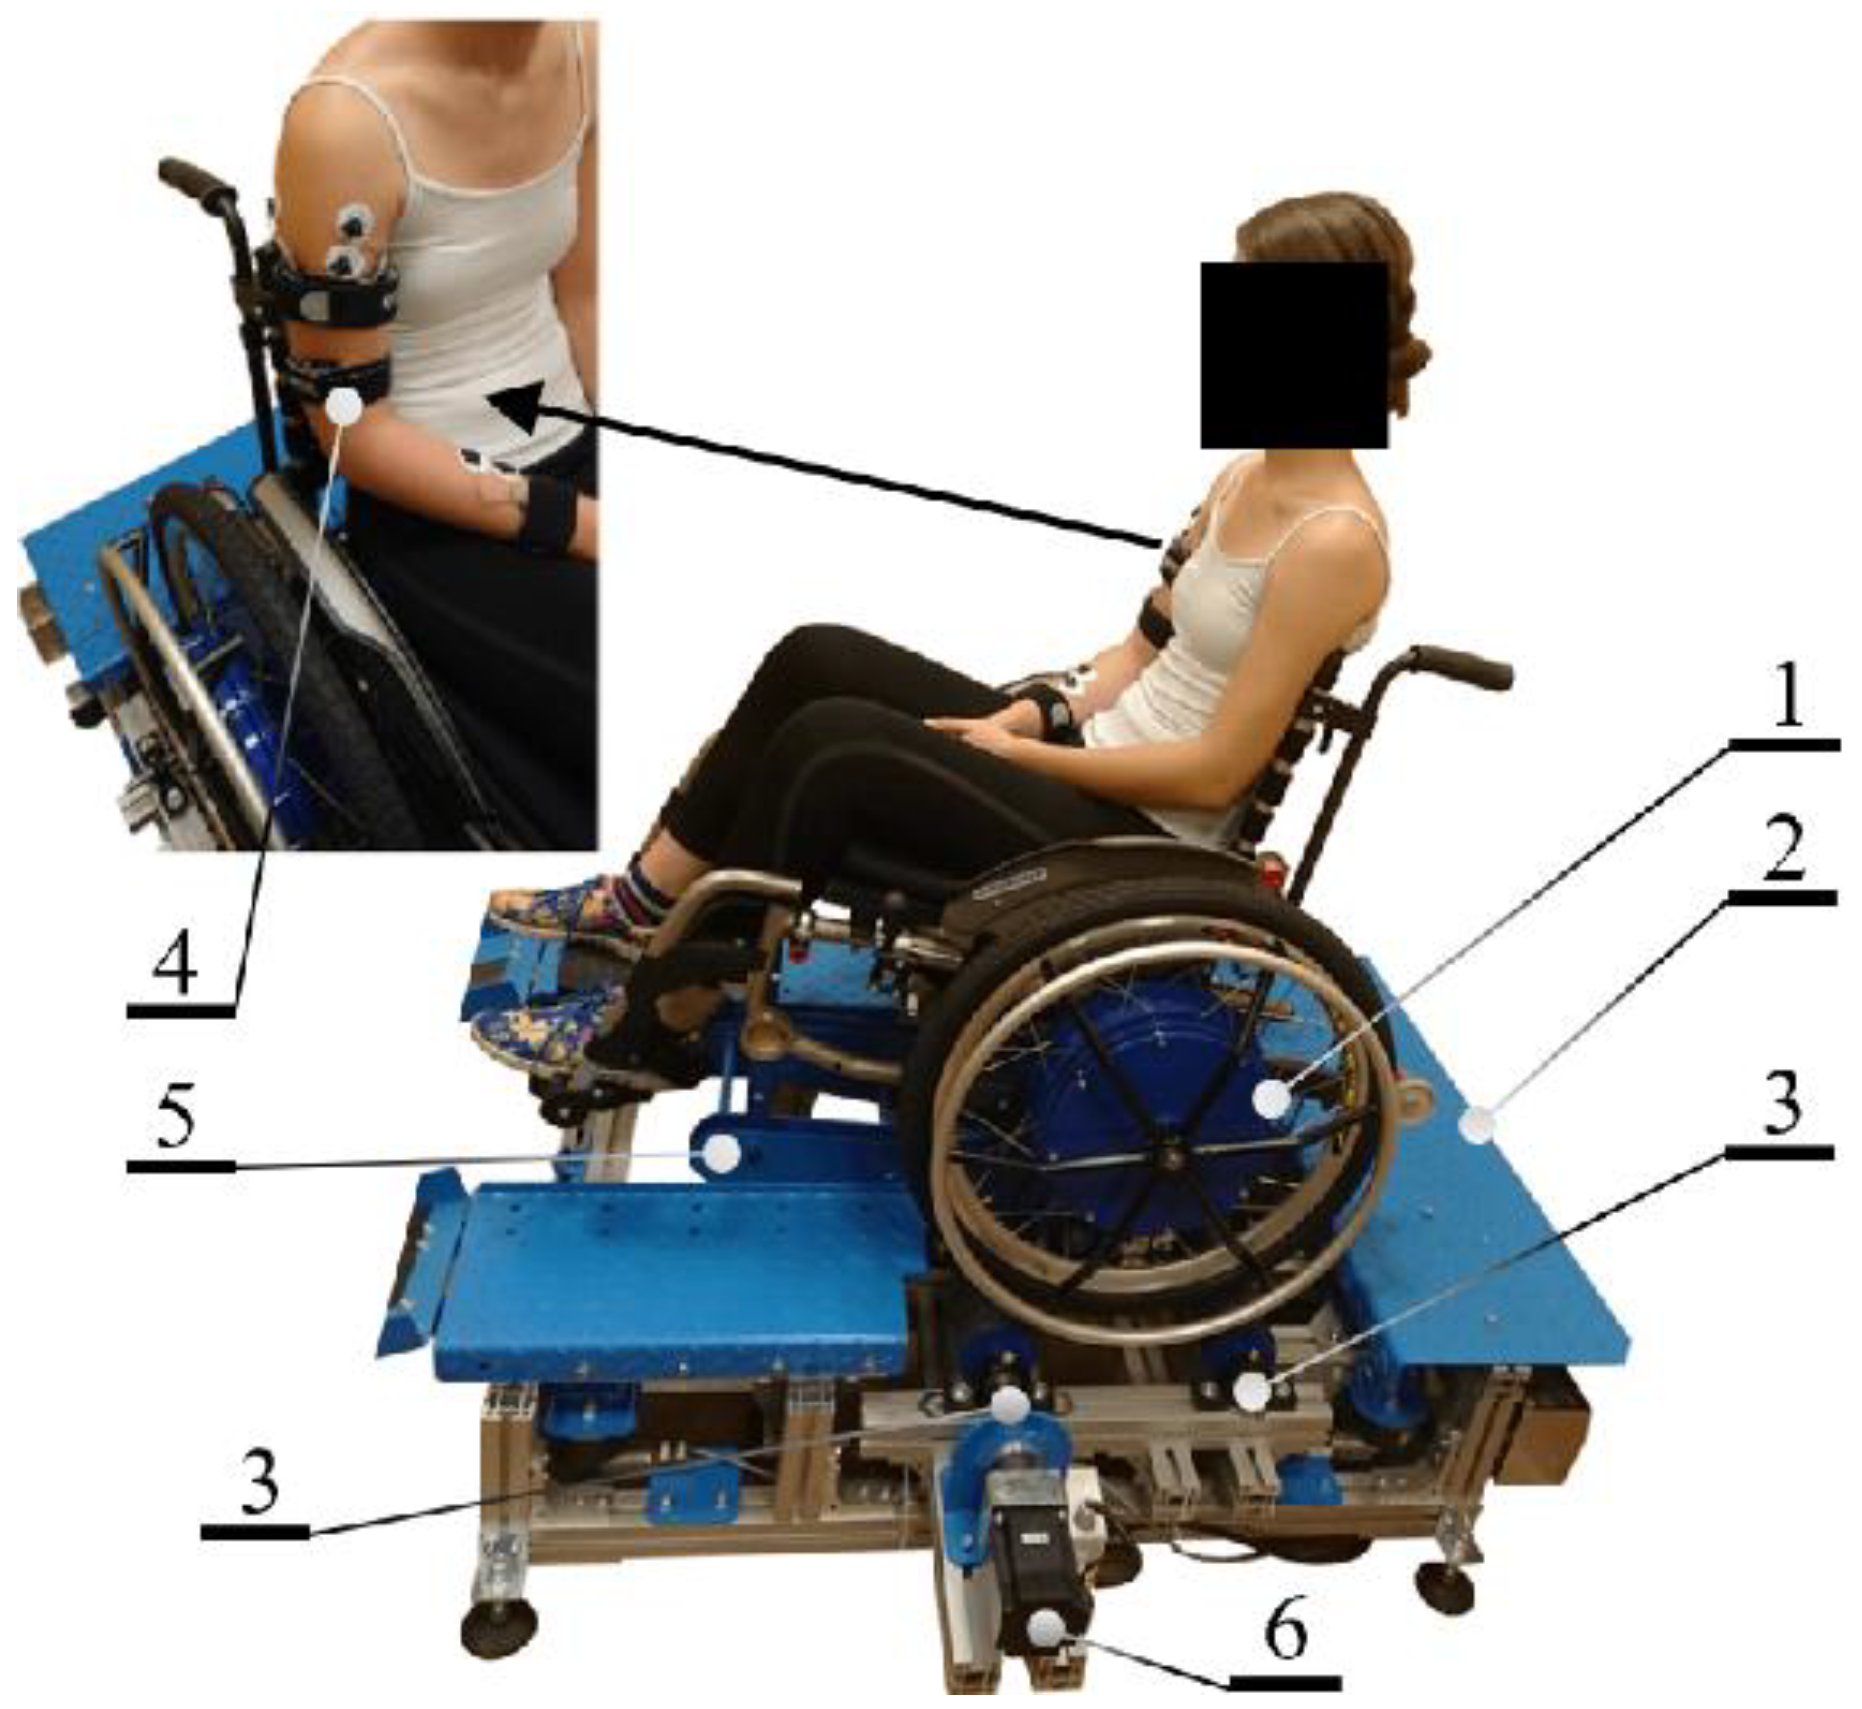
Figure 4.
View of the dynamometer, the examined wheelchair with the participant and the arrangement of electrodes; 1—planetary gear integrated in the hub of a larger wheel, 2—test stand (wheelchair dynamometer), 3—support rollers for the propelled wheel, 4—measuring electrodes, 5—mounting arm (enables changing the angle of inclination of the wheelchair) and 6—servo drive.
Figure 5.
Diagram of carried out experiments; A1—patient preparation, A2—normalization, A3—placing on the stand, B1—test start, B2—break, B3—test variant change and B4—test end.
Figure 5.
Diagram of carried out experiments; A1—patient preparation, A2—normalization, A3—placing on the stand, B1—test start, B2—break, B3—test variant change and B4—test end.
Figure 6.
Markers used for motion capture (a) placement on the test participant and (b) dimensions.
Figure 6.
Markers used for motion capture (a) placement on the test participant and (b) dimensions.
Figure 7.
Geometric interpretation of the kinematic parameters of the upper limb segments during measurements with the use of motion capture.
Figure 7.
Geometric interpretation of the kinematic parameters of the upper limb segments during measurements with the use of motion capture.
Figure 8.
Average values of the area under the diagram (SA) for measurement tests s2, k1-3 and p1-3 for the muscle: extensor carpi radialis longus (D); error bars are ± standard deviation.
Figure 8.
Average values of the area under the diagram (SA) for measurement tests s2, k1-3 and p1-3 for the muscle: extensor carpi radialis longus (D); error bars are ± standard deviation.
Figure 9.
Average values of the area under the diagram (SA) for measurement tests s2, k1 and p1-3 for the posterior part of the deltoid muscle (B); error bars are ± standard deviation, rectangles are ± standard error.
Figure 9.
Average values of the area under the diagram (SA) for measurement tests s2, k1 and p1-3 for the posterior part of the deltoid muscle (B); error bars are ± standard deviation, rectangles are ± standard error.
Figure 10.
The average EMG signal amplitude values () for all propulsion cycles for measurement tests s2; error bars are ± standard deviation; designations: p1–3—the gear ratio, k1–3—the inclination angle, A–D—the type of muscle (as specified in the Test Conditions and Statistical Analysis paragraph).
Figure 11.
The displacement of individual markers for a constant gear ratio and a variable inclination angle of the wheelchair.
Figure 11.
The displacement of individual markers for a constant gear ratio and a variable inclination angle of the wheelchair.
Figure 12.
The displacement of individual markers for a constant inclination angle of the wheelchair and a variable gear ratio.
Figure 12.
The displacement of individual markers for a constant inclination angle of the wheelchair and a variable gear ratio.
Figure 13.
Designated values: (a) total angle of rotation of wrist marker (ID1) and (b) total displacement of wrist marker (ID1).
Figure 13.
Designated values: (a) total angle of rotation of wrist marker (ID1) and (b) total displacement of wrist marker (ID1).
Figure 14.
Designated values (a) mean value of and and (b) mean value of surface area .
Figure 14.
Designated values (a) mean value of and and (b) mean value of surface area .
Table 1.
Variants, markings and input values used in experiments.
Table 1.
Variants, markings and input values used in experiments.
| Gear Ratio | Series Number | Wheelchair Inclination Angle | Muscle |
|---|
| p1 = 1.96 | s1 | k1 = 0° | Deltoid muscle anterior (A) and posterior (B) |
| p2 = 1 | s2 | k2 = 1.5° | Triceps brachii (C) |
| p3 = 0.51 | s3 | k3 = 5.4° | Extensor carpi radialis longus (D) |
Table 2.
The average values and the statistical data of the area under the diagram (SA) for the individual propulsion cycles; —arithmetic mean, —standard deviation of the arithmetic mean, —standard error, —test probability for the Anderson–Darling test; muscle markings: Deltoid muscle anterior (A) and posterior (B), Triceps brachii (C), Extensor carpi radialis longus (D); markings of the angles of the erection of the wheelchair: k1 = 0°, k2 = 1.5° and k1 = 5.4°; markings of experiment series: s1, s2 and s3; markings of the propulsion system gear ratios: p1 = 1.96, p2 = 1 and p3 = 0.51.
| | | s1 A | s1 B | s1 C | s1 D |
|---|
| | | p1 | p2 | p3 | p1 | p2 | p3 | p1 | p2 | p3 | p1 | p2 | p3 |
|---|
| k1 | [s·%] | 23.33 | 21.51 | 19.03 | 32.50 | 30.34 | 29.94 | 21.28 | 15.46 | 14.59 | 6.08 | 4.55 | 3.17 |
| [s·%] | 2.74 | 2.00 | 0.99 | 1.60 | 2.09 | 1.99 | 1.44 | 1.17 | 0.99 | 0.33 | 0.47 | 0.14 |
| [s·%] | 0.61 | 0.45 | 0.22 | 0.36 | 0.47 | 0.44 | 0.32 | 0.26 | 0.22 | 0.07 | 0.11 | 0.03 |
| 0.09 | 0.18 | 0.26 | 0.64 | 0.17 | 0.18 | 0.17 | 0.65 | 0.10 | 0.09 | 0.46 | 0.35 |
| k2 | [s·%] | 23.57 | 23.44 | 22.37 | 36.88 | 30.85 | 30.39 | 24.11 | 19.43 | 15.20 | 10.64 | 5.98 | 3.62 |
| [s·%] | 3.10 | 1.84 | 1.39 | 3.41 | 2.73 | 1.87 | 1.95 | 1.44 | 0.88 | 0.85 | 0.73 | 0.17 |
| [s·%] | 0.69 | 0.41 | 0.31 | 0.76 | 0.61 | 0.42 | 0.44 | 0.32 | 0.20 | 0.19 | 0.16 | 0.04 |
| 0.50 | 0.06 | 0.09 | 0.59 | 0.18 | 0.19 | 0.53 | 0.12 | 0.38 | 0.53 | 0.52 | 0.16 |
| k3 | [s·%] | 31.20 | 27.95 | 24.57 | 48.94 | 39.61 | 35.94 | 36.88 | 27.96 | 21.61 | 20.50 | 6.45 | 5.46 |
| [s·%] | 2.37 | 1.48 | 1.67 | 5.32 | 3.46 | 3.18 | 2.96 | 3.06 | 1.31 | 1.53 | 0.48 | 0.54 |
| [s·%] | 0.53 | 0.37 | 0.33 | 1.19 | 0.77 | 0.71 | 0.66 | 0.68 | 0.29 | 0.34 | 0.11 | 0.12 |
| 0.09 | 0.29 | 0.09 | 0.08 | 0.09 | 0.26 | 0.13 | 0.11 | 0.40 | 0.14 | 0.25 | 0.14 |
| | | s2 A | s2 B | s2 C | s2 D |
| | | p1 | p2 | p3 | p1 | p2 | p3 | p1 | p2 | p3 | p1 | p2 | p3 |
| k1 | [s·%] | 27.44 | 19.14 | 19.03 | 30.51 | 27.56 | 25.60 | 20.49 | 15.61 | 13.23 | 9.14 | 3.55 | 2.96 |
| [s·%] | 1.22 | 1.18 | 0.99 | 2.28 | 0.99 | 1.51 | 1.03 | 0.76 | 0.70 | 0.97 | 0.29 | 0.19 |
| [s·%] | 0.27 | 0.26 | 0.22 | 0.51 | 0.22 | 0.34 | 0.39 | 0.24 | 0.18 | 0.22 | 0.06 | 0.04 |
| 0.45 | 0.17 | 0.26 | 0.92 | 0.37 | 0.77 | 0.60 | 0.54 | 0.23 | 0.57 | 0.69 | 0.77 |
| k2 | [s·%] | 28.40 | 21.12 | 20.51 | 47.09 | 27.73 | 26.49 | 37.38 | 18.59 | 13.93 | 9.27 | 4.04 | 3.62 |
| [s·%] | 2.26 | 1.33 | 0.97 | 4.22 | 1.79 | 1.34 | 2.55 | 1.55 | 0.90 | 0.79 | 0.30 | 0.25 |
| [s·%] | 0.51 | 0.30 | 0.22 | 0.94 | 0.40 | 0.30 | 0.91 | 0.18 | 0.18 | 0.18 | 0.07 | 0.06 |
| 0.32 | 0.47 | 0.75 | 0.33 | 0.77 | 0.28 | 0.11 | 0.10 | 0.09 | 0.16 | 0.19 | 0.10 |
| k3 | [s·%] | 30.90 | 25.77 | 24.70 | 53.40 | 38.99 | 33.85 | 50.58 | 30.40 | 27.87 | 9.69 | 6.50 | 5.28 |
| [s·%] | 2.47 | 1.31 | 1.92 | 4.40 | 2.89 | 2.20 | 7.94 | 3.31 | 1.56 | 0.74 | 0.40 | 0.49 |
| [s·%] | 0.55 | 0.29 | 0.43 | 0.98 | 0.65 | 0.49 | 0.94 | 0.68 | 0.37 | 0.16 | 0.09 | 0.11 |
| 0.47 | 0.82 | 0.49 | 0.50 | 0.70 | 0.13 | 0.12 | 0.21 | 0.55 | 0.60 | 0.22 | 0.05 |
| | | s3 A | s3 B | s3 C | s3 D |
| | | p1 | p2 | p3 | p1 | p2 | p3 | p1 | p2 | p3 | p1 | p2 | p3 |
| k1 | [s·%] | 20.50 | 18.63 | 18.41 | 28.66 | 26.95 | 25.76 | 20.49 | 15.61 | 13.23 | 5.20 | 4.15 | 3.16 |
| [s·%] | 1.03 | 0.84 | 1.16 | 1.89 | 2.09 | 2.44 | 1.03 | 0.76 | 0.70 | 0.43 | 0.19 | 0.22 |
| [s·%] | 0.23 | 0.19 | 0.26 | 0.42 | 0.47 | 0.55 | 0.23 | 0.17 | 0.16 | 0.10 | 0.04 | 0.05 |
| 0.87 | 0.83 | 0.91 | 0.18 | 0.43 | 0.36 | 0.60 | 0.54 | 0.23 | 0.30 | 0.69 | 0.65 |
| k2 | [s·%] | 25.12 | 24.69 | 18.78 | 47.77 | 44.19 | 27.55 | 37.38 | 18.59 | 13.93 | 8.77 | 5.37 | 3.71 |
| [s·%] | 1.40 | 1.49 | 1.45 | 3.49 | 3.40 | 1.53 | 2.55 | 1.55 | 0.90 | 1.23 | 0.75 | 0.27 |
| [s·%] | 0.31 | 0.33 | 0.32 | 0.76 | 0.78 | 0.34 | 0.57 | 0.35 | 0.20 | 0.28 | 0.17 | 0.06 |
| 0.87 | 0.51 | 0.27 | 0.06 | 0.72 | 0.12 | 0.11 | 0.10 | 0.09 | 0.07 | 0.07 | 0.11 |
| k3 | [s·%] | 34.89 | 31.92 | 24.89 | 54.19 | 53.90 | 39.79 | 50.58 | 30.40 | 27.87 | 10.05 | 8.31 | 6.79 |
| [s·%] | 2.50 | 1.98 | 1.10 | 4.82 | 5.03 | 4.79 | 7.94 | 3.31 | 1.56 | 0.70 | 0.60 | 0.63 |
| [s·%] | 0.56 | 0.25 | 0.44 | 1.08 | 1.12 | 1.07 | 1.77 | 0.74 | 0.35 | 0.16 | 0.13 | 0.14 |
| 0.67 | 0.91 | 0.89 | 0.28 | 0.12 | 0.31 | 0.12 | 0.21 | 0.55 | 0.29 | 0.13 | 0.09 |
Table 3.
The statistical data of the analysis of variance (ANOVA); —F test value, —test probability of ANOVA analysis, Deltoid muscle anterior (A) and posterior (B), Triceps brachii (C), Extensor carpi radialis longus (D); markings of the angles of erection of the wheelchair: k1 = 0°, k2 = 1.5° and k1 = 5.4°; markings of experiment series: s1, s2 and s3; markings of the propulsion system gear ratios: p1 = 1.96, p2 = 1 and p3 = 0.51.
| | | | | | | | | |
|---|
| | s1 A | s1 B | s1 C | s1 D |
|---|
| p1-3 | 166.07 | 8.46 × 10−41 | 206.21 | 2.69 × 10−46 | 665.36 | 2.10 × 10−81 | 1192.56 | 3.74 × 10−101 |
| k1-3 | 39.62 | 7.29 × 10⁻¹⁵ | 96.99 | 7.02 × 10⁻²⁹ | 472.89 | 2.09 × 10−70 | 2350.68 | 4.16 × 10−125 |
| Interaction | 18.34 | 1.48 × 10⁻¹² | 15.84 | 4.74 × 10⁻¹¹ | 31.42 | 1.29 × 10⁻¹⁹ | 540.83 | 7.04 × 10−96 |
| | s2 A | s2 B | s2 C | s2 D |
| p1-3 | 170.93 | 1.64 × 10−41 | 429.84 | 1.99 × 10−67 | 667.01 | 1.74 × 10−81 | 201.49 | 1.09 × 10−45 |
| k1-3 | 404.84 | 1.4 × 10−65 | 539.42 | 1.38 × 10−74 | 830.89 | 8.42 × 10−89 | 1673.81 | 5.09 × 10−113 |
| Interaction | 5.42 | 0.000393 | 71.40 | 1.85 × 10⁻³⁵ | 111.28 | 1.59 × 10−46 | 29.07 | 1.93 × 10⁻¹⁸ |
| | s3 A | s3 B | s3 C | s3 D |
| p1-3 | 877.56 | 1.2 × 10−90 | 599.86 | 5.16 × 10−78 | 621.09 | 3.79 × 10−79 | 654.92 | 6.96 × 10−81 |
| k1-3 | 135.90 | 4.68 × 10−36 | 216.88 | 1.25 × 10−47 | 551.69 | 2.61 × 10−75 | 443.29 | 2.20 × 10−68 |
| Interaction | 106.42 | 2.44 × 10−45 | 42.02 | 1.65 × 10⁻²⁴ | 53.29 | 4.26 × 10⁻²⁹ | 31.77 | 8.65 × 10⁻²⁰ |
Table 4.
The average values and the statistical data on the average amplitude of the EMG signal values () for the individual propulsion cycles; —the arithmetic mean, —the standard deviation of the arithmetic mean; the muscle markings: Deltoid muscle anterior (A) and posterior (B), Triceps brachii (C), Extensor carpi radialis longus (D); markings of experiment series: s1, s2 and s3; markings of the propulsion system gear ratios: p1 = 1.96, p2 = 1 and p3 = 0.51.
| | | s1 A | s1 B | s1 C | s1 D |
|---|
| | | p1 | p2 | p3 | p1 | p2 | p3 | p1 | p2 | p3 | p1 | p2 | p3 |
|---|
| k1 | [%] | 25.39 | 24.00 | 23.48 | 39.12 | 37.31 | 36.73 | 31.23 | 24.50 | 23.27 | 11.56 | 6.27 | 4.42 |
| [%] | 2.50 | 2.28 | 2.02 | 3.12 | 4.01 | 2.69 | 1.33 | 3.02 | 2.61 | 1.20 | 0.88 | 0.23 |
| k2 | [%] | 30.03 | 26.41 | 26.48 | 42.60 | 41.79 | 39.19 | 37.67 | 27.87 | 23.41 | 19.50 | 10.24 | 4.54 |
| [%] | 2.81 | 2.01 | 1.70 | 4.98 | 2.52 | 4.39 | 5.31 | 2.89 | 3.11 | 2.48 | 1.58 | 0.54 |
| k3 | [%] | 45.34 | 33.31 | 29.15 | 82.80 | 47.13 | 46.68 | 68.56 | 52.00 | 35.79 | 31.26 | 10.92 | 8.19 |
| [%] | 3.23 | 2.05 | 2.73 | 14.97 | 5.32 | 5.42 | 8.01 | 8.53 | 3.15 | 4.17 | 1.20 | 1.06 |
| | | s2 A | s2 B | s2 C | s2 D |
| | | p1 | p2 | p3 | p1 | p2 | p3 | p1 | p2 | p3 | p1 | p2 | p3 |
| k1 | [%] | 45.06 | 22.39 | 21.59 | 41.07 | 39.85 | 35.12 | 29.58 | 23.18 | 21.21 | 16.48 | 6.27 | 4.93 |
| [%] | 5.96 | 1.68 | 1.68 | 3.68 | 2.73 | 2.39 | 2.00 | 2.83 | 2.27 | 1.84 | 0.67 | 0.61 |
| k2 | [%] | 47.47 | 25.40 | 24.98 | 71.93 | 41.01 | 38.39 | 66.46 | 24.93 | 24.00 | 17.75 | 6.90 | 5.21 |
| [%] | 3.54 | 1.77 | 1.58 | 9.72 | 3.52 | 1.77 | 8.72 | 2.51 | 1.81 | 2.61 | 0.51 | 0.48 |
| k3 | [%] | 57.45 | 33.05 | 31.73 | 104.24 | 56.48 | 50.49 | 106.33 | 57.24 | 41.03 | 19.40 | 11.57 | 9.09 |
| [%] | 5.29 | 3.30 | 3.25 | 9.45 | 7.23 | 5.30 | 16.12 | 6.73 | 4.48 | 1.95 | 1.23 | 1.64 |
| | | s3 A | s3 B | s3 C | s3 D |
| | | p1 | p2 | p3 | p1 | p2 | p3 | p1 | p2 | p3 | p1 | p2 | p3 |
| k1 | [%] | 29.77 | 26.13 | 24.13 | 44.96 | 43.42 | 42.16 | 37.77 | 29.80 | 25.23 | 10.87 | 7.98 | 5.87 |
| [%] | 2.59 | 2.56 | 2.08 | 3.97 | 4.23 | 3.32 | 2.39 | 2.93 | 2.76 | 1.62 | 0.83 | 0.86 |
| k2 | [%] | 46.94 | 37.62 | 25.02 | 84.05 | 59.66 | 45.80 | 80.83 | 40.38 | 28.50 | 15.92 | 12.79 | 5.99 |
| [%] | 5.09 | 3.21 | 2.42 | 10.83 | 5.97 | 3.85 | 10.10 | 5.25 | 2.78 | 2.64 | 3.18 | 0.83 |
| k3 | [%] | 63.40 | 39.89 | 51.92 | 119.42 | 76.89 | 62.19 | 121.10 | 66.31 | 61.20 | 20.61 | 15.13 | 15.03 |
| [%] | 5.52 | 3.88 | 3.68 | 13.28 | 8.12 | 6.03 | 15.66 | 7.93 | 3.71 | 2.15 | 1.44 | 1.65 |
Table 5.
Mean values of the displacement and the angle covered by individual markers ; —standard deviation of the arithmetic mean of the marker’s displacement and —standard deviation of the arithmetic mean of the angle covered by the marker.
Table 5.
Mean values of the displacement and the angle covered by individual markers ; —standard deviation of the arithmetic mean of the marker’s displacement and —standard deviation of the arithmetic mean of the angle covered by the marker.
| | | | ID1 | ID3 | ID5 |
|---|
| | | | | | | | | | | | | | | |
|---|
| k1 | p1 | push | 728.0 | 67.6 | 60.1 | 3.7 | 611.3 | 41.6 | 28.0 | 1.3 | 375.2 | 20.2 | 9.7 | 0.8 |
| return | 658.9 | 25.6 | 68.4 | 0.6 | 533.2 | 40.8 | 23.8 | 1.8 | 261.4 | 11.7 | 6.1 | 0.2 |
| p2 | push | 773.7 | 19.1 | 62.9 | 3.6 | 614.1 | 16.2 | 29.5 | 1.3 | 358.4 | 9.2 | 10.1 | 0.8 |
| return | 707.6 | 59.7 | 69.6 | 3.6 | 564.4 | 73.0 | 26.4 | 1.5 | 327.3 | 64.9 | 9.0 | 0.5 |
| p3 | push | 630.8 | 8.2 | 48.0 | 2.5 | 503.0 | 15.2 | 24.7 | 1.1 | 408.0 | 21.6 | 12.9 | 1.5 |
| return | 565.9 | 33.9 | 55.5 | 5.9 | 516.4 | 10.5 | 24.9 | 3.4 | 335.9 | 9.0 | 13.2 | 1.4 |
| k2 | p1 | push | 815.9 | 94.5 | 73.3 | 4.0 | 689.5 | 18.1 | 37.9 | 0.8 | 380.9 | 9.6 | 12.0 | 1.1 |
| return | 787.2 | 24.3 | 70.3 | 2.1 | 646.7 | 18.9 | 27.9 | 1.8 | 340.3 | 35.3 | 14.4 | 1.5 |
| p2 | push | 777.9 | 47.7 | 71.2 | 7.2 | 633.8 | 21.5 | 33.8 | 1.1 | 392.8 | 6.3 | 15.6 | 1.0 |
| return | 743.7 | 25.1 | 74.9 | 5.0 | 586.8 | 49.4 | 33.2 | 1.8 | 316.1 | 9.1 | 12.6 | 2.5 |
| p3 | push | 625.2 | 23.4 | 50.2 | 14.9 | 590.1 | 19.5 | 27.7 | 1.9 | 453.3 | 31.7 | 14.8 | 4.8 |
| return | 591.4 | 46.5 | 58.0 | 3.0 | 448.0 | 35.0 | 29.8 | 1.8 | 342.6 | 21.4 | 16.6 | 1.9 |
| k3 | p1 | push | 883.3 | 24.1 | 83.3 | 2.0 | 697.2 | 49.0 | 40.3 | 1.4 | 446.8 | 48.3 | 20.0 | 0.4 |
| return | 903.2 | 24.8 | 82.0 | 3.6 | 756.6 | 18.5 | 35.9 | 2.9 | 369.0 | 20.2 | 16.1 | 1.6 |
| p2 | push | 816.3 | 8.6 | 78.4 | 1.8 | 667.1 | 43.5 | 36.6 | 1.4 | 401.5 | 10.8 | 17.1 | 0.9 |
| return | 776.2 | 30.6 | 80.9 | 3.1 | 614.4 | 27.9 | 33.6 | 1.8 | 336.7 | 22.7 | 22.5 | 2.0 |
| p3 | push | 762.1 | 28.1 | 66.2 | 8.5 | 650.9 | 28.5 | 36.1 | 3.0 | 479.8 | 4.2 | 19.2 | 0.8 |
| return | 726.8 | 69.8 | 69.6 | 4.4 | 618.9 | 68.7 | 32.6 | 4.8 | 358.8 | 70.3 | 16.3 | 0.5 |
Table 6.
Mean values of surface areas and corresponding lengths and widths of the designated shapes for all of the markers; —standard deviation of length, —standard deviation of the height and —standard deviation of surface area.
Table 6.
Mean values of surface areas and corresponding lengths and widths of the designated shapes for all of the markers; —standard deviation of length, —standard deviation of the height and —standard deviation of surface area.
| | | Wrist ID1 |
|---|
| | | | | | | | |
|---|
| k1 | p1 | 585.26 | 213.09 | 0.0208 | 20.75 | 12.66 | 0.0007 |
| p2 | 623.55 | 199.97 | 0.0266 | 22.21 | 17.96 | 0.0007 |
| p3 | 536.18 | 194.33 | 0.0197 | 83.63 | 19.62 | 0.0051 |
| k2 | p1 | 703.92 | 195.65 | 0.0324 | 21.11 | 1.68 | 0.0023 |
| p2 | 659.20 | 191.64 | 0.0309 | 22.72 | 19.66 | 0.0054 |
| p3 | 517.41 | 120.85 | 0.0204 | 19.63 | 6.44 | 0.0027 |
| k3 | p1 | 696.84 | 162.23 | 0.0314 | 8.50 | 12.30 | 0.0105 |
| p2 | 632.86 | 141.42 | 0.0240 | 34.15 | 14.40 | 0.0027 |
| p3 | 640.89 | 149.32 | 0.0225 | 31.33 | 10.92 | 0.0025 |
| | | Elbow ID3 |
| k1 | p1 | 528.47 | 253.25 | 0.0453 | 34.31 | 14.23 | 0.0052 |
| p2 | 514.40 | 240.35 | 0.0548 | 18.83 | 20.26 | 0.0020 |
| p3 | 473.46 | 222.66 | 0.0329 | 35.18 | 10.87 | 0.0083 |
| k2 | p1 | 503.50 | 215.90 | 0.0486 | 17.82 | 2.24 | 0.0021 |
| p2 | 488.91 | 208.72 | 0.0410 | 28.93 | 17.87 | 0.0049 |
| p3 | 408.18 | 152.26 | 0.0378 | 63.07 | 8.39 | 0.0036 |
| k3 | p1 | 530.65 | 180.27 | 0.0504 | 9.48 | 6.90 | 0.0066 |
| p2 | 488.51 | 171.92 | 0.0444 | 38.86 | 6.59 | 0.0081 |
| p3 | 520.38 | 163.77 | 0.0457 | 31.95 | 6.52 | 0.0040 |
| | | Shoulder ID5 |
| k1 | p1 | 214.30 | 137.46 | 0.0139 | 26.78 | 14.56 | 0.0023 |
| p2 | 169.96 | 131.14 | 0.0117 | 20.64 | 11.22 | 0.0010 |
| p3 | 263.54 | 142.30 | 0.0148 | 22.77 | 5.56 | 0.0007 |
| k2 | p1 | 248.72 | 136.57 | 0.0175 | 4.55 | 2.53 | 0.0001 |
| p2 | 236.59 | 139.18 | 0.0120 | 43.65 | 13.84 | 0.0045 |
| p3 | 268.57 | 100.06 | 0.0170 | 16.76 | 12.11 | 0.0022 |
| k3 | p1 | 267.42 | 121.34 | 0.0177 | 47.39 | 16.21 | 0.0045 |
| p2 | 216.70 | 102.97 | 0.0151 | 26.04 | 12.55 | 0.0024 |
| p3 | 237.46 | 105.86 | 0.0174 | 9.12 | 4.94 | 0.0011 |


