Article

Influence of Self-Compaction on the Airflow Resistance of Aerated Wheat Bulks (Triticum aestivum L., cv. ‘Pionier’)

Tropics and Subtropics Group (440e), Institute of Agricultural Engineering, University of Hohenheim, 70599 Stuttgart, Germany
*
Author to whom correspondence should be addressed.
Appl. Sci. 2022, 12(17), 8909; https://doi.org/10.3390/app12178909
Submission received: 9 August 2022 / Revised: 26 August 2022 / Accepted: 2 September 2022 / Published: 5 September 2022
(This article belongs to the Special Issue Engineering of Smart Agriculture)

Abstract

:

Featured Application

Grain storage, design and analysis of cooling, aeration and low-temperature drying of in-store grain bulks, practical application.

Abstract

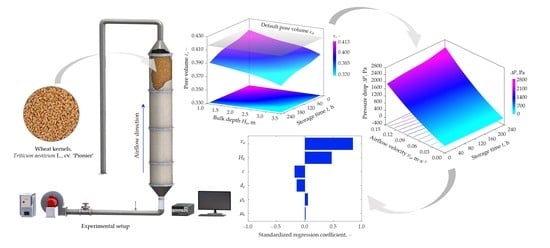
Aeration is a key post-harvest grain processing operation that forces air through the pore volume of the grain bulk to establish favorable conditions to maintain grain quality and improve its storability. However, during storage, grain bulk experiences self-compaction due to its dead weight, which alters the bulk properties and impedes the uniform flow of air during aeration. Thus, this study focused on investigating the effect of self-compaction on the pressure drop ΔP of wheat bulk (Triticum aestivum L., cv. ‘Pionier’, X = 0.123 kg·kg−1 d.b.) accommodated in a laboratory-scale bin (Vb = 0.62 m3) at a coherent set of airflow velocities va. Pressure drop ΔP was measured at bulk depths Hb of 1.0, 2.0, 3.0 and 3.4 m and storage times t of 1, 65, 164 and 236 h. For the semi-empirical characterization of the relationship between ΔP and va, the model of Matthies and Petersen was used, which was proficient in describing the experimental data with decent accuracy (R2 = 0.990, RMSE = 68.67 Pa, MAPE = 12.50%). A tailored product factor k was employed for the specific grain bulk conditions. Results revealed a reduction of in-situ pore volume ε from 0.413 to 0.391 at bulk depths Hb of 1.0 to 3.4 m after 1 h storage time t and from 0.391 to 0.370 after 236 h storage time t, respectively. A disproportional increase of the pressure drop ΔP with bulk depth Hb and storage time t was observed, which was ascribed to the irreversible spatio-temporal behavior of self-compaction. The variation of pore volume ε was modeled and facilitated the development of a generalized model for predicting the relationship between ΔP and va. The relative importance of modeling parameters was evaluated by a sensitivity analysis. In conclusion, self-compaction has proven to have a significant effect on airflow resistance, therefore it should be considered in the analysis and modeling of cooling, aeration and low-temperature drying of in-store grain bulks.

Graphical Abstract

1. Introduction

Cereal grains are among the most important and indispensable food sources for humans, with an annual global production of 3.0 billion tons in 2020 [1]. They account for 60 to 80% of the dietary calorie intake, which makes up a significant portion of human energy and nutrient requirements [2]. Storage technologies play a critical role in maintaining the nutritional quality and prolonging the shelf-life of cereal grains during the off-season. Grain temperature and moisture content are the two most important parameters impacting storage, with high values affecting the intrinsic quality of grains and promoting decay [3,4,5]. The interaction between these parameters during storage has resulted in losses of about 13.4% in the global production in 2018 [6]. Therefore, aeration is utilized to force air through the pore volume of stored grain to modify the bulk microclimate and create favorable conditions for quality preservation and improvement of storability. Aeration reduces the bulk temperature to a safe storage level to prevent insect and mite infestation, spontaneous heating and off-odors [7]. In addition, it inhibits the development of microflora by reducing the excess moisture and intergranular air humidity in isolated grain dump nests. Intergranular air humidity refers to the relative amount of water available in the air at a particular temperature described by sorption isotherms [8]. At sufficiently high levels (above 60%), the development of bacteria, fungi and yeasts is promoted, leading to the formation of toxins that are detrimental to humans [9,10]. Hence, ensuring adequate aeration throughout the grain bulk can be an important preservative measure to effectively control harmful substances.
During aeration, as the air flows through the pore volume of the grain bulk, it loses its kinetic energy due to intergranular friction and turbulence, resulting in airflow resistance known as pressure drop [11]. The grain species and cultivars, as well as their properties such as moisture content, physical and mechanical properties, surface roughness, bulk depth, pore volume configuration and extraneous impurity quantity, have a significant impact on the aeration process and uniformity of the airflow throughout the grain bulk [12,13,14]. They also influence the intergranular air pathways and associated inter-speed currents as well as the exchange of temperature and moisture in bulk [15]. Therefore, assessing the prevailing airflow resistance in grain bulks is essential for the energy-efficient design of ventilation systems, aeration management and grain quality retention [16].
Physical experiments are commonly used to assess the airflow resistance of grain bulks and serve as important means for the development of mathematical models. In this regard, Shedd [17] established an empirical model by fitting experimental data of pressure drop ΔP across the grain bulk and airflow velocity va for several grain types using a logarithmic scale. va referred to the hypothetical airflow velocity calculated from the volume flow rate in the free bulk cross-section area, also known as superficial velocity. However, Shedd’s model was limited to a narrow range of airflow velocities, which was further enhanced by the model of Hukill and Ives [18]. Due to their ease of handling and simplicity, these models have been used in several studies [19,20,21]. In addition, Hunter [22] developed a lumped polynomial-based model capable of accurately anticipating the relationship of ΔP vs. va, but lacked insight into parameters affecting the airflow resistance. A modified version was proposed by Haque et al. [23] that included the moisture content as an input parameter. As these models were empirical in nature, they were tied to the same grain–air conditions and bin configurations for which they were created and therefore can outperform when those conditions vary widely.
To overcome the shortcomings of empirical models, semi-empirical models which use the grain’s physical characteristics and air properties have been developed. Ergun [24] conducted a thorough data analysis to describe the relationship between ΔP and va of uniform spherical particles and developed a semi-empirical model based on the Kozeny-Carman [25] and Burke-Plummer relationships [26], making this model one of the most commonly analyzed and used in the literature. However, the Ergun model lacked adaptability to non-spherical shapes of particles, thus Patterson [27] and Li and Sokhansanj [28] suggested quantitative improvements to account for irregular and random-sized shapes of grains. A simplification of these models was proposed by Bern and Charity [29]. In addition, Leva [30] developed a semi-empirical model based on the Hagen-Poisseuille law for isothermal flow that contained a modified friction factor for the state-of-flow and a shape factor for non-spherical particles, while Matthies and Petersen [31] established another model for high grain bulks. Due to their theoretical underpinning, the semi-empirical models were able to determine the effect of different grains, moisture contents, filling methods, impurity concentration and airflow directions on the airflow resistance [12,13,23,32]. They were also viable in isolating and quantifying the grain bulk pore volume. A summary of the above-mentioned models for describing the relationship of ΔP vs. va in grain bulks is presented in Table 1. So far, the known models are limited to depicting the complexity and diversity of bulk pore structures [29].
During storage, grain bulk undergoes burden pressures imposed by its dead weight, contributing to self-compaction [33,34,35]. Hence, the bulk characteristics may change depending on the degree of compaction. According to Rocha et al. [36], the airflow resistance in aeration systems is significantly increased with the increase of compaction when higher pressures are applied. Therefore, the misestimation of airflow resistance due to compaction can lead to ineffective aeration strategies and grain quality problems [35]. To date, the literature offers limited coverage on the effect of compaction on the airflow resistance of stored grain bulks where controlled compaction systems or filling methods were used [36,37,38]. However, the influence of spontaneous temporal and spatial self-compaction on the airflow resistance of practical storage systems has not been considered so far. Therefore, the objectives of this study were: (i) to investigate the effect of self-compaction on the pressure drop during aeration at various sets of airflow velocities, bulk depths and storage times, (ii) to mathematically describe the relationship of ΔP vs. va using a semi-empirical modeling approach, (iii) to develop a generalized model with itemized product factor and variable bulk pore volume and (iv) to evaluate the influence of parameters in modeling of pressure drop through a sensitivity analysis.

2. Materials and Methods

2.1. Raw Material and Sample Preparation

A total quantity of 1000 kg wheat (Triticum aestivum L.), cultivar ‘Pionier’ (I.G. Pflanzenzucht GmbH, Ismaning, Germany) was obtained from the Heidfeldhof research farm of the University of Hohenheim, Stuttgart, Germany (48°42′56.54″ N, 9°11′23.07″ E). The non-cereal harvest impurities such as straw, chaff, dust and stones (8.86 ± 1.37%) of aggregate mass were removed using an automated cleaning machine (D-4950, Samatec Saatguttechnik & Maschinenbau GmbH, Bad Oeynhausen, Germany). The cleaned bulk was stored for 24 h at hygienically safe conditions (temperature T of 14.90 ± 1.50 °C and relative humidity φ of 52.09 ± 7.07%) before being used for measurement of physical properties and airflow resistance experiments.

2.2. Characterization of Grain Physical Properties

The moisture content X (kg·kg−1 d.b.) of wheat kernels was determined by the standard thermogravimetric analysis in a convective oven (UM 700, Memmert GmbH & CO. KG, Schwabach, Germany) at 105 ± 1 °C for 24 h and natural air circulation according to AOAC [39], where moisture of 0.123 ± 0.001 kg·kg−1 d.b. was observed (dry matter of 89.01 ± 0.01%).
The principal geometrical characteristics of kernels, length L (mm), width W (mm) and thickness T (mm) were measured via a digital Vernier caliper (Digi-Met IP 67, Helios-Preisser GmbH, Gammertingen, Germany) with a measuring resolution of ±0.01 mm. Measurements were carried out for a total of 100 randomly selected kernels. Shape-dependent geometric properties such as arithmetic diameter da (mm), geometric diameter dg (mm), sphericity ϑ (%), aspect ratio Ra (-) and unit volume V (mm3) were estimated from the basic geometrical characteristics, as described by Karaj and Müller [40]. The equivalent diameter de (mm) of kernels was calculated as:
d e = 6   V π 3  
From Sirisomboon et al. [41], the surface area A (mm2) of kernels was estimated as:
A = π   W 2 ( W +   L   c arcsin c )   with   c = 1 ( W L ) 2
In addition, the gravimetric properties were assessed. Unit mass m (g) of kernels was measured by means of an analytical high-precision balance with an accuracy of ±0.10 mg (Sartorius BP221S, Sartorius AG, Göttingen, Germany). Solid density ρs (kg·m−3) was defined based on the toluene displacement method in a 25 mL pycnometer (Blaubrand, Wertheim, Germany) as described by Mohsenin [42]. Toluene was utilized as a water-insoluble liquid. The solid density ρs was determined as:
ρ s = m g r   ρ t o l m g r + m f l ,   t o l m g r ,   f l ,   t o l
where mgr (g) is the mass of kernel, mfl,tol (g) is the mass of pycnometer flask filled with toluene, mgr,fl,tol (g) is the mass of kernels soaked in toluene solution together with the flask and ρtol (kg·m−3) is the toluene density. The default bulk density ρb0 (kg·m−3) was measured by freely pouring kernels into a cylindrical container (150 mm diameter, 100 mm height) by maintaining a natural flow rate until overflowing. Afterwards, the surplus mass was gently swiped off using a wooden striker from the brim of the container and weighted. Hence, the bulk density ρb0 was calculated as:
ρ b 0 = m c V c
where mc (kg) is amassed mass in the container and Vc (m3) is the occupied volume. The default (uncompacted) pore volume ε0 (-) was defined as the fraction of the volume of intergranular voids in the bulk and was calculated as a function of the solid density and bulk density:
ε 0 = 1 ρ b 0 ρ s

2.3. Experimental Test Bench

The test bench used to perform the airflow resistance experiments is shown schematically in Figure 1.
A cylindrical acrylic-glass test bin (480 mm diameter, 3400 mm height and 5 mm wall thickness) with a wall friction coefficient of 0.32 ± 0.02 was used to accommodate approx. 500 kg of wheat kernels (Vb = 0.62 m3). A perforated floor (3.80 mm apertures, 18.60% opening area) was installed at the bottom of the test bin to allow undisturbed upward movement of air within the pore volume of the grain bulk and to assert minimal resistance to airflow according to ASAE [43]. Air was supplied by a centrifugal fan (RD6-NRD80S/2, Elektror GmbH, Esslingen, Germany) with a maximal volumetric air capacity of 1230 m3·h−1, pressure of 2500 Pa at the nominal fan speed of 2890 min−1 and power consumption of 0.75 kW at 380 V/50 Hz. The fan speed was adjusted to the experimental requirements by a frequency inverter (ST 8100, Sourcetronic GmbH, Bremen, Germany).
An air duct (150 mm diameter, 2000 mm length) was employed to connect the fan with the test bin. A thermal flow sensor with an integrated transducer (TA10, Höntzsch Instrument, Waiblingen, Germany) with a measurement accuracy of ±2.0% was used to measure the airflow velocity at a distance of 10-fold diameter of the duct [44]. The flow sensor was calibrated using a bench wind tunnel (8390, TSI Incorporated, Shoreview, MN, USA). Based on the airflow velocity in the duct, the volume flow was calculated and subsequently the superficial velocity va in the test bin. At the duct end, a 90° bow rubber pipe and a honeycomb-shaped polycarbonate straightener (100 mm diameter, 50 mm thickness) were installed to prevent the fan propagating vibrations and ensure uniform flow conditions [12]. All joints of the test bench were examined for air leakage and were tightly sealed.
Pressure taps (2 mm diameter, 30 mm length) were attached in the wall of the test bin at depths of 1.0, 2.0, 3.0 and 3.4 m (P1.0–P3.4). The taps protruded 2 mm inside the bulk to reduce the possible wall effects during the pressure measurements. At each depth, six taps were evenly distributed around the circumference at a segment angle of 60° and connected by a loop of 4 mm diameter transparent polyethylene hose, which was also used to connect the loops with the pressure sensors (GMSD 25MR & GHM 3151-Ex, GHM Messtechnik GmbH, Remscheid, Germany) with an accuracy of ±0.50 Pa. Combined temperature/humidity sensors (SHT25, Sensirion AG, Zurich, Switzerland) were placed in the centerline of the test bin at the same depths as pressure sensors to measure the temperature Ta (±0.20 °C) and relative humidity φa (±1.80%) of intergranular air in the grain bulk. A data logger (Agilent 34901A, Agilent Technologies Inc., Santa Clara, CA, USA) was used to acquire data from all sensors and record them on a laboratory computer. Manual sampling and offline thermogravimetric analysis were also conducted to determine the grain moisture content in the bulk [39].

2.4. Experimental Procedure

A motor-driven screw conveyor (T206/4, Wolf Landtechnik GmbH, Petersberg, Germany) was used to fill the test bin and to ensure a practical filling procedure of grain bulk at a standard flow rate. The resulting bulk cone of approx. 30° was manually drawn off flush at the top edge [14]. After 1 h, during which the grain bulk rested, the fan was started with a frequency f of 10.0 Hz and gradually increased by 5.0 Hz intervals until 50.0 Hz, resulting in nine steps of airflow velocities. The fan speed was changed only when the fluctuations of the pressure readings were calming down to less than 2.0%. The pressure drop ΔP was estimated as the difference of pressure at Hb of 1.0 (P1.0), 2.0 (P2.0), 3.0 (P3.0) and 3.4 m (P3.4) to the pressure at the top of the test bin at Hb of 0.0 m bulk depth. In order to investigate the effect of self-compaction over time t, the same procedure was repeated after 65, 164 and 236 h. Table 2 shows the average fan speed ω, airflow velocity va, mass flow rate and volume flow rate Q used for the experiments, which were chosen based on the practical recommendations for aeration and drying systems [45]. For the analysis of the relationship between pressure drop ΔP and airflow velocity va, a total of 15,760 data were gathered at different bulk depths Hb and storage times t. The intermittent forced aeration was applied only for the airflow resistance experiments, while the traditional storage without aeration was used for the rest of the time.

2.5. Semi-Empirical Modelling of Airflow Resistance

Out of the available semi-empirical models in literature, the Matthies and Petersen [31] was chosen as the most appropriate for modeling ΔP vs. va of grain bulks Hb ≥ 2.50 m, which covers the irregular and random-sized shapes of wheat kernels and a wide range of airflow velocities. This model is expressed as:
Δ P H b = k   ζ   ρ a   v a 2 2   d e   ε 4
where ΔP (Pa) is the pressure drop in bulk, va (m·s−1) is the airflow velocity, Hb (m) is the bulk depth, k (-) is the product factor related to the shape configuration, size and surface characteristic of wheat kernels, ζ (-) is the coefficient of air resistance, ρa (kg·m−3) is the density of intergranular air and ε (-) is the pore volume of grain bulk. The product factor k was estimated by fitting the model to the experimental data, while the coefficient of air resistance ζ was determined as:
ζ = 47.92 R e + ( 1.18   R e ) 0.1
where Re (-) is the Reynolds number, which was expressed as a function of the equivalent diameter of kernels de (mm):
R e = v a   ρ a   d e μ a
where μa (kg·m−1·s−1) is the dynamic viscosity of air in the pore volume of grain bulk. The thermodynamic characteristics of air μa, ρa and Reynolds number Re were calculated based on the temperature Ta and relative humidity φa of intergranular air of grain bulk during aeration. Therefore, the Matthies and Petersen [31] model (Equation (6)), by embedding the Re and ζ, can be written as:
Δ P H b = k ( 23.96   μ a v a ε 4 d e 2 + 0.51   μ a 0.1 ρ a 0.9 v a 1.9 ε 4 d e 1.1 )
The above-mentioned equation was used to fit the experimental data of ΔP vs. va at various bulk depths and storage times.

2.6. Statistical Analysis and Graphical Presentation

The graphical representation of data and the nonlinear least-squares fitting procedure at 95.0% significance level (p ≤ 0.05) were carried out in MATLAB 2019a (MathWorks Inc., Natick, MA, USA). The Levenberg-Marquardt algorithm was used for the fitting of experimental data in a series of iterative steps with a convergence criterion of 1.0 × 10⁻⁶. The coefficient of determination R2, root mean square error RMSE and mean absolute percentage error MAPE were employed as statistical criteria to assess the goodness of fit, which were defined as follows:
R 2 = 1 i = 1 n ( Δ P o b s Δ P p r e d ) 2 i = 1 n ( Δ P o b s Δ P o b s ¯ ) 2
R M S E =   i = 1 n ( Δ P o b s Δ P p r e d ) 2 n
M A P E = 100 n i = 1 n | Δ P o b s Δ P p r e d Δ P o b s |
where ΔPpred (Pa) is the predicted pressure drop, ΔPobs (Pa) is the observed pressure drop ascertained from experiments and n (-) is the number of observations. The sensitivity analysis using Monte Carlo simulations in MATLAB/Simulink 2019a (MathWorks Inc., Natick, MA, USA) performed to evaluate the influence of modeling parameters on pressure drop. Furthermore, the CAD design of the experimental test bench was carried out in SOLIDWORKS 2019 (Dassault Systèmes, Waltham, MA, USA).

3. Results and Discussion

3.1. Characterization of Grain Physical Properties

Table 3 presents the summary of the geometric and gravimetric properties of wheat kernels (Triticum aestivum L.) cv. ‘Pionier’ at moisture content of 0.123 ± 0.001 kg·kg−1 d.b.
It can be discerned from Table 3 that a low standard deviation was exhibited from geometric properties, indicating that data were tightly clustered around the mean value. The length L, width W and thickness T were found to be consistent with the literature, with values falling within 5.78–7.45 mm, 2.36–3.93 mm, 2.56–3.27 mm reported by Tabatabaeefar [46], Karimi et al. [47], Molenda and Horabik [48] and Wang et al. [49] for other wheat varieties but similar moisture contents. Therefore, the shape-dependent properties such as arithmetic diameter da, geometric diameter dg, equivalent diameter de, aspect ratio Ra, sphericity ϑ, surface area A and unit volume V were also in conformity with the same literature. However, kernel dimensions were slightly larger than those reported by Giner and Denisienia [12], Nelson [50], Petingco et al. [51] and Markowski et al. [52], which can be attributed to differences in sample origin, cultivar, specific growth conditions and moisture contents. Gürsoy and Güzel [53], on the other hand, reported lower values for width and thickness for similar kernel lengths, resulting in a lower aspect ratio Ra and sphericity ϑ.
In addition, the gravimetric properties are presented in Table 3. Due to the larger kernel dimensions, a larger unit mass m was observed compared to values reported by Gürsoy and Güzel [53] and Markowski, Żuk-Gołaszewska and Kwiatkowski [52]. The values of bulk density ρb0, solid density ρs and pore volume ε0 were found to be in decent agreement with values reported by Molenda and Horabik [48], Haque et al. [23], Jayas and Cenkowski [54], Muir and Sinha [55] and Kraszewski [56]. However, higher values of bulk density ρb0 and pore volume ε0 were observed compared to Markowski, Żuk-Gołaszewska and Kwiatkowski [52], which can be ascribed to the cultivar and/or kernel moisture content, as well as container volume, size, quantity of impurities, filling procedure and filling height and rate, which in turn affected the bulk packing in the container [57,58]. In contrast to Giner and Denisienia [12], lower values of bulk density ρb0 were obtained, resulting in a higher pore volume ε0 for similar solid density ρs.

3.2. Bulk Conditions during Experimentation

During pressure drop experiments, variations in temperature Ta from 12.29 to 17.18 °C and relative humidity φa from 34.04 to 40.87% were observed for the intergranular air of the grain bulk at 1, 65, 164 and 236 h storage time t. The associated thermodynamic properties of air, in terms of viscosity μa and density ρa, were assessed according to White and Majdalani [59] and tabulated in Appendix A (Table A1). The observed data were utilized for the semi-empirical modeling of pressure drop. Despite fluctuations in temperature Ta and relative humidity φa, no significant differences were observed in moisture content X of the wheat bulk (0.123 ± 0.001 to 0.122 ± 0.001 kg·kg−1 d.b.) at p ≤ 0.05 during the experiments, which means that possible effects of drying on the self-compaction were excluded.

3.3. Determination of the Product Factor k

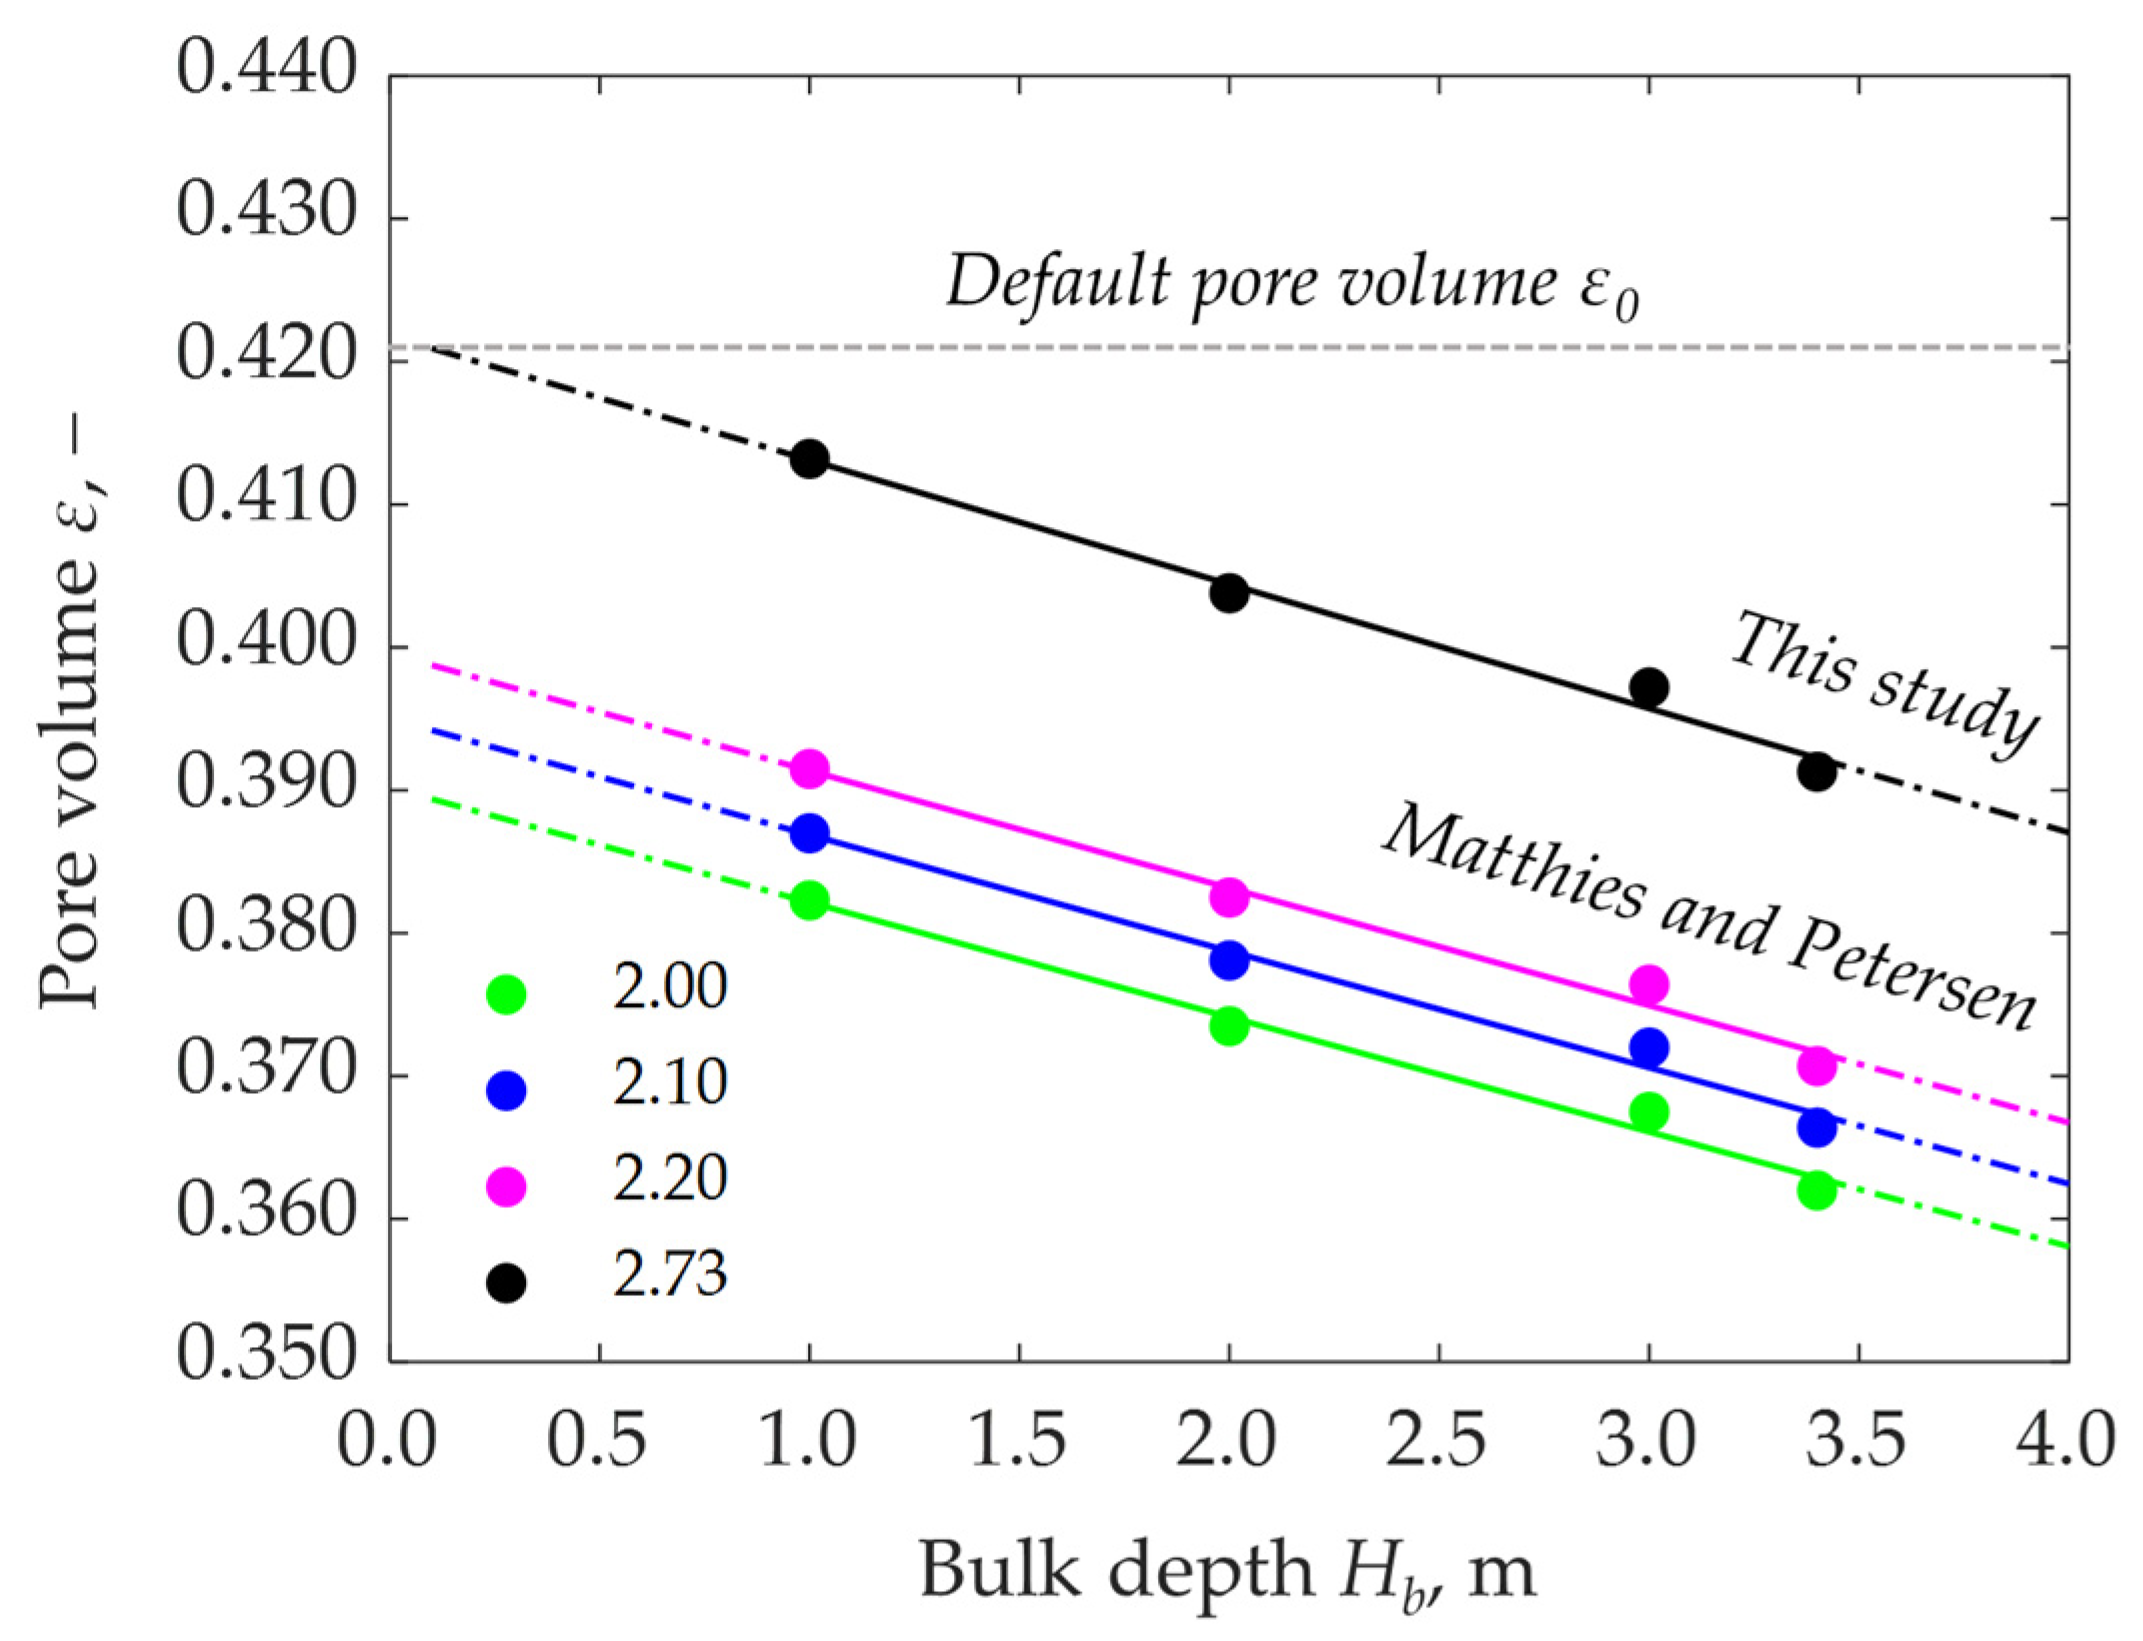
Matthies and Petersen [31] found a product factor k ranging from 2.00 to 2.20 in their study for calculating the airflow resistance of stored wheat bulks. However, a different wheat variety with different moisture content, physical properties, kernel size distribution and filling method has been employed in this study, therefore the value of k was tailored to the specific grain bulk and experimental conditions. Herewith for the determination of k, the experimental data of ΔP vs. va for bulk depths of Hb 1.0, 2.0, 3.0 and 3.4 m and storage time t of 1 h were fitted by the Matthies and Petersen model (Equation (9)) and the pore volume ε at different depths Hb was determined, accordingly. The observed ε were afterwards fitted by a linear model to describe the relationship between ε and Hb and extrapolated to Hb = 0.1 m, which is the criterion for comparison with the default ε0 (uncompacted) ascertained in the laboratory. First, the reported k were used and afterwards k was iteratively adjusted by intervals of 0.01 until the predicted pore volume matched the default ε0 of 0.421 (Figure 2). By using this criterion, a value of k of 2.73 was found, which fell between values of 2.00 and 3.90 used for various grains by Matthies and Petersen [31]. This finding was consistent with findings of Bakker-Arkema et al. [60] and Patterson [27], who adjusted the factor k for the specific settings of their experiment and found out higher values of k than those reported by Matthies and Petersen [31].
The linear models and the goodness of fit acquired from individual fittings at k of 2.00, 2,10, 2.20 and 2.73 are presented in Table 4. An accuracy of R2 ≥ 0.985 was observed from fitting with the linear models, which indicated a high capability of the employed models to depict the relationship between ε and Hb at different k. Figure 2 displays graphically the variation of the pore volume ε influenced by factor k with respect to the default ε0. It can be seen that the values of ε increased proportionally with the increase of k. The values proposed by Matthies and Petersen [31] resulted in underestimation of 7.31, 6.17 and 5.09% of default ε at Hb = 0.1 m for k of 2.00, 2.10 and 2.20, respectively. Moreover, these factor k yielded a MAPE of 26.82, 23.17 and 19.51% for pressure drop in fitting the experimental data. Therefore, a product factor k of 2.73 was used for prediction of pressure drop of wheat bulk cv. ‘Pionier’.

3.4. Influence of Self-Compaction on the Airflow Resistance

Figure 3a shows the experimental data of the pressure drop ΔP vs. airflow velocity va at bulk depths Hb of 1.0, 2.0, 3.0 and 3.4 m at 1 h storage time t. The overall variation of ΔP during the measurement cycle was relatively small, with the standard deviation ranging from 0.51 to 24.86 Pa, which indicated that the data were highly reproducible and tightly clustered around the mean values. The experimental data exhibited a progressive increase in pressure drop ΔP with increasing air velocity va and bed depth Hb, which were comparable to those of Giner and Denisienia [12] for similar moisture content and velocities smaller than 0.15 m·s−1. This can be explained by the application of the same filling procedure that produced a dense bulk configuration as is typically used in practice. A similar trend of pressure drop for wheat was reported by Molenda et al. [37] for sprinkle filling. However, the results of ΔP vs. va were higher than those of Shedd [17] and Haque et al. [23], which can be attributed to the differences in wheat varieties and filling methods, resulting in higher resistance to airflow and higher pressure drops.
When fitting the Matthies and Petersen [31] to the experimental data and using the default pore volume ε0 of 0.421 as obtained from laboratory measurements, where the curves were found to increasingly deviate with increasing airflow velocity va and bulk depth Hb. For Hb = 1.0 m, a decent fit is observed for va ≤ 0.10 ms−1, after which the model tends to underestimate the experimental data values by up to 11.78%. Notably, this tendency becomes more prominent with the increase of Hb to 2.0, 3.0 and 3.4 m, where differences increase with a deviation up to 19.62, 24.61 and 28.92%, respectively. Hence, the observed results were found to be irreconcilable with the homogeneous and isotropic consideration of grain bulk reported in literature, for which the pressure drop curves between depths Hb are linearly equidistant at a given velocity va, as the curves from prediction underestimated the behavior of the experimental data. Figure 3b shows the distribution of predicted ΔPpred vs. observed ΔPobs for the default pore volume ε0.
It can be seen that the model exhibit an inferior performance with the data deviating from ΔPpred = ΔPobs line and clustering towards the line ΔPpred = 0.73ΔPobs + 54.70 with R2 = 0.993 and thus revealing an average underestimation of 22.0%. This disparity, however, is likely to increase as velocity va exceeds the limit used in this study.
To account for the spatial change of the pore volume in the grain bulk caused by self-compaction, the experimental data were refitted for each bulk depth Hb by adjusting the ε values. A reduction in pore volume ε of 0.413, 0.404, 0.397 and 0.391 was found from fitting analysis for Hb of 1.0, 2.0, 3.0 and 3.4 m. The variation of the pressure drop ΔP using the variable pore volumes ε is displayed in Figure 3c, where the fitted curves have accurately described the course of the experimental data. When using adjusted pore volume ε, the distribution of data was closely dispersed around the line ΔPpred = 0.97ΔPobs + 38.72 in close proximity with line ΔPpred = ΔPobs, hence revealing a high accuracy prediction with R2 = 0.995 by the employed model (Figure 3d). These results were accredited to the vertical decrease of pore volume ε by 5.30%, which was in line with the findings of Cheng et al. [61] for compressive pressure levels ranging from 0 to 50 kPa. This behavior can be explained by the pressure of the overlying grain mass, which increases the in-situ intergranular stresses between kernels due to the dead weight of the overlying bulk [33]. Consequently, the pressure drop ΔP increased non-uniformly with the increase of the bulk depth Hb.
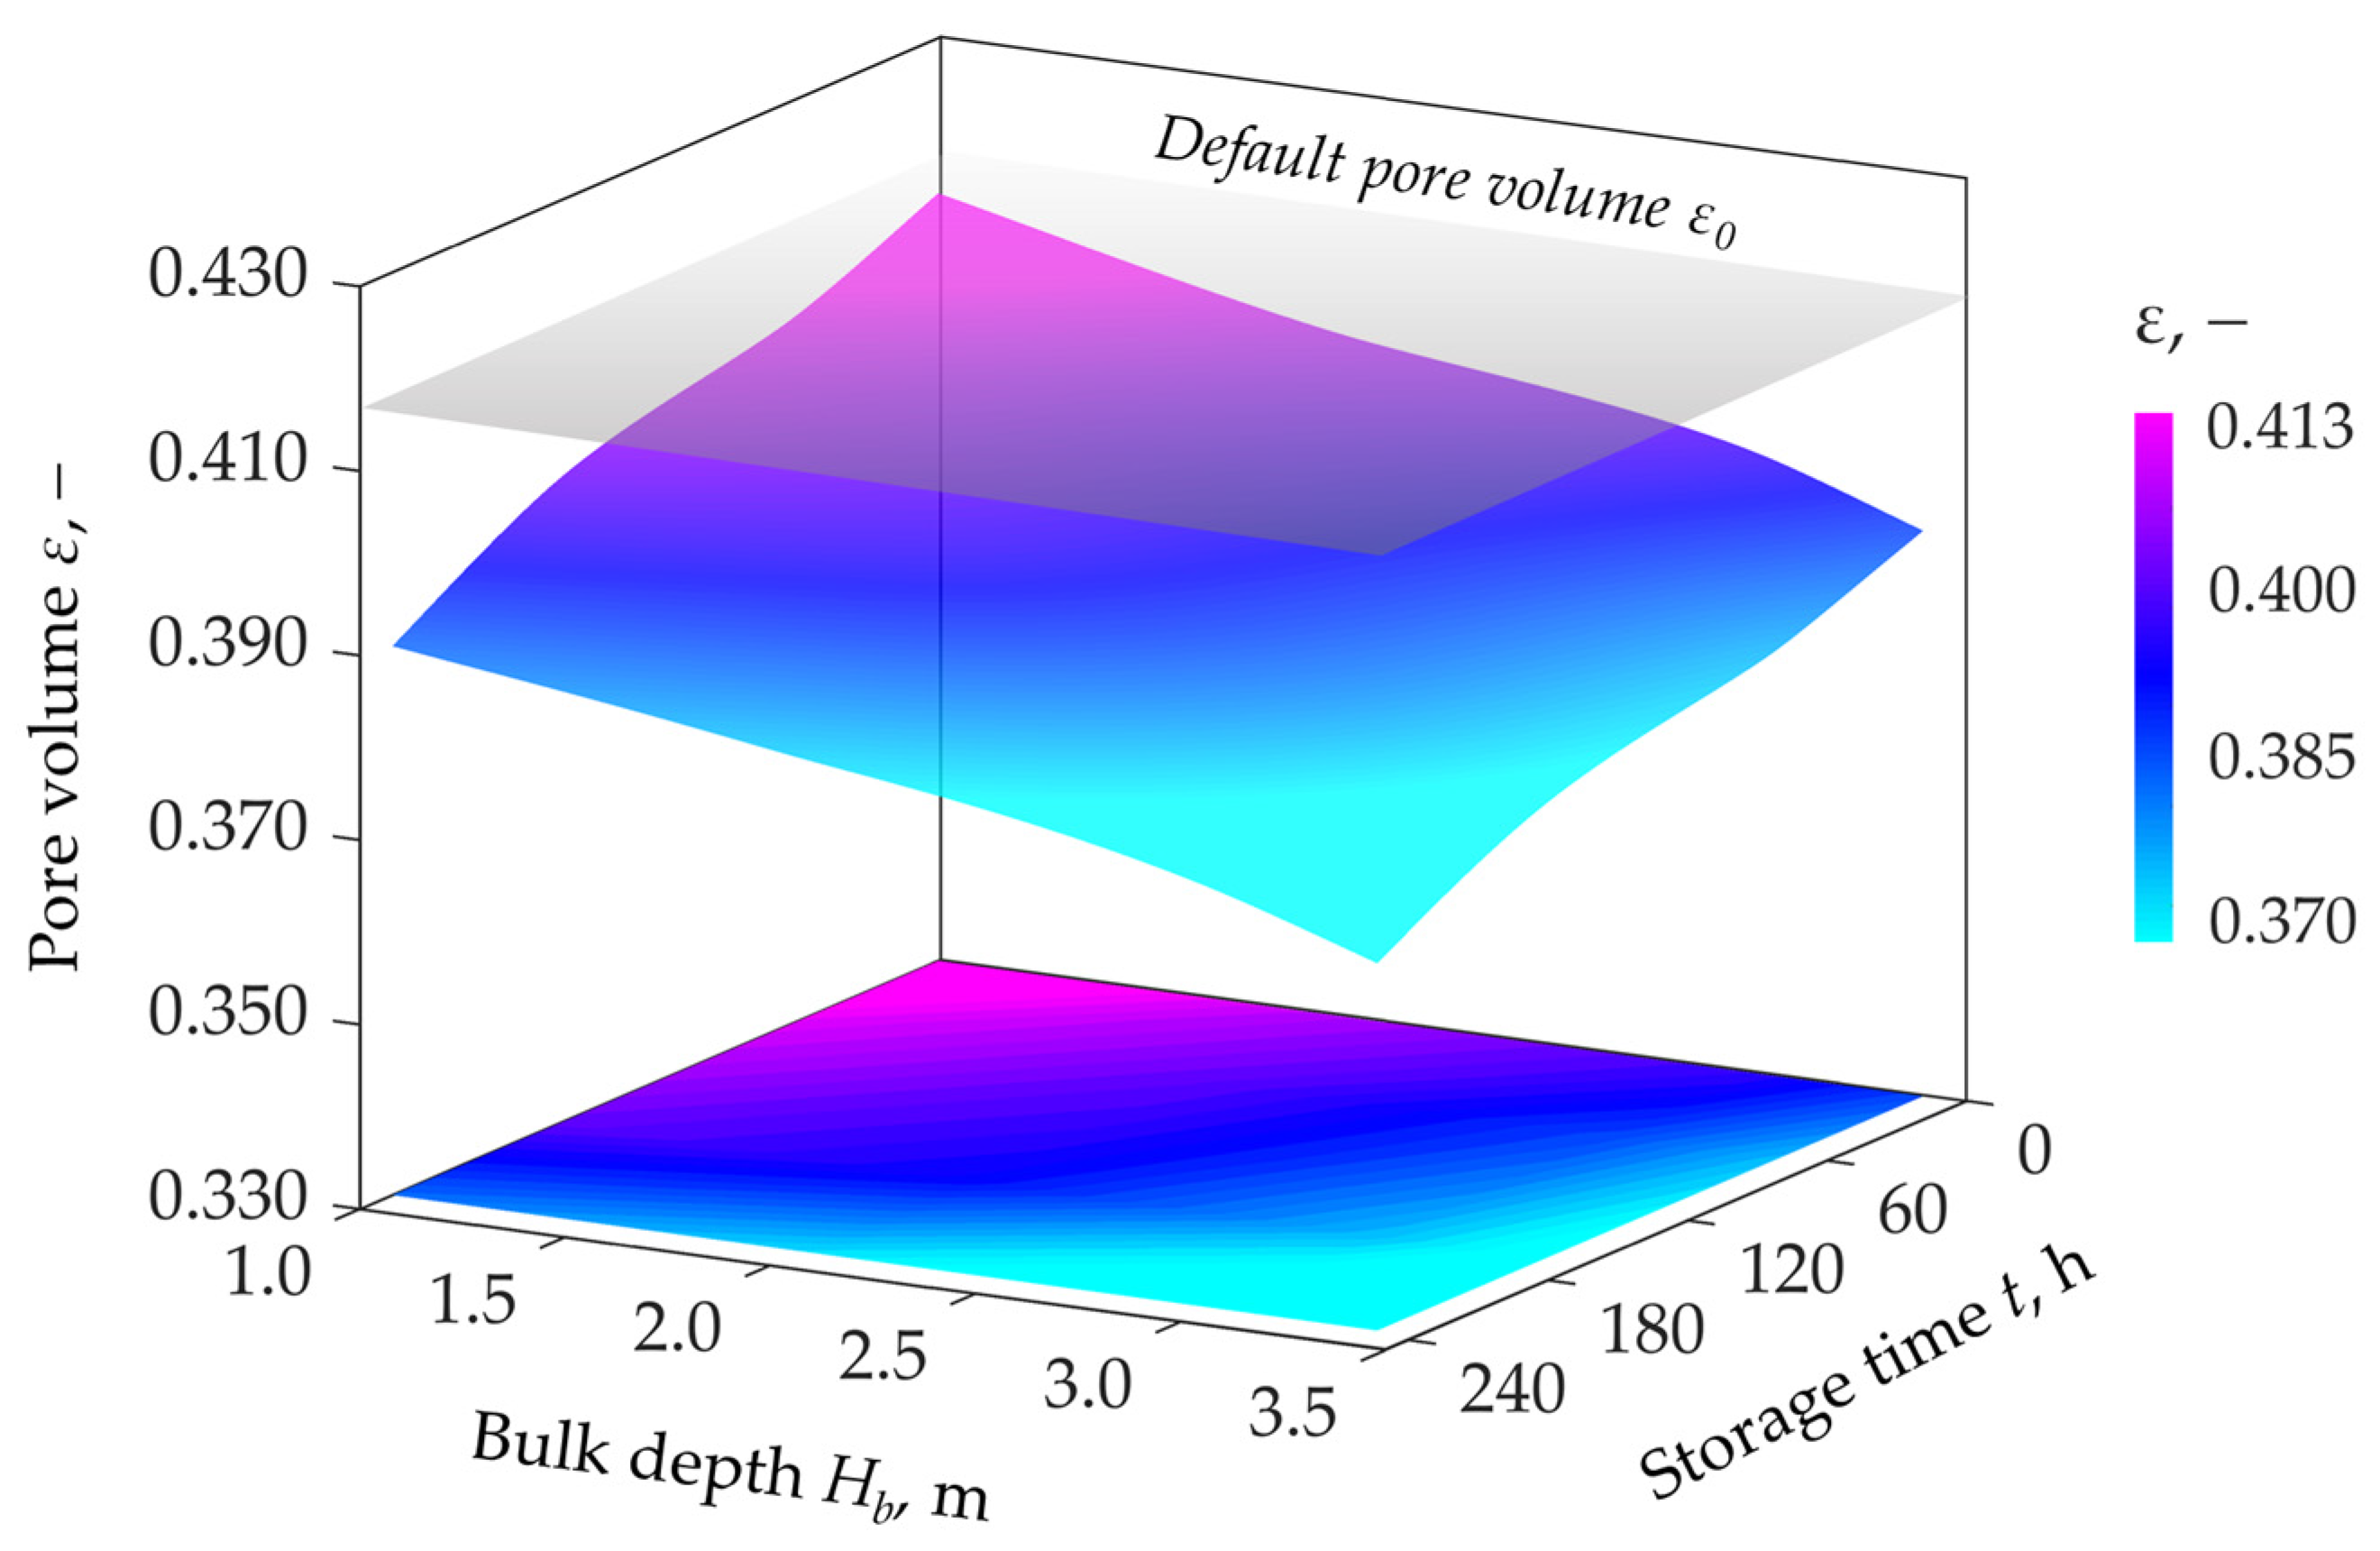
Since self-compaction is a dynamic process, the ΔP vs. va were fitted for different storage times t and the pore volume ε was also adjusted. Results of ε for bulk depths Hb of 1.0, 2.0, 3.0 and 3.4 m and storage time t of 1, 65, 164 and 236 h are shown in Figure 4. The default pore volume ε0 was indicated by the grey plane in the chart.
For the different bulk depths Hb of 1.0 to 3.4 m, a temporal decrease of ε from 0.413 to 0.391, from 0.406 to 0.385, from 0.400 to 0.379 and from 0.390 to 0.370 was observed when storage time t increased from 1 to 65, 164 and 236 h. The resultant stresses are believed to initially influence the reorientation of the kernels and then cause the irreversible plastic deformation once the rupture force is attained, which eventually decreases the pore volume ε [33]. The compaction of the grain mass can be attributed to the visco-elastoplastic properties of kernels. However, Figure 4 shows that the grain mass did not settle completely and a longer time can be required to achieve the permanent equilibrium.
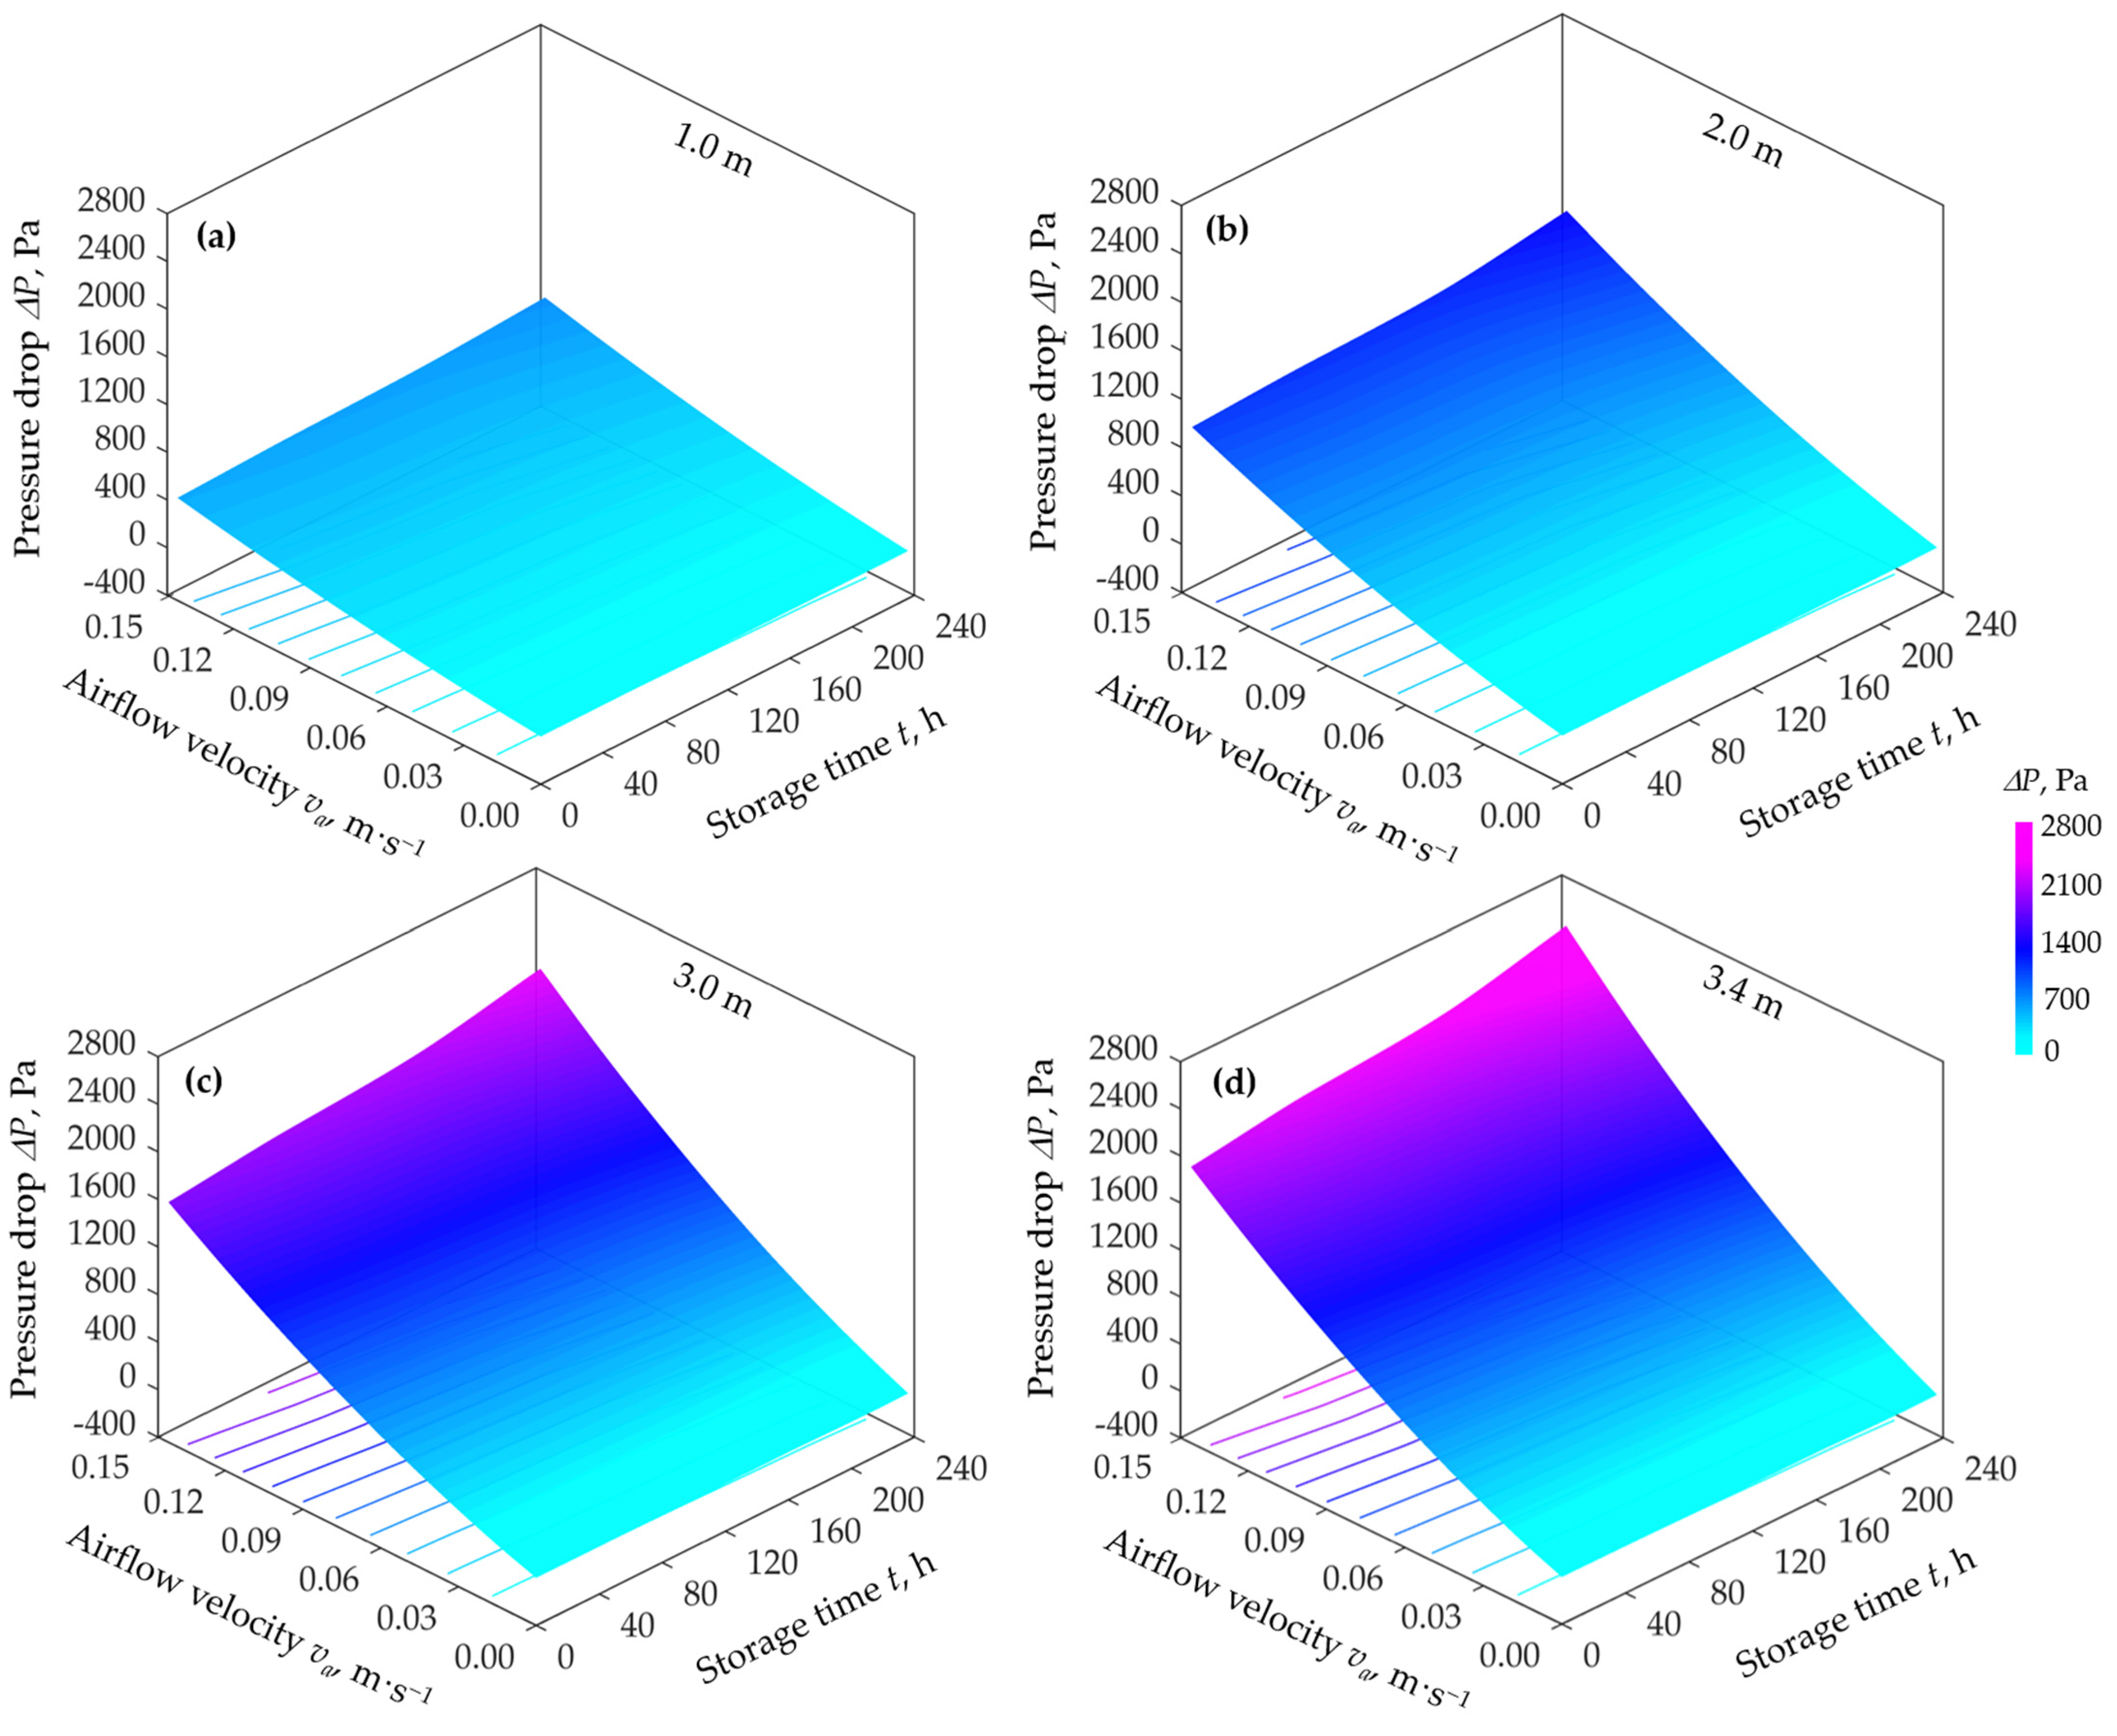
Figure 5 presents the pressure drop ΔP vs. airflow velocity va for storage time t predicted with the Matthies and Petersen model. It can be seen that the pressure drop manifested a temporal increase throughout 236 h of storage time t, which can be ascribed to the gradual and irreversible dynamic compaction of the bulk [62,63]. Hence, a variation of pressure drop ΔP from 1231.92 to 1536.97 Pa was estimated for 3.40 m bulk depth Hb at va = 0.10 m·s−1 once the storage time t increased from 1 to 236 h, which accounted for an increase of 24.76%. The higher pressure drops are mainly attributed to the dense fill created by the kernel packing due to the reduction of pore volume ε, which leads to increased kinetic energy dissipation due to friction and turbulence and higher intergranular resistances of the airflow. Similar outcomes were reported by Kumar and Muir [32], Molenda et al. [37] and Łukaszuk et al. [38], who found a considerable increase in pressure drop ΔP due to increase of ρb and reduction of ε obtained from the application of different filling methods and filling height. The same tendency has been also noted by Jayas et al. [64] for rapeseed, Kay et al. [65] for maize and Siebenmorgen and Jindal [66] for rice. However, they used the mean pore volume ε for modeling the relationship between ΔP and va and did not encounter the lateral variation of ε caused by self-compaction. Moreover, the results of this study are consistent with the outcomes of Haque [67], who confirmed the effect of non-homogeneous bulk of wheat on the pressure drop per unit of bulk depth due to self-compaction. Khatchatourian and Savicki [68] reported similar findings for soybeans. Despite consistency with published research, the effect of storage time t on ΔP has not been reported so far.
A summary of adjusted pore volumes ε and statistical indicators attained from the fitting analysis is given in Table 5. The inspection of the statistical indicators revealed that the Matthies and Petersen [31] model was capable of depicting the course of ΔP vs. va at a decent accuracy. Particularly, R2 between 0.983 and 0.996, RMSE between 15.18 and 123.77 Pa and MAPE between 8.21 and 16.16% were observed, respectively. However, a slight overestimation was observed at all predicted curves from 0.06 to 0.09 m·s−1. Furthermore, from Table 5 can be discerned an increase in bulk density ρb which goes along with the decrease of pore volume ε. Particularly, a variation of 793.00–822.60 kg·m−3, 802.33–830.98 kg·m−3, 810.98–938.95 kg·m−3 and 825.03–851.65 kg·m−3 was observed for the bulk density ρb at the bulk depths Hb of 1.0 to 3.4 m and storage times t of 1, 65, 164, 236 h, respectively.
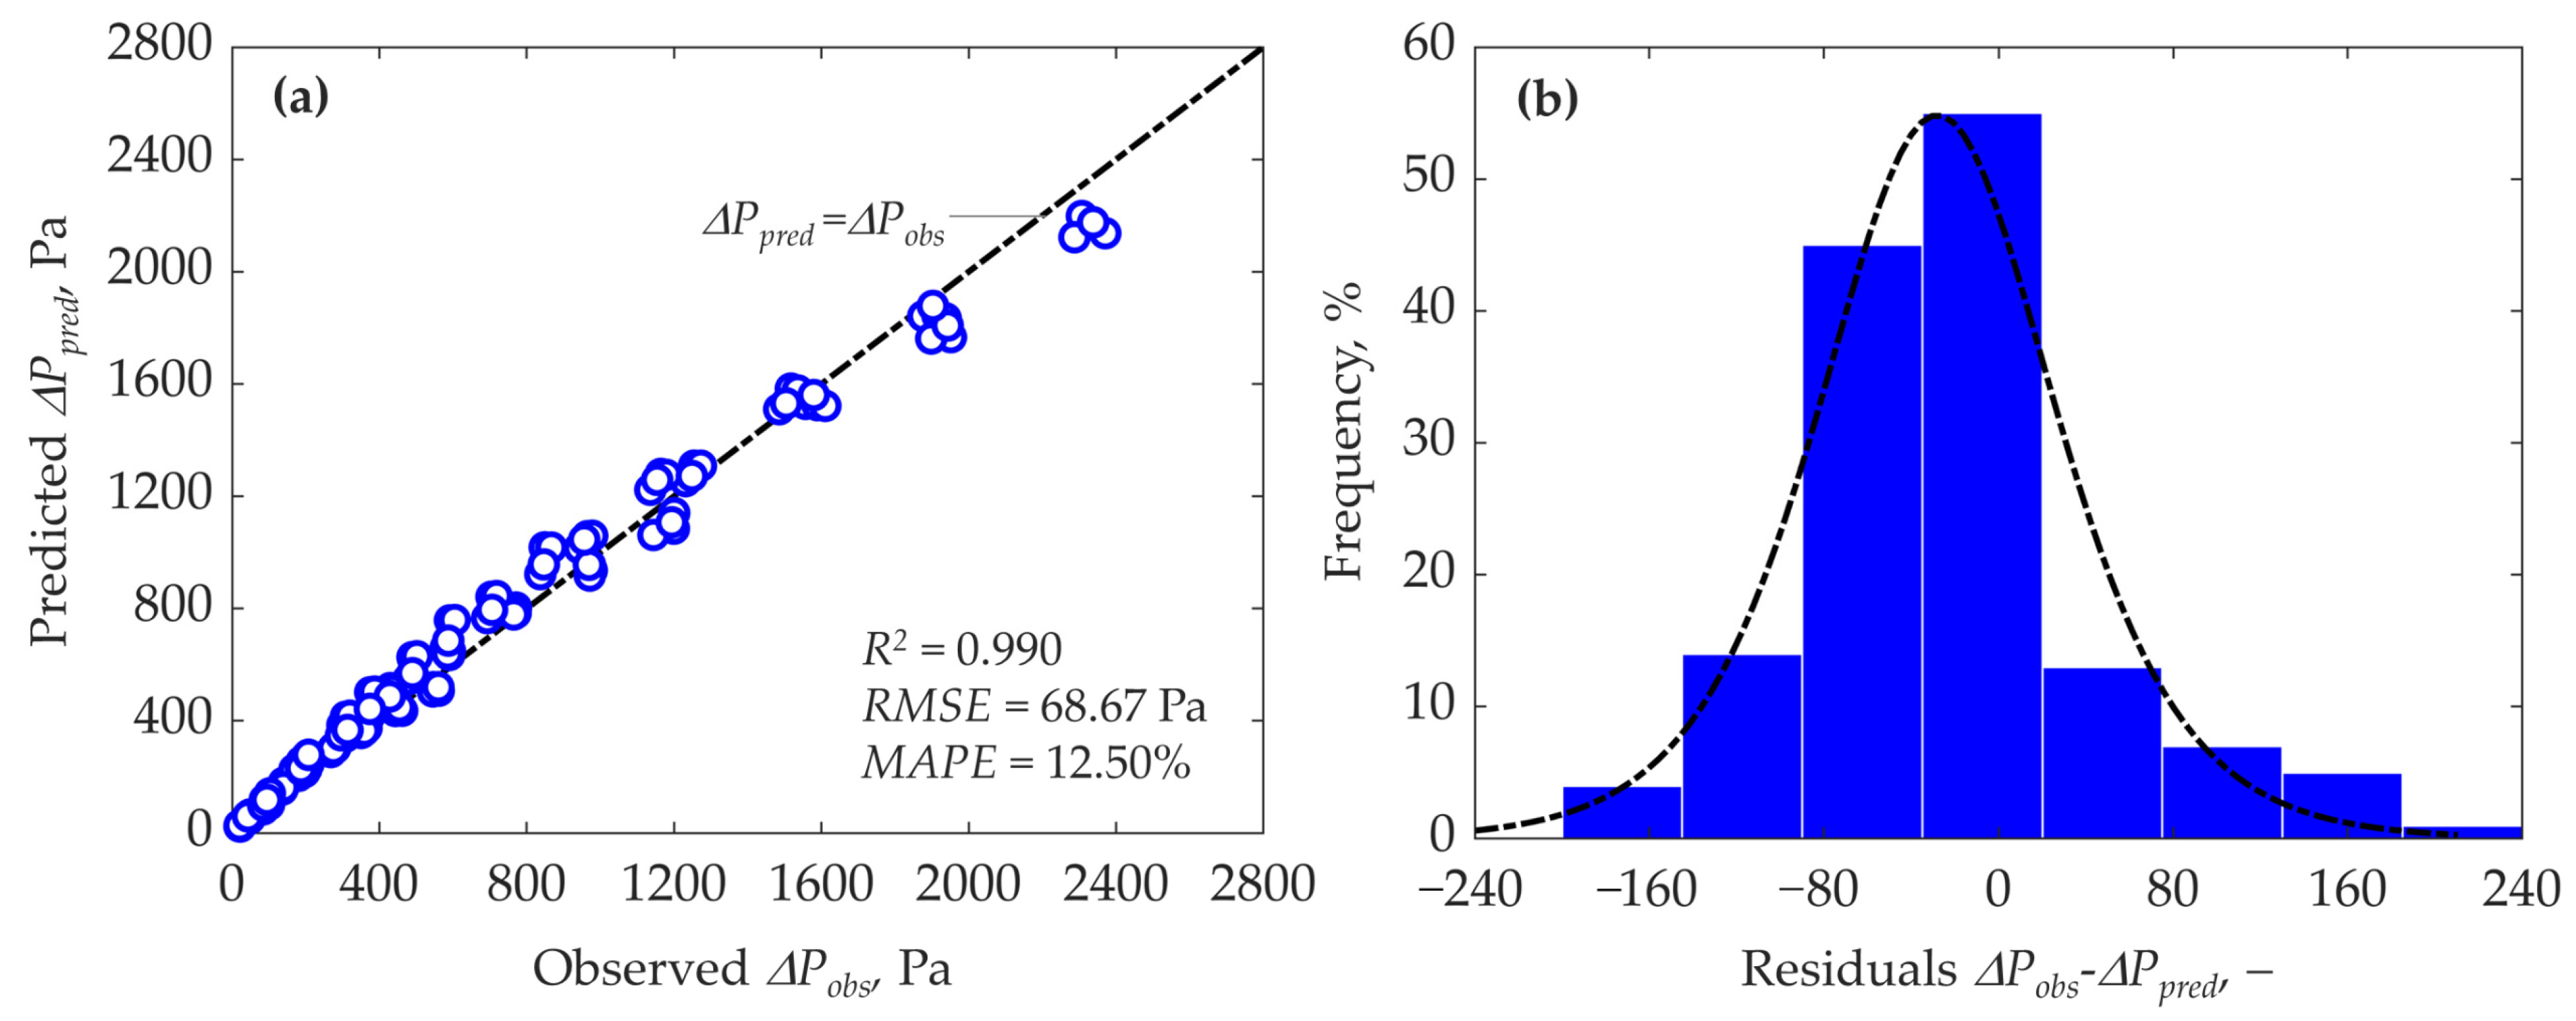
Figure 6a presents the data from pooling all predicted ΔPpred and experimental ΔPobs from the fitting analysis. It can be seen that the experimental data were satisfactorily anticipated by the model since they fell around the line of ΔPpred = ΔPobs, hence showing an appropriate accuracy of prediction of the Matthies and Pettersen model for the employed range of va, Hb and t with an R2 = 0.990, RMSE = 68.67 Pa, MAPE = 12.50%.
The frequency distribution of residuals is shown in Figure 6b. The results indicate that the residuals follow a random distribution. This distribution was found to be unbiased and homoscedastic with non-constant variance, hence a reasonably symmetric and unimodal distribution of residuals around 0 was observed, which supported the validity of the engaged model. The values of residuals ranged from −169.24 to 233.55. However, 55.0% of data fell between −34.97 and 9.78. According to the Shapiro-Wilk test, the residuals indicated a significant likelihood of non-normal distribution at p ≤ 0.05. Hence, a logistic model was employed to describe the distribution behavior of residuals.

3.5. Modelling of Pore Volume Variation in Bulk

To establish a generalized semi-empirical model, pore volume ε was expressed as a function of bulk depth Hb analogous to the model proposed by Gao et al. [69] and Cheng et al. [35] for bulk density, which is given as:
1 ε 0 ε ε 0 ε m i n = a H b + c
where ε0 (-) refers to the default pore volume and εmin (-) refers to the minimal pore volume observed at the highest bulk depth Hb of 3.4 m, while a and c are the empirical constants observed from fitting analysis. To determine the pore volume ε, Equation (13) was rewritten as:
ε = ε 0 ( ε 0 ε m i n ) · ( 1 a H b c )
Table 6 presents the equations and goodness of fit derived from the regression analysis for the different storage times t. The constants a and c were embodied in the equations. A variation of constant a from −0.292 to −0.156 and c from −1.026 to −0.557 was observed accordingly, hence revealing a decreasing trend of constants a and c with the increase of storage time t. The statistical indicators confirmed the capability of the employed model to predict closely the data with a high accuracy of R2 ≥ 0.963.
In analogy with Equation (14), a model for describing pore volume ε as function of bulk height Hb and storage time t with an R2 of 0.972 could be established:
ε = ε 0 ( ε 0 ε m i n ) · ( 1 + 0.016 H b + 0.002 t 1.013 )  
This allowed the inclusion of the influence of bulk depth Hb and storage time t in the Matthies and Petersen model (Equation (9)), hence yielding a generalized model:
  Δ P = 2.73 · ( 23.96   μ a v a d e 2 + 0.51   μ a 0.1 ρ a 0.9 v a 1.9 d e 1.1 ) · ( H b ( ε 0 ( ε 0 ε m i n ) · ( 1 + 0.016 H b + 0.002 t 1.013 ) ) 4 )
The generalized model was able to depict the airflow resistance of wheat with an R2 of 0.989, RMSE of 75.91 Pa and MAPE of 16.29%.

3.6. Sensitivity Analysis

The relative importance of parameters in modeling of pressure drop ΔP was determined through a sensitivity analysis, which was performed by generating a randomized combination of input parameters (va, Hb, ε, de, ρa, μa) of Equation (9) within their range of operating conditions and evaluating their impact on pressure drop ΔP. Figure 7 presents the standardized regression coefficients of sensitivity analysis, with parameters ranked by influence. Results of the analysis indicated that air velocity va is the most influential parameter, which significantly influences the pressure drop ΔP due to its contribution to energy dissipation of air pathways due to friction and turbulence. A value of 0.85 was obtained, indicating how decisive va is for the airflow resistance and aeration process of wheat bulk. Therefore, bulk depth Hb makes a considerable contribution in ΔP, where a value of 0.47 was observed, demonstrating a relatively weaker influence (−44.71%) compared to airflow velocity va. Noticeably, va and Hb are positively correlated with ΔP, therefore higher values of velocity or bulk depth result in the increase of pressure drop with the magnitude determined by the analysis. Pore volume ε and particle diameter de were identified as less decisive, which negatively affect ΔP with values of −0.18 and −0.15, respectively. They are responsible for the bulk configuration, therefore, their reduction increases the resistance to airflow and consequently increases the pressure drop ΔP. The parameters that had the least influence were air density ρa (0.05) and dynamic viscosity of air μa (0.01) which were affected by the minor variations of temperature Ta and relative humidity φa of the air passing through the grain bulk.

4. Conclusions

In this study, the resistance to airflow of a wheat grain bulk (Triticum aestivum L., cv. ‘Pionier’) under a set of air velocities, bulk depths and storage times was investigated. The physical characteristics of wheat kernels were experimentally assessed as a prerequisite for modeling the airflow resistance. For the characterization of ΔP vs. va relationship, the Matthies and Petersen model was employed, for which the product factor k was tailored for the specific wheat variety and experimental settings used in this study. From the fitting analysis, a goodness of fit with R2 of 0.990, RMSE of 68.67 Pa and MAPE of 12.50% was observed for bulk depths ranging between 1.0 and 3.4 m and storage times between 1 and 236 h, which demonstrated a great potential of the employed model to describe the course of the experimental data with decent accuracy. Due to self-compaction, a spatial reduction of pore volume from 0.413 to 0.391 at bulk depths of 1.0 to 3.4 m after 1 h storage time and temporal reduction from 0.391 to 0.370 after 236 h storage time was observed, accordingly. Therefore, a disproportional increase of the pressure drop ΔP with bulk depth and storage time was observed, which was in contrast with the assumption of homogeneous and isotropic aerodynamic conditions in grain bulks often made in the literature. Thus, for practical application, higher power is required by the fan to maintain the required airflow velocity in bulk than when estimated from the default pore volume measured by the standard laboratory methods. The variation of pore volume ε was modeled and supported the development of a generalized model that could satisfactorily predict the airflow resistance of wheat bulk under self-compaction.
It could be shown that self-compaction plays a critical role in airflow resistance and therefore should be included in the design and analysis of cooling, aeration and low-temperature drying of in-store grain bulks. Further research should focus on the assessment of airflow resistances under self-compaction for other grains, moisture contents, bulk configurations and airflow velocity range. Moreover, the dynamics of grain compaction until permanent equilibrium should be further investigated. In addition, advanced numerical methods should be employed for an in-depth analysis of kernel and bulk behavior subjected to a wide range of loads encountered in practice during the storage of grain bulks.

Author Contributions

Conceptualization, I.R., S.S., S.K. and J.M.; methodology, I.R., S.S., S.K. and J.M.; software, I.R.; validation, I.R.; formal analysis, I.R.; investigation, I.R.; resources, I.R. and J.M.; data curation, I.R.; writing—original draft preparation, I.R.; writing—review and editing, I.R., S.S., S.K. and J.M; visualization, I.R.; supervision, J.M.; project administration, I.R., S.S., S.K. and J.M.; funding acquisition, J.M. All authors have read and agreed to the published version of the manuscript.

Funding

This research was financially supported by the German Federal Ministry for Economic Affairs and Energy (BMWi)—Project number KF2607404LT4.

Institutional Review Board Statement

Not applicable.

Informed Consent Statement

Not applicable.

Data Availability Statement

Not applicable.

Acknowledgments

The authors are grateful to the technical team of the Institute of Agriculture Engineering for their assistance in the construction of components required for the experimental investigation. Special gratitude goes to Simon Munder and Sabine Nugent for their contributions to sensor development and language editing, respectively. Furthermore, authors are thankful to the editors and reviewers for their constructive comments, which helped to improve the quality and scientific substance of manuscript.

Conflicts of Interest

The authors declare no conflict of interest.

Nomenclature

a, cEmpirical constants, -
AKernel surface area, mm2
daKernel arithmetic diameter, mm
deKernel equivalent diameter, mm
dgKernel geometric diameter, mm
d.b.Dry basis, -
fFan frequency, Hz
HbGrain bulk depth, mm
LKernel length, mm
kProduct factor, -
Air mass flow rate, kg·h−1
mKernel unit mass, g
mcAggregate mass of kernels in the container, g
mgrMass of kernels soaked in toluene, g
mfl,tolMass of pycnometer flask filled with toluene, g
mgr,fl,tolMass of kernels, toluene solution and pycnometer flask, g
nNumber of observations, -
MAPEMean absolute percentage error, %
pProbability level, -
QAir volume flow rate, m3·h1
R2Coefficient of determination, -
RaKernel aspect ratio, -
ReReynolds number, -
RMSERoot mean square error, Pa
tElapsed storage time, h
TaAir temperature, °C
TKernel thickness, mm
vaAirflow velocity, m·s−1
VKernel unit volume, mm3
VbTest bin volume, m3
VcContainer volume, m3
VpPycnometer volume, mm3
WKernel width, mm
XMoisture content, -
x,yIndependent and dependent variables in linear models, -
xaAir absolute humidity, g·kg1
ΔxaAir saturation deficit, g·kg−1
PPressure, Pa
ΔPPressure drop, Pa
ΔPobsObserved pressure drop, Pa
ΔPpredPredicted pressure drop, Pa
εBulk pore volume, -
ε0Default pore volume, -
εminPore volume at the highest bulk depth, -
ζFriction factor, -
ϑKernel sphericity, %
φaAir relative humidity, %
ωFan rotational speed, min−1
μaAir dynamic viscosity, kg·m1·s1
ρaAir density, kg·m−3
ρbBulk density, kg·m−3
ρb0Default bulk density, kg·m−3
ρsSolid density, kg·m−3
ρtolToluene density, kg·m−3

Appendix A

Table A1. Variations of air conditions in the pore volume of the grain bulk during pressure drop experiments.
Storage Time
t, h
Moisture
Content
X, kg·kg−1 d.b.
Temperature
T, °C
Relative
Humidity
φa, %
Absolute
Humidity
xa, g·kg−1
Saturation
Deficit
Δxa, g·kg−1
Viscosity
μa × 10−5, kg·m−1·s−1
Density
ρa, kg·m−3
10.123 ± 0.00117.18 ± 0.0939.83 ± 0.694.84 ± 0.072.85 ± 0.041.80 ± 0.001.22 ± 0.00
65-15.02 ± 0.1039.54 ± 0.194.23 ± 0.022.65 ± 0.041.79 ± 0.001.23 ± 0.00
164-16.30 ± 0.0240.87 ± 0.024.70 ± 0.012.72 ± 0.001.80 ± 0.001.22 ± 0.00
2360.122 ± 0.00112.29 ± 0.0234.04 ± 0.023.01 ± 0.012.66 ± 0.001.78 ± 0.001.24 ± 0.00

References

  1. FAO. Food and Agriculture Data. Available online: http://www.fao.org/faostat/en/#data (accessed on 28 June 2022).
  2. Awika, J.M. Major cereal grains production and use around the world. In Advances in Cereal Science: Implications to Food Processing and Health Promotion; ACS Publications: Washington, DC, USA, 2011; pp. 1–13. [Google Scholar]
  3. Ziegler, V.; Paraginski, R.T.; Ferreira, C.D. Grain storage systems and effects of moisture, temperature and time on grain quality—A review. J. Stored Prod. Res. 2021, 91, 101770. [Google Scholar] [CrossRef]
  4. Anukiruthika, T.; Jian, F.; Jayas, D.S. Movement and behavioral response of stored product insects under stored grain environments—A review. J. Stored Prod. Res. 2021, 90, 101752. [Google Scholar] [CrossRef]
  5. Collins, D.A. A review on the factors affecting mite growth in stored grain commodities. Exp. Appl. Acarol. 2012, 56, 191–208. [Google Scholar] [CrossRef] [PubMed]
  6. Mesterházy, Á.; Oláh, J.; Popp, J. Losses in the Grain Supply Chain: Causes and Solutions. Sustainability 2020, 12, 2342. [Google Scholar] [CrossRef]
  7. Navarro, S.; Noyes, R.T. The Mechanics and Physics of Modern Grain Aeration Management; CRC Press: Boca Raton, FL, USA, 2001. [Google Scholar]
  8. Labuza, T.P. Sorption phenomena in foods: Theoretical and practical aspects. In Theory, Determination and Control of Physical Properties of Food Materials; Springer: Berlin, Germany, 1975; pp. 197–219. [Google Scholar]
  9. Lenovich, L.M. Survival and death of microorganisms as influenced by water activity. In Water Activity: Theory and Applications to Food, 1st ed.; Routledge: Oxfordshire, UK, 2017; pp. 119–136. [Google Scholar]
  10. Chakraverty, A.; Singh, R.P. Grain storage. In Postharvest Technology and Food Process Engineering; CRC Press: Boca Raton, FL, USA, 2014; pp. 131–157. [Google Scholar]
  11. Brooker, D.B.; Bakker-Arkema, F.W.; Hall, C.W. Drying and Storage of Grains and Oilseeds, 1st ed.; Springer Science & Business Media: New York, NY, USA, 1992. [Google Scholar]
  12. Giner, S.A.; Denisienia, E. Pressure drop through wheat as affected by air velocity, moisture content and fines. J. Agric. Eng. Res. 1996, 63, 73–85. [Google Scholar] [CrossRef]
  13. Kashaninejad, M.; Maghsoudlou, Y.; Khomeiri, M.; Tabil, L. Resistance to airflow through bulk pistachio nuts (Kalleghochi variety) as affected by moisture content, airflow rate, bed depth and fill method. Powder Technol. 2010, 203, 359–364. [Google Scholar] [CrossRef]
  14. Olatunde, G.; Atungulu, G.G.; Sadaka, S. CFD modeling of air flow distribution in rice bin storage system with different grain mass configurations. Biosyst. Eng. 2016, 151, 286–297. [Google Scholar] [CrossRef]
  15. Neethirajan, S.; Karunakaran, C.; Jayas, D.S.; White, N.D.G. X-ray Computed Tomography Image Analysis to explain the Airflow Resistance Differences in Grain Bulks. Biosyst. Eng. 2006, 94, 545–555. [Google Scholar] [CrossRef]
  16. Alagusundaram, K.; Jayas, D. Airflow resistance of grains and oilseeds. Postharvest News Inf. 1990, 1, 279–283. [Google Scholar] [CrossRef]
  17. Shedd, C.K. Resistance of grains and seeds to air flow. Agric. Eng. 1953, 34, 616–619. [Google Scholar]
  18. Hukill, W.; Ives, N. Radial airflow resistance of grain. Agric. Eng. 1955, 36, 332–335. [Google Scholar]
  19. Gunasekaran, S.; Jackson, C.Y. Resistance to airflow of grain sorghum. Trans. ASAE 1988, 31, 1237–1240. [Google Scholar] [CrossRef]
  20. Nimkar, P.M.; Chattopadhyay, P.K. PH—Postharvest Technology: Airflow Resistance of Green Gram. Biosyst. Eng. 2002, 82, 407–414. [Google Scholar] [CrossRef]
  21. Agullo, J.O.; Marenya, M.O. Airflow Resistance of Parchment Arabica Coffee. Biosyst. Eng. 2005, 91, 149–156. [Google Scholar] [CrossRef]
  22. Hunter, A.J. Pressure difference across an aerated seed bulk for some common duct and store cross-sections. J. Agric. Eng. Res. 1983, 28, 437–450. [Google Scholar] [CrossRef]
  23. Haque, E.; Ahmed, Y.N.; Deyoe, C.W. Static pressure drop in a fixed bed of grain as affected by grain moisture content. Trans. ASAE 1982, 25, 1095–1098. [Google Scholar] [CrossRef]
  24. Ergun, S. Fluid Flow Through Packed Columns. Chem. Eng. Prog. 1952, 48, 89–94. [Google Scholar]
  25. Carman, P.C. Fluid flow through granular beds. Chem. Eng. Res. Des. 1997, 75, S32–S48. [Google Scholar] [CrossRef]
  26. Burke, S.P.; Plummer, W.B. Gas flow through packed columns. Ind. Eng. Chem. 1928, 20, 1196–1200. [Google Scholar] [CrossRef]
  27. Patterson, R.J. Airflow-Pressure Drop Characteristics of Packed Beds of Biological Particles; Michigan State University: East Lansing, MI, USA, 1969. [Google Scholar]
  28. Li, W.; Sokhansanj, S. Generalized equation for airflow resistance of bulk grains with variable density, moisture content and fines. Dry. Technol. 1994, 12, 649–667. [Google Scholar] [CrossRef]
  29. Bern, C.J.; Charity, L.F. Airflow resistance characteristics of corn as influenced by bulk density. ASAE Pap. 1975, 48, 1137–1145. [Google Scholar]
  30. Leva, M. Fluidization; McGraw-Hill: New York, NY, USA, 1959. [Google Scholar]
  31. Matthies, H.J.; Petersen, H. New data for calculating the resistance to air flow of stored granular materials. Trans. ASAE 1974, 17, 1144–1149. [Google Scholar] [CrossRef]
  32. Kumar, A.; Muir, W.E. Airflow resistance of wheat and barley affected by airflow direction, filling method and dockage. Trans. ASAE 1986, 29, 1423–1426. [Google Scholar] [CrossRef]
  33. Turner, A.P.; Montross, M.D.; McNeill, S.G.; Sama, M.P.; Casada, M.C.; Boac, J.M.; Bhadra, R.E.; Maghirang, R.G.; Thompson, S.A. Modeling the compressibility behavior of hard red wheat varieties. Trans. ASABE 2016, 59, 1029–1038. [Google Scholar] [CrossRef] [Green Version]
  34. Thompson, S.; McNeill, S.; Ross, I.; Bridges, T. Packing factors of whole grains in storage structures. Appl. Eng. Agric. 1987, 3, 215–221. [Google Scholar] [CrossRef]
  35. Cheng, X.; Zhang, Q.; Yan, X.; Shi, C. Compressibility and equivalent bulk modulus of shelled corn. Biosyst. Eng. 2015, 140, 91–97. [Google Scholar] [CrossRef]
  36. Rocha, J.C.d.; Pohndorf, R.S.; Meneghetti, V.L.; Oliveira, M.d.; Elias, M.C. Effects of mass compaction on airflow resistance through paddy rice grains. Biosyst. Eng. 2020, 194, 28–39. [Google Scholar] [CrossRef]
  37. Molenda, M.; Montross, M.D.; McNeill, S.G.; Horabik, J. Airflow resistance of seeds at different bulk densities using Ergun’s equation. Trans. ASAE 2005, 48, 1137–1145. [Google Scholar] [CrossRef]
  38. Łukaszuk, J.; Molenda, M.; Horabik, J.; Szot, B.; Montross, M.D. Airflow resistance of wheat bedding as influenced by the filling method. Res. Agric. Eng. 2008, 54, 50. [Google Scholar] [CrossRef]
  39. AOAC. Official Methods of Analysis, 16th ed.; Association of Analytical Chemist: Arlington, VA, USA, 1998. [Google Scholar]
  40. Karaj, S.; Müller, J. Determination of physical, mechanical and chemical properties of seeds and kernels of Jatropha curcas L. Ind. Crops Prod. 2010, 32, 129–138. [Google Scholar] [CrossRef]
  41. Sirisomboon, P.; Kitchaiya, P.; Pholpho, T.; Mahuttanyavanitch, W. Physical and mechanical properties of Jatropha curcas L. fruits, nuts and kernels. Biosyst. Eng. 2007, 97, 201–207. [Google Scholar] [CrossRef]
  42. Mohsenin, N.N. Physical Properties of Plant and Animal Materials; Gordon & Breach Science Publishers Ltd.: Philadelphia, PA, USA, 1968. [Google Scholar]
  43. ASAE. ASAE D272: Resistance to airflow of grains, seeds, other agricultural products, and perforated metal sheets. Am. Soc. Agric. Biol. Eng. 2003, 3, 569–576. [Google Scholar]
  44. Miller, R.W. Flow Measurement Engineering Handbook, 3rd ed.; McGraw-Hill: New York, NY, USA, 1983. [Google Scholar]
  45. Mühlbauer, W. Handbuch der Getreidetrocknung: Grundlagen und Verfahren; Agrimedia: Clenze, Germany, 2009. [Google Scholar]
  46. Tabatabaeefar, A. Moisture-dependent physical properties of wheat. Int. Agrophys. 2003, 17, 207–211. [Google Scholar]
  47. Karimi, M.; Kheiralipour, K.; Tabatabaeefar, A.; Khoubakht, G.; Naderi, M.; Heidarbeigi, K. The effect of moisture content on physical properties of wheat. Pak. J. Nutr. 2009, 8, 90–95. [Google Scholar] [CrossRef]
  48. Molenda, M.; Horabik, J. Mechanical Properties of Granular Agro-Materials and Food Powders for Industrial Practice. In Part I: Characterization of Mechanical Properties of Particulate Solids for Storage and Handling; Institute of Agrophysics Polish Academy of Sciences: Lublin, Poland, 2005; p. 145. [Google Scholar]
  49. Wang, D.; Dowell, F.E.; Lacey, R.E. Single wheat kernel size effects on near-infrared reflectance spectra and color classification. Cereal Chem. 1999, 76, 34–37. [Google Scholar] [CrossRef]
  50. Nelson, S. Moisture-Dependent Kernel- and Bulk-Density Relationships for Wheat and Corn. Trans. ASAE 1980, 23, 139–0143. [Google Scholar] [CrossRef]
  51. Petingco, M.C.; Casada, M.E.; Maghirang, R.G.; Thompson, S.A.; McNeill, S.G.; Montross, M.D.; Turner, A.P. Influence of kernel shape and size on the packing ratio and compressibility of hard red winter wheat. Trans. ASABE 2018, 61, 1437–1448. [Google Scholar] [CrossRef]
  52. Markowski, M.; Żuk-Gołaszewska, K.; Kwiatkowski, D. Influence of variety on selected physical and mechanical properties of wheat. Ind. Crops Prod. 2013, 47, 113–117. [Google Scholar] [CrossRef]
  53. Gürsoy, S.; Güzel, E. Determination of physical properties of some agricultural grains. Res. J. Appl. Sci. Eng. Technol. 2010, 2, 492–498. [Google Scholar]
  54. Jayas, D.S.; Cenkowski, S. Grain Property Values and Their Measurement. In Handbook of Industrial Drying, 3rd ed.; CRC Press: Boca Raton, FL, USA, 2006. [Google Scholar]
  55. Muir, W.; Sinha, R. Physical properties of cereal and oilseed cultivars grown in western Canada. Can. Agric. Eng. 1988, 30, 51–55. [Google Scholar]
  56. Kraszewski, A.W. Wheat moisture content and bulk density determination by microwave parameters measurement. Can. Agric. Eng. 1992, 34, 327–335. [Google Scholar]
  57. Petingco, M.C.; Casada, M.E.; Maghirang, R.G.; Thompson, S.A.; Turner, A.P.; McNeill, S.G.; Montross, M. Discrete Element Method Simulation of Wheat Bulk Density as Affected by Grain Drop Height and Kernel Size Distribution. J. ASABE 2022, 65, 555–566. [Google Scholar] [CrossRef]
  58. Stephens, L.E.; Foster, G.H. Grain Bulk Properties as Affected by Mechanical Grain Spreaders. Trans. ASAE 1976, 19, 354–0358. [Google Scholar] [CrossRef]
  59. White, F.M.; Majdalani, J. Viscous Fluid Flow, 2nd ed.; McGraw-Hill: New York, NY, USA, 2006. [Google Scholar]
  60. Bakker-Arkema, F.W.; Patterson, R.J.; Bickert, W.G. Static pressure-airflow relationships in packed beds of granular biological materials such as cherry pits. Trans. ASAE 1969, 12, 134–0136. [Google Scholar] [CrossRef]
  61. Cheng, X.; Zhang, Q.; Shi, C.; Yan, X. Model for the prediction of grain density and pressure distribution in hopper-bottom silos. Biosyst. Eng. 2017, 163, 159–166. [Google Scholar] [CrossRef]
  62. Guillard, F.; Golshan, P.; Shen, L.; Valdes, J.R.; Einav, I. Dynamic patterns of compaction in brittle porous media. Nat. Phys. 2015, 11, 835–838. [Google Scholar] [CrossRef]
  63. Grundas, S.; Szot, B.; Wozniak, W. Variability of the porosity of cereal grain layer under the influence of static loading. Zesz. Probl. Postępów Nauk. Rol. 1978, 203, 33–40. [Google Scholar]
  64. Jayas, D.S.; Sokhansanj, S.; Moysey, E.B.; Barber, E.M. Airflow resistance of canola (rapeseed). Trans. ASAE 1987, 30, 1484–1488. [Google Scholar] [CrossRef]
  65. Kay, R.L.; Bern, C.J.; Hurburgh, C.R., Jr. Horizontal and Vertical Airflow Resistance of Shelled Corn at Various Bulk Densities. Trans. ASAE 1989, 32, 733–0736. [Google Scholar] [CrossRef]
  66. Siebenmorgen, T.J.; Jindal, V.K. Airflow resistance of rough rice as affected by moisture content, fines concentration and bulk density. Trans. ASAE 1987, 30, 1138–1143. [Google Scholar] [CrossRef] [Green Version]
  67. Haque, E. Void fraction as a function of depth and pressure drops of packed beds of porous media formed by granular materials. Trans. ASABE 2011, 54, 2239–2243. [Google Scholar] [CrossRef]
  68. Khatchatourian, O.A.; Savicki, D.L. Mathematical Modelling of Airflow in an Aerated Soya Bean Store under Non-uniform Conditions. Biosyst. Eng. 2004, 88, 201–211. [Google Scholar] [CrossRef]
  69. Gao, M.; Cheng, X.; Du, X. Simulation of bulk density distribution of wheat in silos by finite element analysis. J. Stored Prod. Res. 2018, 77, 1–8. [Google Scholar] [CrossRef]
Figure 1. Test bench comprising (1) frequency inverter, (2) centrifugal fan, (3) safety valve, (4) air duct, (5) flow sensor, (6) data logger, (7) laboratory computer, (8) airflow straightener, (9) test bin, (10) wheat bulk, (11) sensor grid and (12) pressure taps. P denotes the equalized pressure of six pressure taps, whereas P1.0, P2.0, P3.0 and P3.4 represent the pressure data at bulk depths of 1.0, 2.0, 3.0 and 3.4 m, respectively.
Applsci 12 08909 g001
Figure 2. Pore volume ε vs. bulk depth Hb for product factor k of 2.00, 2.10, 2.20 and 2.73. Horizontal dashed line refers to the default pore volume ε0 at bulk depth Hb of 0.1 m. Solid lines represent linear model fitting; dashed lines represent extrapolations beyond the dataset utilized for fitting.
Applsci 12 08909 g002
Figure 3. Experimental and predicted pressure drop ΔP vs. airflow velocity va at bulk depth Hb of 1.0, 2.0, 3.0 and 3.4 m and storage time t of 1 h storage time fitted with (a) default pore volume ε0 of 0.421 and (c) adjusted pore volume ε between 0.391 and 0.413. Markers represent the experimental data points (±SD), dashed-dotted lines indicate fitting with the Matthies and Petersen model; Predicted pressure drop ΔPpred vs. observed pressure drop ΔPobs for (b) default and (d) variable pore volume.
Applsci 12 08909 g003
Figure 4. Variation of pore volume ε with bulk depth Hb and storage time t. The grey plane indicates the default pore volume ε0.
Applsci 12 08909 g004
Figure 5. Pressure drop ΔP vs. airflow velocity va and storage time t predicted with the Matthies and Petersen model at bulk depths Hb of 1.0, 2.0, 3.0, 3.4 m (ad).
Applsci 12 08909 g005
Figure 6. (a) Predicted pressure drop ΔPpred vs. observed pressure drop ΔPobs from pooled data of bulk depth Hb of 1.0, 2.0, 3.0, 3.4 m and storage times t of 1, 65, 164, 236 h; (b) Frequency distribution of residuals. Dashed-dotted line indicates the logistic probability distribution of residuals.
Applsci 12 08909 g006
Figure 7. Standardized regression coefficients from sensitivity analysis including airflow velocity va, bulk depth Hb, pore volume ε, particle diameter de, air density ρa and dynamic air viscosity μa.
Applsci 12 08909 g007
Table 1. Models for describing the pressure drop ΔP as a function of airflow velocity va in grain bulks.
SourceYearModel TypeApplicabilityComments
Velocity va, m·s−1Type of Grains
Ergun [24]1952Semi-empirical≥0.01Maize, rice,
sorghum, wheat
Covers both laminar and turbulent flow; suitable for spherical particles
Shedd [17]1953Empirical0.005–0.30Barley, maize, oat,
rice, sorghum,
soybean, wheat
Appropriate for low airflow velocities and uncompacted grain bulk; outperformance at high velocities
Hukill and Ives [18]1955Empirical0.0003–1.0Barley, maize, oat, rice, sorghum,
soybean, wheat
Encompasses a wide range of velocities; limited to specific grain and air conditions
Leva [30]1959Semi-empirical≥0.0001Barley, maize, oat,
wheat
Tedious to solve; includes a friction-factor for the state-of-flow and a shape factor for non-spherical shape of grains
Patterson [27]1969Semi-empirical0.05–0.61Beans, maizeAdjusted model for grains with different size distributions and shape irregularities
Matthies and Petersen [31]1974Semi-empirical0.02–0.61Barley, maize,
rice, rye, wheat
Established for high bulks; considers several influencing parameters
Bern and Charity [29]1975Semi-empirical0.015–0.60MaizeEasy to solve; considers solely pore volume and airflow velocity; limited to maize
Haque, Ahmed and Deyoe [23]1982Empirical0.01–0.22Maize, sorghum, wheatIncludes the effect of moisture content on the calculation basis
Hunter [22]1983Empirical0.006–0.21Barley, maize, oat,
rice, sorghum,
soybean, wheat
Better fit compared to Shedd; considers the non-uniform nature of grain bulks; lacks insight into parameters affecting airflow resistance
Li and Sokhansanj [28]1992Semi-empirical0.0001–0.90Barley, maize,
oat, wheat
Similar to Ergun; suitable for grains; established for a wide range of airflow velocities
Table 2. Operating settings utilized for the airflow resistance experiments.
FrequencyRotational SpeedAirflow VelocityMass Flow RateVolume Flow Rate
f, Hzω, min−1va, m·s−1, kg·h−1Q, m3·h−1
10.05780.011 ± 0.0008.57 ± 0.367.00 ± 0.29
15.08670.021 ± 0.00120.15 ± 0.9616.46 ± 0.79
20.011560.037 ± 0.00432.93 ± 3.4026.90 ± 2.78
25.014450.056 ± 0.00547.48 ± 4.2538.79 ± 3.47
30.017340.074 ± 0.00661.37 ± 4.6650.14 ± 3.81
35.020230.092 ± 0.00674.99 ± 5.0461.27 ± 4.12
40.023120.109 ± 0.00888.14 ± 6.2872.01 ± 5.14
45.026010.125 ± 0.008100.78 ± 6.6182.34 ± 5.40
50.028900.141 ± 0.010113.16 ± 8.3792.45 ± 6.84
Table 3. Geometric and gravimetric properties of wheat (Triticum aestivum L.) cv. ‘Pionier’.
PropertiesUnitValue
Length Lmm6.87 ± 0.25
Width Wmm3.75 ± 0.22
Thickness Tmm3.11 ± 0.17
Arithmetic diameter damm4.57 ± 0.15
Geometric diameter dgmm4.30 ± 0.15
Equivalent diameter demm4.49 ± 0.14
Aspect ratio Ra-0.55 ± 0.03
Sphericity ϑ%62.72 ± 1.94
Surface area Amm264.06 ± 5.42
Volume Vmm341.95 ± 4.34
Unit mass m g0.06 ± 0.01
Bulk density ρb0kg·m−3782.46 ± 6.68
Solid density ρskg·m−31351.40 ± 4.62
Pore volume ε0-0.421 ± 0.07
Table 4. Linear models for describing the relationship between the pore volume ε and bulk depth Hb at different product factor k and coefficient of determination R2.
Product Factor k, -Mathematical ModelR2, -
2.00y = −8.027 × 10⁻³ x + 0.3900.986
2.10y = −8.141 × 10⁻³ x + 0.3950.986
2.20y = −8.215 × 10⁻³ x + 0.4000.985
2.73y = −8.693 × 10⁻³ x + 0.4220.986
Table 5. Pore volume ε and bulk density ρb for different storage time t and bulk depth Hb as well as statistical indicators (R2, RMSE, MAPE) observed from fitting the experimental data with Matthies and Peterson model.
Storage Time
t, h
Bulk Depth
Hb, m
Pore Volume
ε, -
Bulk Density
ρb, kg·m−3
Statistical Indicators
R2, -RMSE, PaMAPE, %
1.01.00.413793.000.99515.188.21
2.00.404805.700.99533.288.32
3.00.397814.620.99552.397.19
3.40.391822.600.99661.937.62
65.01.00.406802.330.98329.1914.75
2.00.400811.380.98362.7415.12
3.00.391822.460.983100.6514.40
3.40.385830.980.982123.7713.97
164.01.00.400810.980.98726.5816.16
2.00.395817.730.98754.1614.44
3.00.385831.110.98789.3013.28
3.40.379838.950.987106.9113.66
236.01.00.390825.030.99321.0414.61
2.00.383833.270.99345.2415.11
3.00.375844.080.99368.3510.66
3.40.370851.650.99384.1712.75
Table 6. Mathematical models for describing pore volume ε as function of bulk height Hb at different storage times t.
Storage Time t, hMathematical ModelR2, -
1 ε = ε 0 ( ε 0 ε m i n ) · ( 1 + 0.292 H b 1.026 ) 0.987
65 ε = ε 0 ( ε 0 ε m i n ) · ( 1 + 0.238 H b 0.851 ) 0.977
164 ε = ε 0 ( ε 0 ε m i n ) · ( 1 + 0.205 H b 0.733 ) 0.963
236 ε = ε 0 ( ε 0 ε m i n ) · ( 1 + 0.156 H b 0.557 ) 0.980
Publisher’s Note: MDPI stays neutral with regard to jurisdictional claims in published maps and institutional affiliations.