1. Introduction
In recent decades, the addition of short fibers in modern structural concrete has been a preferred option for improving the composite material’s performance under tensile stress states. In relation to plain concrete, steel fiber-reinforced concrete (SFRC) shows not only higher resistance to crack growth, and hence improved resistance to aggressive substance diffusion and increased durability [
1], but also enhanced tensile strength and ductility. Frequent industrial applications of SFRC include high-performance slabs (such as industrial floors, pile-supported foundation rafts and slabs on grade), tunnel linings, refractory structures, silos, containers, impact-proof defence structures and prefabricated—often prestressed—structural components. Because of the increasing trend for the use of SFRC in several types of engineering structures, advanced knowledge and standardisation with respect to this material becomes essential. The increasing interest in design guidance for SFRC is reflected in, besides numerous scientific publications and dedicated conferences, the emerging guidelines and standards, e.g., in the fib Model Code 2010 and 2020 [
2,
3], the German standard DIN 1045 and the associated DAfStb-Richtlinie Stahlfaserbeton [
4], the ACI 544.4 Guide to Design with Fiber-Reinforced Concrete [
5] and, most importantly, in the inclusion of provisions for the design with SFRC in the next generation of Eurocode 2 [
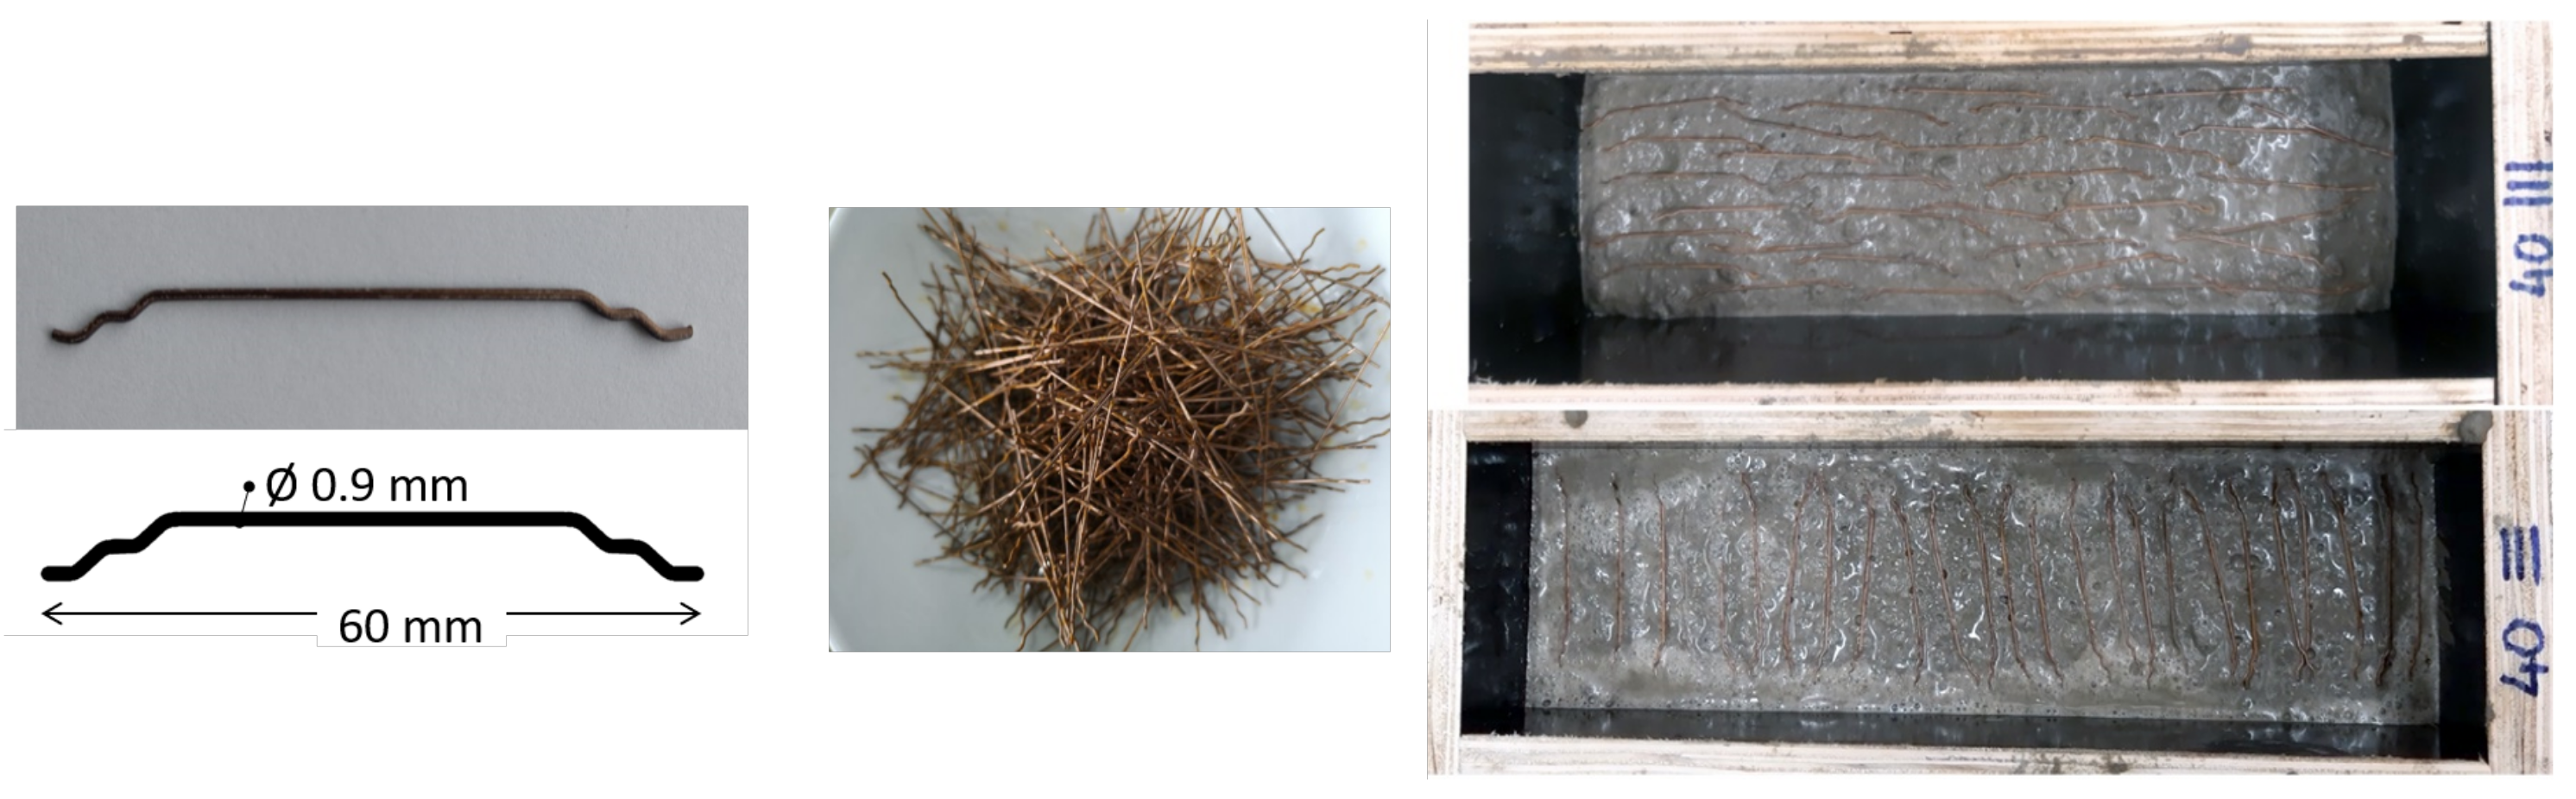
6]. The design with SFRC strongly depends on the properties of the fiber reinforcement, such as the dosage of the fibers (typically expressed in weight of fibers per total volume of concrete), the material (steel, natural, synthetic), the dimensions (length and cross-section) and the shape of the fibers (straight, crimped, hooked, etc.) Furthermore, modern design concepts strongly rely on consistent and predictable overall distribution and orientation characteristics for fibers in the hardened concrete mix, since the amount and inclination of the fibers relative to the internal stress directions of the structural component have been shown to significantly influence its load-bearing performance [
7]. Alignment of fibers in a parallel direction to the prevailing tensile stresses understandably increases the composite matrix’s resistance in tensile rupture, and unfavorable fiber distributions and orientations can even hinder the structural performance of concrete by inducing anisotropy and weak regions in the material.
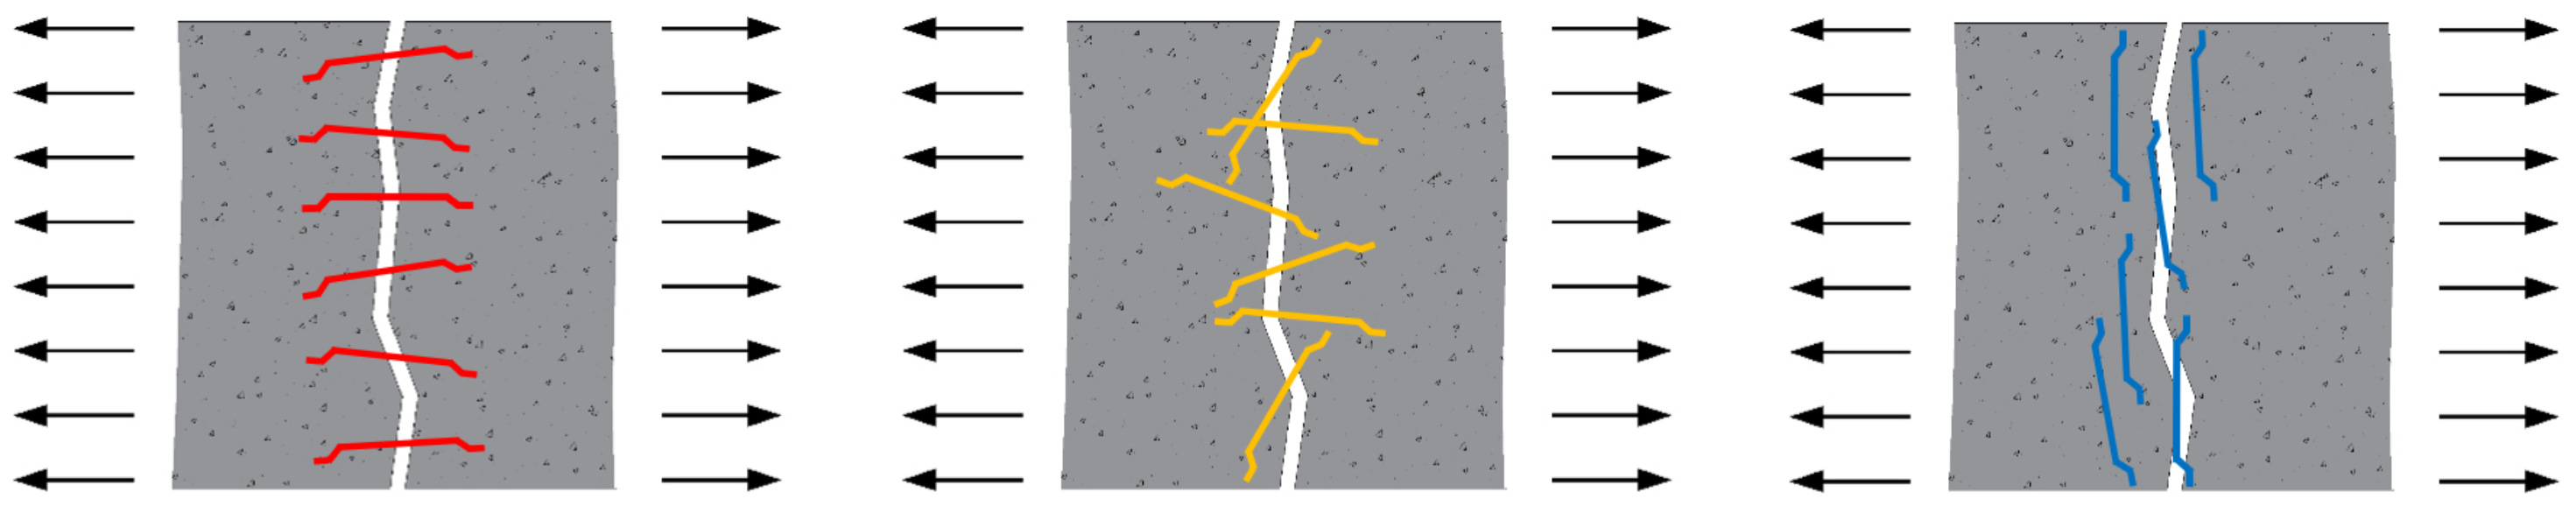
Fiber reinforcement in concrete aims to mainly arrest the concrete crack formation and propagation, which generally results in an increased tensile strength, ductility, and durability of the material. As seen in
Figure 1, this effect is strongly dependent on the location of the fibers within the concrete matrix with respect to the cracking, which in turn forms in a nearly perpendicular direction to the tensile stresses in the material. These stresses are in turn bridged through the fibers intersecting the crack. Obviously, this behavior is strongly influenced by the orientation of fibers in relation to the principal tensile stresses (represented by the black arrows) and the resulting cracking planes. The fibers can, for example, have an orientation parallel to the cracking plane (blue), they can have a random orientation distribution in relation to the stress and crack planes (yellow), or be aligned parallel to the tensile forces and perpendicularly to the crack plane (red). In the last case (red), an optimum utilisation of the fibers’ cross section is expected, and hence the load-displacement response can exhibit substantial ductility and possibly higher strength than plain concrete, which would otherwise fail in a quasi-brittle manner after the crack initiation. The yellow fibers represent the random distribution, which can still exhibit cracking stress retention and, hence, ductility. In the most suboptimal (blue) case, fibers essentially do not contribute to crack bridging, and, hence, concrete tends to behave similarly to a plain unreinforced material. In fact, fibers in this latter orientation can even act as discontinuities in the matrix and accelerate cracking. The fiber distribution and orientation strongly depends on the casting conditions of the fresh mix as well as geometric constraints, and the effect of casting-induced variations in fiber orientations on SFRC structural performance has been shown in previous research [
8,
9,
10,
11]. Some methods to control the fiber alignment in fresh concrete have also been proposed, e.g., by [
12,
13]. The effect of the fiber orientations on the load-bearing performance of concrete is accounted for in current design guidelines [
2,
14] by introducing a so-called fiber orientation factor, which reduces the nominal tensile strength value of fiber reinforced concrete, accounting for favorable and unfavorable fiber alignment effects as well as isotropy.
Given the critical effect that fiber orientation and distribution have on the strength and failure pattern of SFRC structural components, NDT methods for evaluating fiber orientation and distribution are needed. In addition to measurement systems that can be applied in the lab on small samples, e.g., in [
15], in situ testing techniques for large structures need to be developed.
In this study, we focus on the application of methods, which have already shown some value in this regard but have not yet really been systematically applied on samples with defined amounts of fibers in different orientations.
Previous research has indicated that electrical resistivity could be a suitable tool for the measurement of fiber orientations [
16] and fiber-volume fractions in larger SFRC structural components [
17,
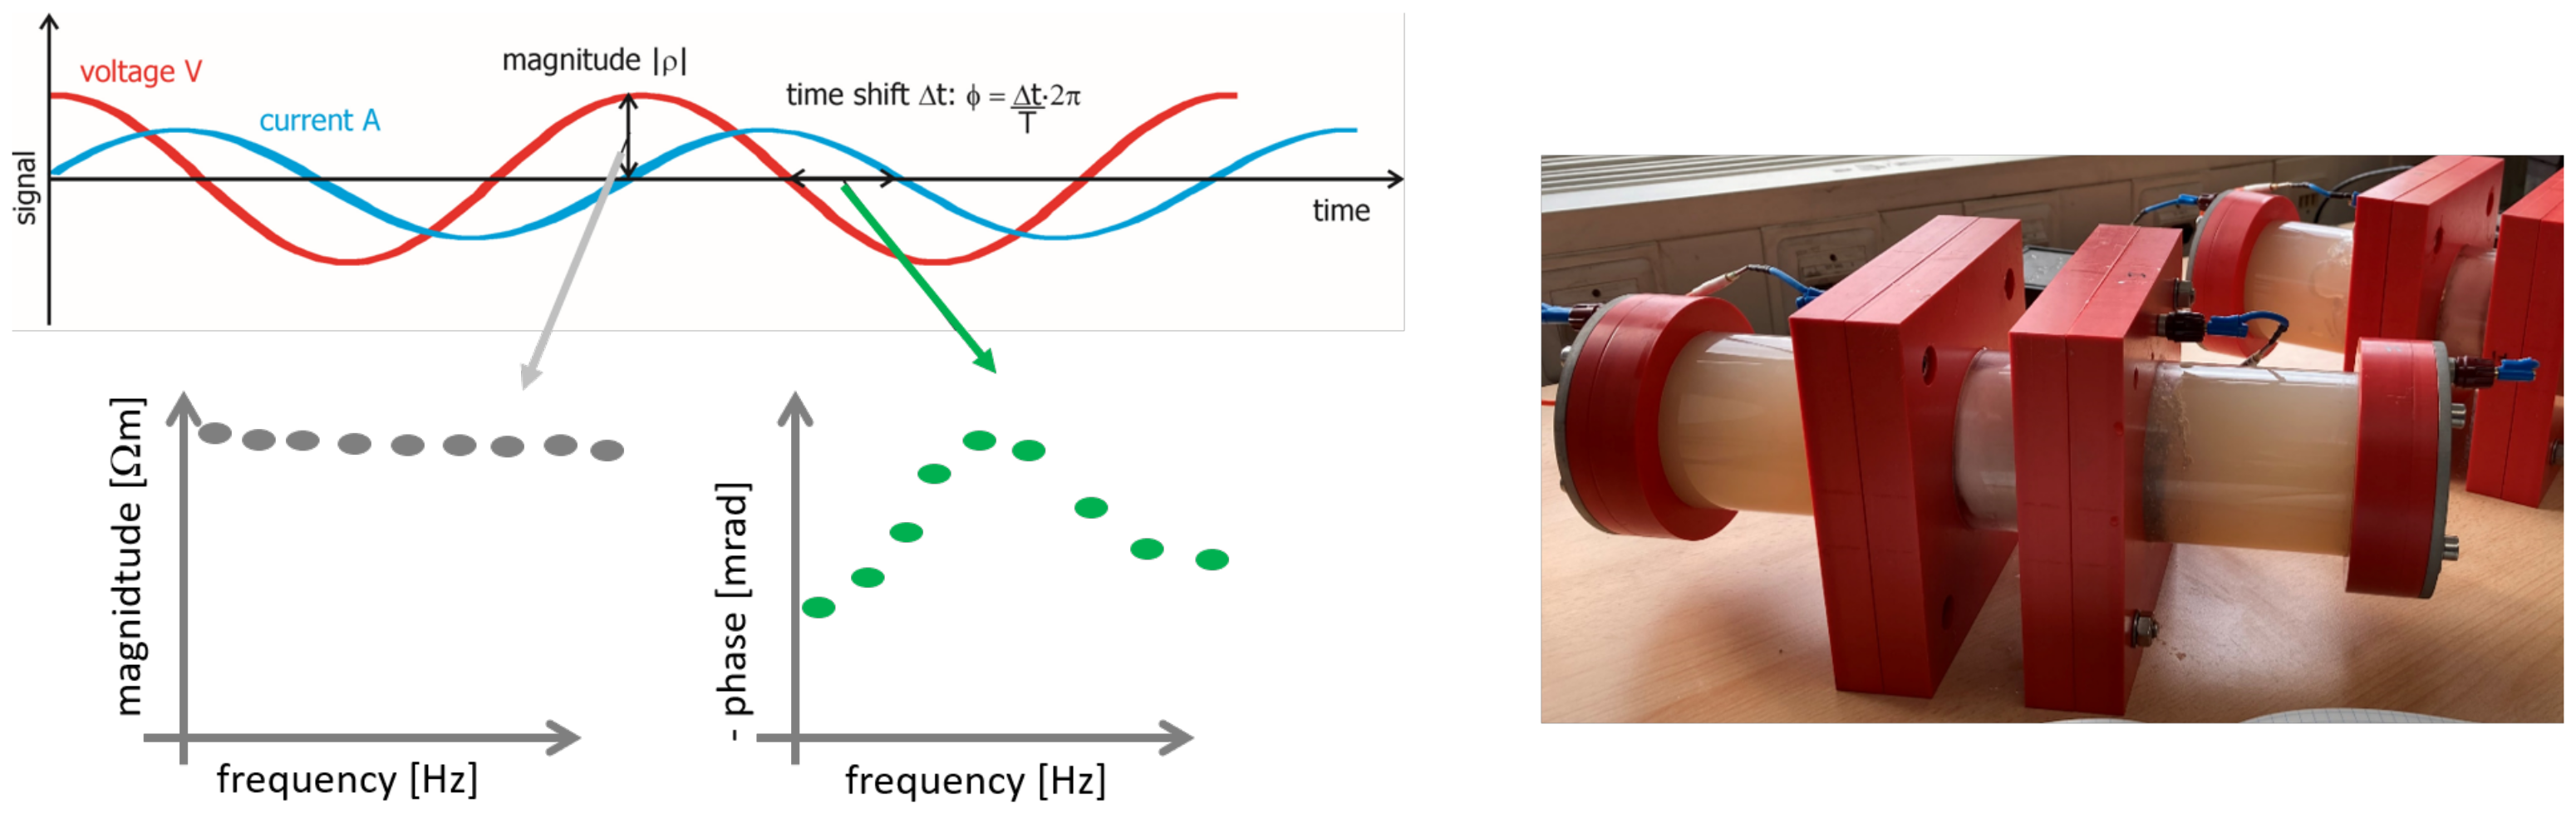
18]. Dry cementitious materials are typically electrical insulators. However, conducting materials added to the concrete, such as steel fibers, significantly decrease its electrical resistivity. Nontheless, further research is still needed in order to precisely define quantitative values of steel fiber distribution and orientation based on electrical resistivity data. The frequency dependency of the electrical resistivity and, hence, the polarizability of SFRC in the low frequency range has not yet been studied. It is conceivable that looking at both the capability of a medium to conduct and to store electrical charges will give deeper insight for material characterization. This can, for example, be done when the spectral induced polarization (SIP) method is used for measuring the electrical properties of a medium.
Recent research has also indicated that ultrasonic techniques may be useful for assessing fiber orientation characteristics [
19]. If such an ultrasonic-based method could be validated, it would hold great potential, since ultrasound measurement techniques are already widespread within the civil engineering community and the capability of measuring ultrasonic properties up to several meters in depth has been successfully demonstrated [
20]. However, further research is still needed to determine the sensitivity and accuracy of ultrasound for fiber orientation measurement, including ultrasound measurement quality and consistency for varying fiber types, structural shapes, and concrete mixtures.
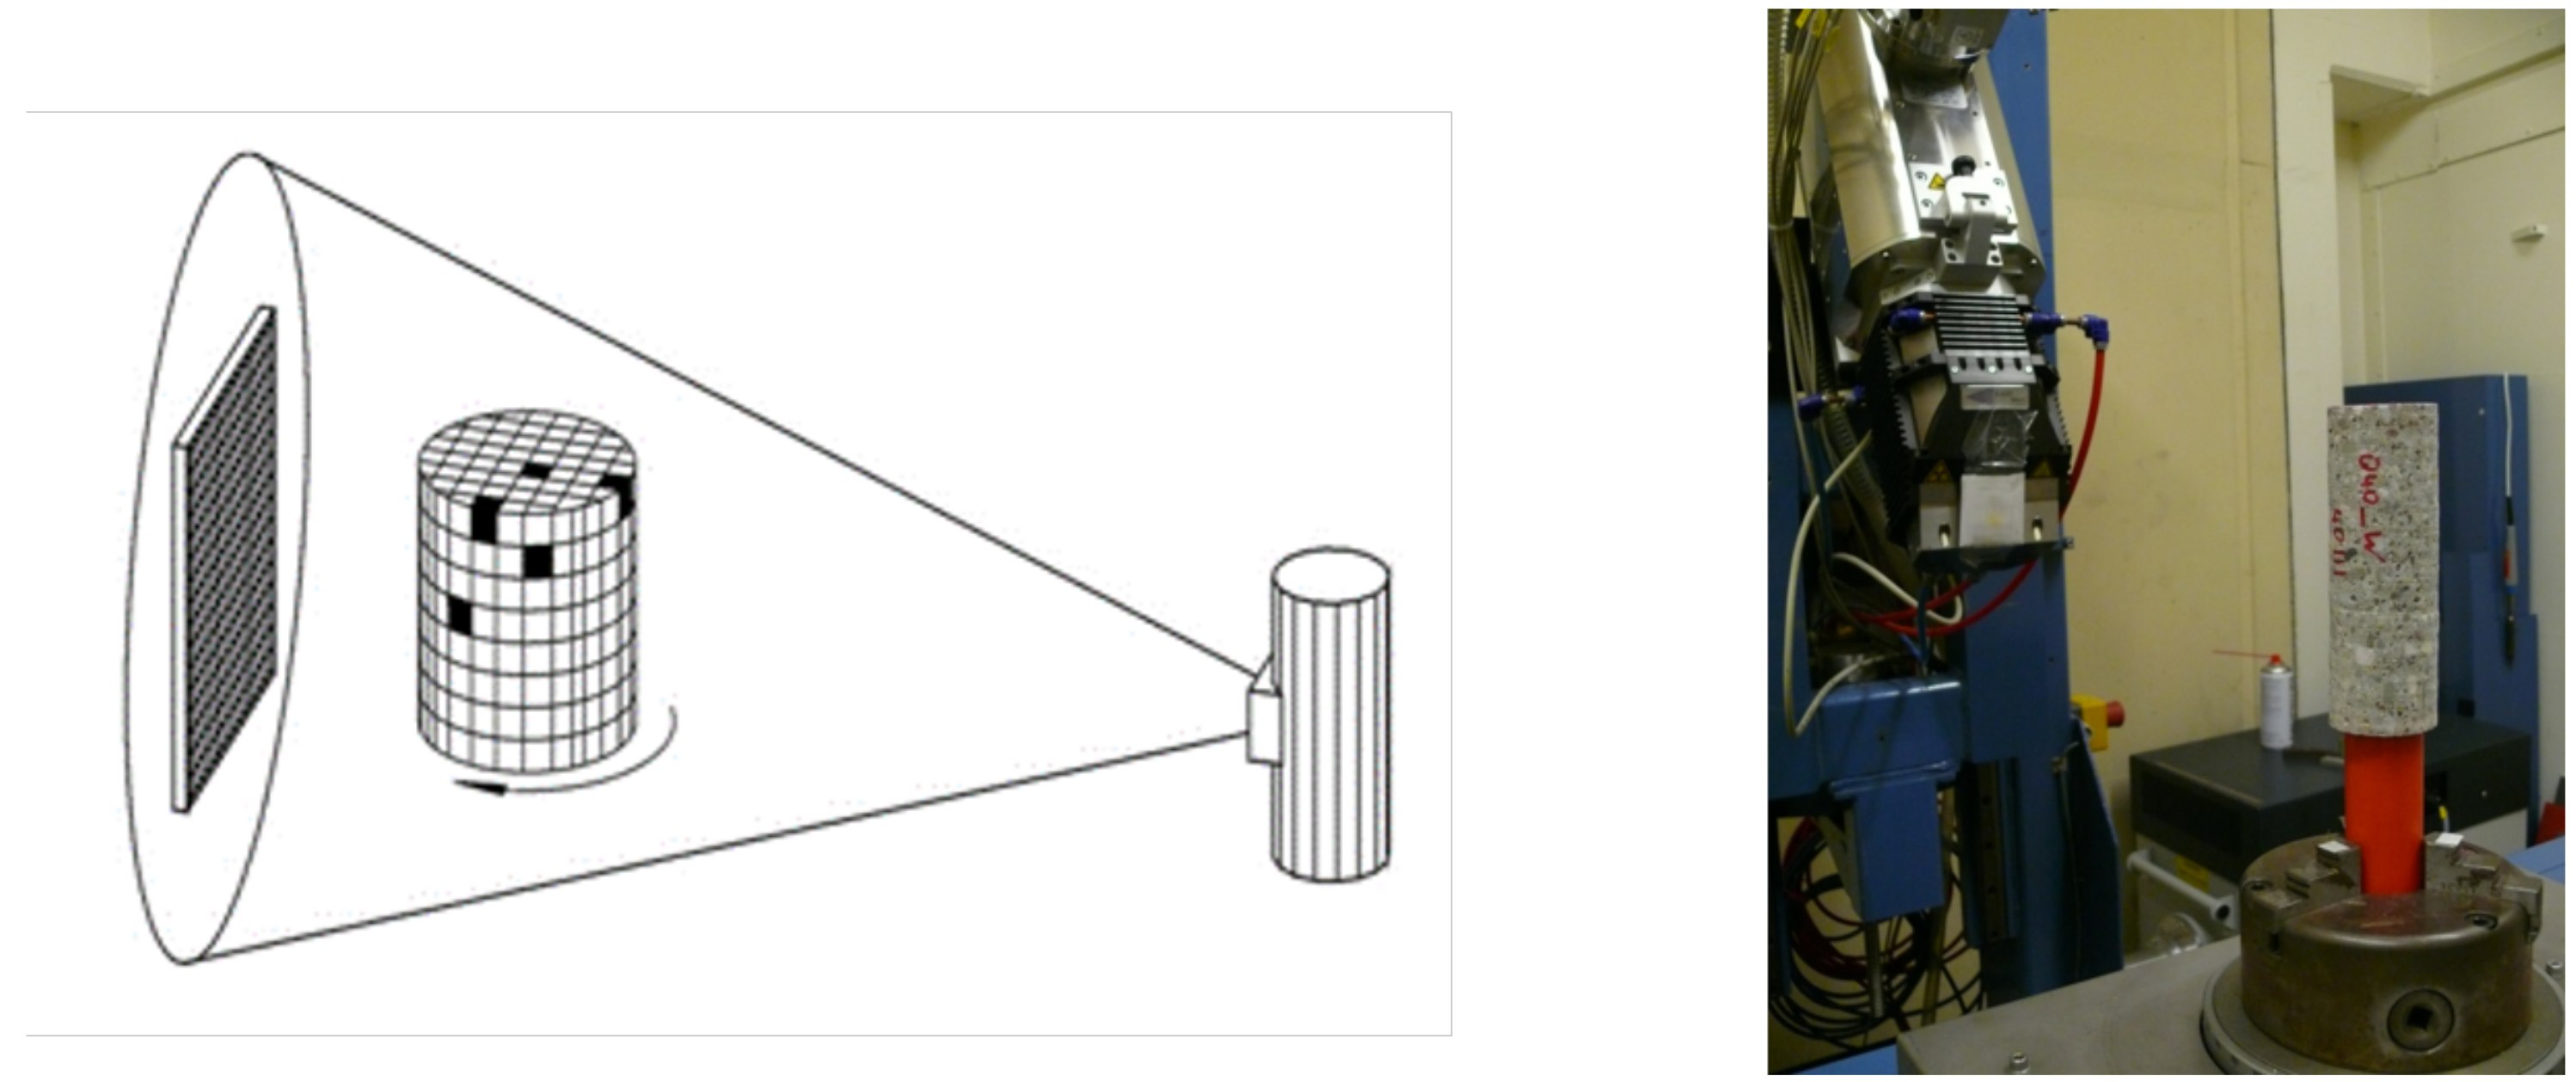
One of the most popular NDT methods for measuring the spatial distribution and directional orientation of fibers in concrete in the lab is X-ray computed tomography (CT) [
21,
22,
23]. When used for analysis of SFRC, this method typically relies on the fact that the fibers have significantly higher X-ray attenuations than the surrounding concrete material. The primary drawbacks of this method are, however, that specimen sizes tend to be limited and that X-ray CT cannot easily be used on-site in actual structures. Regardless, the accuracy of fiber measurement using X-ray CT on small specimens makes it an ideal method for calibrating or validating fiber measurements using other NDT techniques.
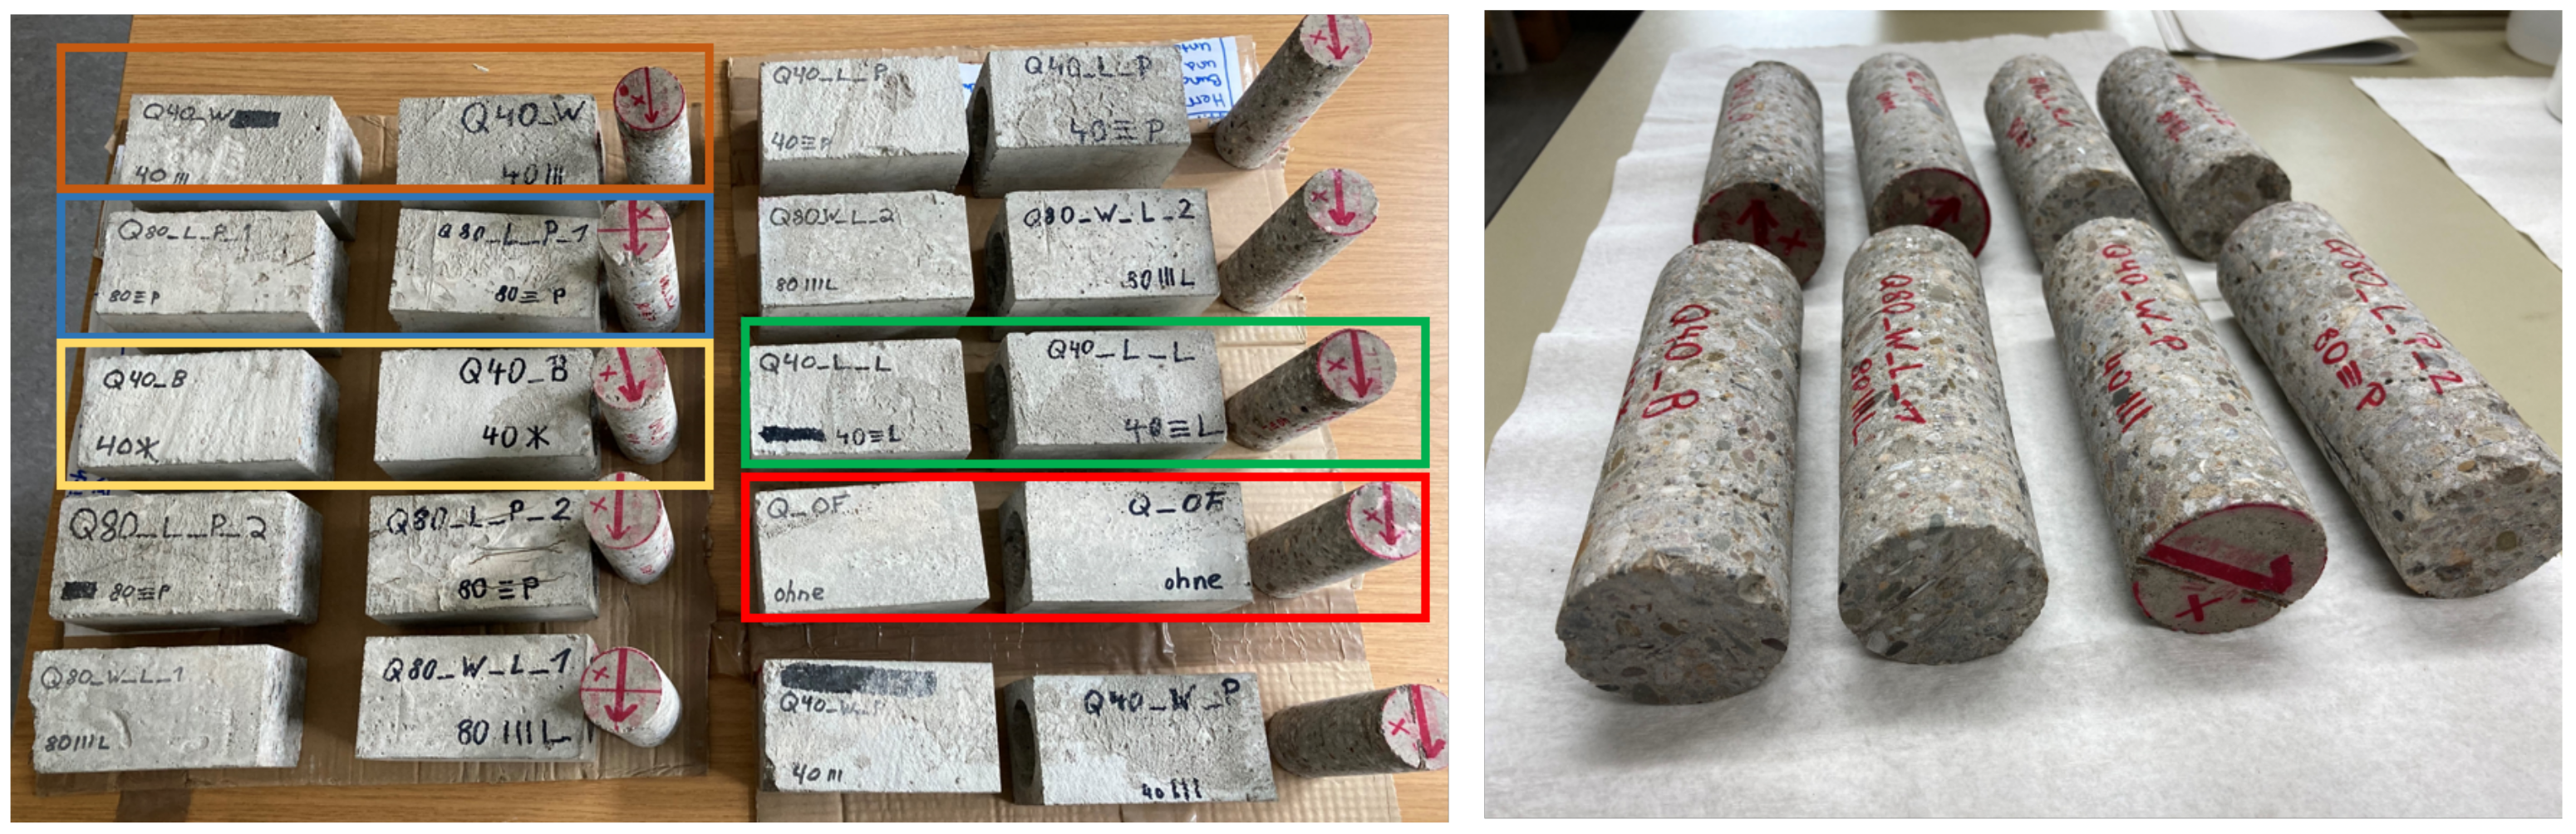
The study described in this paper was undertaken in order to assess the general sensitivity of the ultrasonic and SIP methods for fiber orientation measurement and to identify promising areas for future research. To accomplish these goals, specimens with varying controlled, casting-induced fiber orientation characteristics were fabricated and subsequently measured using ultrasonic and SIP measurement systems. Following these measurements, the specimens were scanned using X-ray CT and fiber orientation analyses of the resulting CT images were carried out. The goal of these CT-based analyses was to provide precise fiber orientation data for validation of the results of the ultrasonic and SIP measurements.
4. Discussion
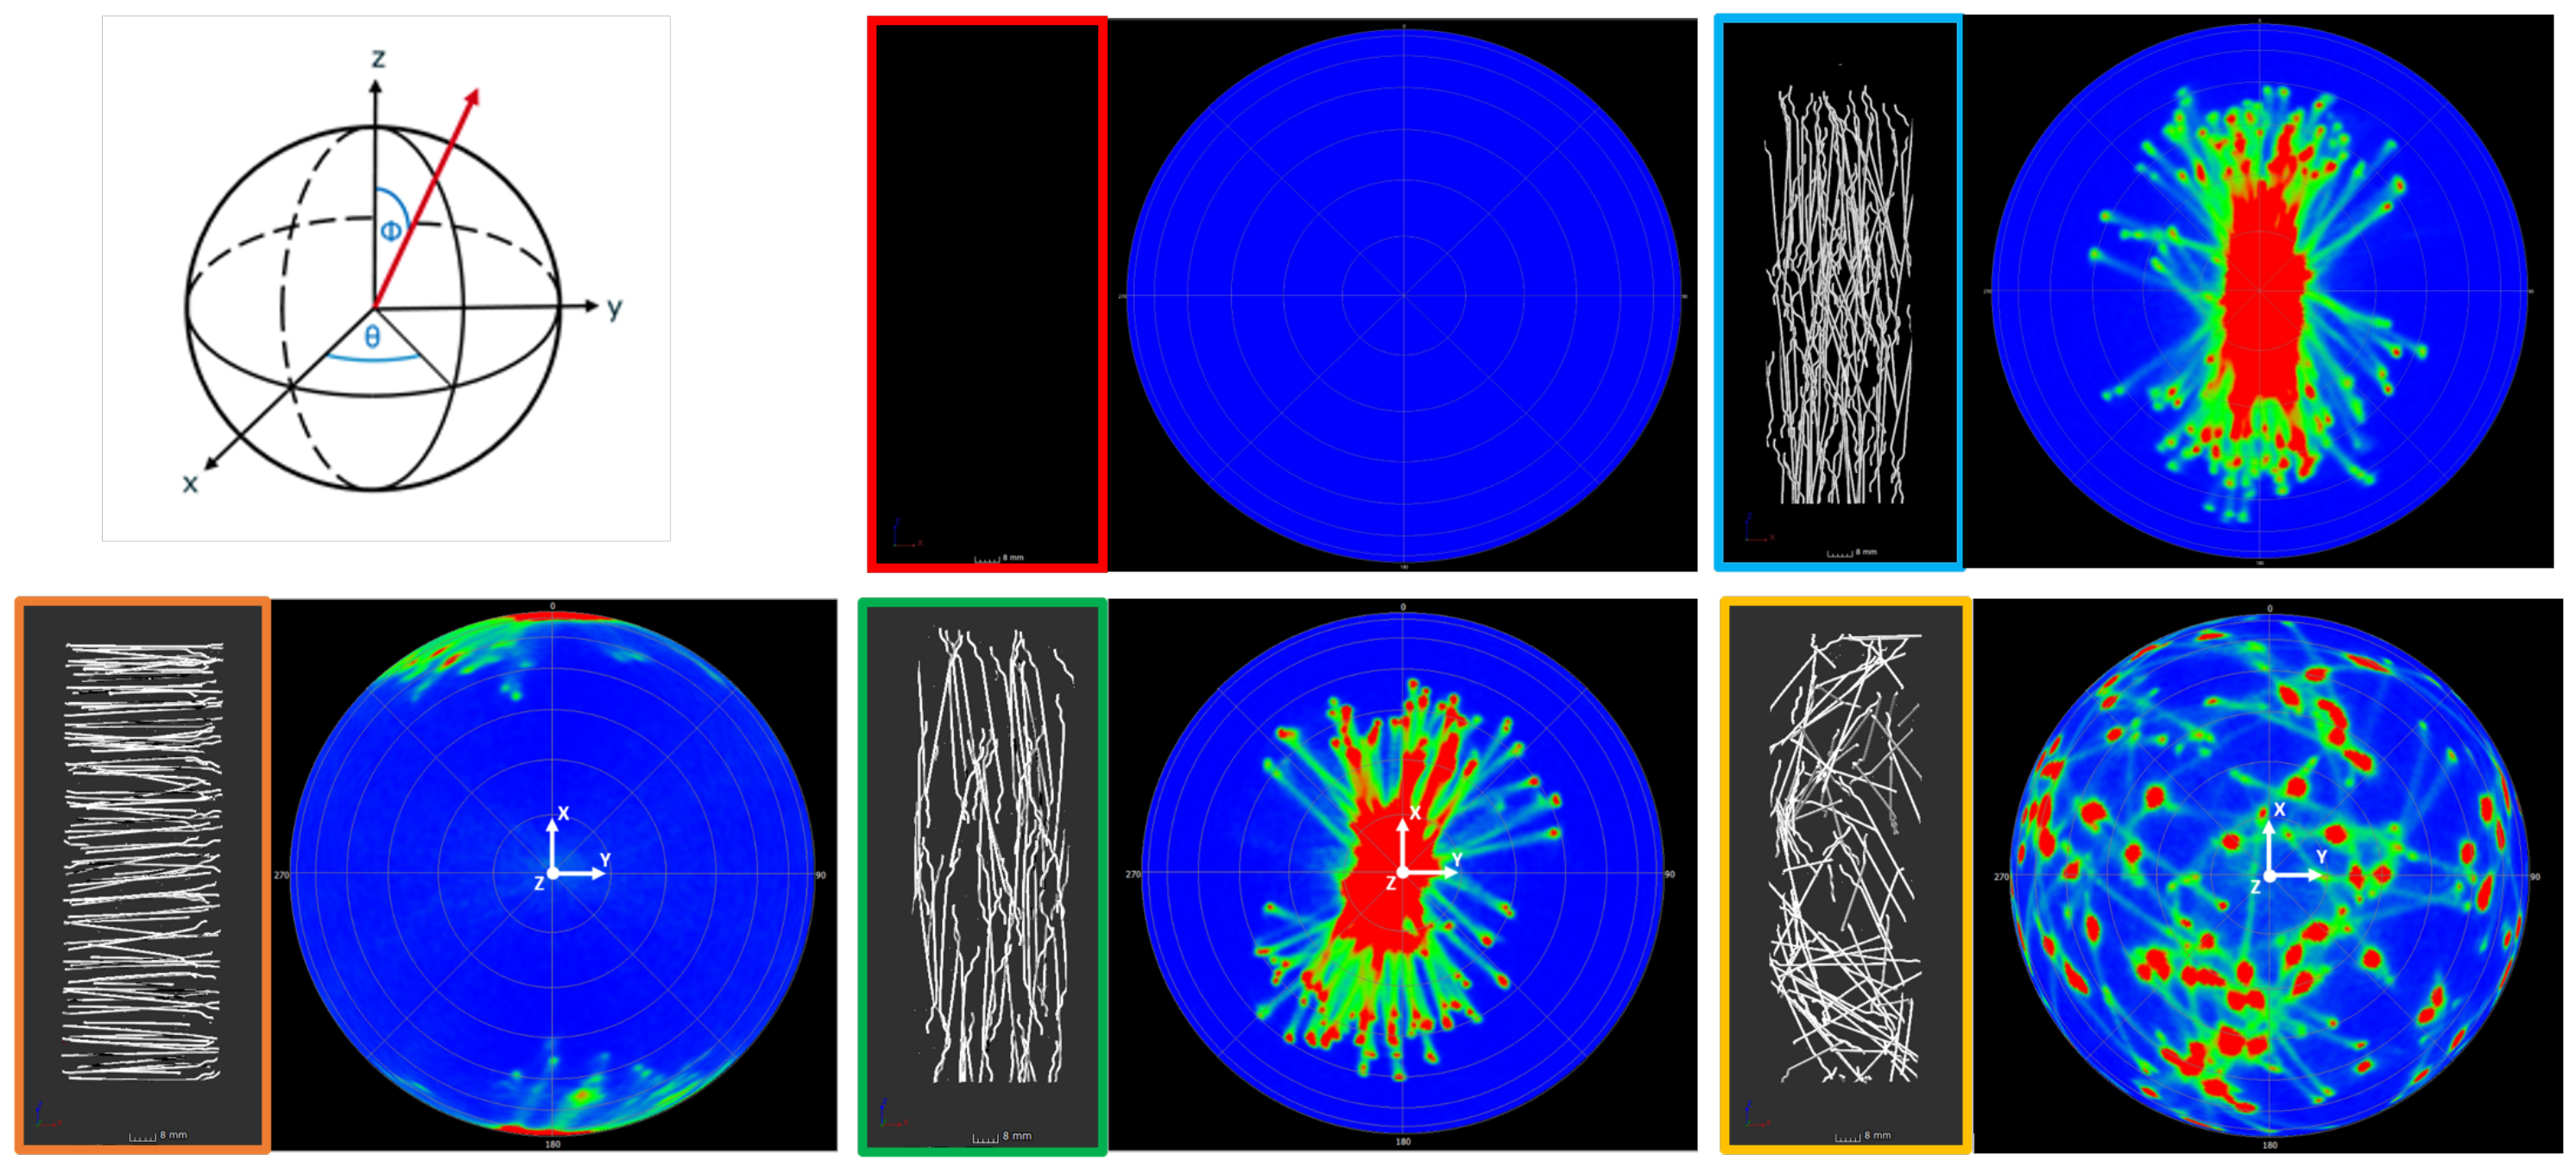
The X-ray CT results provide both a qualitative and a quantitative demonstration of the variations in fiber orientation characteristics amongst the specimens. In
Figure 7, one can visually observe that nearly all fibers within specimen Q40—Cylinder are well aligned with the x-axis of the sample (i.e., perpendicular to the cylindrical axis). This result is confirmed by the concentrations of fiber orientations measured at (
,
) = (0
, 90
) and (
,
) = (180
, 90
), which are the spherical coordinate points corresponding to alignment along the x-axis. Similarly,
Figure 7 indicates that the fibers in specimen Q40 ||| Cylinder are well aligned with the z-axis of the specimen (i.e., the cylindrical axis). For specimen Q40* Cylinder, a relatively random scattering of different fiber orientations can be observed (
Figure 7). These analysis results, thus, confirm the successfulness of the casting techniques in producing the desired controlled fiber orientation characteristics and can be used as a baseline of fiber orientation information, against which the SIP and ultrasonic measurement results can be evaluated.
In principle, it is conceivable that the measurement results of the non-destructive testing methods are influenced by systematically different (air) pore contents in the specimens due to the manufacturing process and that the observed properties could be distorted as a result. Therefore, the pore radius distributions and the air void contents of the five specimens were determined and compared. Air voids were considered to be those with pore diameters greater than 160
m, twice the voxel size of the X-ray CT studies performed here. Mercury intrusion porosimetry (MIP) was used as a reference method (compare also [
27,
28]). For this purpose, 20–30 g of sample material was manually chipped off each of the remnants of the prisms (after the cylinder samples had been taken), dried at 105
C, and examined by MIP. MIP is used to detect pore sizes down to approximately 3.6 nm. Due to its underlying physics, however, only pore throat diameters can be determined and the volume of wide pore areas (which can only be reached via narrow pore throats) is attributed to the pore throats.
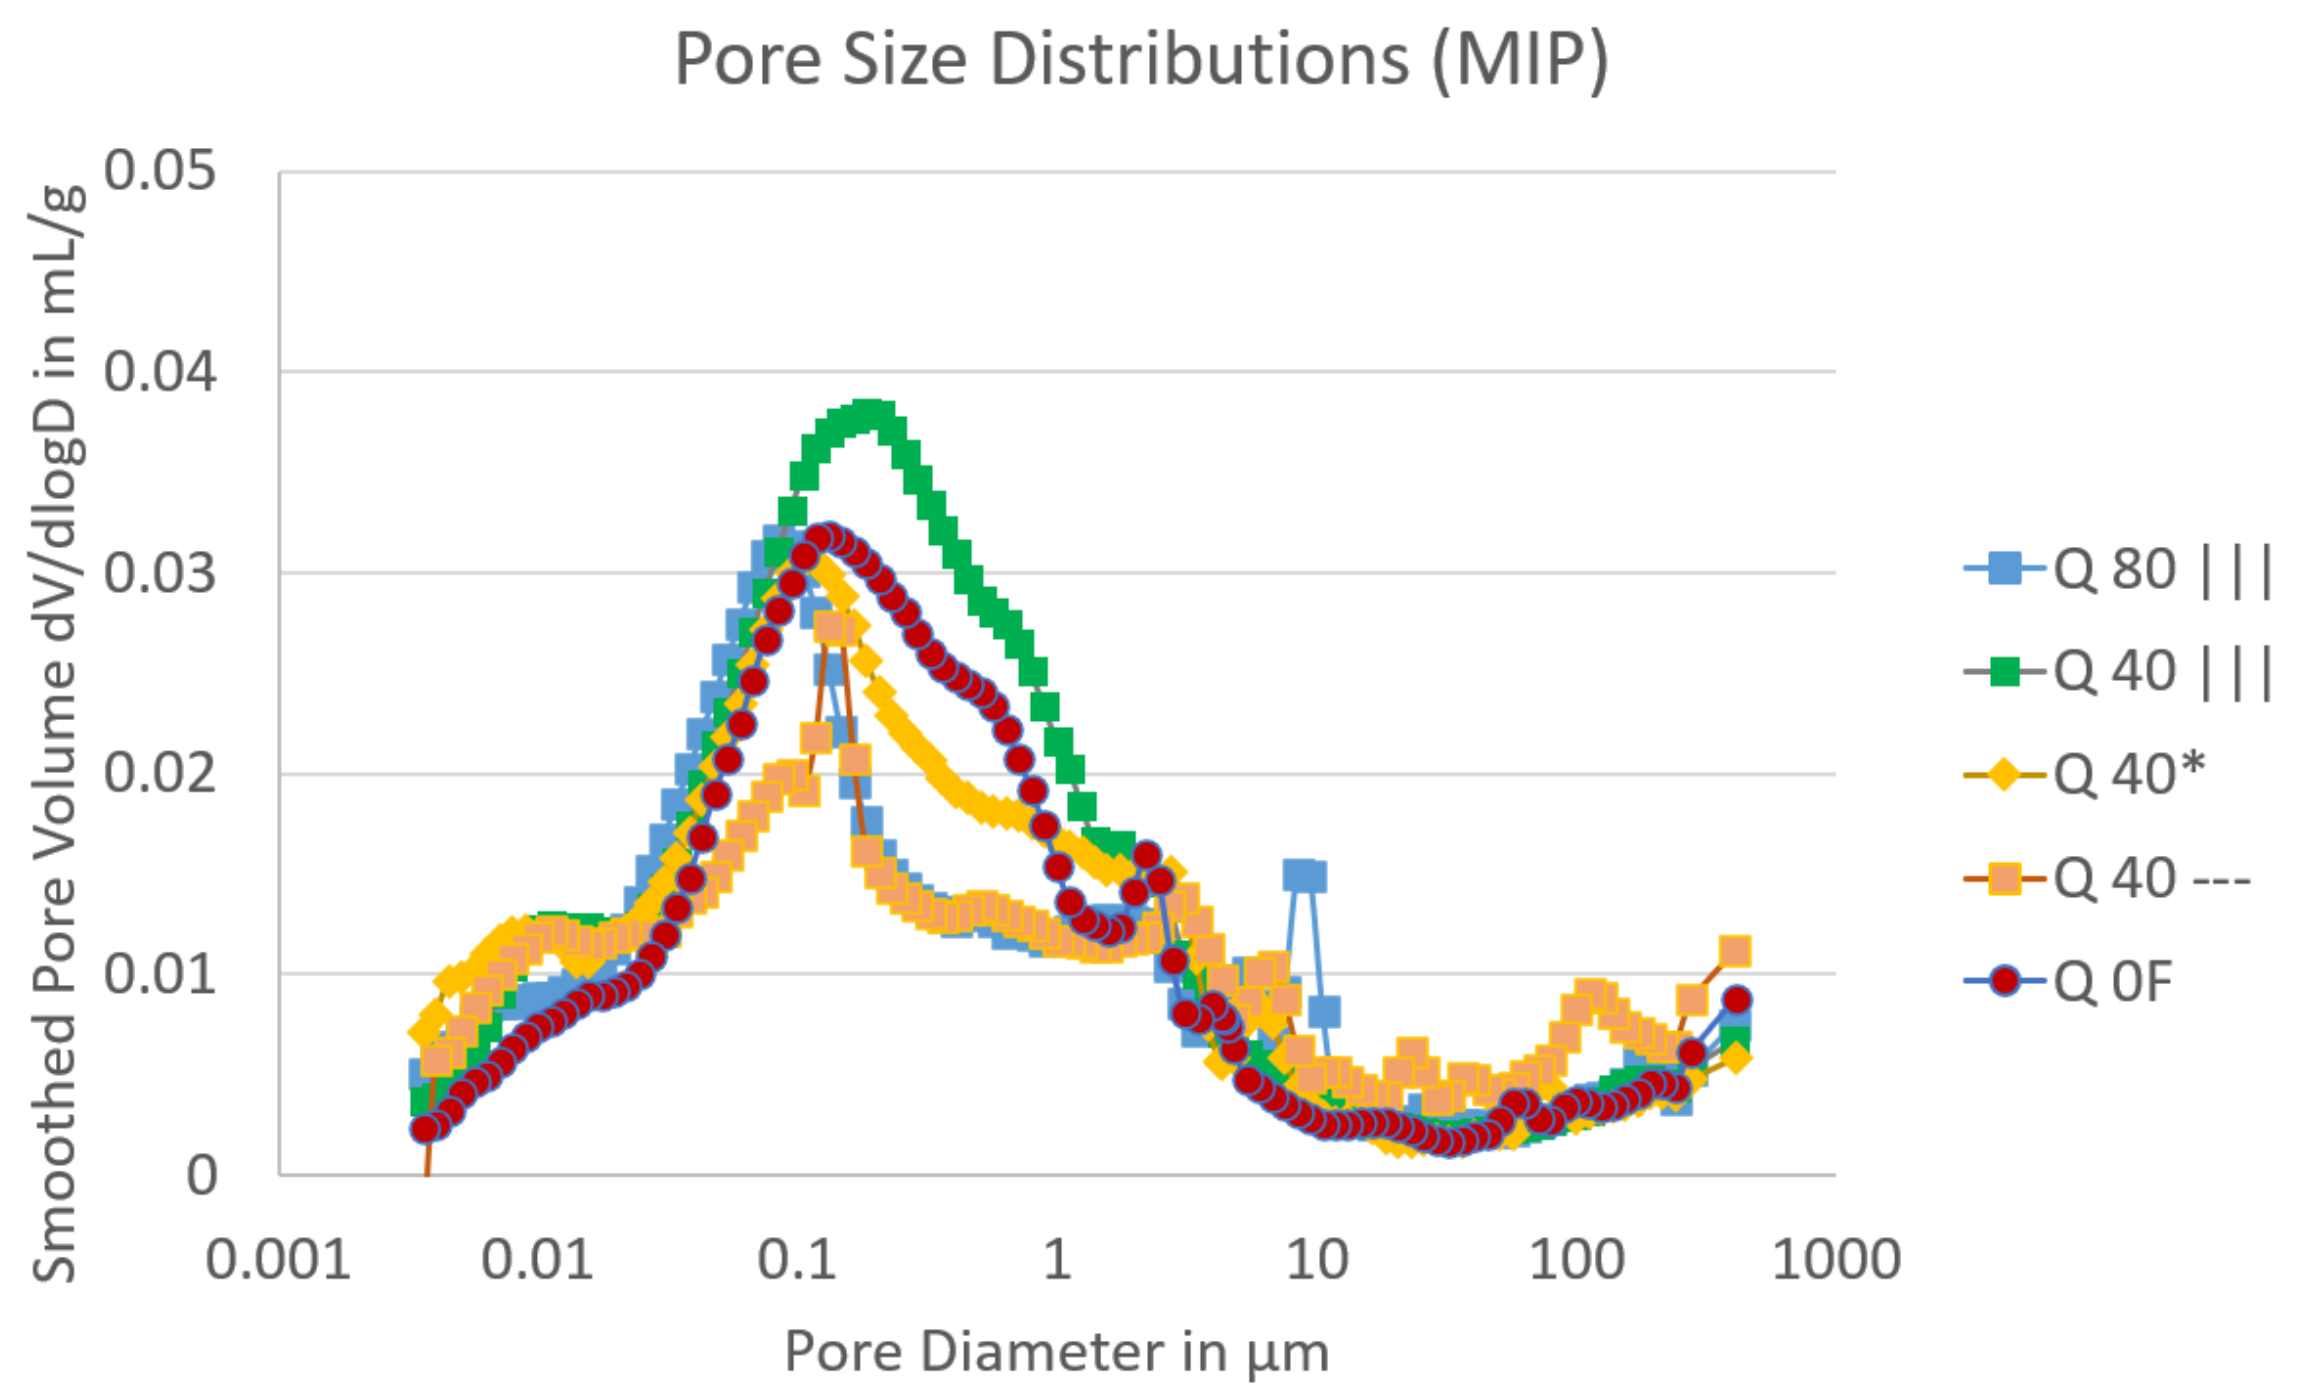
The pore throat diameter distributions are shown in
Figure 10, the corresponding total porosities in
Table 2. The total porosities of all samples range between 12.14% and 15.19%, but no systematic differences are observed: neither directly between the three samples with 40 kg/m
fibre content, where the fibres were manually placed in different orientations, nor with respect to the samples with 0 or 80 kg/m
fibre content. Thus, it can be concluded that the casting process had neither a systematic influence on the overall porosity nor on the pore size distribution of the samples.
The MIP method is not suited, though, for the detection of larger pores, as they are usually accessed via narrow pore throats. However, these might be assessed using X-ray CT. To determine the pore content within the volume examined with CT, a low image grey value threshold for pores is used. The boundary between pore (air) and material (cement) is defined by the determined material surface. The ISO threshold value air/cement, automatically determined by the software from the histogram analysis, serves as the starting value for the automatic surface detection with local threshold values. In the CT analysis, however, only objects consisting of two or more adjacent voxels are recognized as pores in order to exclude noise (“false pores”). Consequently, only pores with a diameter larger than 160
m can be detected. The results are shown in
Table 2. It is striking that the two samples with longitudinally aligned fibers (Q80 ||| and Q40 |||) show approximately the same and, compared to the other fiber reinforced samples, somewhat lower amount of large pores. This could, however, be due to the better radiolucency of the fibers and the associated reduction of artefacts that are incorrectly recognized as pores by the automatic analysis software. In the sample without fibres, the amount of large pores is only slightly lower. The results may, therefore, be not very reliable due to the interference caused by the steel fibres. Strictly speaking, the pore content can only be reliably compared if the fibre orientation is the same. Thus, it is not possible to deduce the effect of the casting process on the volume of large pores using the measurement data listed here. However, given that the total porosities measured using MIP did not vary strongly in relation to fiber distribution or orientation characteristics, it appears unlikely that porosity variations had a major influence on the results of the SIP and US investigations.
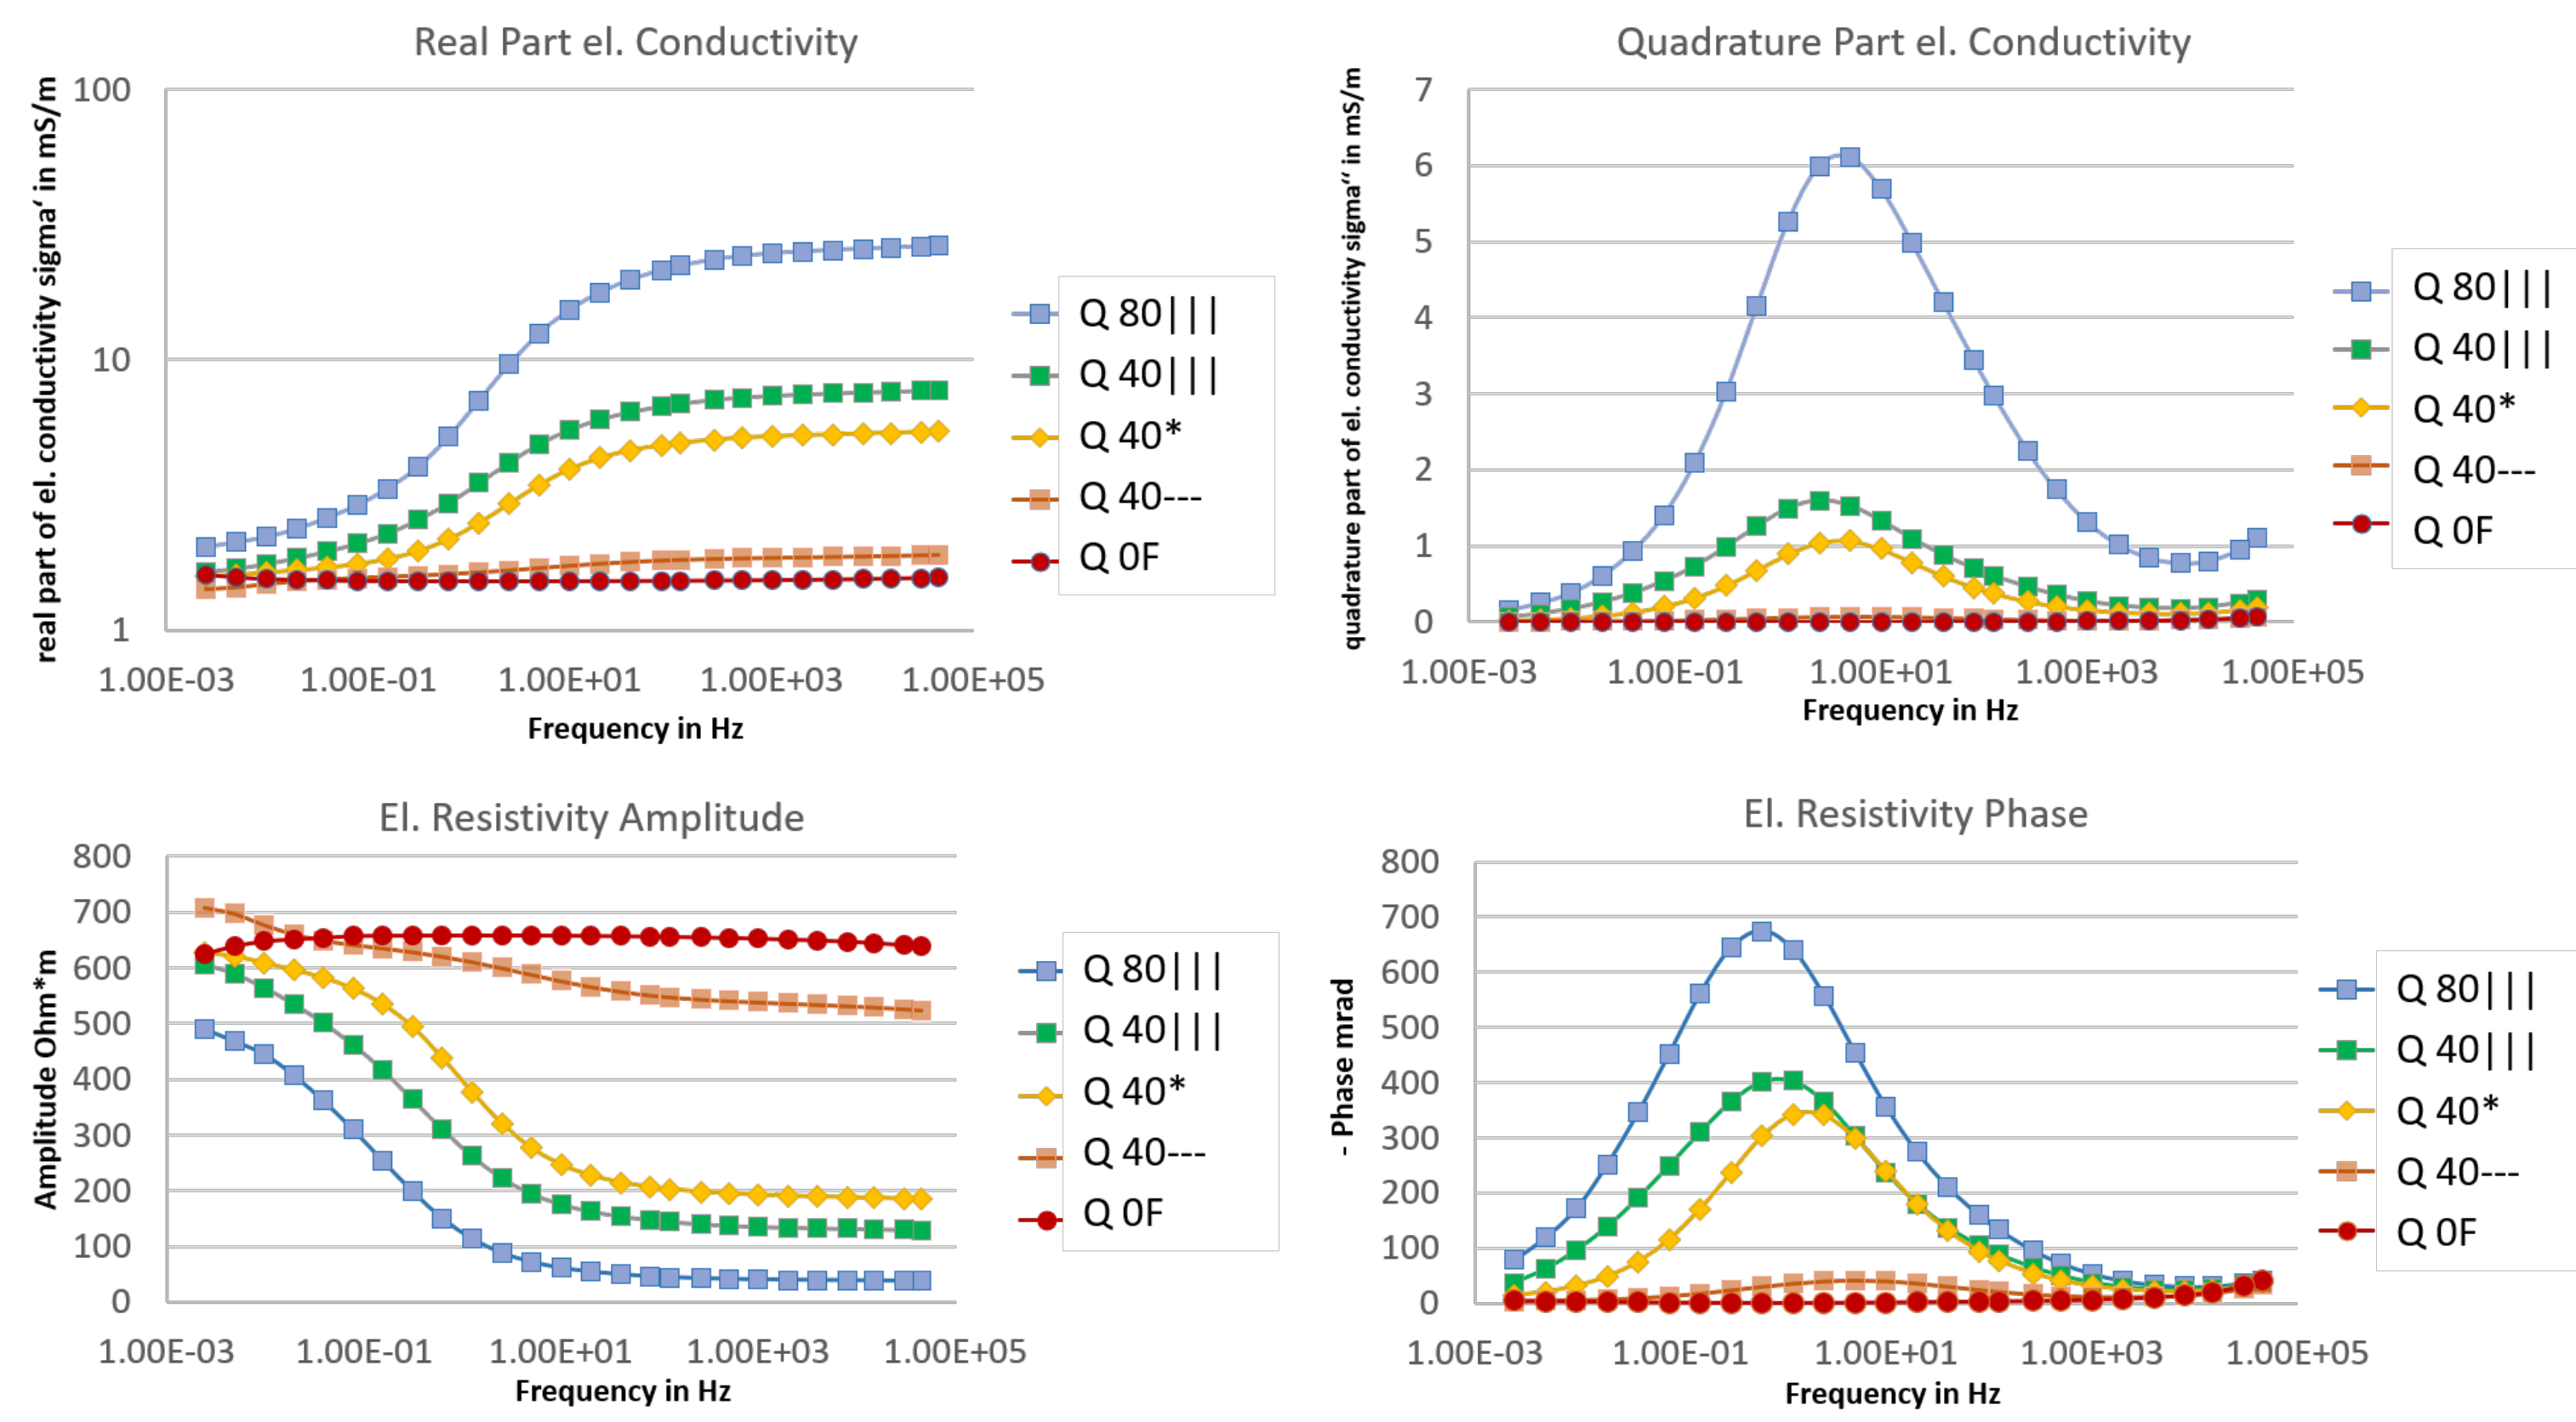
The SIP measurements showed that our results support the findings of [
16], which showed that the main orientation of steel fibers in test specimens coincided with the direction of the lowest resistivity. In the present study, we measured, however, not only the resistivity, which has previously been evaluated by [
16], but also the frequency dependency of the complex resistivity by evaluating the polarization behavior of our samples. Our data indicate that the phase spectra might be an even more sensitive quantity for measuring fiber orientation than the amplitude spectra as the differences between samples with parallel and perpendicular oriented steel fibers were even more pronounced. The works of [
17,
18] both focus on the influence of fiber dosage (not their orientation) on the electrical resistivity for samples prepared with random fiber distributions. The fibre dosage of our samples (for instance, 0.5 vol% for Q40—, Q40||| and Q40*) is at the lower end of what the other working groups used and it is conceivable that by evaluating both resistivity amplitude and phase, we could extract information about fibre orientation and content at the same time.
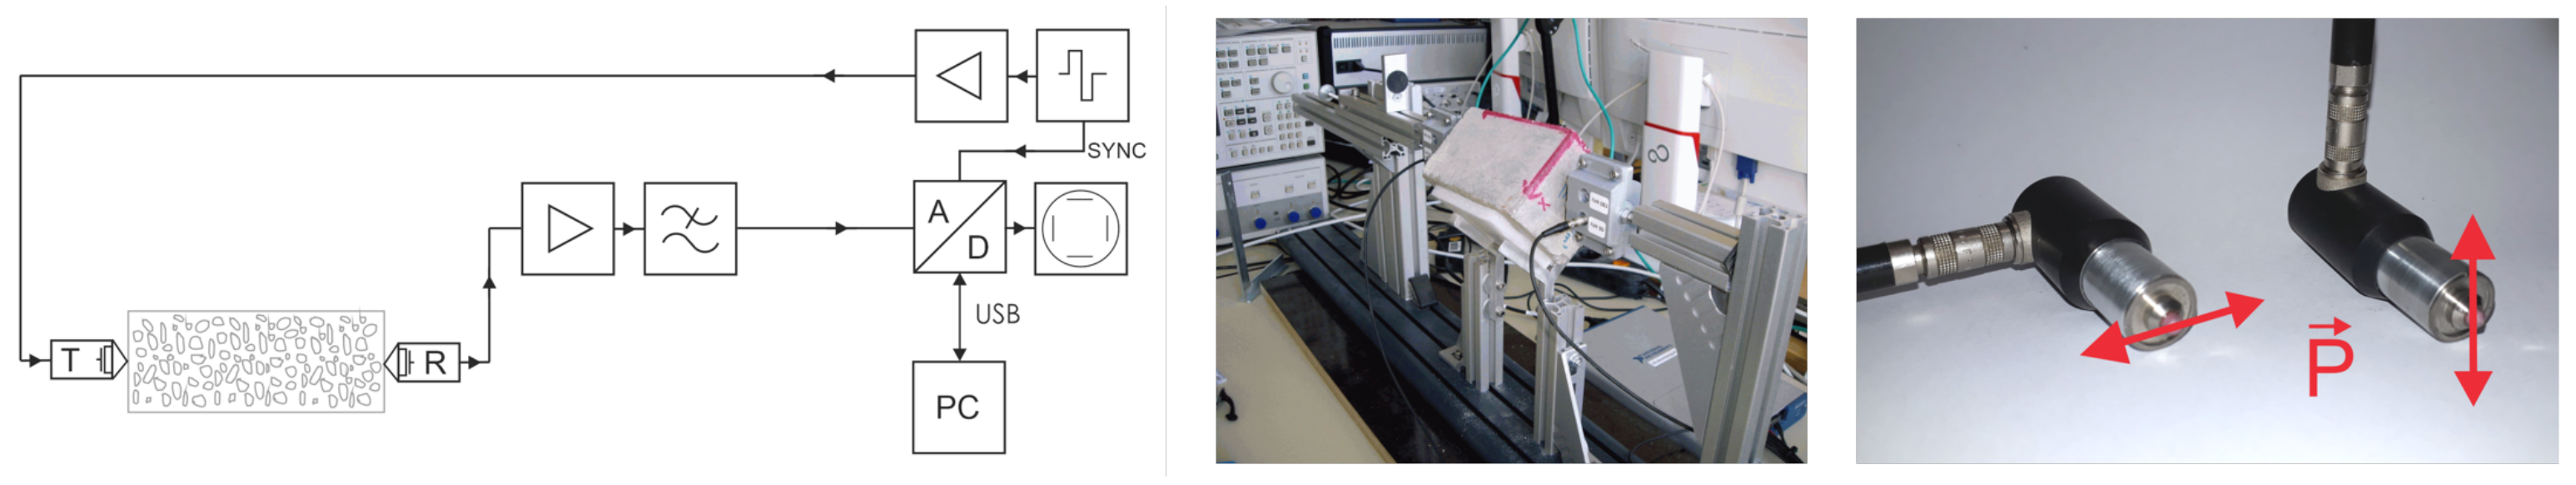
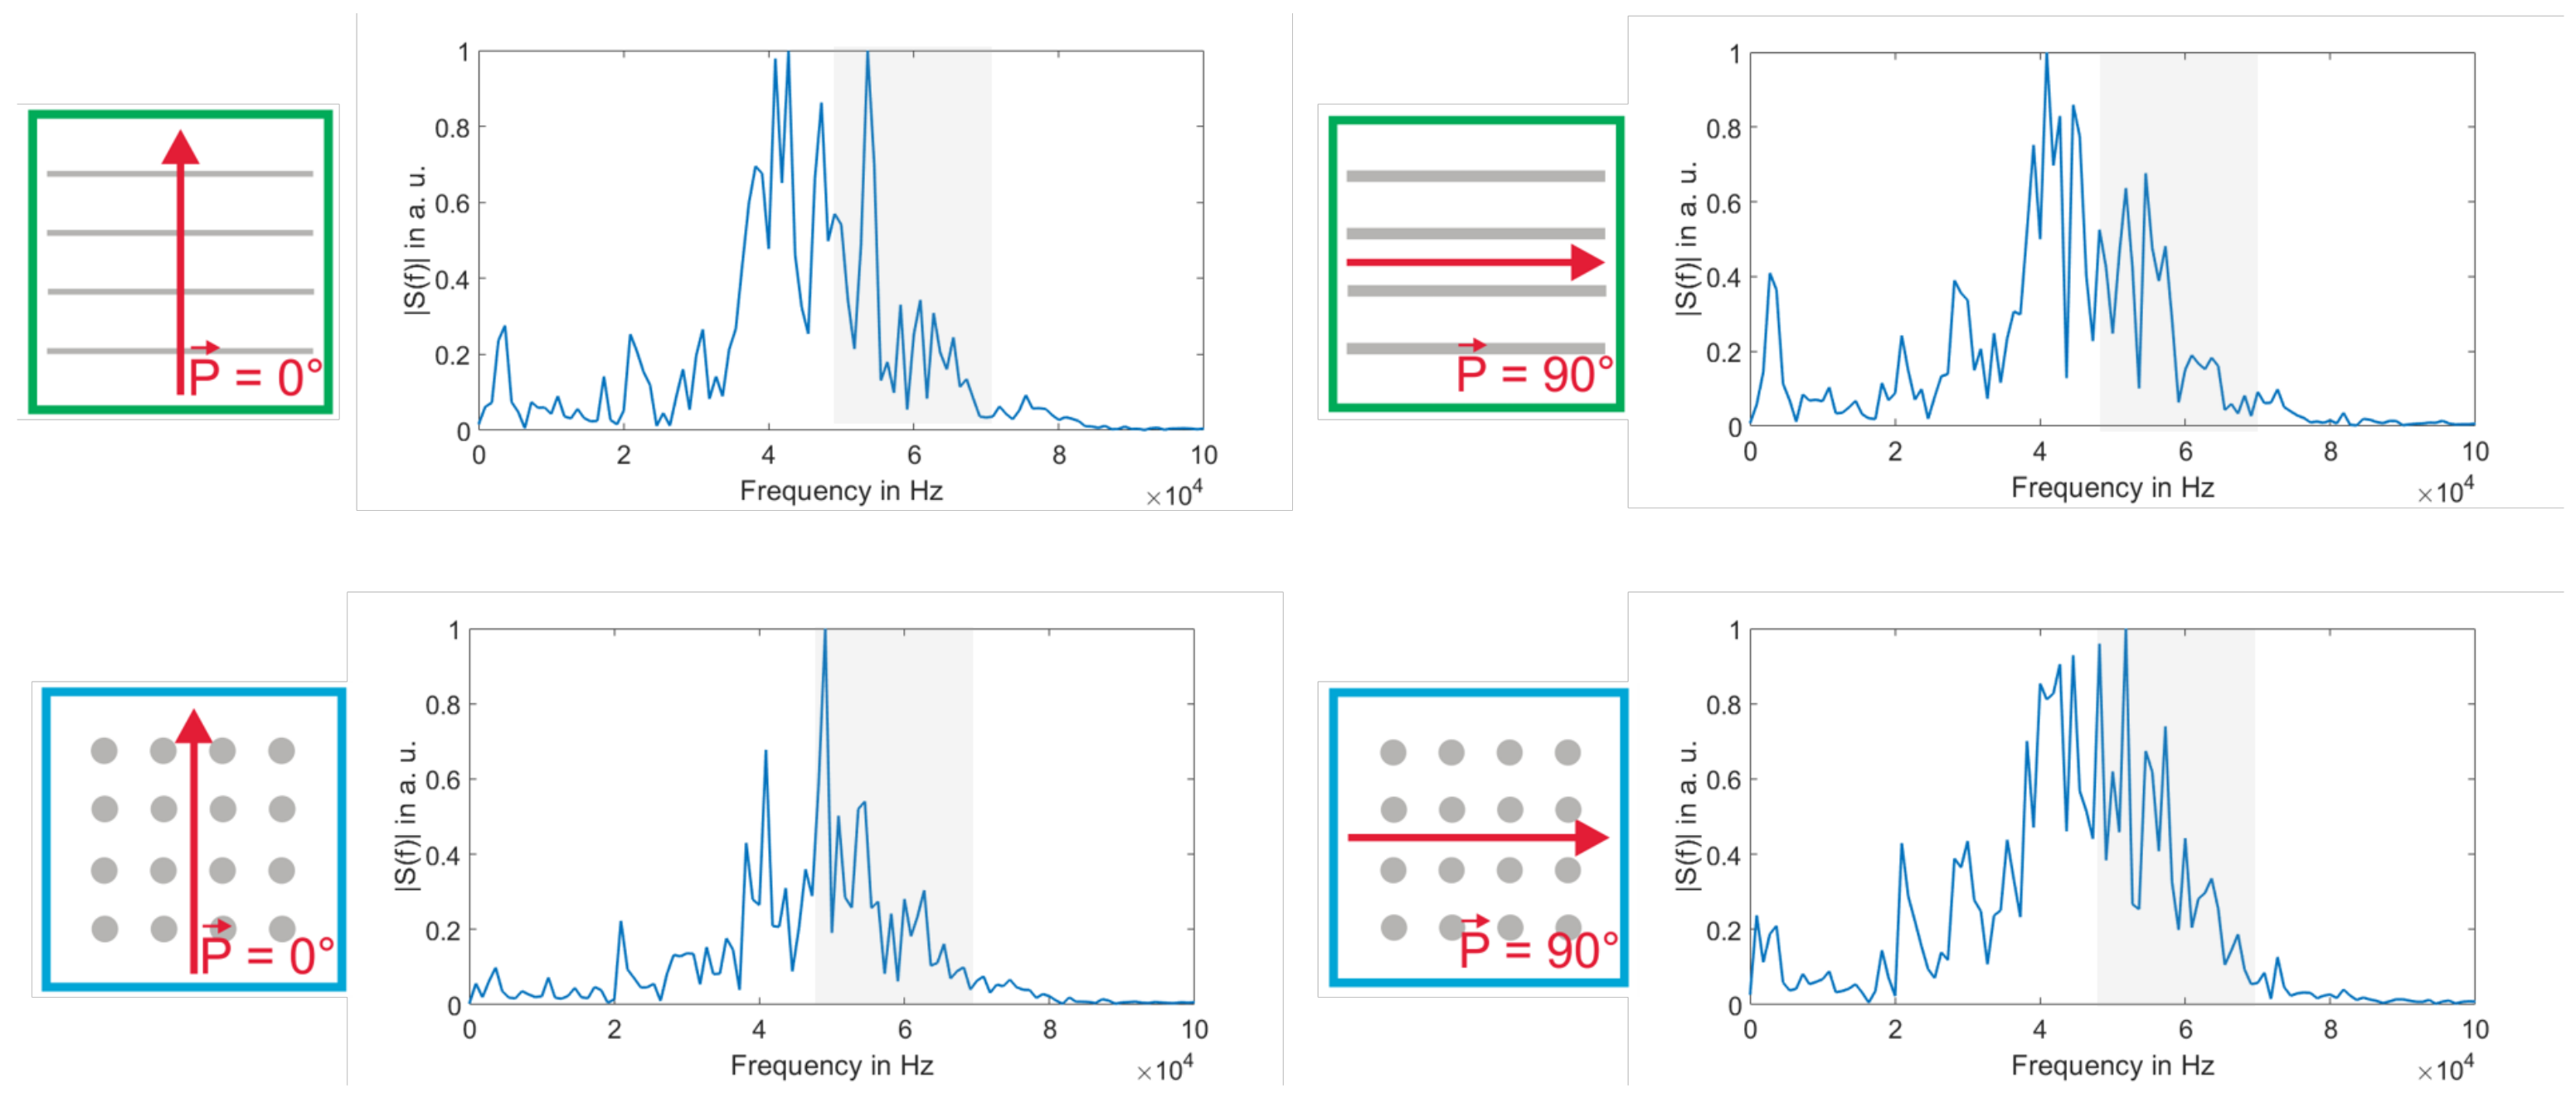
The observed changes in the ultrasound signal are not very strong and experience has shown that this can also be caused by changes in the coupling. The test specimens are relatively small compared to the ultrasonic wavelength. Due to reflections of the ultrasonic waves at the sides of the test specimen and the superposition of different wave modes, the results are not clear. Thus, further ultrasonic measurements on larger specimens are necessary to confirm these initial promising results. The measurement of steel fiber content and/or orientation with ultrasonic dry contact probes would have the advantage that the concrete surface does not have to be prepared for a measurement. Other influencing variables like the grading curve, the pore structure, cracks or variations in the moisture content of the samples were not regarded in this study. All these parameters can significantly influence the results and sensitivity of SIP or US measurements. Therefore, further research is needed.
5. Conclusions
SFRC is still a relatively new building material, which holds great potential for innovative use and design approaches for future concrete structures. The assessment of SFRC properties, such as fiber orientation and dosage, is still difficult, often requiring coring and elaborate lab analysis. Our study focusses on the effectiveness of alternative methods to extract this information non-destructively.
Evaluating the electrical behavior of SFRC samples, we found that both the resistivity magnitude and phase (i.e., the material’s capability to polarize) are sensitive to the main fiber orientation. It is conceivable that when both are measured, fiber orientation and content can be assessed. Likewise, for the measured samples we saw that the transmission amplitude of ultrasonic shear waves is slightly diminished and that higher frequency components are attenuated when the polarization of the wave is parallel to the fibers’ direction. However, the dimensions of the test specimens have the same order of magnitude as the ultrasound wavelength itself. This results in reflections of the ultrasonic waves from the test body sides and a superposition of different wave modes in the received signal, making the interpretation of the results difficult. In addition, variations in probe coupling have an influence on the received signals. For this reason, further ultrasonic measurements are necessary, using a larger number of test specimens with bigger dimensions, to further investigate these first indications of an influence of the fibres on the ultrasonic signals.
The X-ray CT analysis provided quantitative measurements of fiber orientation as well as visualizations of actual fiber distributions within the specimens. These measurements not only verified the successfulness of the specimen casting technique in producing specimens with controlled fiber orientations. They also can serve as a quantitative basis for assessing correlations between ultrasonic or SIP measurements and actual fiber conditions. An analysis of the statistical correlation between the quantitative fiber orientation data measured using X-ray CT and the phase variations measured using SIP could yield useful mathematical relationships that could be utilized as a basis for expanding fiber orientation assessment using SIP to further applications (such as measurement of larger components or of different fiber types). Such a statistical analysis is the planned topic of the authors’ future work in this area.


 ,
, 


