Article

Construction of Artificial Forest Point Clouds by Laser SLAM Technology and Estimation of Carbon Storage

1
Faculty of Land and Resources Engineering, Kunming University of Science and Technology, Kunming 650093, China
2
Surveying & Mapping Technology and Application Research Center on Plateau Mountains of Yunnan Higher Education, Kunming University of Science and Technology, Kunming 650093, China
*
Author to whom correspondence should be addressed.
Appl. Sci. 2022, 12(21), 10838; https://doi.org/10.3390/app122110838
Submission received: 15 September 2022 / Revised: 23 October 2022 / Accepted: 24 October 2022 / Published: 26 October 2022

Abstract

:
In order to reduce the impact of global warming, forestry carbon sink trading is an effective approach to achieving carbon neutrality, while carbon storage estimation plays an important role as the basis of the whole carbon sink trading. Therefore, an accurate estimation of carbon storage is conducive to the sustainable development of carbon sink trading. In this paper, we use laser SLAM technology to model an artificial forest in three dimensions, extract the tree parameters by the point cloud processing software, and calculate the carbon storage according to the allometric growth equation of the tree species. The experimental results show that the loop path is the best among the three-path planning of ZEB-HORIZON scanner data acquisition. For large-scale plantations, the fusion data acquisition of linear and loop paths by Livox Mid-40 and ZEB-HORIZON LIDAR can be adopted with a highly precise and a complete 3D point cloud obtained. The Lidar360 software is used for single wood segmentation and parameter extraction, and the manual measurement is taken as the quasi-true value. After the measurement accuracy analysis, the carbon storage estimation is met. Using the volume source biomass method in the sample plot inventory method, the carbon storages of camphor and cypress in the experimental area were estimated through the allometric growth equation of camphor and cypress and the international conversion rate.

1. Introduction

The rapid development of the social economy cannot be separated from the support of resources and the environment. Excessive consumption of resources will inevitably lead to the deterioration of the global ecological environment. At present, the Earth’s climate is experiencing rapid warming and the warming trend will continue, which will cause a series of frequent natural disasters and changes in the Earth’s ecosystem, and impact the major human production fields [1]. In order to cope with its impact, a series of agreements, such as the “Paris Agreement”, “Kyoto Protocol”, “United Nations Framework Convention on Climate Change”, and others, have been implemented successively [2,3]. From September 2020 on, China has promised to “strive to achieve carbon peak by 2030 and carbon neutrality by 2060”, which was not only an inevitable choice for China to respond to climate change and carbon emission reduction in international negotiations, but also an urgent requirement to implement the new development concept and drive the economic and social transformation and sustainable development [4]. As the most economically feasible and potential way to deal with global warming and achieve carbon neutrality, forestry carbon sequestration has become a strategic choice for China to deal with global warming and achieve carbon neutrality by 2060 [5]. In order to promote the development of increasing carbon sequestration in forestry, China has incorporated the Chinese certified emission reduction (CCER) project into the pilot mechanism of carbon trading in China. Up to now, the CCER forestry carbon sequestration project is still the most important way to increase carbon sequestration in forestry in China [6,7]. With the appeal and implementation of forestry carbon sequestration policies, its measurement and monitoring technology has also been further developed. Accurate estimation of forest carbon reserves in carbon sequestration measurement is the basis of the entire carbon sequestration transaction. At present, the main forest carbon reserves estimation methods include sample land inventory, micrometeorology, remote sensing estimation methods, etc. [8]. The sample land inventory method is to establish the most characteristic sample land in the measuring area and use different analysis methods to estimate forest carbon reserves [9]. Micrometeorology is to estimate forest carbon reserves by measuring the energy exchange flux between vegetation CO2 and the atmosphere [10]. The remote sensing estimation method uses remote sensing images to extract vegetation from the images and classify different forest species, and then estimate the carbon storage of trees according to the scale of the remote sensing forest [11]. However, the research on carbon storage estimation through tree feature extraction of point cloud data has become a new hotspot. Most scholars obtained tree point clouds through the unmanned aerial vehicles (UAV) and ground-based 3D lasers [12,13,14]. Marc Simard et al. have used spaceborne lidar to map forest canopy height globally [15]. Luke Wallace et al. presented the development of a low-cost Unmanned Aerial Vehicle–Light Detecting and Ranging (UAV–LIDAR) system and an accompanying workflow to produce 3D point clouds [16]. Sebastiano Sferlazza et al. optimized the Sampling Area across an Old-Growth Forest via UAV-Borne Laser Scanning, GNSS, and Radial Surveying [17]. There is little research on obtaining tree point clouds using laser simultaneous localization and mapping (SLAM) technology for carbon storage estimation. Therefore, this paper uses laser SLAM technology to obtain high-precision tree point clouds of plantations and extract tree information parameters, and uses the volume-derived biomass method in the sample plot inventory method to estimate carbon reserves.

2. Materials and Methods

When building the 3D reconstruction of trees, we can obtain the 3D point clouds of trees through UAV tilt photogrammetry technology, airborne LIDAR technology, ground 3D laser scanning technology, laser SLAM, etc. The UAV tilt photogrammetry technology can obtain 3D data with real texture. However, due to the influence of the wind, the trees sway greatly, and the obtained aerial images of trees cannot be fixed in the same position. As a result, the final 3D model developed has problems of blurred and incomplete expression of 3D information, which further makes it impossible to obtain the 3D information under the canopy of trees (as shown in Figure 1a). Therefore, the carbon storage of trees cannot be estimated completely and accurately by this technology. The ground station 3D laser scanning technology is based on the principle of laser ranging, which can quickly obtain the 3D point clouds of the measured object at a single station. Although it has the advantages of high accuracy of tree point clouds obtained, the point cloud data obtained by single-station scanning cannot completely reflect the 3D information of trees due to the serious occlusion of trees. Multi-station scanning is required to compensate, resulting in a huge workload of data acquisition. This is not suitable for establishing 3D point clouds of large-scale forestry. Airborne LIDAR technology expands single-station scanning to overall scanning, which can quickly reconstruct geometric data such as points, lines, surfaces, and 3D models of the ground. This can enable a detailed understanding of the overall changes and characteristics of the survey object [18]. At present, most airborne LIDAR scanners use orthophoto acquisition, and the use of pulse frequency has a certain penetrability. However, there is still a large number of 3D point clouds missing at the bottom of trees when establishing tree point clouds (as shown in Figure 1b). Therefore, using laser SLAM technology to build 3D point clouds for trees is suitable for the accurate estimation of carbon storage in forestry carbon sink trees with its high efficiency and good accuracy.

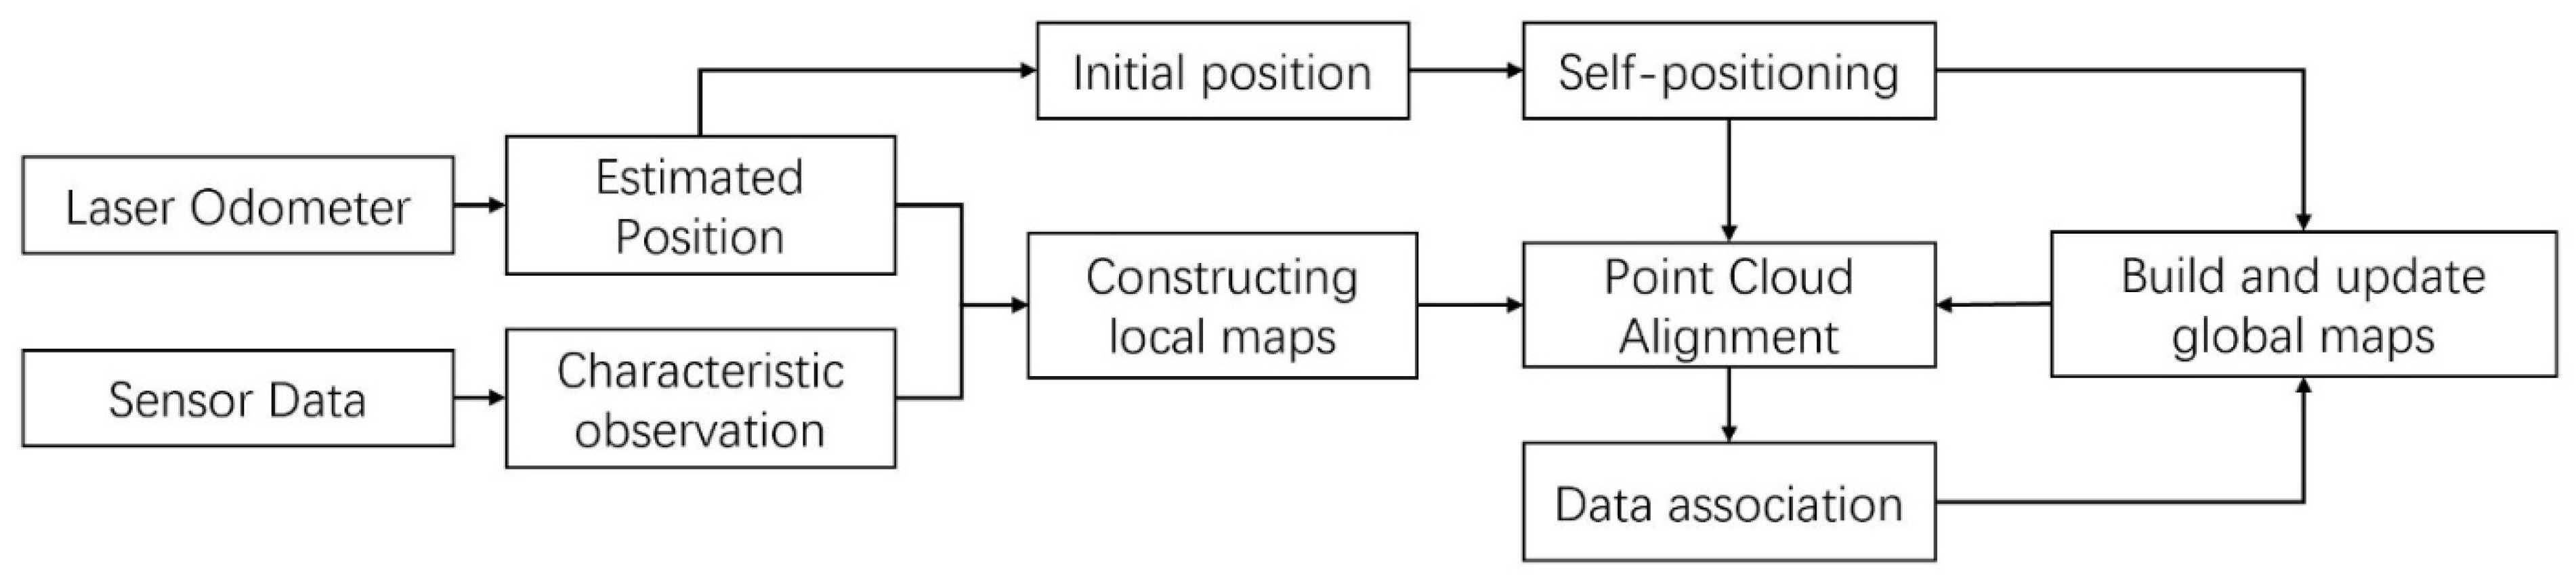
2.1. SLAM Technology 3D Reconstruction

Simultaneous localization and mapping (SLAM) can perform real-time localization and map construction [19]. In the unknown three-dimensional space, it obtains 3D spatial environmental information through its own sensors, determines the pose in 3D space according to its own movement path to sense the location changes of different objects in 3D space, and finally constructs a 3D mapping. Laser SLAM is a method based on laser ranging and positioning, which collects 3D scene information through LIDAR to present a series of points with 3D spatial information attributes. By registration and comparison of 3D point clouds of the two scenes acquired at different times, the distance and attitude change of the relative motion of the LIDAR are calculated, thus the construction of the 3D scene is completed. The laser SLAM system framework mainly comprises sensor data, front-end, back-end, mapping, and other modules. The system flow is shown in Figure 2.
The front-end processing (laser odometer, etc.,) is to match the data feature points at the frequency of each frame of the sensor, and after initialization, to obtain the initial value of the pose of each frame by using the geometric method. Since the front-end processing only refers to the previous frame or frames, the accumulated error will increase. Therefore, the back-end uses the frequency of key frames to satisfy the feature matching and reduces the number of frames to obtain the initial value of the key frame pose. The threshold value can be set for global optimization in segments. The Loopback detection can find the previously passed place through data alignment, find the loopback that uses a similar transformation method to adjust the poses of key frames associated with the closed-loop frames, optimize all the key frames and points within the loopback, and finally, perform global optimization. The final optimized data is the scene map.
The LOAM (Lidar Odometry and Mapping in Real-time) algorithm [20] is one of the representatives of real-time laser SLAM. It was first proposed by Hugh Durrant-Whyte and John J. Leonard, aiming to solve the problem of localization, navigation, and mapping of mobile robots when operating in an unknown environment. The LOAM algorithm is a laser-matching SLAM method, which constructs a 3D scene mainly through scan registration, LIDAR odometry, LIDAR mapping, and pose integration. The LOAM-Livox [21] algorithm is an open-source algorithm developed by the MaRS lab of the University of Hong Kong for the Livox LIDAR SLAM technology. The LOAM algorithm is a real-time, low-drift LIDAR ranging method using 3D LIDAR for state estimation and mapping. It divides complex SLAM problems into high-frequency motion estimation and low-frequency environment mapping. It uses the collaboration of ranging and mapping algorithms to seek to optimize a large number of variables simultaneously for real-time accurate motion estimation and mapping [22]. The LOAM-Livox algorithm still uses the same way of point cloud extraction as LOAM, extracting edge points and plane points by curvature, but filtering out those close to the viewpoint edge, or with too large or small reflection intensity, small plane angle, and occluded points when selecting candidate feature points. It then uses sparse features to calculate the positional transformation, and adds a loopback detection module, using a “bag-of-words model“ for matching. Finally, the graph optimization method is used to establish constraints and optimize each pose node to obtain the scene model.

2.2. Data Acquisition and Processing

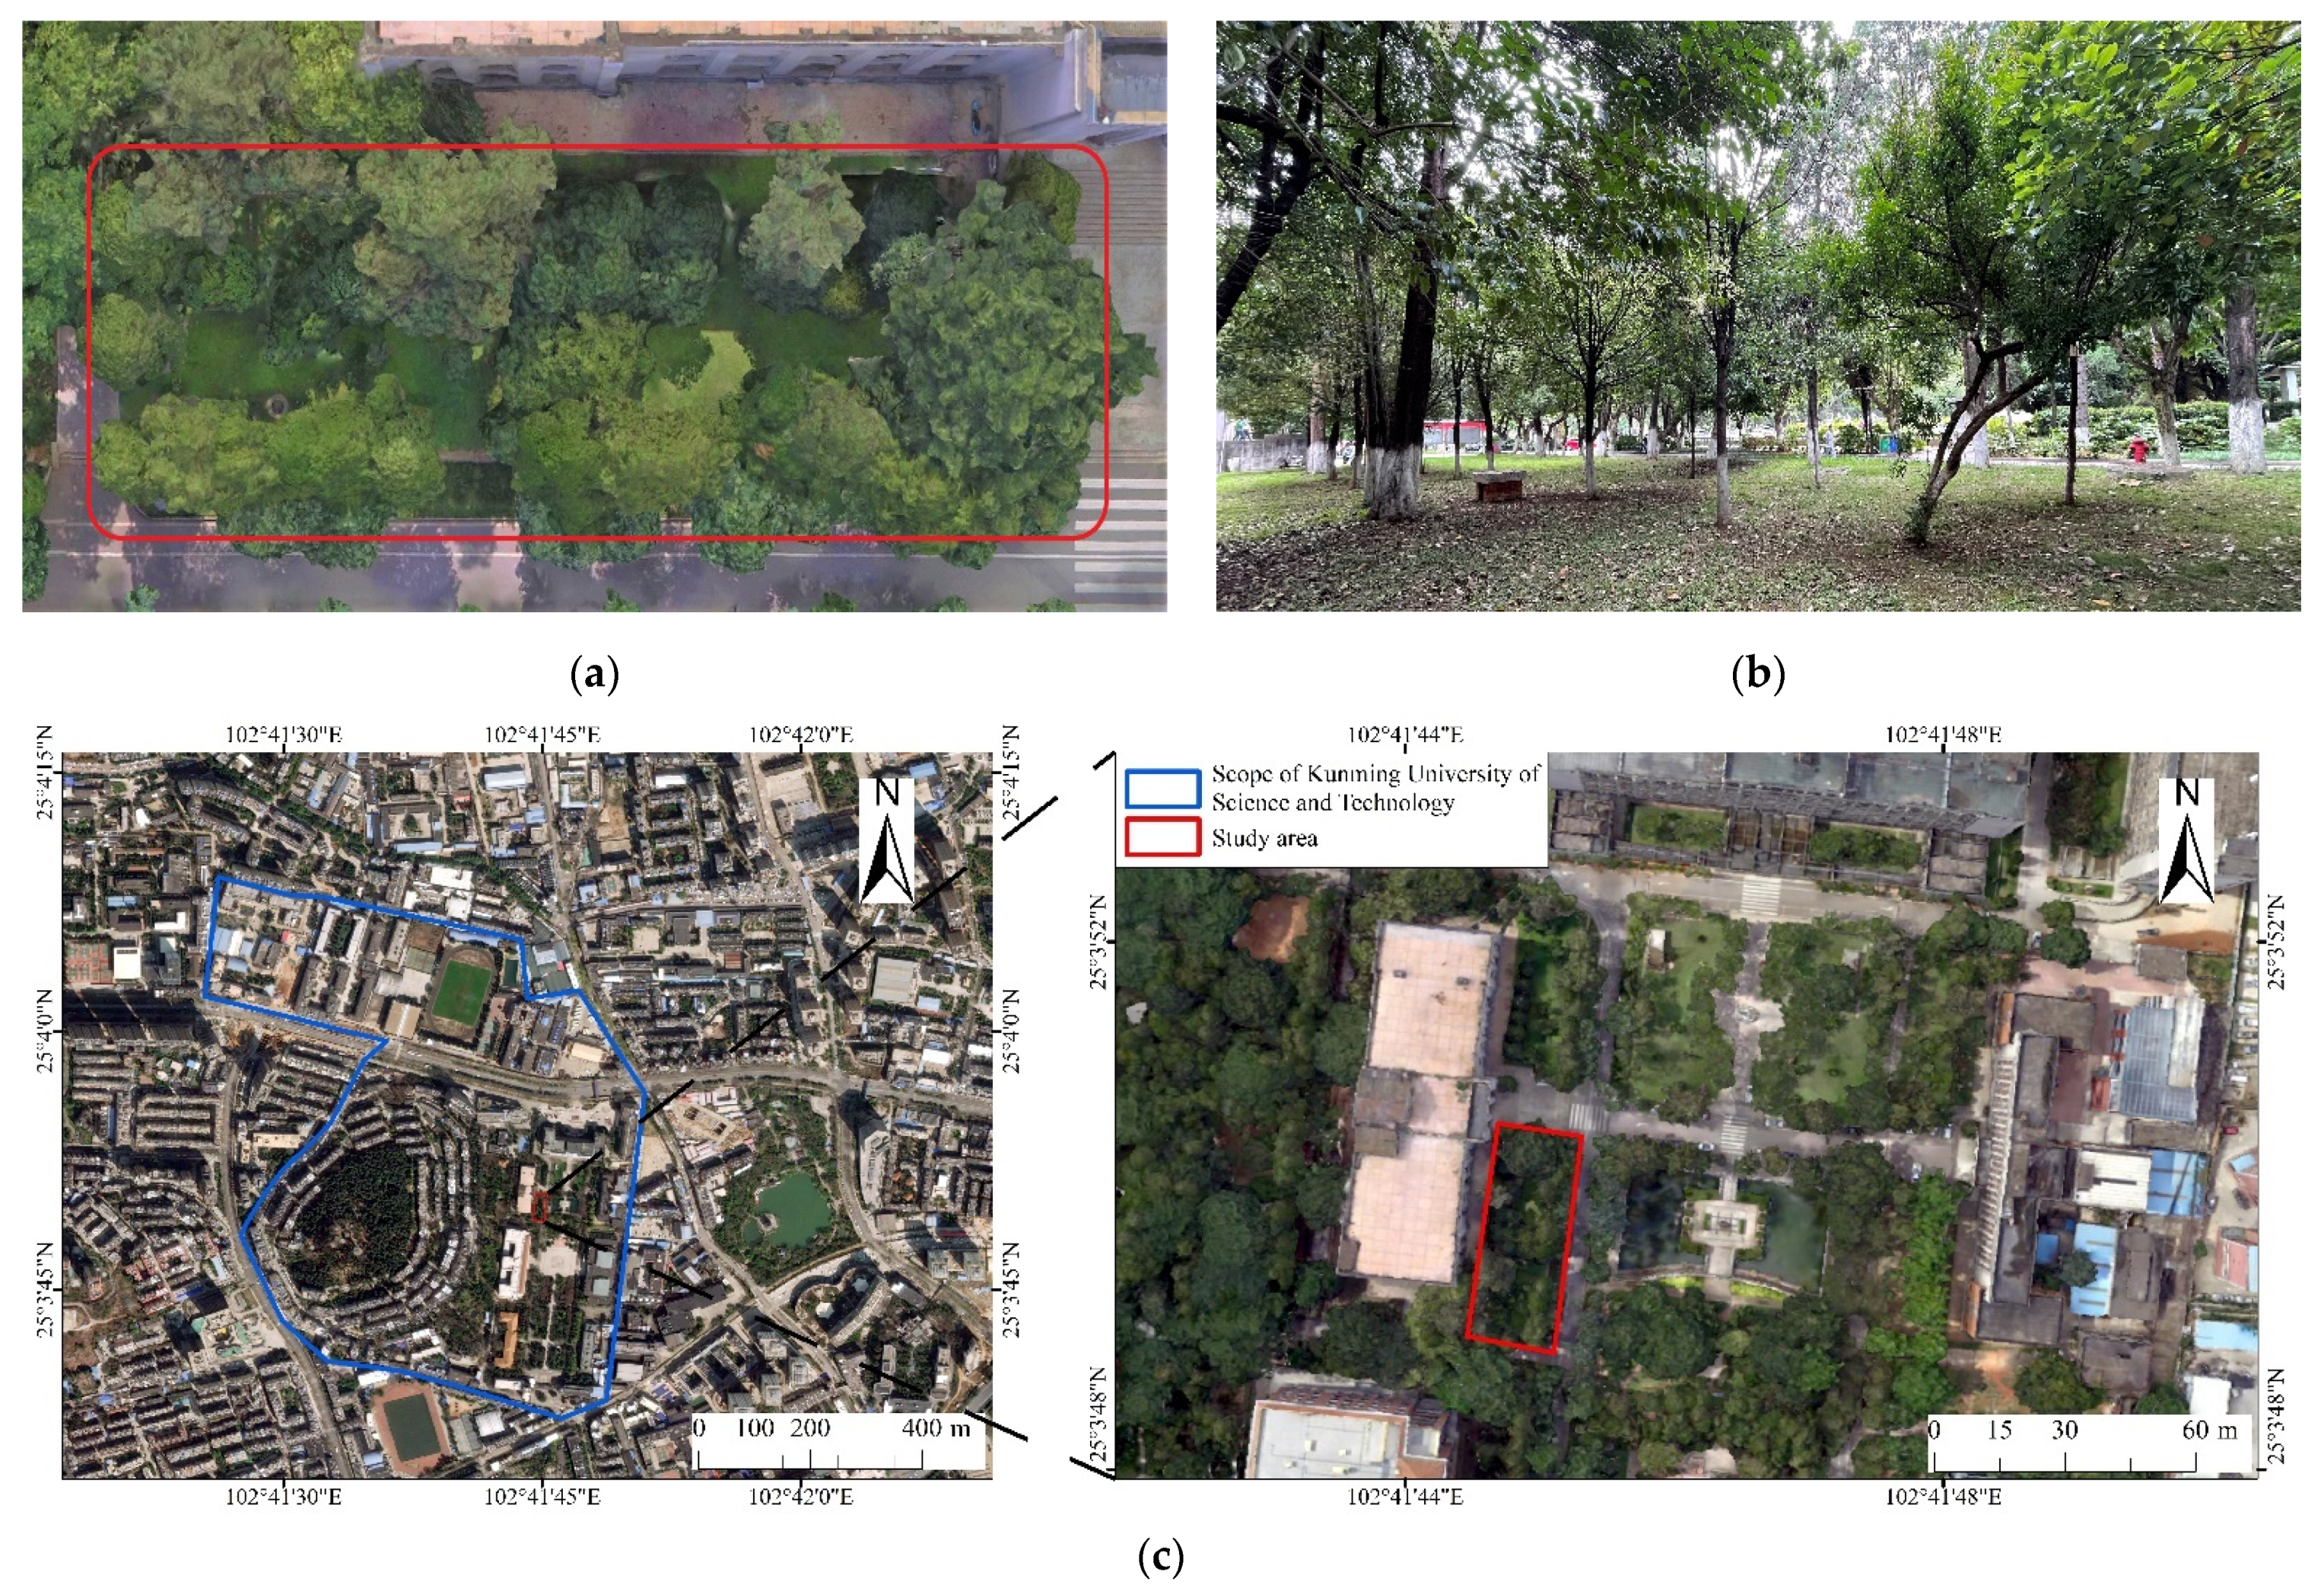
2.2.1. Overview of the Experimental Area

The experimental area of this paper is located in a small plantation at Kunming University of Science and Technology, Kunming, Yunnan Province. We used 3D laser SLAM technology to construct 3D point clouds of trees, by which parameters were extracted for the final estimation of carbon stock in this plantation. The experimental area is shown in Figure 3. The plantation forest in the experimental area is mainly camphor and cypress.

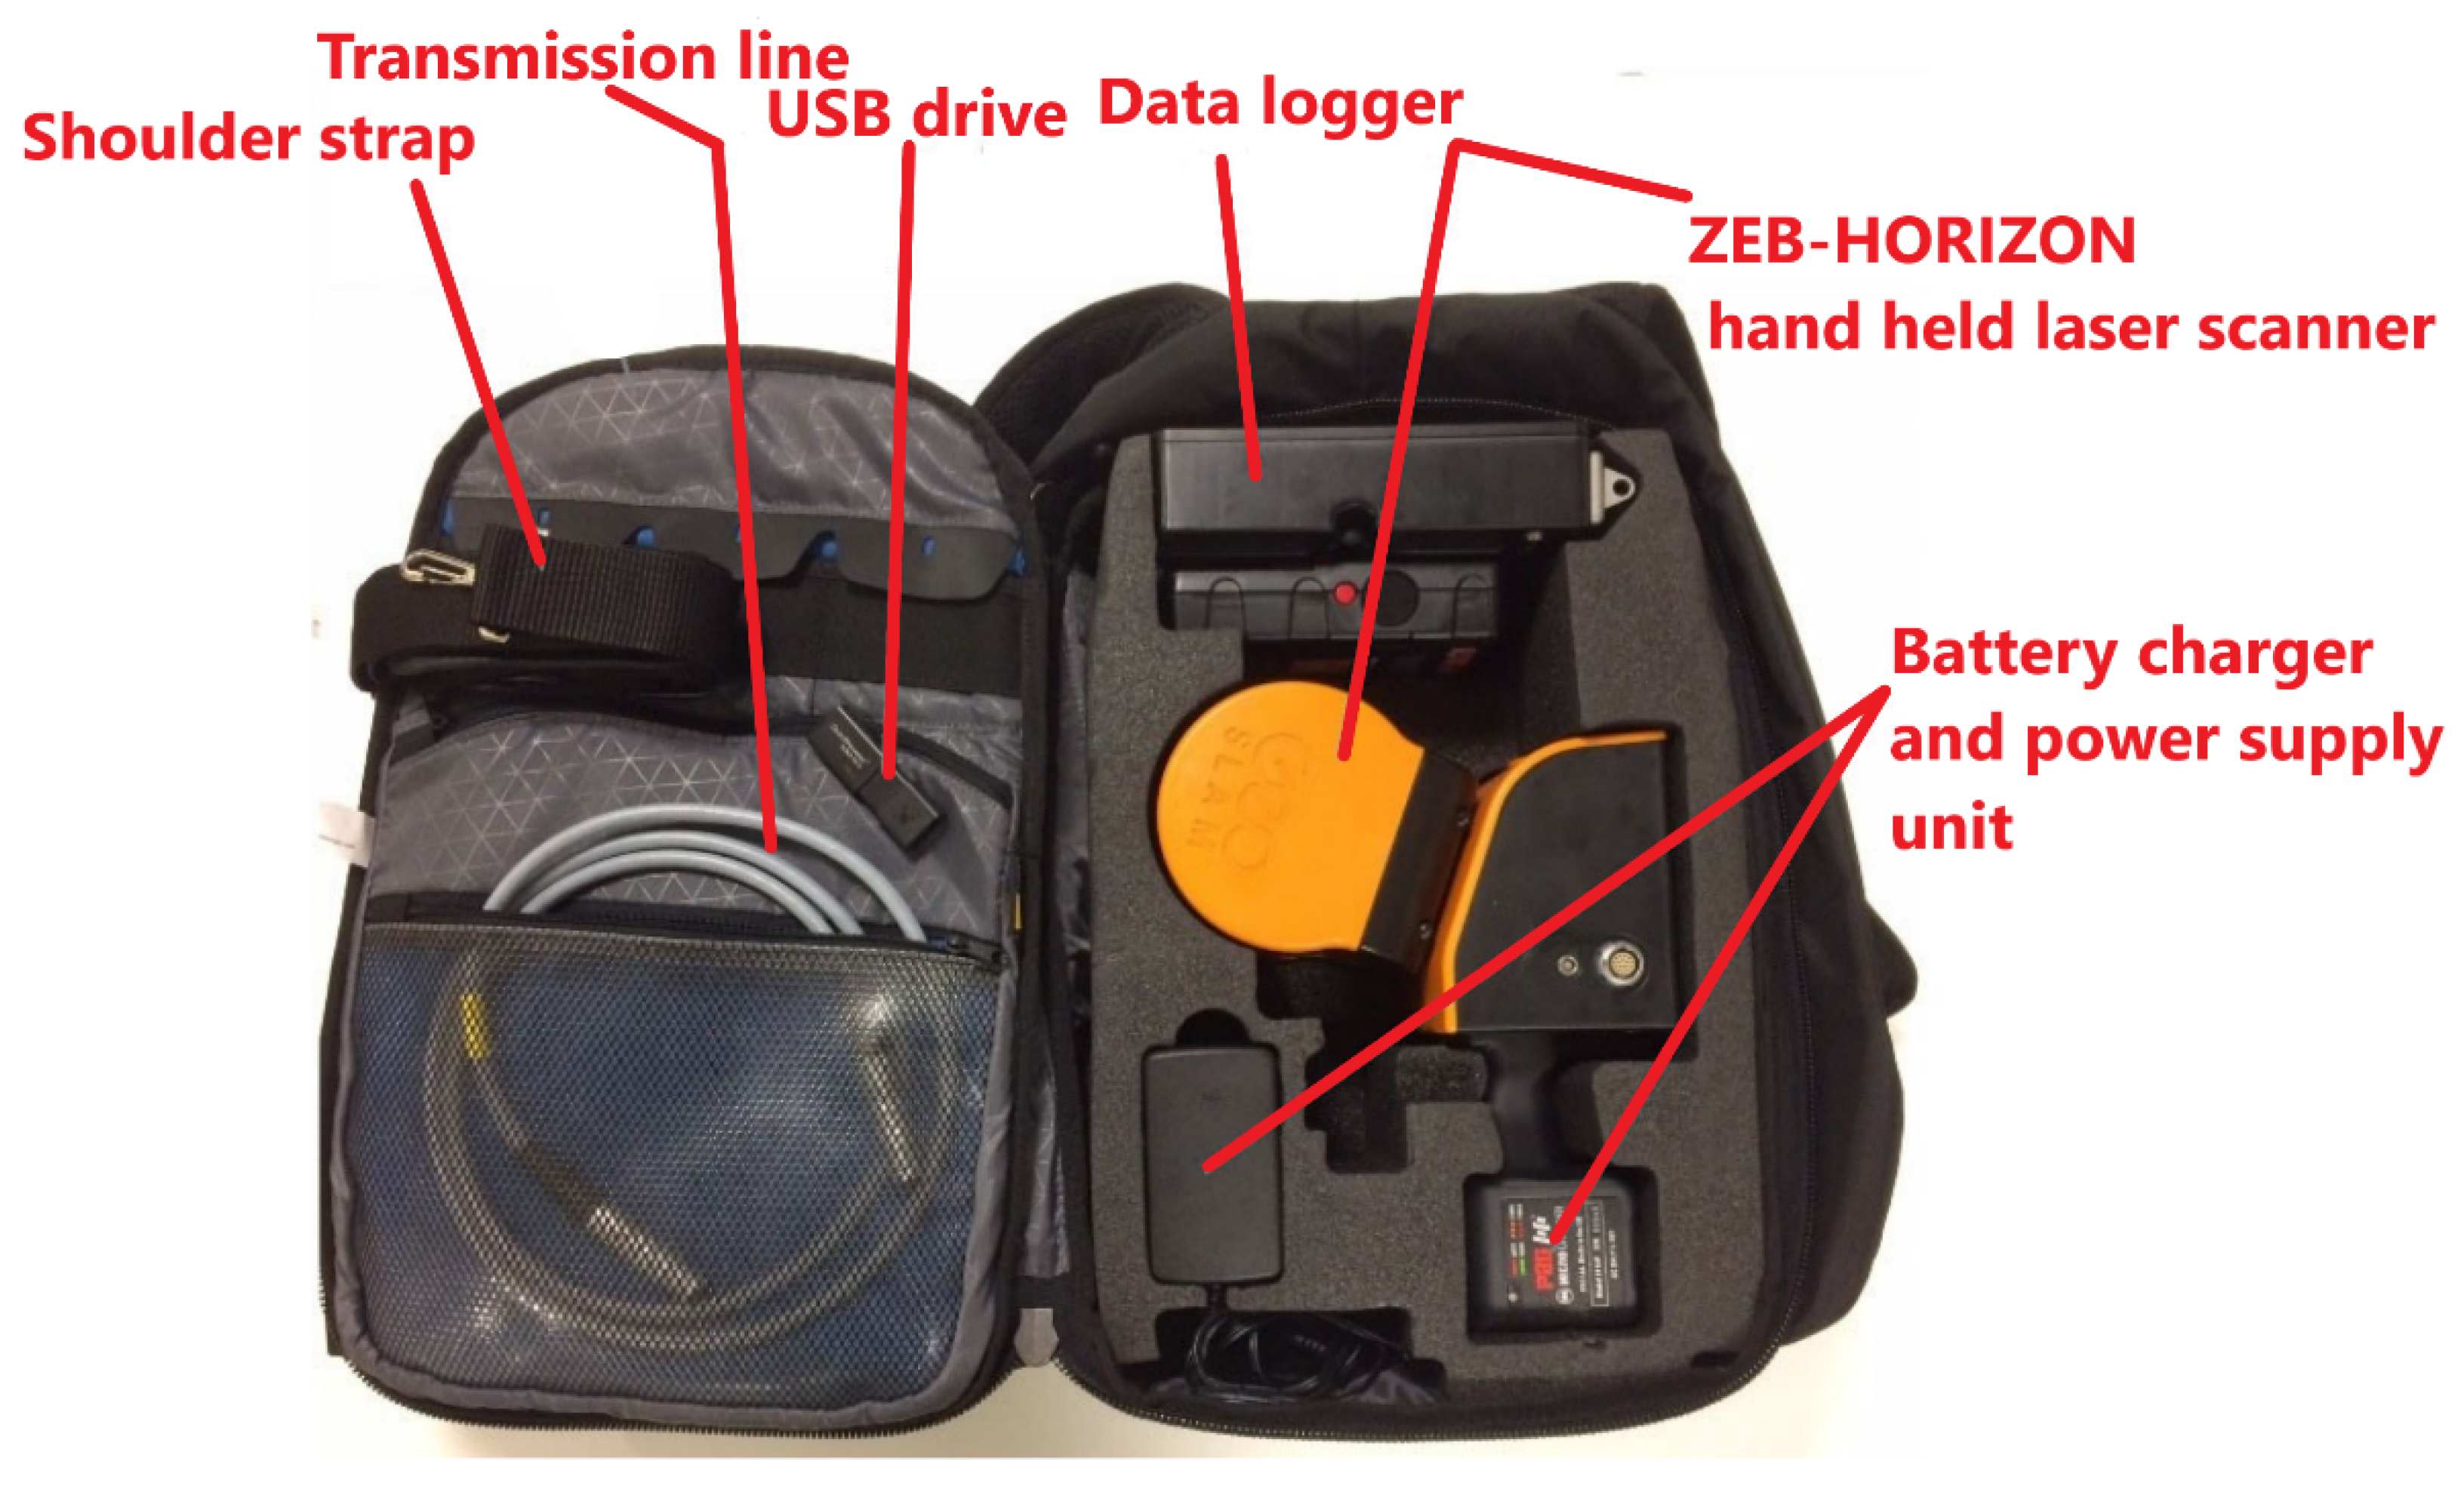
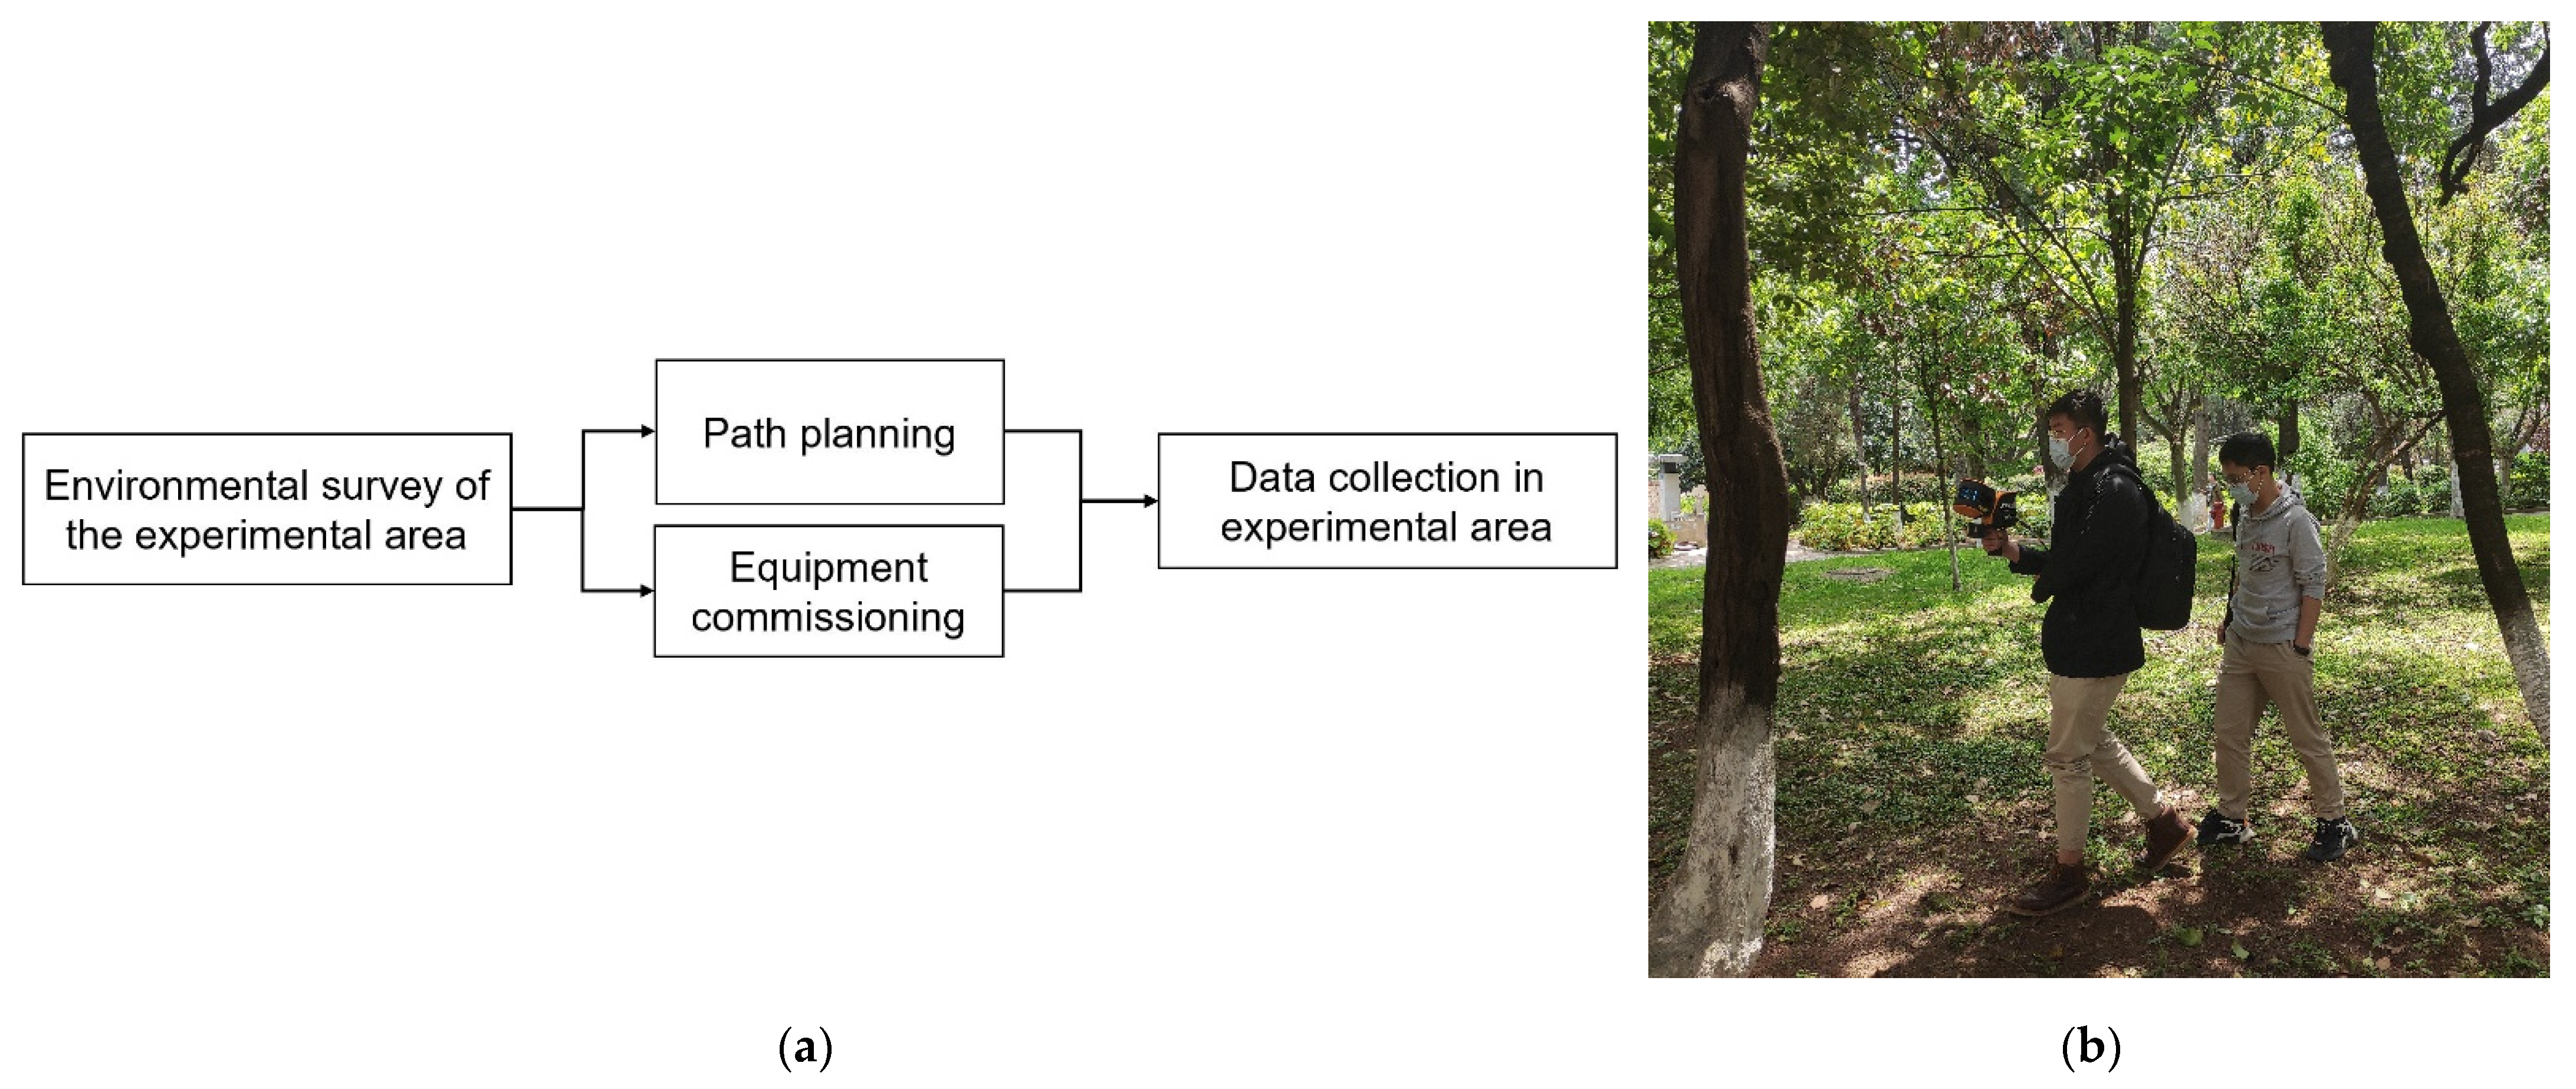
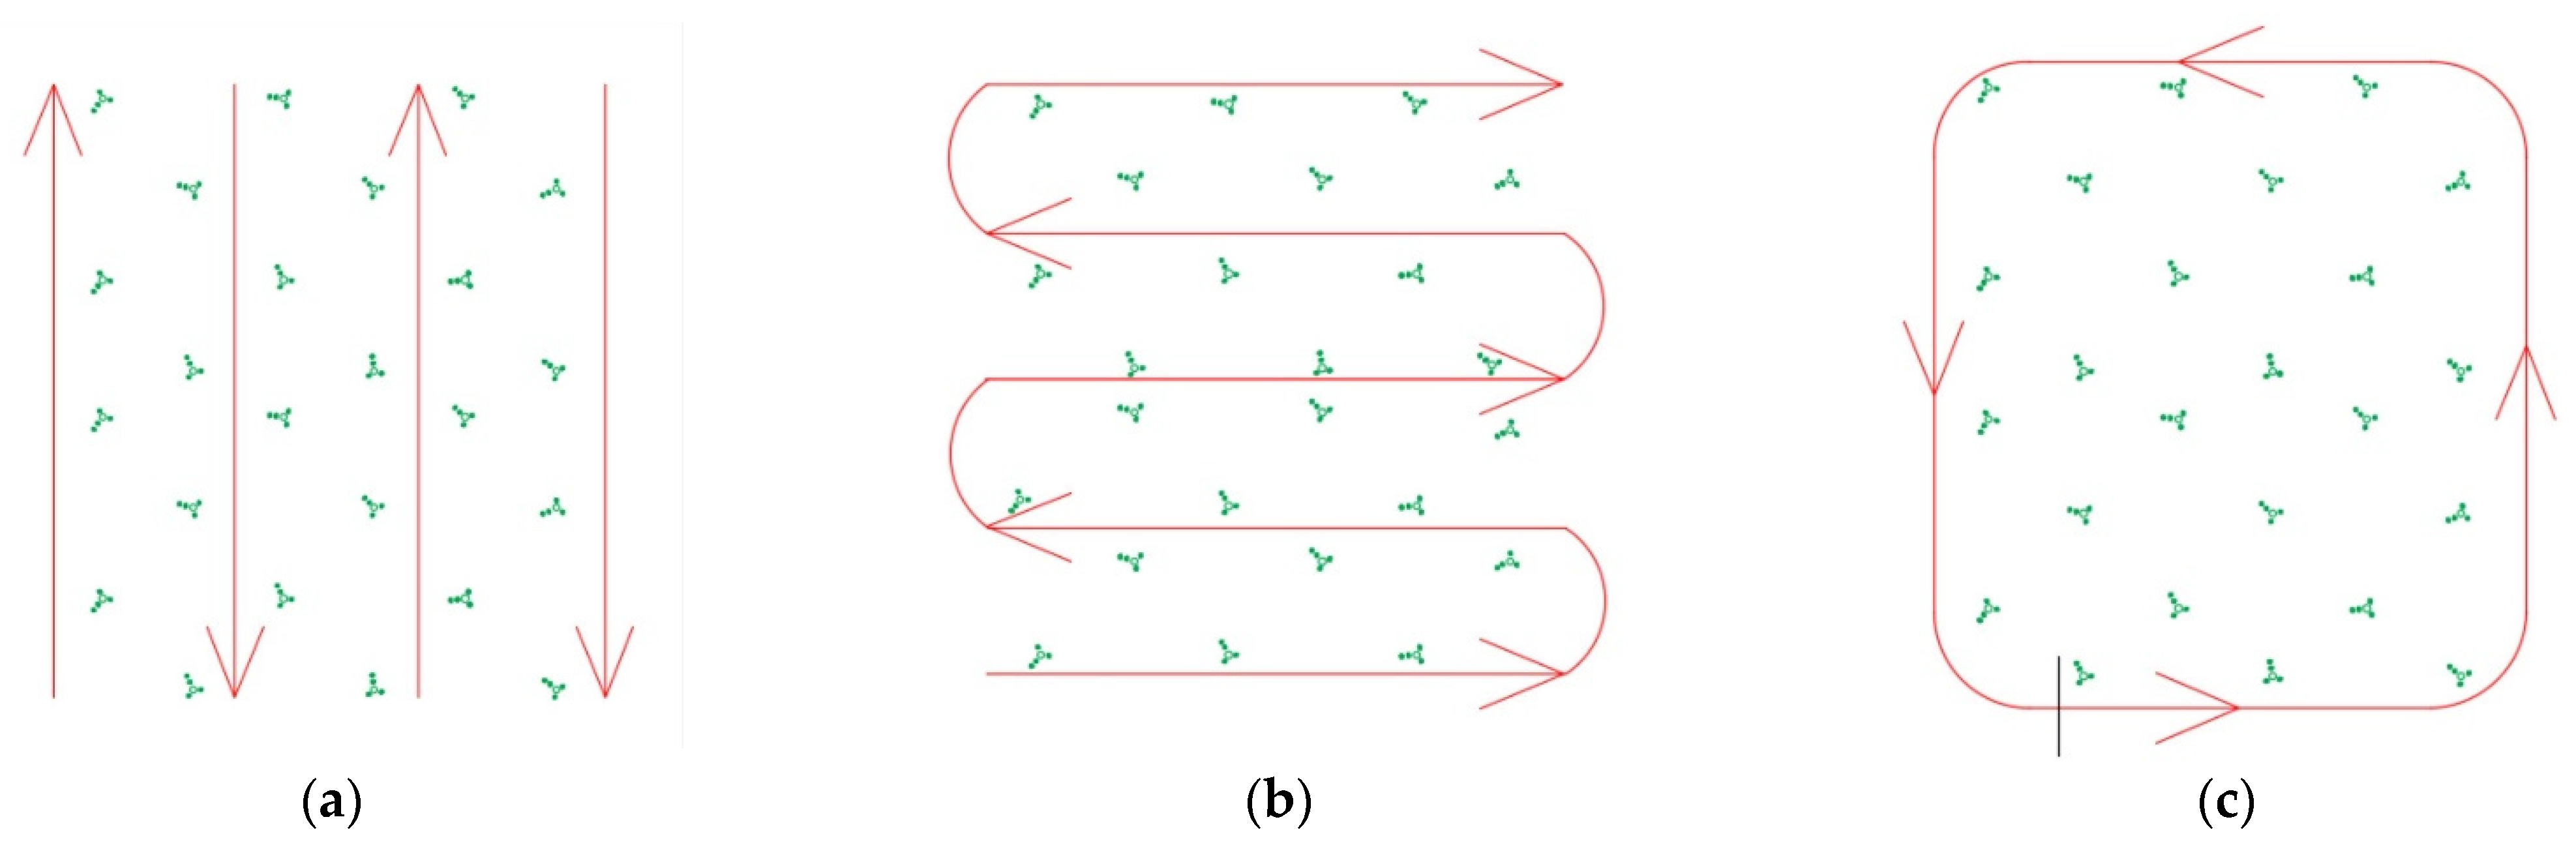
2.2.2. ZEB-HORIZON Data Acquisition

A ZEB-HORIZON 3D laser scanner of GeoSLAM was used to collect 3D point cloud data of the plantation in the experimental area. It is a mobile handheld scanner based on the 3D-SLAM algorithm, consisting of a 2D-TOF 16-thread laser rangefinder and an inertial measurement unit (IMU) rigidly coupled on a motor drive, which drives the rotation of the scanning head to acquire 3D spatial information of the scene. It is powered by a mobile power supply (as shown in Figure 4). It has a maximum measurement range of 100 m, a field of view of 360° × 270°, an overall scanning accuracy of ±3 mm, and can acquire 300,000 scanning points per second.
The scanner collects data by hand in the experimental area. Figure 5a shows the necessary procedures undertaken when constructing the 3D point clouds of the experimental area as a whole, including the environmental survey, path planning, equipment debugging, and data collection at the site. According to the distribution characteristics of plantations in this area, three different paths were planned for 3D point cloud data acquisition as shown in Figure 6. And the optimal path was selected through the path experiments.

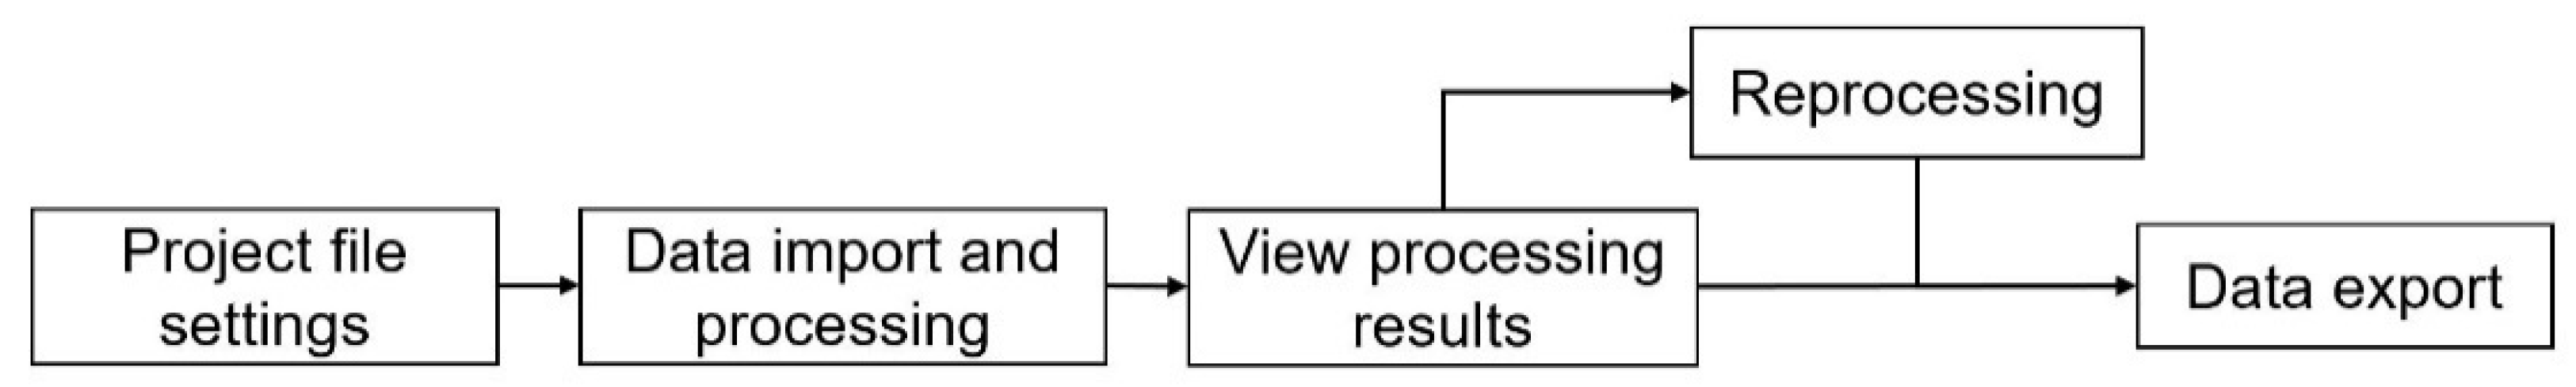
2.2.3. ZEB-HORIZON Data Processing

After data acquisition was completed, the data was processed based on the laser SLAM system. The process included: first, to perform point cloud registration on each key frame of the front-end point clouds collected in the scene; second, to calculate the distance of the motion and attitude change of the LIDAR, i.e., the visual odometry, based on the poses recorded in each key frame of the point clouds; third, to reduce the poses through back-end optimization, thereby reducing the cumulative error caused by the visual odometry; and finally, to construct 3D point clouds of the scene and perform loopback detection to constrain back-end optimization to reduce the cumulative error in the 3D space. The data collected by the ZEB-HORIZON scanner was processed and computed in the GeoSLAM Hub software. The data set of the experimental area was copied from the data logger through the USB disk equipped with the instrument, and the data set was imported into the GeoSLAM Hub software and processed automatically. The processed overall plantation point cloud data format was exported as the Las general format, which would provide basic data for subsequent 3D point cloud post-processing and extraction of tree parameters. Its data processing flow is shown in Figure 7.
The 3D point clouds of the plantation forest constructed under the three path plans of straight line path, S-shaped line path, and loop path are shown in Figure 8 and Figure 9. From the results of the straight line path (Figure 8a and Figure 9a), it is evident that there is an error in the solution of the laser odometer trajectory when the constructed point clouds of the plantation are processed by the GeoSLAM Hub software. The point clouds constructed do not present a straight line path, resulting in confusion of feature matching and not being able to correctly construct the point clouds of the plantation. The results of the S-shaped path (Figure 8b and Figure 9b) show that the laser odometer trajectories are crossed after being processed by the software, which leads to the misalignment of the point clouds in each key frame. This further results in the stratification of the plantation point clouds. The results of the loop path (Figure 8c and Figure 9c) show that the laser odometer trajectories of the loop path are correctly solved with the complete feature information of the plantation. Therefore, our experiment indicates that the GeoSLAM Hub software cannot solve the 3D point clouds of the plantation constructed by the straight-line path and the S-shaped line path, and the loop path is the best to obtain the 3D point clouds of the plantation.

2.2.4. Livox Mid-40 Data Acquisition

For the acquisition of 3D point clouds of large-scale plantations, the loop path planning alone cannot cover the whole area fully, with missing point clouds inside the plantation. Therefore, when planning the path of large-scale plantations, a combination of straight and loop paths is adopted. The ZEB-HORIZON scanner cannot acquire data under straight-line path planning (as shown in Figure 9a). In viewing the above problems, this paper has modified the Livox Mid-40 and constructed 3D point clouds through SLAM, in order to reduce the cost of data acquisition and obtain 3D point clouds of the target forest quickly. Livox Mid-40 LIDAR can be widely used in unmanned environment sensing, robot navigation, and high precision mapping, etc. It adopts non-repetitive scanning technology to obtain higher density point clouds, with a maximum range of 260 m. In this paper, the handheld data acquisition was carried out by adding a handheld grip to the lower part of the LIDAR and modifying the connecting battery to be carried on the shoulder, as shown in Figure 10a after modification. Using straight-line path planning, the LIDAR was first connected to the Ubuntu system and debugged, and then connected to the Ros system for handheld data acquisition, as shown in Figure 10b. The plantation of the experimental area was recorded in a data set in the form of a Rosbag through the Ros system, so as to facilitate the subsequent processing of the data set.

2.2.5. Livox Mid-40 Data Processing

The Rosbag dataset is reconstructed in 3D using the LOAM-Livox algorithm. In this paper, the Ubuntu system was equipped with Ceres optimization solver and PCL point cloud library. The LOAM-Livox algorithm was adopted to reconstruct the dataset of an experimental area in 3D. Its front-end point cloud alignment uses the NDT algorithm [23], with the alignment parameters [resolution:1 (side length of the cube at meshing); step_size:0.1 (the maximum step size); trans_epsilon:0.01 (sets the maximum difference allowed between two consecutive transforms); max_iterations:35 (the number of iterations for optimization)], the front-end real-time mapping uses voxel_filter voxel filtering [24] with the parameters of [0.1 0.1 0.1], and the back-end optimizer uses g2o [25] for graph optimization. The 3D construction of the experimental area (single-straight path) is shown in Figure 11. After each path was solved by LOAM-Livox algorithm in 6 datasets, registration was performed on the 3D point clouds constructed from 6 datasets. The Iterative Closest Point (ICP) algorithm [26] was used to align the point clouds of the six datasets, as Figure 12 shows before and after alignment.

2.2.6. Data Fusion Processing

After data acquisition and processing, the point cloud data collected by the ZEB-HORIZON scanner had a large number of redundant points and noise points. Thus, the CloudCompare software SOR filter was used to denoise the point clouds and crop the point clouds effectively. The results are shown in Figure 13.
The 3D point clouds of the plantation collected by a single data have certain deficiencies. Therefore, for the construction of large-scale plantation point clouds, data fusion (path fusion, as in Figure 14a) is performed to construct the complete plantation point cloud, with the ZEB-HORIZON scanner used mainly for collecting point cloud data (loop path) and supplemented by the Livox Mid-40 LiDAR (linear path). The two types of point cloud data were fused by the ICP algorithm. The fusion results are shown in Figure 14b.

3. Result and Discussion Section

To achieve carbon neutrality in the face of global climate change, forestry carbon sinks are the most economically feasible and promising approach at this stage. Accurate estimation of forest carbon storage in forestry carbon sink measurement is the basis of the entire carbon sink trade, and it is of great importance to study the role of forests in regional and global carbon cycles [27]. At present, the main methods for estimating forest carbon storage include sample plot inventory, the micrometeorological method, the remote sensing estimation method, etc. In this paper, carbon storage was estimated based on the sample plot inventory method by extracting the tree parameters of the plantation point clouds. As the name implies, the sample plot inventory method is to select typical sample plots in the inventory area, conduct continuous biomass observations on the sample plots, and apply different methods (such as all harvesting methods, volume-derived biomass method, dimensional analysis method, etc.) to derive carbon storages. The volume-derived biomass method calculates the biomass of a single tree by the allometric growth equation of tree species biomass that uses parameters such as tree height and diameter at breast height (DBH). The product of the calculated biomass and carbon content is the carbon storage of a single tree, and the carbon storage of a regional plantation is obtained by superimposing the carbon storage of every single tree. For tree 3D point cloud processing, tree parameters were extracted based on Lidar360 point cloud processing software. The forestry module based on the single tree segmentation algorithm [28] was used to obtain the tree height (referring to the distance from the lowest point of the rhizome at the bottom to the top of the tree), diameter at breast height (DBH is one of the most basic factors in the determination of standing trees, and was calculated by the diameter of the main branch at 1.3 m above breast height, and when this section was a deformed section, the minimum and maximum values were averaged [29]), crown diameter, volume (referring to the diameter of the main trunk of the tree and auxiliary branches above the main trunk), etc.
The point cloud processing software, based on Lidar360, firstly denoised the point cloud model after fusion. The denoised point clouds then classified the ground points, and changed the sparsity of the extracted ground key points by setting the upper and lower boundary thresholds, aiming to retain the sparse point set of ground key points and improve the speed of building the digital elevation model (DEM). After classification, a DEM was generated and normalized. Later, point cloud filtering was performed on the ground points with the final result shown in Figure 15. After ground classification, single tree segmentation was performed based on the canopy height model (CHM) segmentation algorithm. The segmentation results are shown in Figure 16.
After the single tree segmentation was completed, the point clouds of each tree were exported. Lidar360 point cloud processing software automatically extracted the center coordinates, tree height, canopy diameter, canopy area and canopy volume for each tree that was granted a unique ID number. The principle is to extract the point clouds near the 1.3 m height of each tree trunk at breast height, and use the least-squares method to fit a circle shape with the center of the single tree as its center and the diameter of the tree at breast height as its diameter. The point clouds of the single tree canopy were obtained by setting the threshold. And the obtained point clouds were used to construct the canopy model, where we obtained the diameter, projected area, and canopy volume of the single tree canopy. The extraction results of the experimental area are shown in Table 1.
To verify the accuracy of the extracted single tree parameters, we conducted an accuracy analysis on the single wood parameters extracted by the laser SLAM scanner lidar360 software and those extracted by manual measurement of the same tree, as shown in Figure 17.
When conducting the manual measurement, we used a standard measuring tape, and measure the tree’s perimeter at 1.3 m around the height at the breast height position with an accuracy of 0.01 m. The tree’s diameter at breast height was then calculated from the measured perimeter. The tree height was obtained by measuring the vertical angle and horizontal distance between the rhizome and the treetop in the same vertical direction using a total station. Taking the manual measurement value as the quasi-true value, we measured five trees separately and compared their accuracy with the point cloud tree parameters of Lidar360 software, and the analysis results are shown in Table 2.
The results of the accuracy analysis in Table 2 show that the obtained plantation point clouds extracted by Lidar360 software after single wood segmentation have a difference of diameter at breast height: ≤±0.5 cm and tree height: ≤+10% or −20%, compared with the manually measured ones, which can be used for carbon storage estimation.
We adopted the wood volume-derived biomass method in the sample plot inventory method to estimate the carbon storage of the plantation in the experimental area. According to the current standard of the “Guidelines for Carbon Sinks Measurement and Monitoring in Afforestation Projects” [30], the wood density of two tree species in the experimental area was calculated with reference to the national and IPCC carbon measurement parameters, i.e., camphor wood density is 0.460/tDM.m3 and that for cypress is 0.478/tDM.m3. According to the tree species classification method in the “Main Technical Regulations of National Forest Resources Inventory” and the allometric growth equation of national dominant tree species in the “Guideline for Measurement and Monitoring of Carbon Sink in Afforestation Projects”, the allometric growth equation was used to calculate the aboveground and underground biomass of camphor and cypress (refers to different equations for camphor and cypress calculation shown in Table 3 and Table 4).
After the completion of single wood segmentation, the biomass of a single tree was calculated by the equation of allometric growth equation of the dominant species of camphor and cypress, and the carbon stock was derived from the biomass. The conversion of biomass into carbon storage was calculated according to the proportion of carbon in the dry-weight organic matter of trees. The conversion rate varies among different tree species, but the overall difference is not significant, generally between 0.45 and 0.5. Since it was difficult to obtain the conversion rates of various tree species, the internationally used conversion rate of 0.50 was used in this paper [31,32]. The carbon storages of camphor and cypress calculated in this study are shown in Table 5 and Table 6.

4. Conclusions

Accurate estimation of carbon storage of a forest is the basis of carbon sink trading. The main estimation methods of carbon stock have their advantages and disadvantages, which enable them to be applied according to the actual situation. In this paper, we construct point clouds of plantation forests and obtain tree parameters for carbon stock estimation by laser SLAM technique. Our experimental results show that:
We tested three path plannings when using a ZEB-HORIZON handheld 3D laser scanner to obtain 3D point clouds of the plantation, and found the best path of the loop path. For a large range of plantation forests that do not allow the collection of the trees’ 3D point clouds completely, we used a modified Livox Mid-40 LIDAR handheld through a straight line path to reconstruct 3D point clouds based on the LOAM-Livox algorithm. The two point clouds were fused by the ICP algorithm to construct a complete and highly accurate 3D point cloud of the plantation. And Lidar360 point cloud processing software was used for single tree segmentation and parameter extraction, which were compared with the manually measured quasi-true value to test its accuracy. The analysis results showed that the parameters obtained can meet the conditions of carbon storage estimation. Finally, the biomass was calculated according to the allometric growth equation of different tree species, and the total carbon storage was calculated according to the international common conversion rate of 0.50. The total carbon storage was 6692.66 kg, with carbon storage of 1452.06 kg and 5240.60 kg for camphor and cypress, respectively.
The laser SLAM technology can quickly and accurately construct high-precision 3D point clouds of plantation forests. Point cloud processing software can automatically extract tree parameters, which could be further used to estimate carbon storage quickly. Since it is still difficult to classify tree species in the 3D point clouds, this method, in general, is only suitable for carbon storage estimation in single-species plantations or plantations with a uniform distribution of species. Our method has achieved a high accuracy of carbon storage estimation. This can make a reference to carbon storage estimation research in future.

Author Contributions

Conceptualization, H.T. and Y.X.; validation, H.T., C.L. and M.Y.; formal analysis, C.L.; resources, Y.X.; data curation, X.K.; writing—original draft preparation, H.T.; writing—review and editing, Y.X. All authors have read and agreed to the published version of the manuscript.

Funding

This work was financially supported by the National Natural Science Foundation of China (Grant Nos. 41861054).

Institutional Review Board Statement

Not applicable.

Informed Consent Statement

Not applicable.

Data Availability Statement

The data used to support the findings of this study are presented in the article. Further inquiries can be directed to the corresponding author.

Conflicts of Interest

The authors declare no conflict of interest.

References

  1. Valérie, M.; Panmao, Z.; Anna, P.; Connors, S.L.; Clotilde, P.; Sophie, B.; Nada, C.; Chen, Y.; Goldfarb, L.; Gomis, M.I. Climate Change 2021—The Physical Science Basis. Chem. Int. 2021, 43, 22–23. [Google Scholar]
  2. United Nations. Adoption of the Paris Agreement: FCCC/CP/2015/L.9/Rev.1; Paris United Nations Framework Convention on Climate Change; United Nations: New York, NY, USA, 2015. [Google Scholar]
  3. He, J.J. From Kyoto Protocol to Paris Agreement: The Start of a New Climate Governance Age. Chin. Rev. Int. Law 2016, 3, 77–88. [Google Scholar]
  4. Ding, M.L.; Yang, X.N.; Zhao, R.X.; Zhang, Z.; Xiao, L.; Xie, Z. Optimization of territorial space pattern under the goal of carbon neutrality: Theoretical framework and practical strategy. J. Nat. Resour. 2022, 37, 1137–1147. [Google Scholar] [CrossRef]
  5. Li, N.Y.; Gong, Y.Z.; Zhang, S.D. Forestry Carbon Sequestration Projects in China—A Synergized Strategy of Mitigation, Adaptation and Sustainable Development. World For. Res. 2006, 19, 1. [Google Scholar]
  6. Qing, G.W.; Tian, M.H. The Development Opportunities and Implementation Path of Forestry Carbon Sequestration under the Target of Carbon Peak and Carbon Neutrality. Adm. Reform 2022, 01, 45–54. [Google Scholar]
  7. Tian, X.; Sohngen, B.; Kim, J.B.; Ohrel, S.; Cole, J. Global climate change impacts on forests and markets—ScienceDirect. For. Policy Econ. 2016, 72, 18–26. [Google Scholar]
  8. Xu, S.S. A Review of Forest Carbon Storage Estimation Methods. For. Inventory Plan. 2014, 39, 28–33. [Google Scholar]
  9. Guo, J.; Lu, M.Y.; Zhang, D.Y.; Aimeti, Y.P.; Qi, C. Application progress of sample land inventory method in forest carbon sink estimation. Prot. For. Sci. Technol. 2016, 154, 102–103. [Google Scholar]
  10. Zhao, H.; Zheng, Y.F.; Li, S.; Yuan, Y.; Huang, J.Q.; Liu, J.; Cao, J.C. Observation and simulation of CO2 and O3 fluxes in the winter wheat field based on micrometeorological method. China Environ. Sci. 2020, 40, 1038–1048. [Google Scholar]
  11. Liu, C.; Li, X. Carbon Storage and Sequestration by Urban Forests in Shenyang, China. Urban For. Urban Green. 2012, 11, 121–128. [Google Scholar] [CrossRef]
  12. Xueyan, Z. Quick Aboveground Carbon Stock Estimation of Densely Planted Shrubs by Using Point Clouds Derived from Unmanned Aerial Vehicle. Remote Sens. 2019, 11, 2914. [Google Scholar]
  13. Li, C.H. Nondestructive Estimation of Above-ground Carbon Storage in Campus Street Trees based on Terrestrial Laser Scanning. Hortic. Seed 2022, 42, 44–48. [Google Scholar]
  14. Chen, Z.; Liu, Q.; Li, C.; Li, M.; Zhou, X.; Yu, Z.; Su, K. Comparison in linear and nonlinear estimation models of carbon storage of plantations based on UAV LiDAR. J. Beijing For. Univ. 2021, 43, 9–16. [Google Scholar]
  15. Simard, M.; Pinto, N.; Fisher, J.B.; Baccini, A. Mapping forest canopy height globally with spaceborne lidar. J. Geophys. Res. Biogeosciences 2011, 116, G04021. [Google Scholar] [CrossRef] [Green Version]
  16. Turner, D.; Wallace, L.; Lucieer, A.; Watson, C. Development of a UAV-LiDAR System with Application to Forest Inventory. Remote Sens. 2012, 4, 1519–1543. [Google Scholar]
  17. Sebastiano, S.; Antonino, M.; Gino, D.; Salvatore, L.V.D. Optimizing the Sampling Area across an Old-Growth Forest via UAV-Borne Laser Scanning, GNSS, and Radial Surveying. ISPRS Int. J. Geo. Inf. 2022, 11, 168. [Google Scholar]
  18. Tang, X.Z.; Liu, C.; Hu, X.Q.; Wang, C. Automatic extraction algorithm for buildings based on UAV lidar data. China Flood Drought Manag. 2015, 25, 67–71; 96. [Google Scholar]
  19. Durrantwhyte, H.F.; Bailey, T. Simultaneous localization and mapping (SLAM): Part II. IEEE Robot. Autom. Mag. 2006, 13, 99–110. [Google Scholar] [CrossRef] [Green Version]
  20. Zhang, J.; Singh, S. Low-drift and Real-time Lidar Odometry and Mapping. Auton. Robot. 2017, 41, 401–416. [Google Scholar] [CrossRef]
  21. Lin, J.; Zhang, F. Loam livox: A fast, robust, high-precision LiDAR odometry and mapping package for LiDARs of small FoV. In Proceedings of the 2020 IEEE International Conference on Robotics and Automation (ICRA), Paris, France, 31 May–31 August 2019. [Google Scholar]
  22. Ou, Y.S.H.; Liu, Z.Y.; Zhao, Y.W.; Qin, S.R.; Liu, X. Research on 3D Laser SLAM Algorithm of Mobile Robot. Microprocessors 2020, 41, 58–64. [Google Scholar]
  23. Magnusson, M. The three-dimensional normal-distributions transform: An efficient representation for registration, surface analysis, and loop detection. Renew. Energy 2009, 28, 655–663. [Google Scholar]
  24. Li, R.X.; Zou, W. Research on Point Clouds Filtering Algorithm Based on PCL Library. Satell. TV IP Multimed. 2020, 13, 237–238. [Google Scholar]
  25. Kummerle, R.; Grisetti, G.; Strasdat, H.; Konolige, K.; Burgard, W. G2o: A general framework for graph optimization. In Proceedings of the IEEE International Conference on Robotics & Automation, Shanghai, China, 9–13 May 2011; IEEE: Piscataway, NJ, USA, 2011. [Google Scholar]
  26. Besl, P.; Mckay, H.D. A method for registration of 3-D shapes. IEEE Trans. Pattern Anal. Mach. Intell. 1992, 14, 239–256. [Google Scholar] [CrossRef] [Green Version]
  27. Liu, Y.C.; Gao, X.L.; Fu, C.; Yu, G.; Liu, Z. Estimation of carbon sequestration potential of forest biomass in China based on National Forest Resources Inventory. Acta Ecol. Sin. 2019, 39, 4002–4010. [Google Scholar]
  28. Kaartinen, H.; Hyyppä, J.; Yu, X.; Vastaranta, M.; Hyyppä, H.; Kukko, A.; Holopainen, M.; Heipke, C.; Hirschmugl, M.; Morsdorf, F.; et al. An international comparison of individual tree detection and extraction using airborne laser scanning. Remote Sens. 2012, 4, 950–974. [Google Scholar] [CrossRef] [Green Version]
  29. Liu, W.L.; Lin, H.; Sun, H.; Yan, E. Based on the ground of 3d laser scanning technology analysis of forest tree diameter at breast height extraction algorithm. J. Cent. South Univ. For. Technol. 2014, 34, 111–115. [Google Scholar]
  30. LY/T 2253-2014; The State Forestry Administration of the People’s Republic of China. In Guidelines on Carbon Accounting and Monitoring for Afforestation Project. China Forestry Publishing House: Beijing, China, 2014.
  31. Zhou, Y.R.; Yu, Z.L.; Zhao, S.D. Carbon storage and budget of major Chinese forest types. Chin. J. Plant Ecol. 2000, 24, 518–522. [Google Scholar]
  32. Cao, M.; Woodward, F.I. Net primary and ecosystem production and carbon stocks of terrestrial ecosystems and their responses to climate change. Glob. Change Biol. 1998, 4, 185–198. [Google Scholar] [CrossRef]
Figure 1. 3D model diagrams of different technologies ((a) shows the 3D model of UAV; (b) shows the 3D model of airborne lidar).
Applsci 12 10838 g001
Figure 2. SLAM system flow chart.
Applsci 12 10838 g002
Figure 3. Overview of experimental area. ((a) shows the whole; (b) shows the part; (c) shows the geographical location of the study area).
Applsci 12 10838 g003
Figure 4. ZEB-HORIZON equipment diagram.
Applsci 12 10838 g004
Figure 5. Data acquisition flow chart. ((a) shows the flow chart of data acquisition; (b) shows the data collection of the experimental area).
Applsci 12 10838 g005
Figure 6. Path planning diagram. ((a) shows a straight path; (b) shows an S-shaped path; (c) shows a circular path).
Applsci 12 10838 g006
Figure 7. GeoSLAM Hub data processing flow chart.
Applsci 12 10838 g007
Figure 8. Cloud map of artificial forest points in three paths. ((a) shows straight-line path; (b) shows S-line path; (c) shows loop path).
Applsci 12 10838 g008
Figure 9. Laser odometer diagram of three paths. ((a) shows straight-line path error; (b) shows S-type line path error; (c) shows loop path).
Applsci 12 10838 g009
Figure 10. Equipment data acquisition diagram. ((a) shows the handheld modified LIDAR diagram; (b) shows the data acquisition diagram).
Applsci 12 10838 g010
Figure 11. 3D reconstruction of LOAM-Livox algorithm.
Applsci 12 10838 g011
Figure 12. ICP algorithm point cloud registration diagram. ((a) is before registration; (b) is after registration).
Applsci 12 10838 g012
Figure 13. Point cloud denoising and cropping diagram. ((a) shows before denoising and cropping; (b) shows after denoising and cropping).
Applsci 12 10838 g013
Figure 14. Data fusion diagram. ((a) shows path fusion; (b) shows point cloud fusion).
Applsci 12 10838 g014
Figure 15. Classification and normalization of ground points. ((a) shows the original point clouds; (b) shows the classification of ground points; (c) shows the filtering after classification of ground points).
Applsci 12 10838 g015
Figure 16. Single tree segmentation diagram. ((a) top view; (b) front view).
Applsci 12 10838 g016
Figure 17. Single wood information diagram of different methods. ((a) shows laser slam single wood point clouds; (b) shows manual measurement diagram).
Applsci 12 10838 g017
Table 1. Different parameters of single tree extraction.
IDXYTree Height
(/m)
DBH
(/m)
Crown Diameter
(/m)
Crown Area
(/m2)
Crown Volume
(/m3)
1−6.639−23.9019.1570.266.75335.82152.966
2−17.512−41.5958.1760.3774.14213.47310.274
3−14.129−45.48913.9730.2817.05439.083137.76
4−16.541−31.9459.6010.136.25430.724174.715
5−12.915−17.2618.8240.1815.8526.879131.372
34−10.108−11.9038.160.1425.42123.085119.332
35−11.635−47.42313.0840.1215.82926.683155.889
36−6.769−1.80216.0070.33512.502122.75702.865
37−7.792−4.0547.7460.223.3798.96534.196
38−0.715−1.31812.7760.31913.53143.768748.378
Table 2. Comparison of different parameters extracted by different methods from the same wood.
IDData SourcesH (/m)D-Value (/m)D (/m)D-Value (/m)Crown Diameter (/m)D-Value (/m)
9Manual measurement16.4600.33108.540
SLAM16.390.090.3370.0058.650.11
13Manual measurement7.8100.17405.630
SLAM7.870.060.1750.0015.800.17
15Manual measurement7.6300.29906.220
SLAM7.710.080.3040.0056.15−0.07
23Manual measurement5.6100.14906.050.02
SLAM5.640.030.1450.046.020.009
36Manual measurement15.9300.332012.540
SLAM16.010.080.3350.00312.50−0.04
Notes: D: DBH of trees, H: Tree height.
Table 3. Formula of aboveground biomass of camphor tree allometric growth equation.
Biomass GroupingAllometric Growth EquationBiomass GroupingAllometric Growth Equation
Tree trunk W S = 0.0556 ( D 2 H ) 0.850193 Leaf W L = 0.05987 ( D 2 H ) 0.574327
Branch W B = 0.00665 ( D 2 H ) 1.051841
Aboveground biomass W T = W S + W B + W L Wood density: 0.460/tDM.m3
Underground biomass W R = 0.218 + 0.007 ( D 2 H ) Total biomass W = W T + W R
Notes: D: DBH of trees, H: Tree height.
Table 4. Formula of aboveground biomass of cypress allometric growth equation.
BiomassAllometric Growth Equation
Aboveground biomass W T = 0.12703 ( D 2 H ) 0.79775 Wood density: 0.478/tDM.m3
Underground biomass W R = 0.1155 ( D 2 H ) 0.56696 Total biomass W = W T + W R
Notes: D DBH of trees, H Tree height.
Table 5. Calculation of camphor tree carbon reserves.
IDH/mD/cm W S / kg W L / kg W B / kg W T / kg W R / kg W CS /kg
1 9.16 26.00 93.06 9.01 64.73 166.80 43.55 210.35 105.17
2 7.87 17.50 41.73 5.24 24.00 70.97 17.09 88.06 44.03
3 13.97 28.10 152.11 12.56 118.88 283.55 77.45 361.00 180.50
35 16.01 33.50 230.22 16.62 198.51 445.34 125.96 571.31 285.65
367.75 22.00 60.76 6.76 38.20 105.71 26.46 132.17 66.09
3812.78 31.90 174.88 13.80 141.28 329.96 91.22 421.19 210.59
Sum 1284.03134.13887.862306.02598.092904.111452.06
Notes: CS is Carbon Storage.
Table 6. Calculation of cypress carbon reserves.
IDH/mD/cm W T / kg W R / kg W CS/kg
611.1230.10198.40320.71519.11259.56
79.8353.20445.891109.491555.38777.69
812.2253.20530.691351.611882.30941.15
2910.9828.30178.03273.89451.92225.96
3713.9728.90223.00357.80580.79290.40
3913.0812.1052.7742.6195.3847.69
Sum 3645.84 6835.37 10481.21 5240.60
Notes: CS is Carbon Storage.
Publisher’s Note: MDPI stays neutral with regard to jurisdictional claims in published maps and institutional affiliations.

