1. Introduction
Stability analysis and design are essential to safety in slope construction. Various traditional methods have been applied to slope stability analysis, such as limit equilibrium [
1], limit analysis [
2], numerical method [
3], and intelligent method [
4]. A field-testing program investigated five expansive soil slopes with different inclinations subjected to artificial rainfalls and calibrated based on a numerical model [
5]. The characteristics and prevention mechanisms of artificial slope instability were explored with field investigation in a typical watershed using a neural network [
6]. The soilbag-protected slopes in expansive soils were designed to consider the swelling pressure based on the balance between the soilbag friction and the active lateral earth pressure [
7]. A limit analysis was used to evaluate the stability of expansive soil slopes stabilized by anchor cables based on the kinematic limit analysis theorem [
8]. The uncoupled and hydro-mechanical coupled analyses were conducted to deal with the hydraulic and hydro-mechanical responses of the surficial layer of soil slopes [
9]. However, the traditional slope stability analysis does not deal with uncertainty. Obviously, this does not conform to the reality of slope engineering. Uncertainty is the intrinsic feature of slope engineering due to the complex property of geomaterials, complicated and changeable geological conditions, unclear failure mechanisms, etc. How the uncertainty to deal with is one of the biggest challenges in slope engineering.
Recently, many researchers have paid more attention to the uncertainty analysis of slope [
10]. The reliability analysis method has been widely used in slope stability analysis for considering the uncertainty in the past decades [
11,
12,
13,
14,
15,
16,
17]. Li et al. integrated the random finite element method (RFEM) with an advanced Monte Carlo Simulation and developed an efficient RFEM for the reliability analysis and risk assessment of soil slopes [
18]. Various reliability methods have been developed for slope reliability analysis such as first order second moment (FOSM) [
19,
20], first-order reliability method (FORM) [
19,
20,
21,
22,
23], and second-order reliability methods (SORM) [
21,
24]. A Bayesian approach was developed to characterize the soil–water retention curve and hydraulic conductivity and was illustrated through a slope example [
25]. The above methods need the gradient of the limit state function. However, it is difficult to obtain the explicit limit state function for practical slope engineering. To overcome this problem, the response surface method (RSM) has been developed to estimate the reliability of slopes by combining it with stability analysis methods such as the limited equilibrium method, or the numerical method [
23,
26,
27,
28,
29]. A genetic algorithm optimized Taylor Kriging surrogate model was developed for the system reliability analysis of soil slopes [
30]. Li et al. reviewed the application of RSM in slope reliability analysis [
31]. Polynomial-based RSM was commonly used in slope reliability analysis which is time-consuming when practicing engineering problems dealing with a high-order polynomial. Other methods, such as artificial neural networks (ANN), support vector machines (SVM), and Relevance vector machine (RVM) overcome this problem [
20,
24,
32,
33,
34]. Those methods have the advantage of providing high-order approximations with fewer samples than polynomial functions of comparable order; however, they have some inherent drawbacks, such as their slow convergence, a less generalized performance, arriving at a local minimum, over-fitting problems, and the selection of a suitable kernel function. The limits of the above reliability methods hindered the application of the reliability method to practical geotechnical engineering.
The moment methods have been the most popular method to find an approximate solution in uncertainty analysis [
35]. The idea is to calculate the first four moments of the response to back calculate the parameters of the distribution [
35,
36,
37]. Discovering what is the moment computation of response is not an easy task due to the distribution type assumed and the lack of a unique solution [
38]. To overcome this problem, the dimensional reduction method was adopted to compute the statistical moments [
39]. MDRM provides an excellent way to determine the function moment based on the multiplicative form of the dimensional reduction method. FOSM is a commonly used reliability method based on the first and second moment of the limit state function, which can be obtained based on MDRM.
This study proposes a new reliability analysis approach that combines the merits of the MDRM and of FOSM. MDRM is used to approximate the limit state function. The statistical moment was estimated based on an MDRM model. FOSM was adopted to compute the reliability index of a slope. The remainder of this study is structured as follows. In
Section 2, the FOSM algorithm was reviewed.
Section 3 introduces the basic theory of MDRM- and MDRM-based moment computations, and the MDRM-based reliability analysis method was developed, and the procedure was presented in detail. Some applications of the proposed method for reliability analysis of slopes were presented in
Section 4. Some conclusions were given in
Section 5.
2. First Order Second Moment (FOSM)
The limit state function of slopes may be established as follows:
where
n is the number of random variables;
Xi (
i = 1, 2, …,
n) are the random variables in the slope reliability analysis; g(
X1,
X2,
X3, …,
Xn) is the limit state function; Z > 0 indicates that the slope is stable, Z < 0 indicates that it has failed, and Z = 0 means that the boundary is hovering between stable and unstable.
F(
X1,
X2,
X3, …,
Xn) is the safety factor of slope.
The mean and variance of the limit state function using the first-order approximation can be calculated using
where
cov(
Xi,
Xj) is the covariance of
Xi and
Xj,
μz is the mean value of the limit state function Z, and σ
2z is the variance of Z (σ
z is the standard deviation of Z). Consequently, the reliability index in slope safety analysis was evaluated as follows based on FOSM:
where
β is the reliability index in slope stability analysis. The key step is to calculate the statistical moments of the limit state function, i.e., the mean value
μz and the standard deviation σ
z. In the calculation of
μz and σ
z, the values of the safety factor of slope and the corresponding first-order partial derivatives are needed according to Equations (2) and (3). However, it is difficult to obtain it in the practical slope engineering. Based on the reliability index, the probability of failure can be evaluated from
where Φ is the cumulative distribution function of the standard normal variable.
For most stability analysis methods for slopes, the factor of safety will be calculated using a numerical method and cannot be represented as an explicit function of the random variables. It is difficult to calculate the partial derivatives of the limit state function in slope reliability analysis. However, the partial derivatives are indispensable for the FOSM method in reliability analysis. To overcome the above difficulty, MDRM, which avoids determining the limit state function and their partial derivatives, was adopted to determine the moment of the slope safety factor. Once the first and second moment of the limit state function was determined, FOSM could be utilized to evaluate the slope reliability based on Equation (4) using MDRM.
3. Dimensional Reduction Method and Moment
The safety factor of a slope can be evaluated as a function of input variables, such as rock mechanical parameters, in situ stress, etc., which is denoted as
where
y is the safety factor of slope and
X is the vector of input random variables. According to the MDRM algorithm, Equation (6) can be represented by a multiplicative of the low dimensional function [
40]. Based on the FOSM, the reliability index can be obtained based on the first and second moments. In this study, the moment of Equation (6) could be calculated using the MDRM. The primary idea of MDRM could be presented in the following.
3.1. Multiplicative Dimensional Reduction Method
For MDRM, the response function
y = g(
X) is evaluated with respect to a reference fixed input point, known as the cut point, with coordinates
c.
where
c1,
c2, …,
cn corresponds to the mean value of each random variables
x1,
x2, …,
xn. Thus, an
ith cut function is obtained by fixing all the point random variables, except
xi, at their respective cut point coordinates, which are generally chosen as the mean values (
c1,
c2, …,
cn) such that
According to the MDRM method [
41], the response function is approximated in a multiplicative form as
where g
i(·) is called the cut component function. For the detailed explanations, algorithm, and procedure of MDRM, some literature [
39,
40,
41] can be referenced.
3.2. Evaluate the Statistics Moment Based on MDRM
Based on the MDRM model, a
kth statistics moment of response can be approximated as
where the mathematical exception operation is denoted as
E[ ] and for
k = 1,
E[
yk] =
E[
y] is the mean value of
y. Assuming that all input random variables are independent, the above equation can be written as
Based on the Equation (10), the first and second moment of response can be approximated as
Then, the standard deviation of response can be obtained as
where
σy is the standard deviation of the response such as the safety factor of slope. The computation of the mean and any other
kth moment of response requires the calculation of a
kth moment of all the cut functions through one-dimensional integration. The numerical integration can be significantly optimized using the Gauss quadrature formulas. A
kth moment of an
ith cut function can be approximated as a weighted sum.
where
L is the number of the Gauss quadrature points,
xj and
wj are the coordinates and weights, respectively, of the Gauss quadrature points (
j = 1, …,
L) and
hi (
i = 1, 2,…,
n) is the response when
ith cut function is set at
jth Gauss quadrature point.
Obviously, MDRM could determine the moment of the response function and avoid determining the response function and its partial derivatives, which is a challenging task for the traditional response surface method using FOSM.
4. MDRM-Based Reliability Analyses
In this study, MDRM was adopted to represent the implicit, high-dimensional, and nonlinear relationship between random variables and safety factors of a slope to improve the efficiency. The statistics moment of safety factor was estimated based on MDRM. The mean and standard variation of the safety factor was computed based on the statistics moment. FOSM is used to determine the reliability index of the slope. To the practical slope engineering, the slope stability model was built based on numerical methods such as limit equilibrium theory, finite element method, discrete element method, etc. Then, the following contents was used to determine the moment of slope safety factor and compute the reliability index.
4.1. Determine the Input Grid
It is difficult to approximate the relationship between the safety factor and its influence factor (random variables) because the limit state function is a nonlinear, high-dimensional, and implicit function. In this study, we used MDRM to approximate the limit state function. To determine the MDRM model, the cut component function needs to be computed based on some known safety factors of a slope. The known safety factors were created for this work by using numerical or analytical analysis, which is used to obtain the safety factor of slope according to the input grid (random variable combinations). For this study, the Gauss quadrature was adopted to construct the input grid.
Table 1 has listed the Gauss point and Gauss weights of five-order rules of Gauss quadrature.
4.2. Determine the MDRM Model and Statistics Moment
Once the input grid was determined, the numerical method was used to compute the safety factor of a slope at each point in the input grid. Each of the cut component functions can be determined based on the input grid and corresponding safety factor. The MDRM model of limit state function can be represented by Equation (9). Once the MDRM model of a limit state function has been obtained, the statistics moment of safety factor can be calculated by Equation (15). The numerical integration procedure for the kth order moment can be calculated using the Gauss quadrature scheme.
4.3. Determining the Reliability Index and Failure Probability
According to FOSM, the reliability of the slope can be determined based on the mean value and standard deviation of the safety factor. Through combining FOSM and MDRM models, the reliability index can be expressed in the following form.
Once the reliability index has been obtained, the failure probability of slope can be estimated using Equation (5).
4.4. The Procedure of Reliability Analysis for Slope
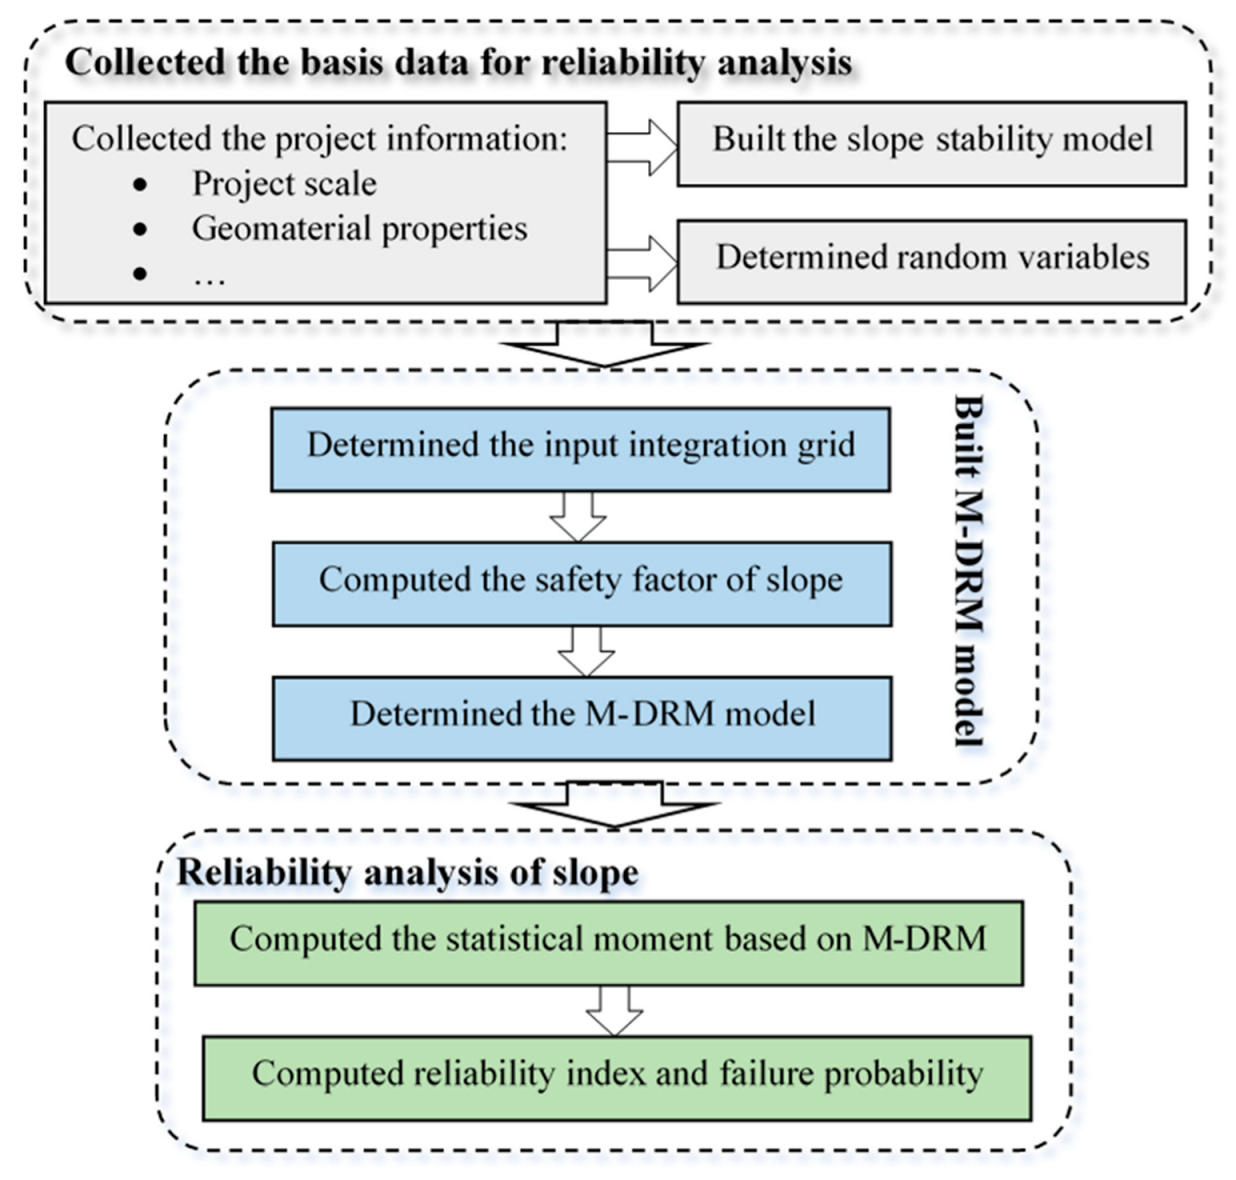
The reliability index and probability failure of the slope was determined through combining MDRM and FOSM. MDRM is adopted to approximate the high dimensional and implicit limit state function. FOSM is used to estimate the reliability index and probability failure of slope. In this process, the Gauss quadrature scheme was used to build the input integration grid and compute the statistics moment. The procedure was shown in
Figure 1 and is explained below.
Step 1: Collect the slope engineering information, such as geological conditions, project scale, geomaterial mechanical parameters, in situ stress, etc.; determine the numerical or analytical model of slope stability analysis.
Step 2: According to the information collected in Step 1, determine the random variables and their statistics property.
Step 3: Construct the input integration grid for MDRM based on Gauss point and compute the corresponding safety factor of a slope using a numerical or analytical method.
Step 4: Compute the statistics moment of safety factor based on the MDRM model.
Step 5: Determine the reliability index and probability failure of a slope using FOSM.
The above procedure includes slope stability analysis (computing slope safety factor, determining the input grid, constructing MDRM model, computing moment based on MDRM and computing the reliability index. Obviously, input grid can be easily obtained based on
Table 1. Then, the MDRM and moment can be obtained through repeating slope stability analysis. Finally, Equation (16) was used to determine the reliability index. The proposed method is perfectly consistent with slope stability analysis in practice.


