3.1. Advanced CS Algorithm
The conventional CS algorithm, which repeats the above process to perform optimization, performs exploration and exploitation according to the size of
, mainly using 0.1 for
. That is, the conventional CS algorithm mainly performs the exploitation rather than the exploration.
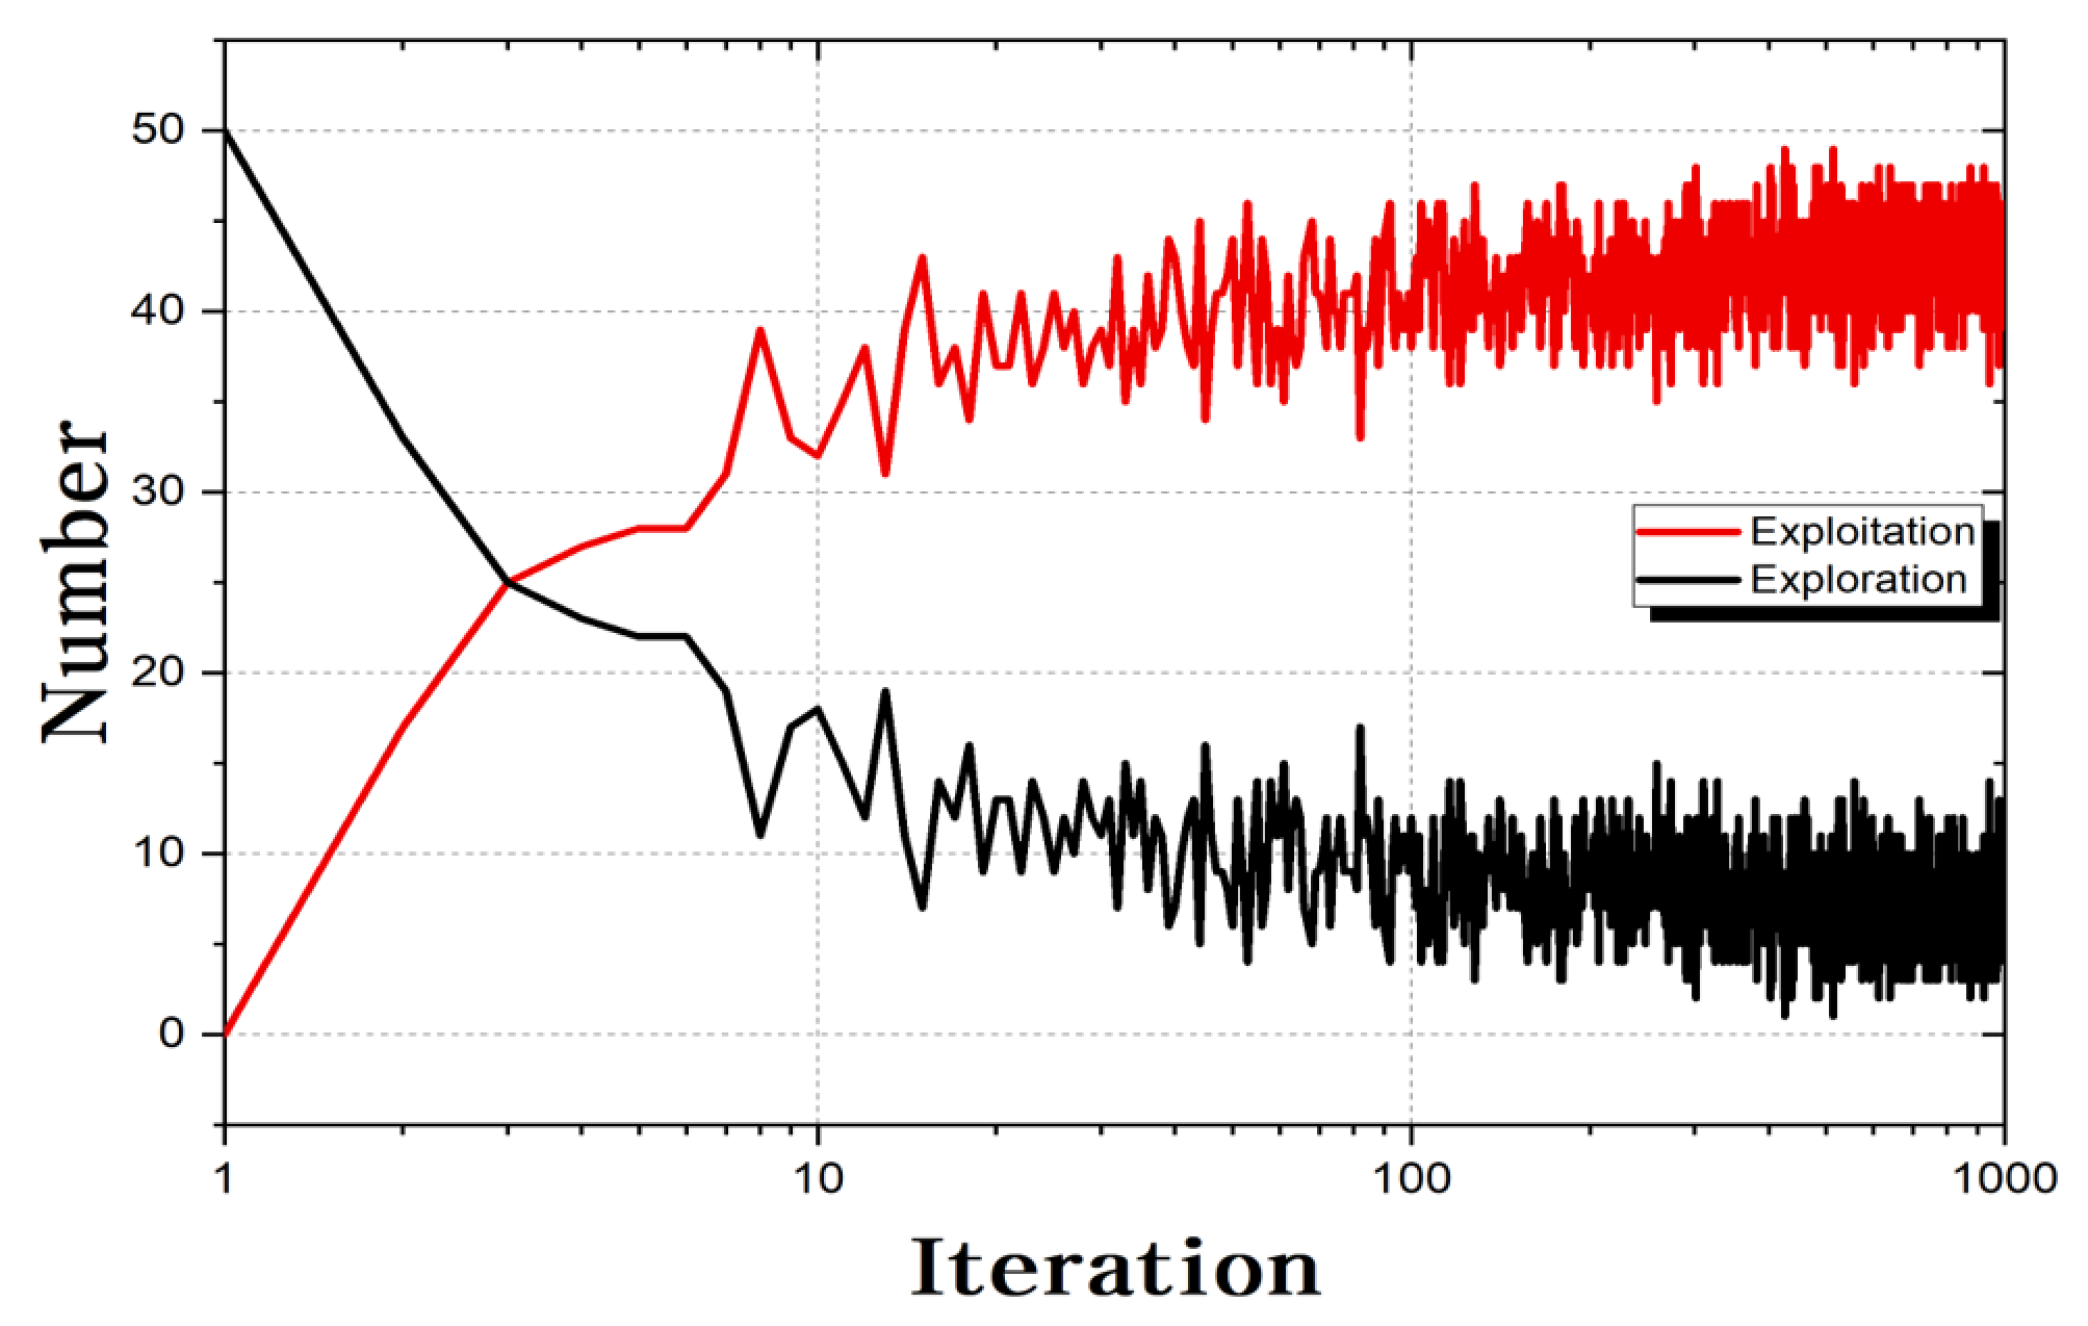
Figure 3 is a diagram showing the exploitation and exploration that occurs in the process of optimizing the Sphere function for 1000 generations of the conventional CS algorithms with a
N of 50. It can be seen that exploitation mainly occurs in all generations. Optimization algorithms that mainly use excitation in optimization performance are likely to fall into local minima [
10], and the performance of the conventional CS algorithms is largely dependent on the initial population. In this paper, to address this problem, we improve the performance of the initial population using dynamic
that varies dynamically with the number of generations, and the performance of exploitation and exploration using two proposed equations.
Similar to the conventional CS algorithm, the ACS algorithm consists of a total of five steps.
Step 1. Define the problem and set the parameters
Like the conventional CS algorithm, the problem for performing optimization is defined in Step 1, and the parameters used in the ACS algorithm are set. The parameters added in the ACS algorithm are , , and (Flight Awareness Ratio). Here, and are used for dynamic .
Step 2. Initialize the memory of crows and evaluate
The size of the crew group used in the ACS algorithm is expressed as Equation (
1) as in the conventional CS algorithm, and the initial position is remembered as Equation (
2). The initial position of the remembered crow is evaluated by the objective function.
Step 3. Generate and evaluate the new positions for crows
The ACS algorithm displays the biggest difference from the conventional CS algorithm in Step 3. First, The ACS algorithm uses dynamic
, which changes dynamically with the number of generations. dynamic
uses Equation (
9) for dynamic changes, and
and
have a value between 0 and 1.
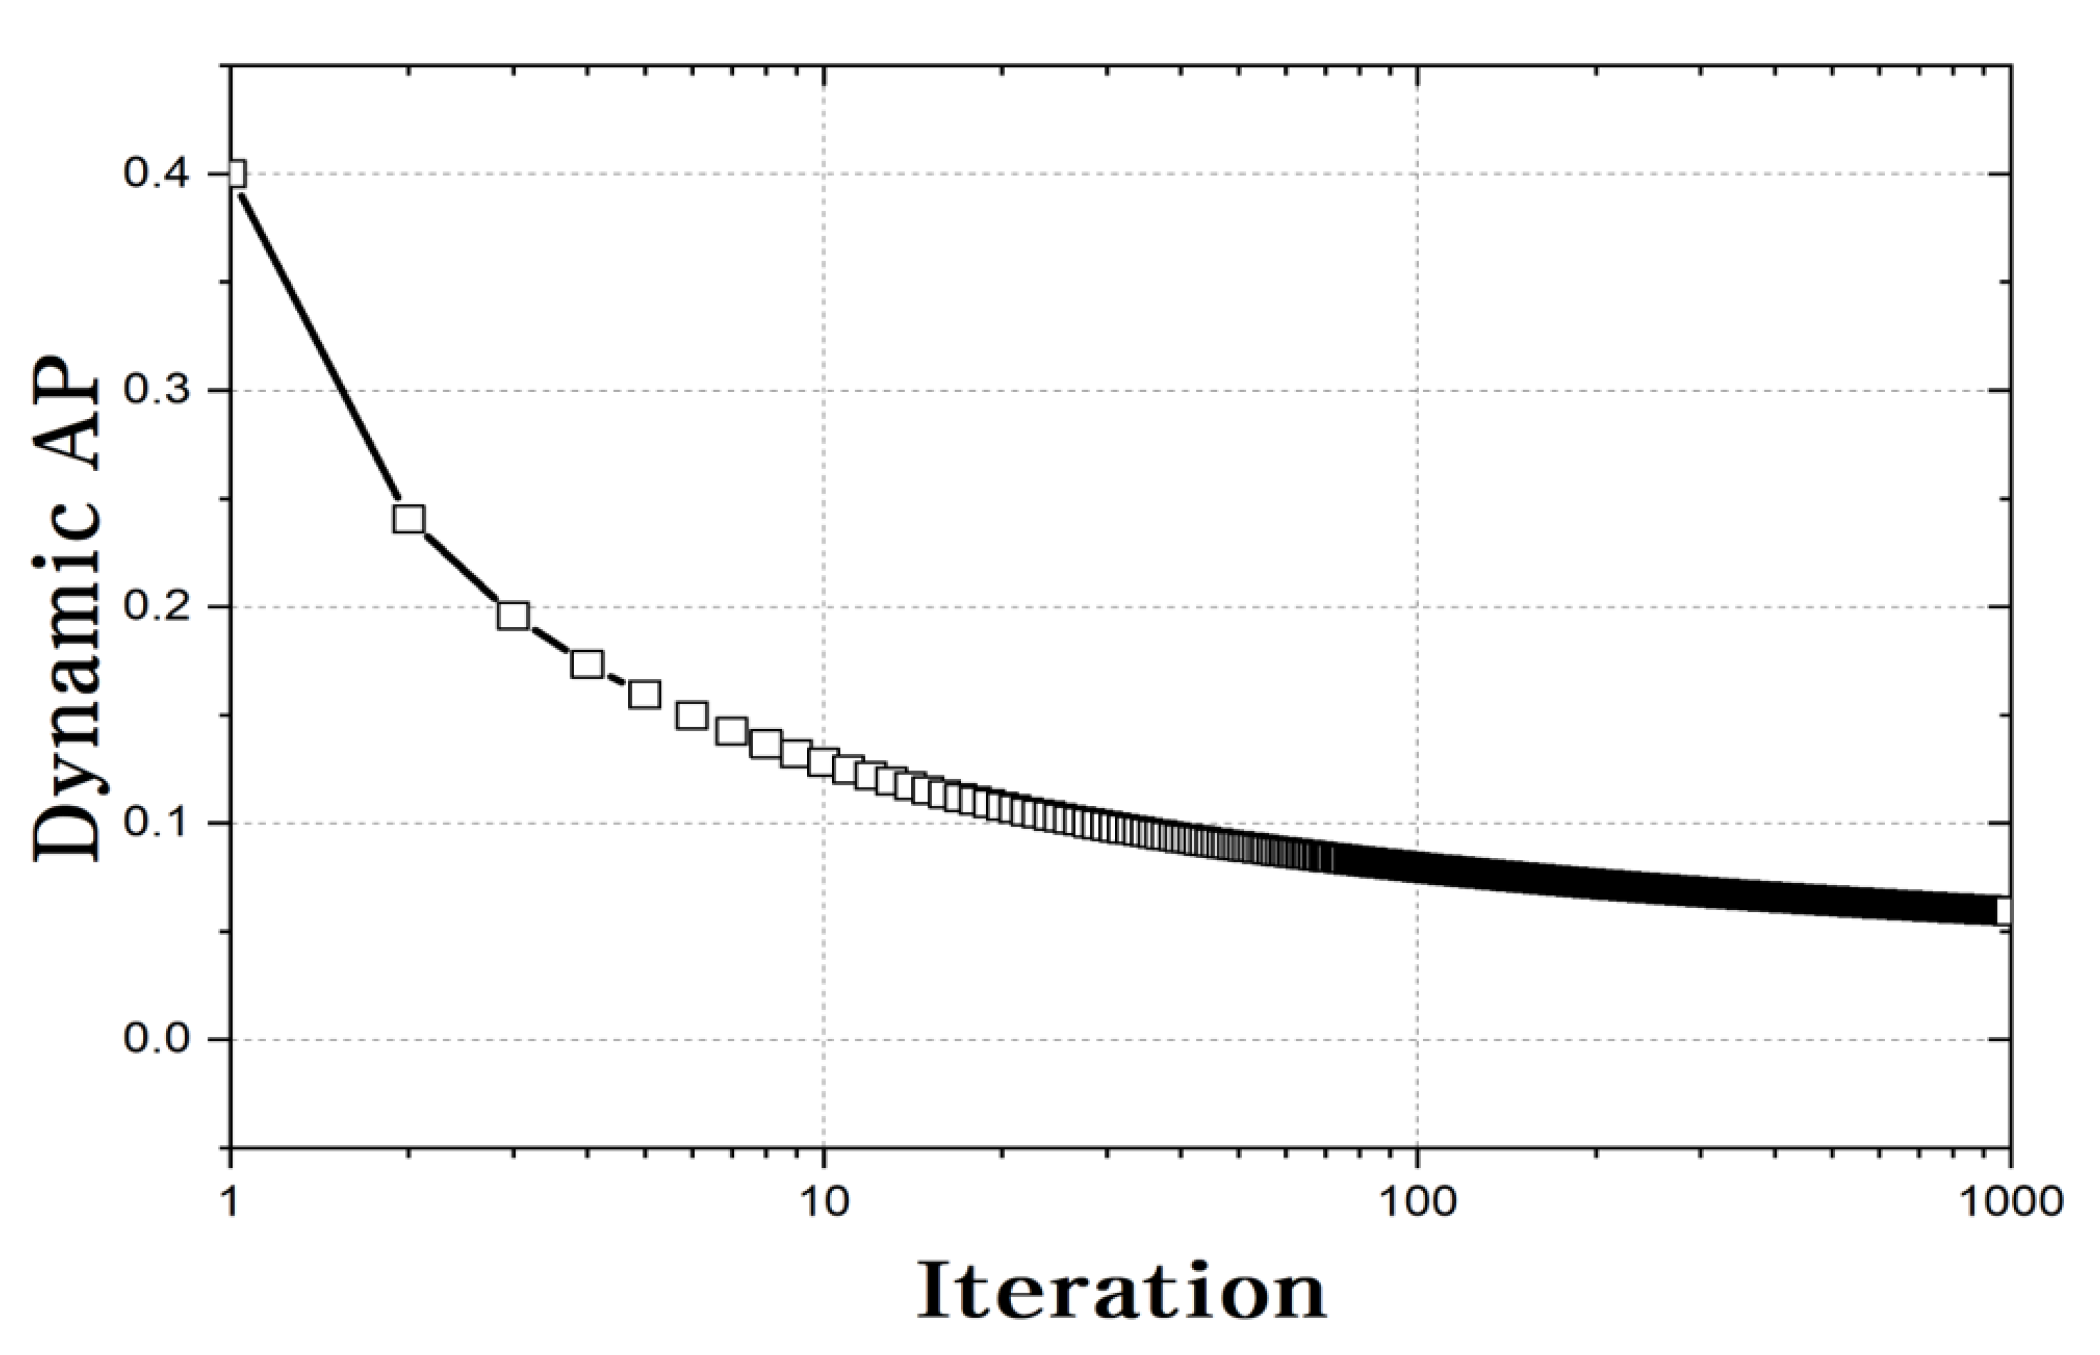
Figure 4 shows an
that changes dynamically according to the number of generations when
is 2000. Using dynamic
, as shown in
Figure 5, increases the probability of exploration at the beginning of the generation, which can increase the performance of the initial population. Compared to
Figure 3, the number of explorations increases at lower numbers of generations. Thus, the larger the
AP, the higher the probability of the initial population performing exploration, and the smaller the
AP, the higher the probability of performing exploitation. In addition, a dynamic
of an appropriate size is required for harmony between exploitation and exploration.
Second, unlike the conventional Equation (
3) in which crow
i follows randomly selected crow
j (
), in the ACS algorithm, it follows the best crow
j (
) by
. This can be expressed as Equation (
10). Here,
,
is a random number between 0 and 1, and
is an initial set value between 0 and 1. The change in this equation improves the exploitation performance compared to the conventional CS algorithm. If
approaches 0, it follows the best solution stored in the crow’s memory. Conversely, when
approaches 1, it follows a randomly selected crow, just like the conventional CS algorithm. Therefore, using the appropriate
, it is possible to improve the convergence performance of the optimization algorithm by harmonizing the exploitation and exploration.
Third, using this algorithm, the exploration phase of the conventional CS algorithm was improved. The conventional CS algorithms are randomly adopted in the
and
ranges if the random number is less than the
. That is, global search is mainly performed. The global search can contribute to the convergence performance of the algorithm because it searches a large area at the beginning of the generation. However, it does not contribute significantly to the convergence performance of the algorithm as the generation progresses. Therefore, the process of reducing the range that can be selected toward the end of the generation was added as Equation (
11), which allows the ACS algorithm to perform a local search. Here,
and
are random numbers between 0 and 1.
Figure 6 illustrates this method.
Step 4. Update the memory
The results are compared through evaluation of the crow position change by Equation (
3), Equation (
4) with the evaluation of crows stored in memory. Comparing the evaluation results, the better crow position is updated in the crow’s memory.
Step 5. Termination of repetition
The ACS algorithm performs optimization by repeating the process of Steps 2–4. When the current number of generations (
t) reaches the maximum number of generations (
), the execution of the ACS algorithm ends, and the optimization result of the problem is derived. Pseudo code of the above-mentioned process is provided in Algorithm 2.
| Algorithm 2 Pseudo code of the ACS algorithm |
Initialize the parameters(, , , , N, , ) Initialize the position of crows in the search space and memorize Evaluate the position of crows while do Randomly choose the position of crows for do if then if then else end if else if then else end if end if end for Evaluate the new position of crows Update the memory of crows end while Show the results
|
3.2. Characteristic of the ACS Algorithm
Unlike the conventional CS algorithm, the ACS algorithm adds the parameters of
and
. Therefore, this section compares the convergence performance according to the change in the newly added parameters and seeks the value with the best convergence performance. The benchmark function was used to compare convergence performance, and it was summarized in
Table 1. Here,
d was set to 10 in order to identify the characteristics of the ACS algorithm.
A total of 13 functions were used to compare the convergence performance according to the value of the added parameter. In
Table 1,
f1–
f7 is a unimodal benchmark function that can test the exploitation performance of each algorithm. Additionally,
f8–
f13 is a multimodal benchmark function that can test the exploration performance of each algorithm. The multimodal benchmark function has many local minima, making it difficult to find an exact solution.
3.2.1.
The ACS algorithm uses
, which varies with the number of generations, to increase the performance of the exploration initially.
is calculated by Equation (
9) and has a different value depending on the size of the
.
Figure 7 is a graph that changes according to the size of the
. The larger the
, the higher the probability of randomly selecting the entire boundary initially and the better the initial population selection. Therefore, this section compares results that change according to the value of the
.
When becomes 0, only exploitation occurs in all generations. Therefore, the was set to a minimum value of (=0.01). was changed to 0.01, 0.1, 0.2, 0.4, 0.6, 0.8, and 1.0, and N, , and were set to 20, 2.0, and 1.0. was set to 2000, and each analysis was repeated a total of 50 times.
Table 2 presents the analysis result of each benchmark function according to the change of
, and the last row indicates the average ranking of the BF (best fitness) or MF (mean fitness) according to the
. If two or more values were ranked the same, then the average ranking was derived. The average ranking of BF was best at 1.88 when
= 0.4, and the average ranking of MF was best at 2.31 when
= 0.8. Conversely, when
= 0.01, both BF and MF performance deteriorated. In other words, using
as an appropriate value yields better convergence performance than the conventional CS algorithms, and the convergence performance of the ACS algorithm is the best when the
has a range of 0.4–0.6.
3.2.2.
The ACS algorithm follows a randomly selected crow () by or a crow () with favorite prey. The closer = 1.0 is, the more likely it is to follow a randomly selected crow () like the conventional CS algorithm, and the closer it is to = 0.0 the more likely is to follow a crow () with favorite prey. In this section, was changed to 0.0, 0.2, 0.4, 0.6, 0.8, and 1.0 in order to compare convergence performance with changes in , and N, , , and were set to 20, 2.0, 0.4, and 0.01, respectively. was set to 2000, and each analysis was repeated a total of 100 times.
Table 3 presents the analysis results according to a change in
. The mean ranking of BF was the best at 2.04 when
= 0.2, and the mean ranking of MF was the best at 2.92 when
= 0.6. Conversely, the closer
= 0.0 or 1.0, the worse the average ranking. Furthermore, the closer the local minima were to
= 0.0 in
F1,
F4, and
F6, the better the convergence performance. In other words, using the appropriate value of
yielded better convergence performance than the conventional CS algorithm, and when
had a range of 0.2–0.4, it had the best convergence performance.


