1. Introduction
Since the 1970s, scientists in many parts of the world have explored ways to build ”floating” foundations, roads, and railway embankments by mixing unstable soils with binders on site instead of excavating all the soft soil beneath the road embankment down to the bedrock and replacing it with mineral fill. This makes it possible to significantly reduce the volume and cost of excavation and ensure the linear movement of the construction front. This approach is economically attractive and more environmentally friendly than traditional methods. The lifetimes of the bases obtained in this way are generally several times longer than those of filled bases [
1].
The most problematic scenario is the stabilization of peat soils. This is being actively investigated (especially in Malaysia, Indonesia, and other peat-rich countries), but current solutions are expensive and require the use of large amounts of high-quality cement [
2]. The use of lime (including lime-containing fly ash) is not possible on peat soils due to their low silicate and aluminate contents. Low pH values caused by organic acids (incl. humic and fulvic acids) can prevent the dissolution of clay minerals [
3]. Additionally, the effect of humic acids on the setting process of cement is not fully understood.
In Estonia, improvements in the geotechnical properties of organic-rich soils have been investigated mostly by mixing or covering organic soils with filling soils and by compacting the organic soil. In 1979, a 4 m thick peat layer at a construction site was covered with a 4 m thick filling layer. Within 3 months, the thickness of the peat layer decreased by 60%, the undrained shear strength Cu doubled, and the water content decreased twofold. The 5 m high partition walls built on the peat subsided 3–6 mm, and the floors subsided 1–2 mm in the subsequent 5 years.
In Estonia, the most attractive binding agent for stabilizing road embankments on soils containing humic substances is oil shale ash [
3,
4], which is domestically produced in power and oil plants in excess of 7 million tons per year (before the reduction in power generation by the incineration of oil shale) [
5].
Since 2014, geotechnical studies on soil stabilization to build road embankments have been carried out on the Võõbu polygon. In a particular experiment, organic-rich soil was loaded with a pressure of 42–97 kPa. At maximum pressure, the relative consolidation was 51%, and at lower pressure, it was 35%. The C
u of peat soil increased by 7 kPa to 28 kPa. After removing the load, the secondary consolidation ranged between 23 and 44 mm. In laboratory tests, soil samples taken from the Võõbu polygon were mixed with cement, oil shale ash, limestone screenings, and sand. Satisfactory results were only obtained when the soil was mixed with cement at a volumetric cement ratio exceeding 10%, and additional compaction under the influence of vertical loads was used. This made the methodology expensive. Mixing oil shale ash and peat generated no satisfactory results and even caused a reduction in the compressive strength of the peat [
6].
This phenomenon has been observed before; floors made of oil shale ash have decayed due to the action of organic matter in previous studies.
However, road construction projects which utilize the removal and replacement of organic soil with backfilling showing an adequate load-bearing capacity or with the dense compacting of organic soil are time-consuming and costly as well as ecologically unsustainable [
2].
The promoters of this project have previously (KIK 11048 “Reuse of secondary polymer waste and oil shale ash as building material raw material. Peat-based composite material with spatially prestressed polymer reinforcement”) and successfully solved all problems related to chemical processes and developed a composite material of peat and oil shale ash [
4].
A similar methodology can also be used to stabilize road embankments on peat soil because the chemical processes taking place are analogous. In this case, only the upper geotechnically necessary minimum part of the subsoil (down to 1–2 m) is stabilized. The rest of the subsoil (deeper than 1–2 m) is left untouched without disturbing the existing water regimes in ecosystems [
7].
Initially, lime and materials containing it were mainly used to harden floating roadbeds, but in the 1980s, it was found that cement or cement–lime mixtures where cement has partially been replaced with lime are considerably more effective (but also more expensive). Soil stabilization with lime is possible only if its mineral part contains a sufficient amount of pozzolanic components (silicate clay particles) [
1].
The stabilization of soils containing peat is expensive and requires the use of large amounts of high-quality cement [
2]. The common use of lime (including lime-containing fly ash) is not possible on peat soils due to its low silicate content and the humic acids present in soil [
1].
Humic acids have a strong chemical affinity for group II metal ions (Ca
2+, Mg
2+, etc.) [
8], so they react with lime to form insoluble calcium and magnesium humates which can be adsorbed on the surface of the cementing particles, preventing the hydration of silicates and pozzolanic reactions [
9].
Similar problems have also been described in studies dealing with the stabilization of peat soils with cement:
- (1)
Humic acids actively bind Ca
2+, forming insoluble humates and thus decreasing the amount of available Ca
2+ ions to form C–S–H gel, while fulvic acids more selectively attack Al-containing particles, covering them with an adsorbed layer of fulvates and inhibiting further reactions. Fulvic acids can also disrupt the crystallization of calcium aluminate hydrate, calcium sulfate aluminate hydrate, and calcium ferrite aluminate hydrate [
9].
- (2)
The dissolution of acidic compounds causes the pH level in the pore water to drop close to or below the threshold, above which secondary cementation products can form (pH~9), thus slowing down or preventing hardening [
9].
- (3)
A high water-binding capacity, as well as high moisture content, slows down the hardening processes [
9].
In Estonia, studies have been carried out to strengthen road embankments using oil shale ash [
10,
11,
12], but their implementation was based on incomplete assumptions. These studies aimed to achieve the stabilization of soil at the expense of the hydraulic hardening of oil shale ash, but due to its low pozzolanic content, solidification occurs only when lime reacts with atmospheric carbon dioxide; in the deeper layers, it would require hundreds of years [
13]. Additionally, the inhibitory effect of humic acids on hardening processes and their lime-degrading effect were not taken into account [
6]. However, it has been proven that these problems can be successfully addressed with relatively cheap additives and a suitable treatment regime, which allows the bearing capacity of a road embankment to exceed 100 kPa. The aim of this study is to apply the results of earlier chemical studies performed at the University of Tartu [
3,
4,
14] for the in situ mass-stabilization of peat soil areas, allowing the retarding effect of humic acids to be minimized.
2. Materials
2.1. Peat Soil
Soil sampling took place in January 2019 at the Järvselja Training and Experimental Forest Centre of the Estonian University of Life Sciences (58°16′ N, 27°19′ E) in four different locations. The soil at the test site is peat with a layer thickness of 0–3 m. Below this, in turn, lies a moraine layer and Devonian sediments. Due to the geology, it is a very good place for the formation of peat soils (the water-holding layers below the moraine layer). Additionally, this small area shows high variation in soil types [
15]. The humidity and contents of organic and inorganic matter in percent by weight are shown in
Table 1.
In sampling areas 1 and 4, the thickness of the peat layer and the deposition depth of the mineral subsoil are slightly more than one meter. In areas 2 and 3, the peat layer is thinner. In area 2, the subsoil is approximately 85 cm deep, and in area 3, it is less than half a meter deep.
2.2. Oil Shale Ash
EestiEnergia (an Estonian national energy company) generates millions of tons of oil shale ash every year, and approximately 5% of this is reused as a raw material; the majority of the ash is deposited in landfills [
5].
The organic component of oil shale usually does not exceed 40% of the total mass (usually less)1. The composition of the mineral part, i.e., oil shale ash, which remains after burning is quite variable depending on the type of layer the oil shale used for heating derives from, and even more so on how many intermediate layers are left in the oil shale during sorting. The main part of the intermediate layers is made up of calcium carbonate or limestone. During firing, it decomposes into quicklime CaO and carbon dioxide.
In power plants, finely ground oil shale is burned floating in air (pulverized firing PF, older energy blocks) or in circulating fluidized bed boilers (CFB, newer energy blocks).
PF fly ash, consisting of the mineral part of oil shale, is separated from combustion gases using cyclones and electric filters. Fly ash is suitably fine for use as a binder and has the best hardening properties. It can have different mineral and elemental compositions depending on where it is obtained (cyclone or electrostatic precipitator).
Fluidized bed burning takes place at a lower temperature, and thus some of the calcium carbonate present in oil shale remains intact. At the same time, some toxic components of burning gas (phenoles, sulfur oxides) are trapped in the same ash, forming calcium sulfate and other substances.
The third type of oil shale ash is DeSOx ash, obtained from the desulfurization system of power plants. CaO from boilers is used in semidry DeSOx systems to remove sulfur oxides from emission gases. This ash has a high sulfate content.
The compositions of ashes used in the experiments are described in
Table 2.
2.3. Silica Fume
Silica fume (fine silica SiO
2) is one of the best pozzolanic agents
2. Two different types of silica fume were used: microscale SiO
2 of Egyptian origin (manufactured by Efaco) and nanoscale SiO
2 (manufactured by Cabot) with a microscale particle diameter. Later, a ready-made suspension of nanosilica fume produced by TamCem was also introduced. The main silica fume data are shown in
Table 3.
2.4. Other Reagents
Caustic soda (potassium hydroxide, NaOH) and waterglass (sodium silicate, (Na2O)x·(SiO2)y, 20% solution) were obtained from Keemiakaubandus AS technical grade.
2.5. Bog Water
Bog water with high acidity (pH 3) was collected from the same area as the soil, i.e., the Järvselja Experimental Centre. The organic content of the water was appr. 3%.
3. Experimental Procedure
3.1. Initial Lab Tests
Initially, 20 test specimens with different recipes were prepared for each soil type; later, the number of test specimens in each series increased to 57.
To prepare each test piece, 200 g of peat soil was mixed with 100–200 g of ash and additives. No pretreatment of peat was applied (except for the removal of green plant residues) so that its natural water content could be preserved. Additives included silica fume (SiO
2), NaOH for pH adjustment, and waterglass (20% Na
2SiO
3 aqueous solution). The use of additives in different test mixtures was varied (in most cases, not all additives were used together), and the data on the composition of specific test objects are shown in
Table 4 (for the abbreviations, see
Section 3.2).
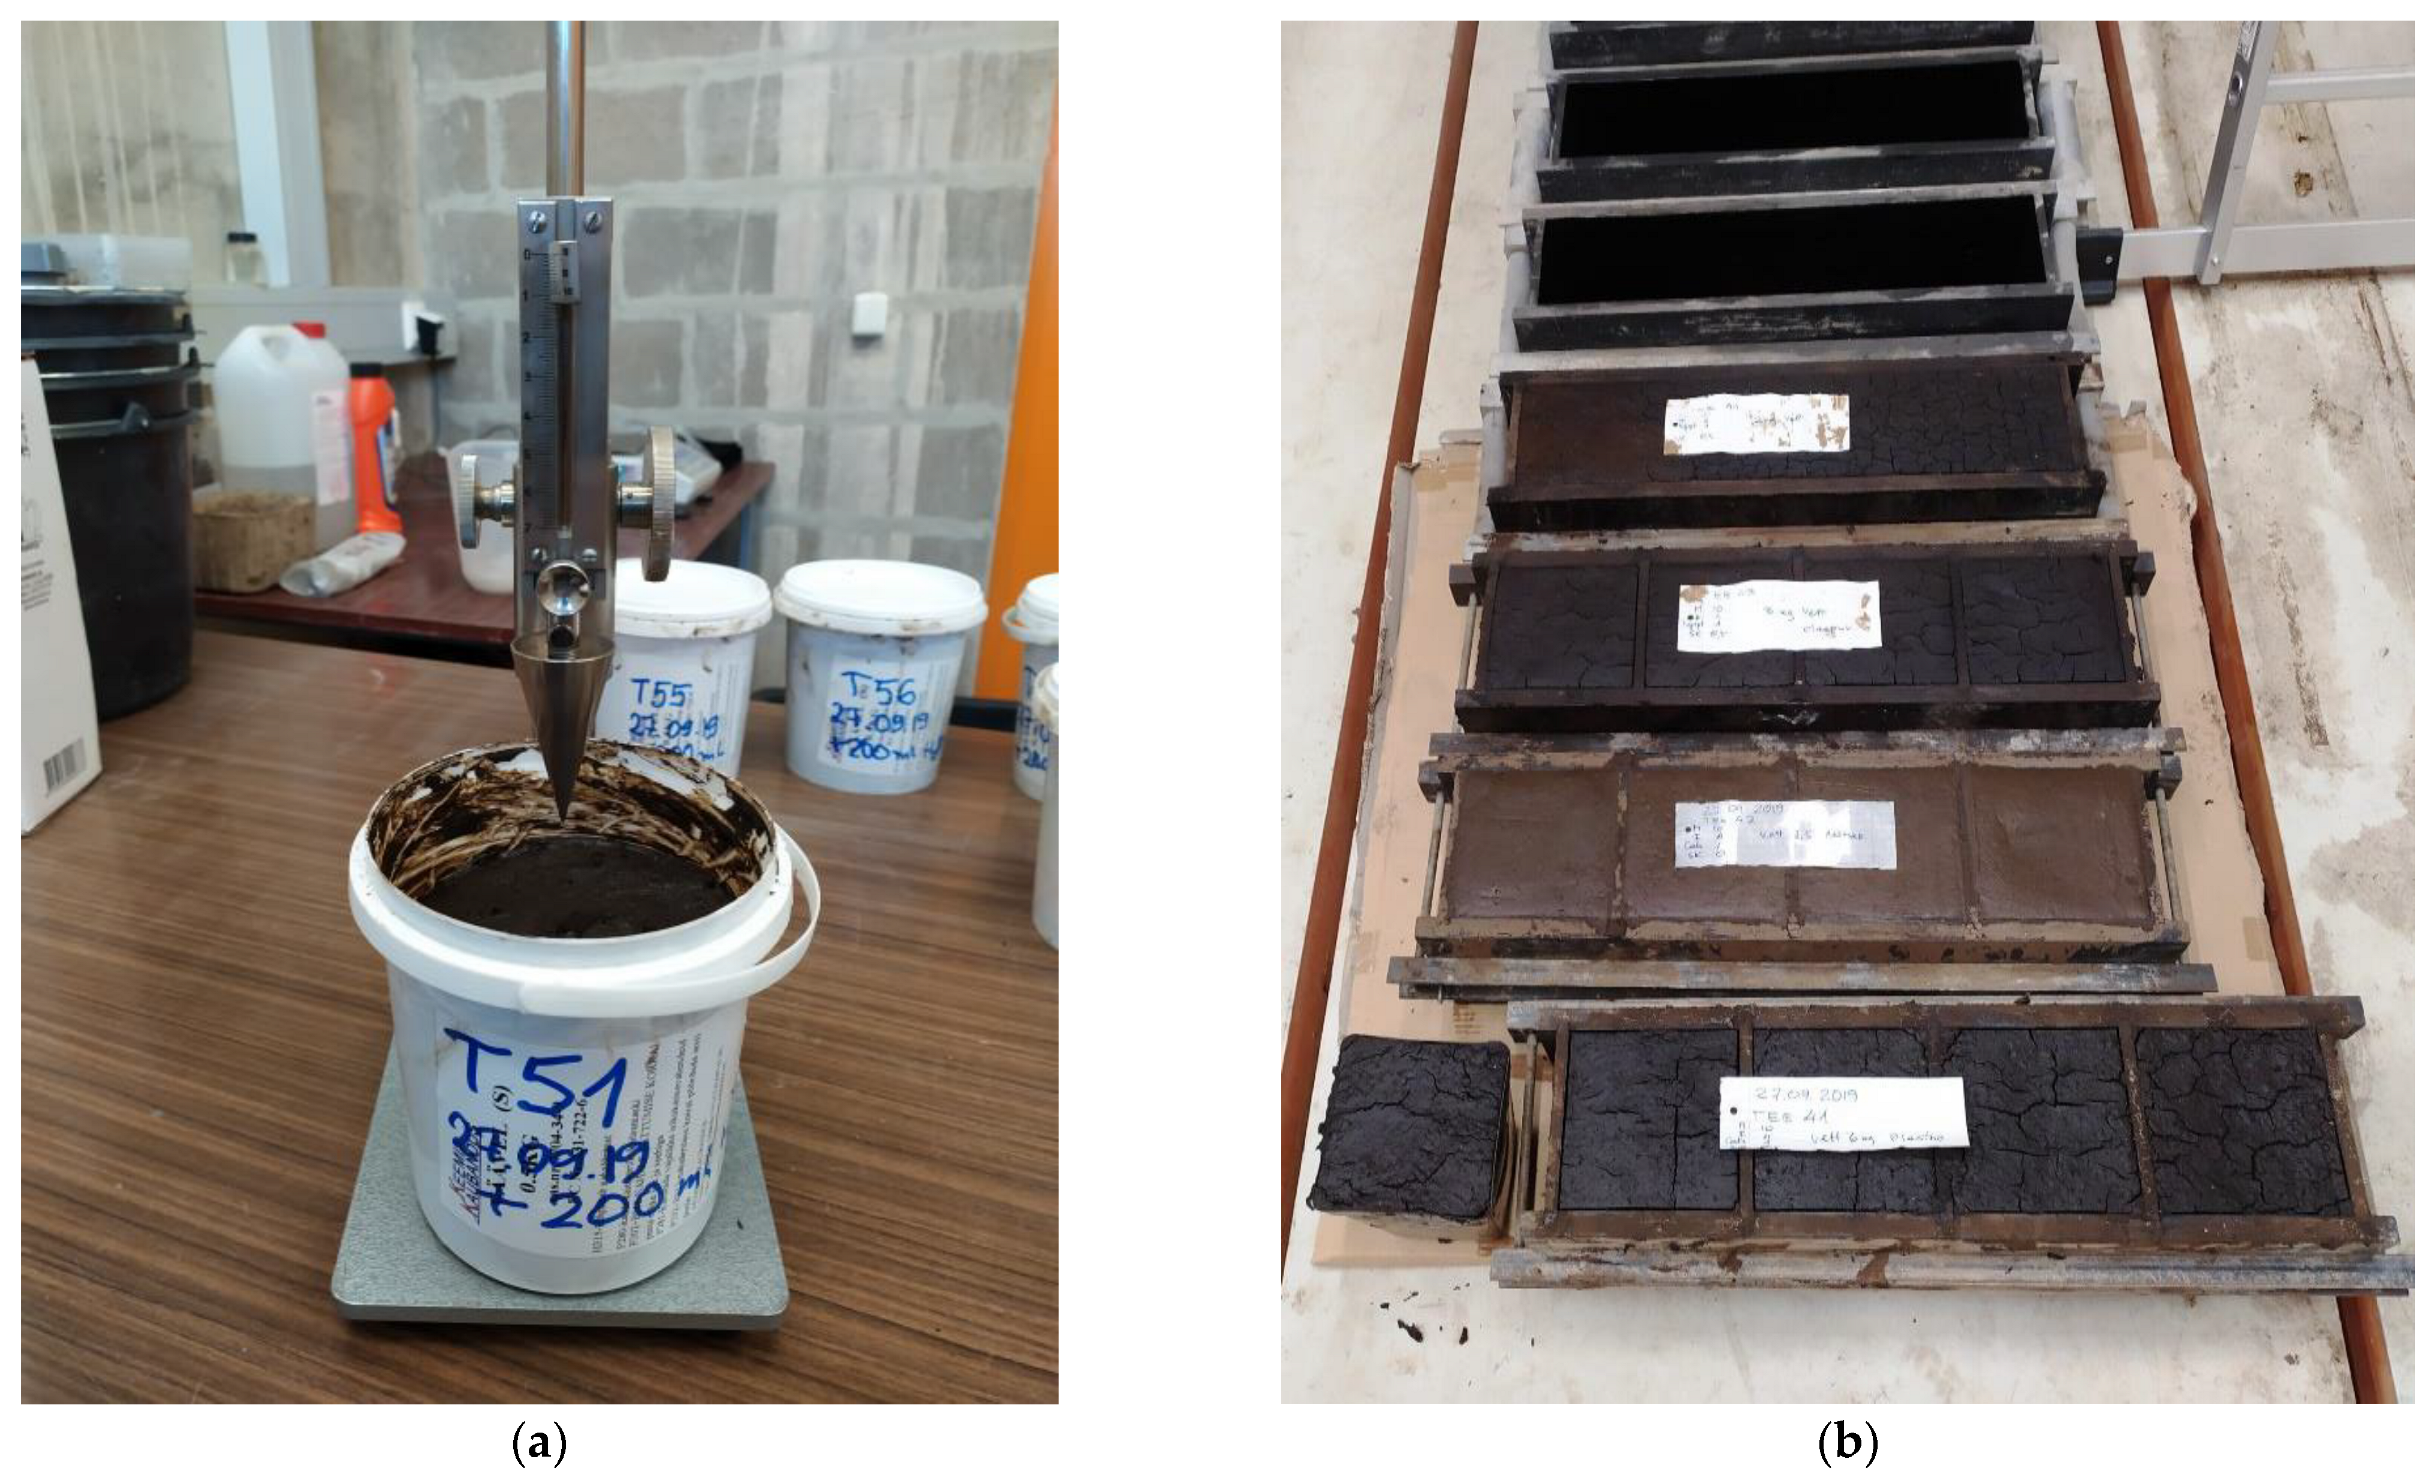
First, the hardening of the test pieces was checked after the first 7 days of mixing. Preliminary testing of the hardening of the specimens was performed using cone apparatus (
Figure 1a). Samples that did not show any hardening were marked “No” in the “Hardening within 7 Days” cell in
Table 4 and were excluded from further studies. The samples that showed hardening are indicated as “Yes” in
Table 4, and 12 recipes were selected for the compression–strain analysis. The test specimens were prepared in standard containers (
Figure 1b) for the compressive strength measuring apparatus.
The water content was determined on natural material (soil) and its composite mixtures. Water content (w) is the mass of water in the test sample expressed as a percentage of the weight of the dry test sample (EVS-EN 1097-5:2008).
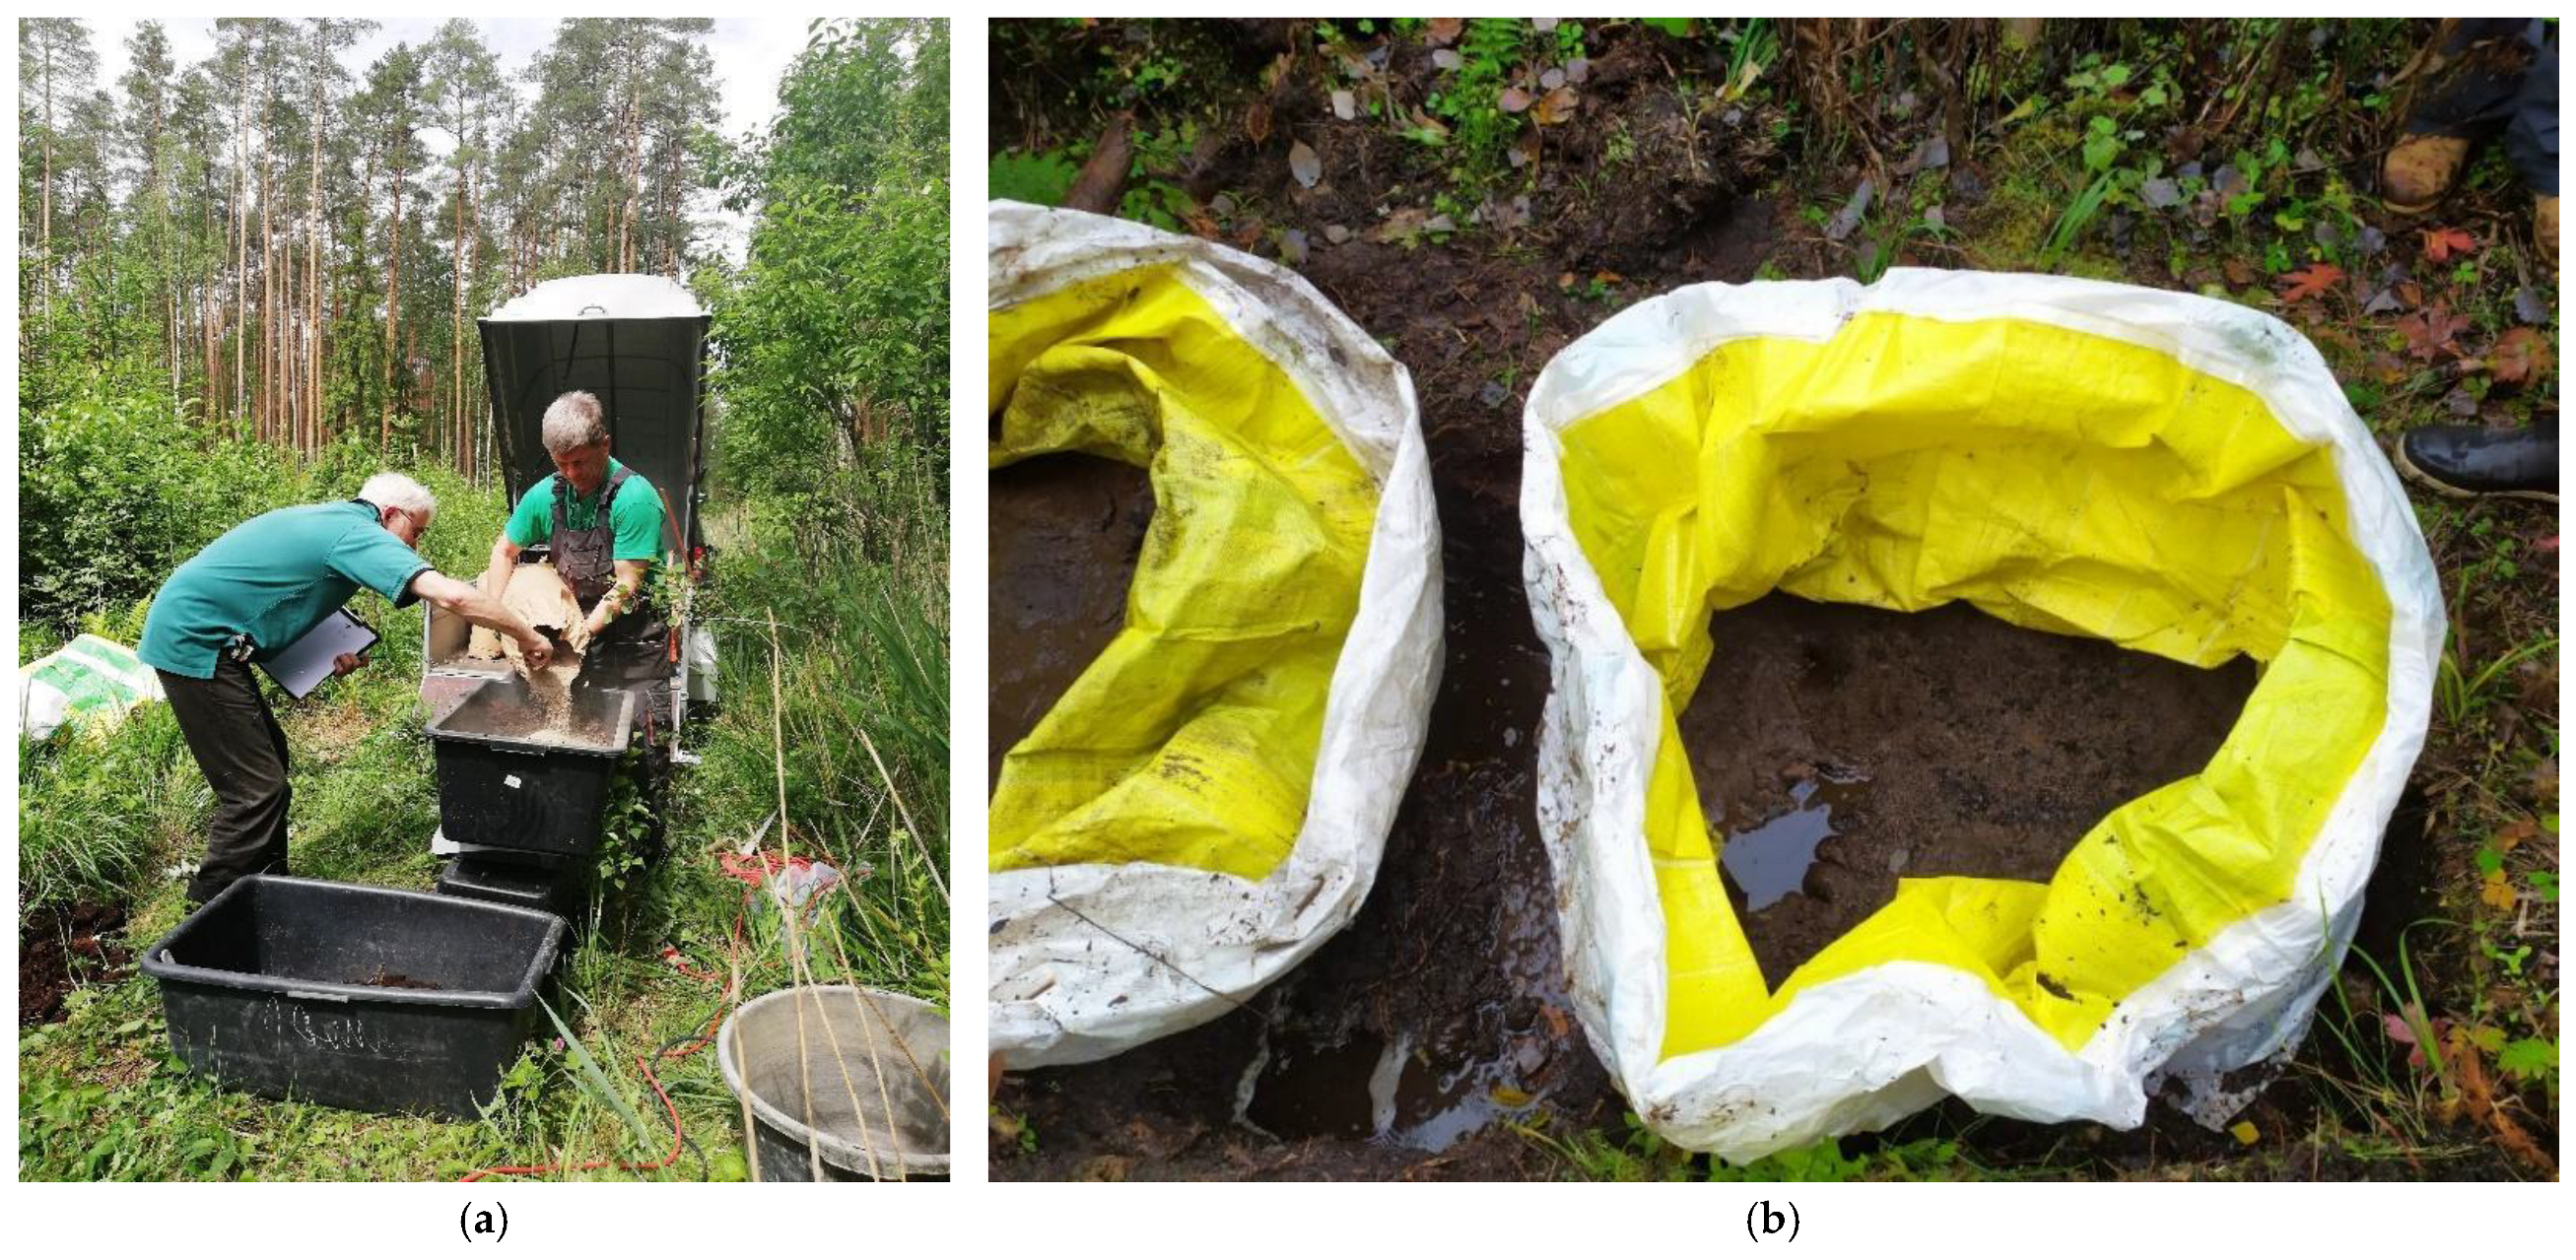
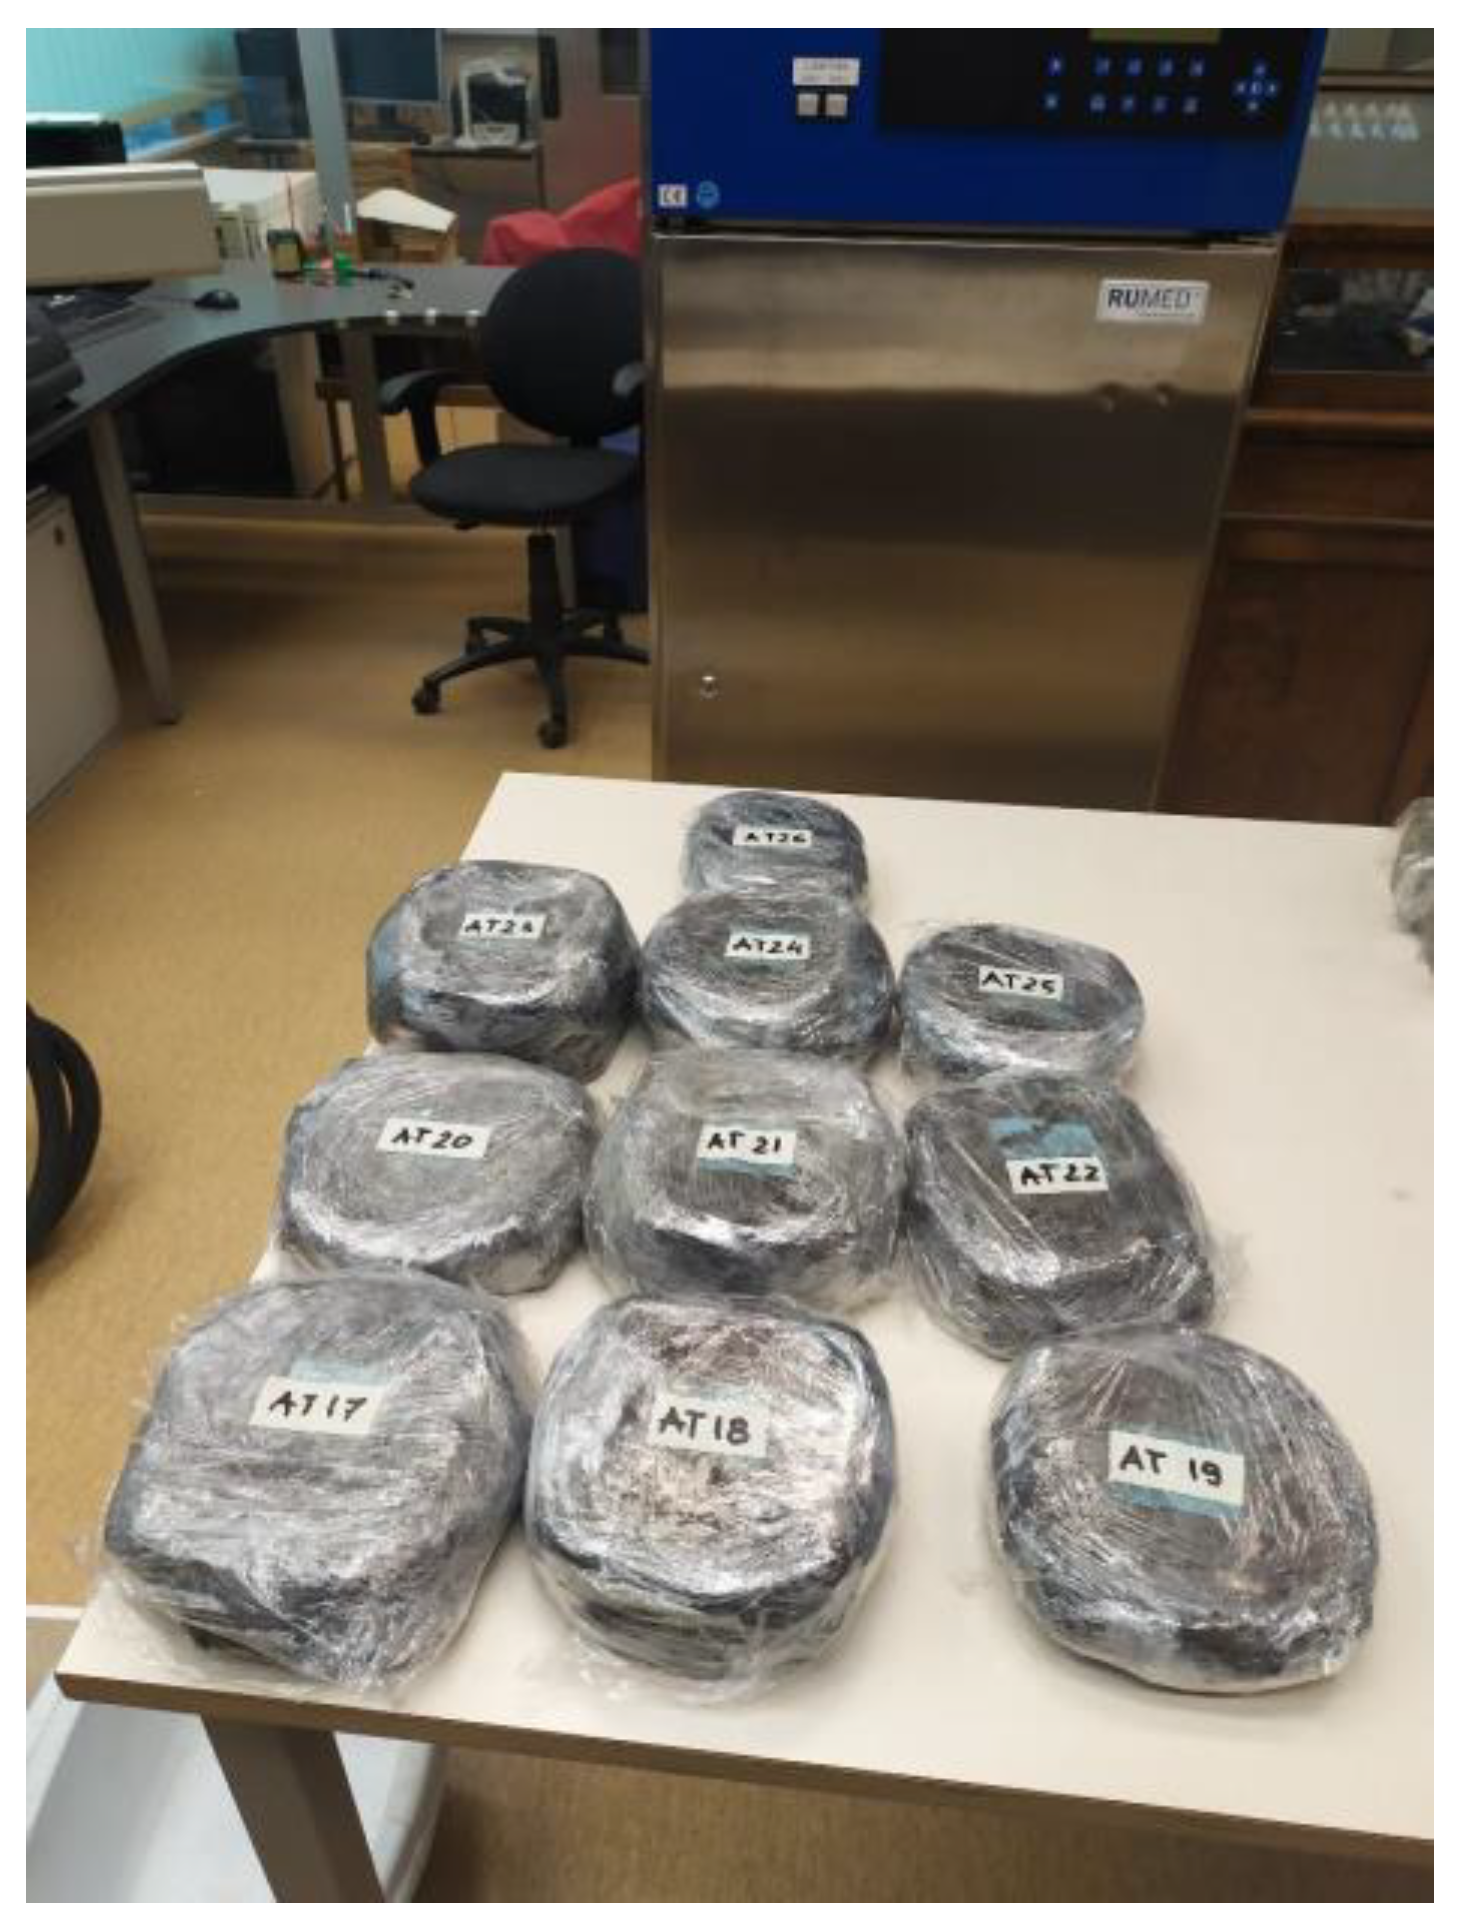
3.2. Initial Field Tests
The preparation of pilot-scale test specimens took place at the Järvselja test site. Two 1 × 1 × 1 m pits were dug in the soil, in each of which a 1 m
3 bigbag made of water-permeable material was placed. The excavated soil was mixed with fly ash, silica fume, waterglass, and NaOH (
Table 5) and used for backfilling bags (
Figure 2). The recipe of the laboratory test specimen T17 was chosen as the basis for the pilot-scale test specimens, and it was identical to
Table 5.
After the mixture was prepared and filled, the bigbag was sealed to prevent the mixture from drying too quickly.
The specimens were allowed to harden for 4 months from mid-June to mid-October 2019. During this period, the evolution of the mechanical properties of the test specimens was monitored. In October 2019, sampling took place.
3.3. Construction of Test Roads
The concept was to build an experimental road on soil with the lowest possible bearing capacity to test the methodology under critical conditions to the extent possible. We chose a partially mined peat deposit at the Elva E.P.T. company in Sangla (58°30′ N, 26°25′ E) for two reasons:
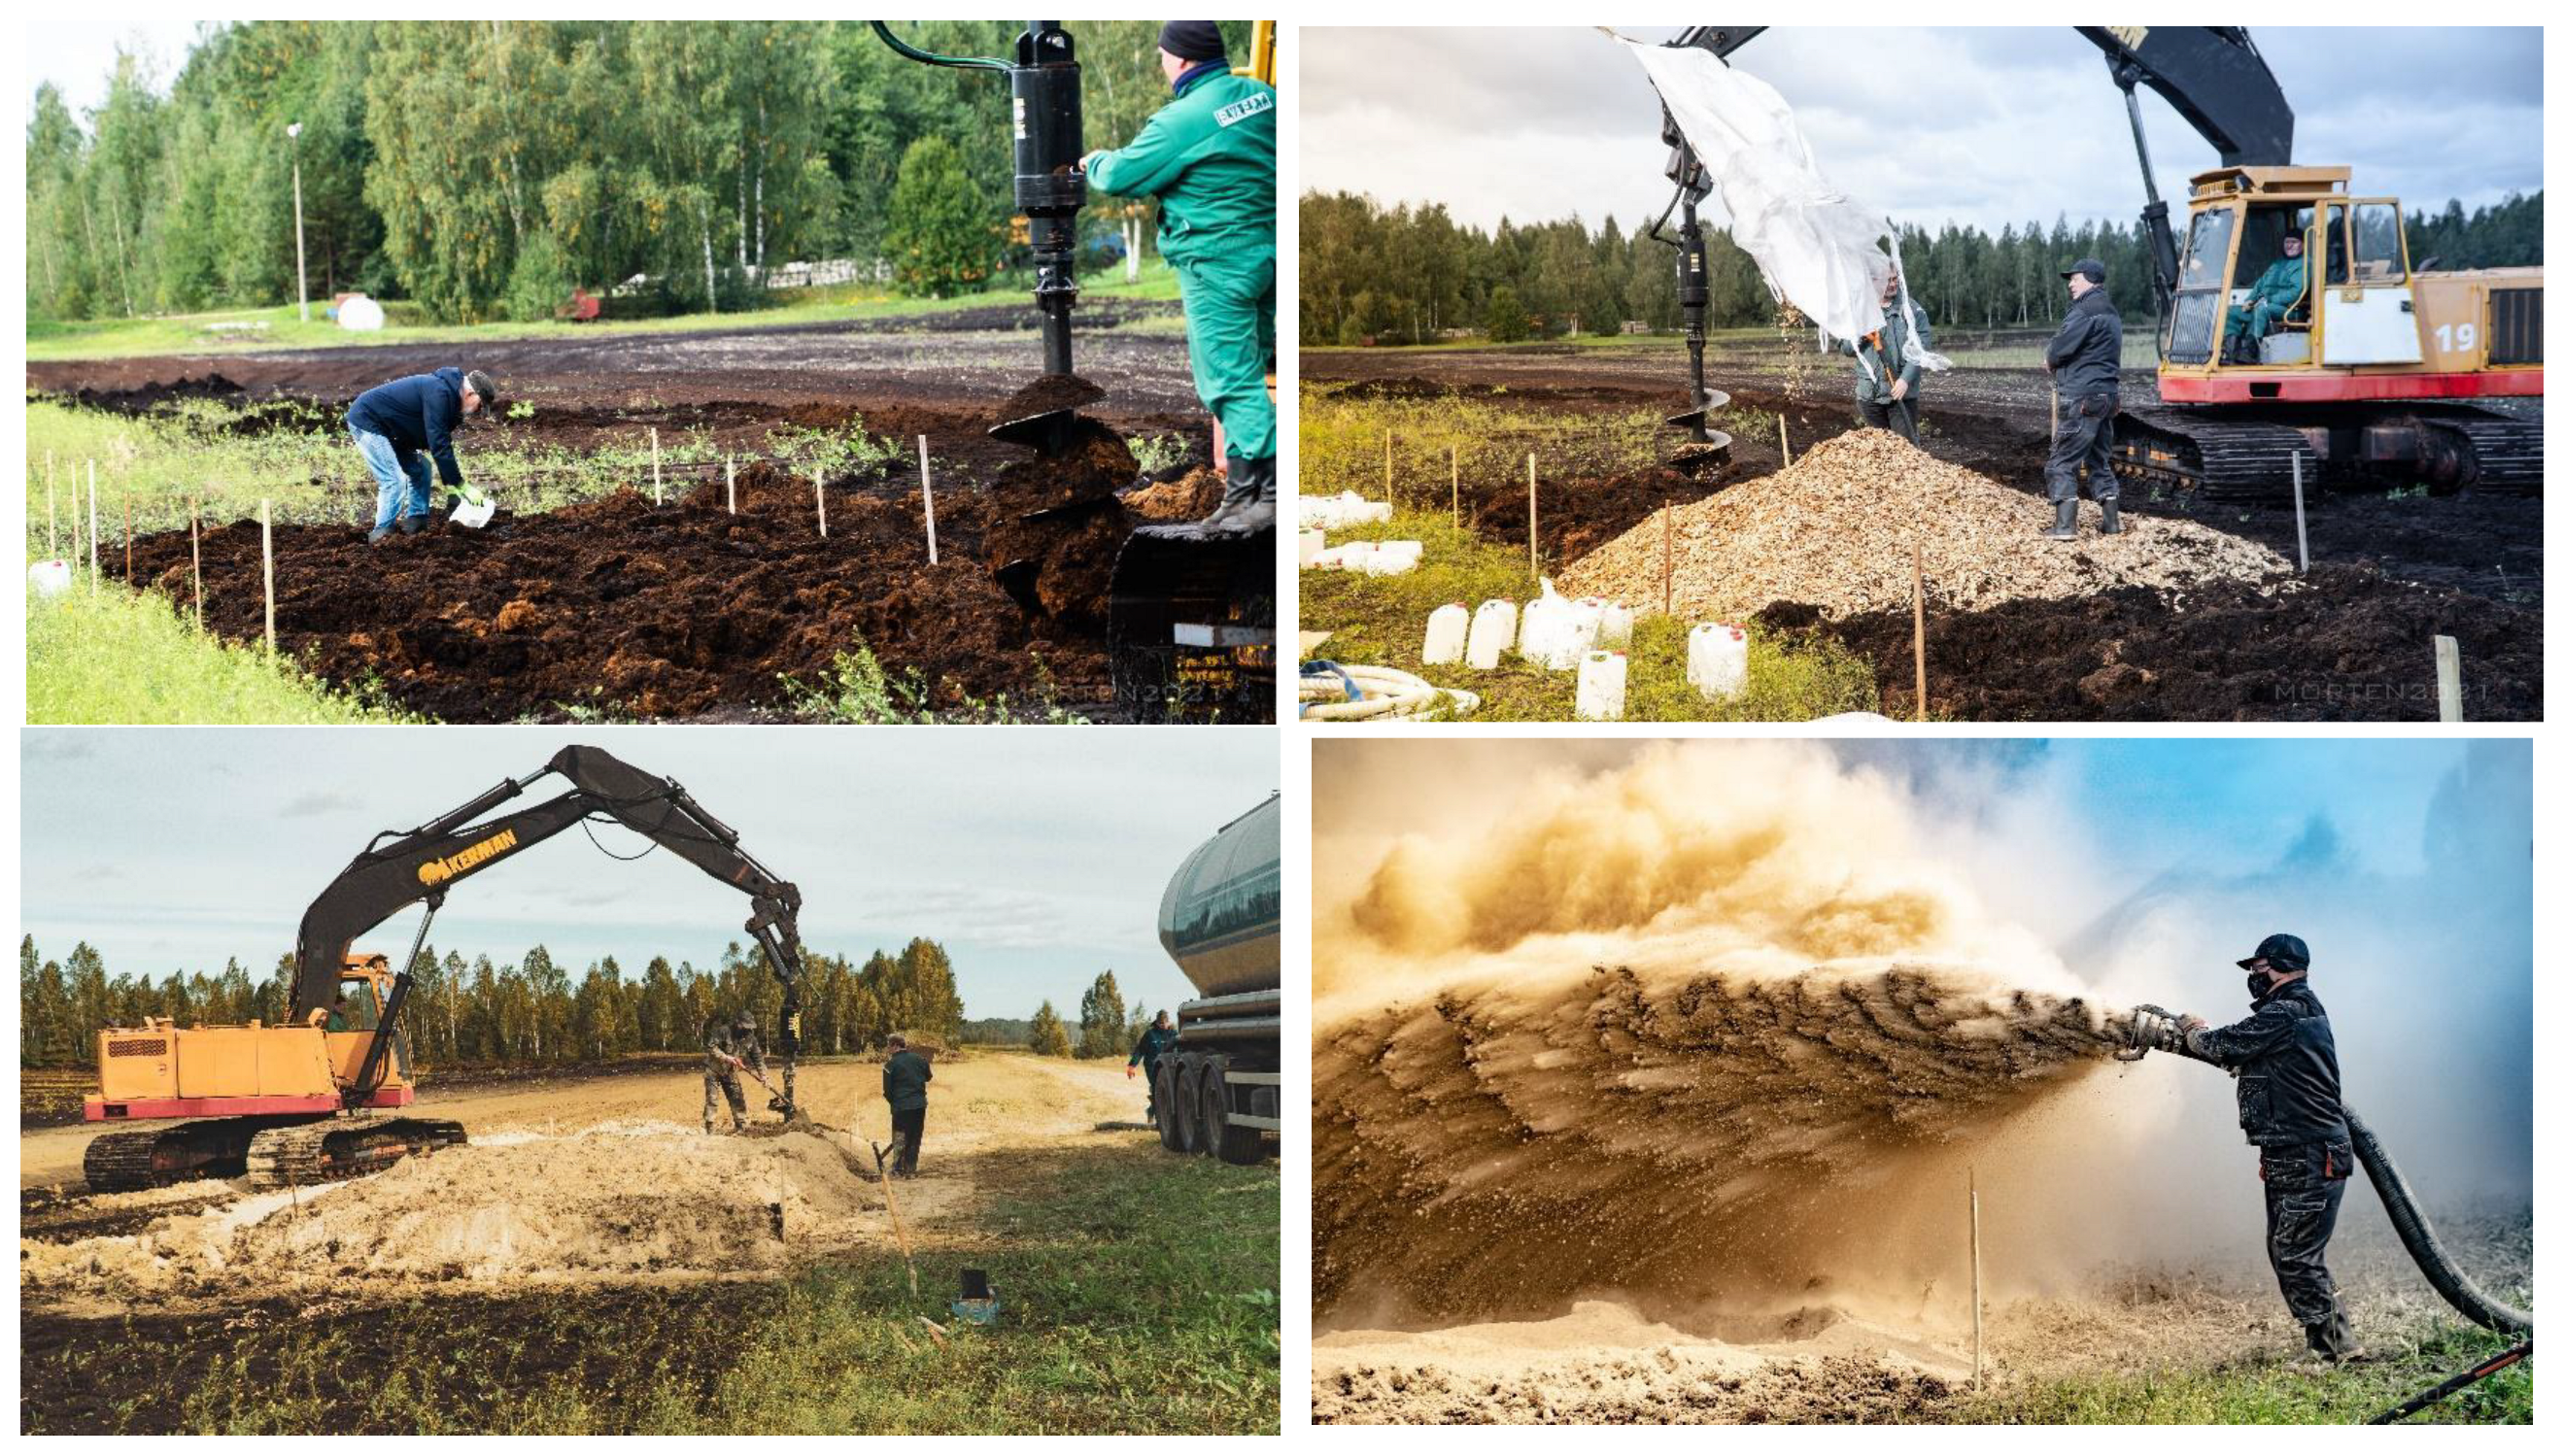
The locations of the roads were marked, and the soil was loosened to the working depth (
Figure 3, top left). The working depth was about 1 m. The upper peat layer had already been removed during the peat mining operations.
Five recipes of different thicknesses and compositions were tested (including one containing wood chips for reinforcing;
Figure 3 top right and
Table 6). All components (except oil shale ash) were added to the soil surface and then mechanically mixed with peat to a depth of 1 m. The PF oil shale ash was spread separately (
Figure 3 bottom right) and immediately mixed with the soil (the hardening process began). The road was leveled and compacted (
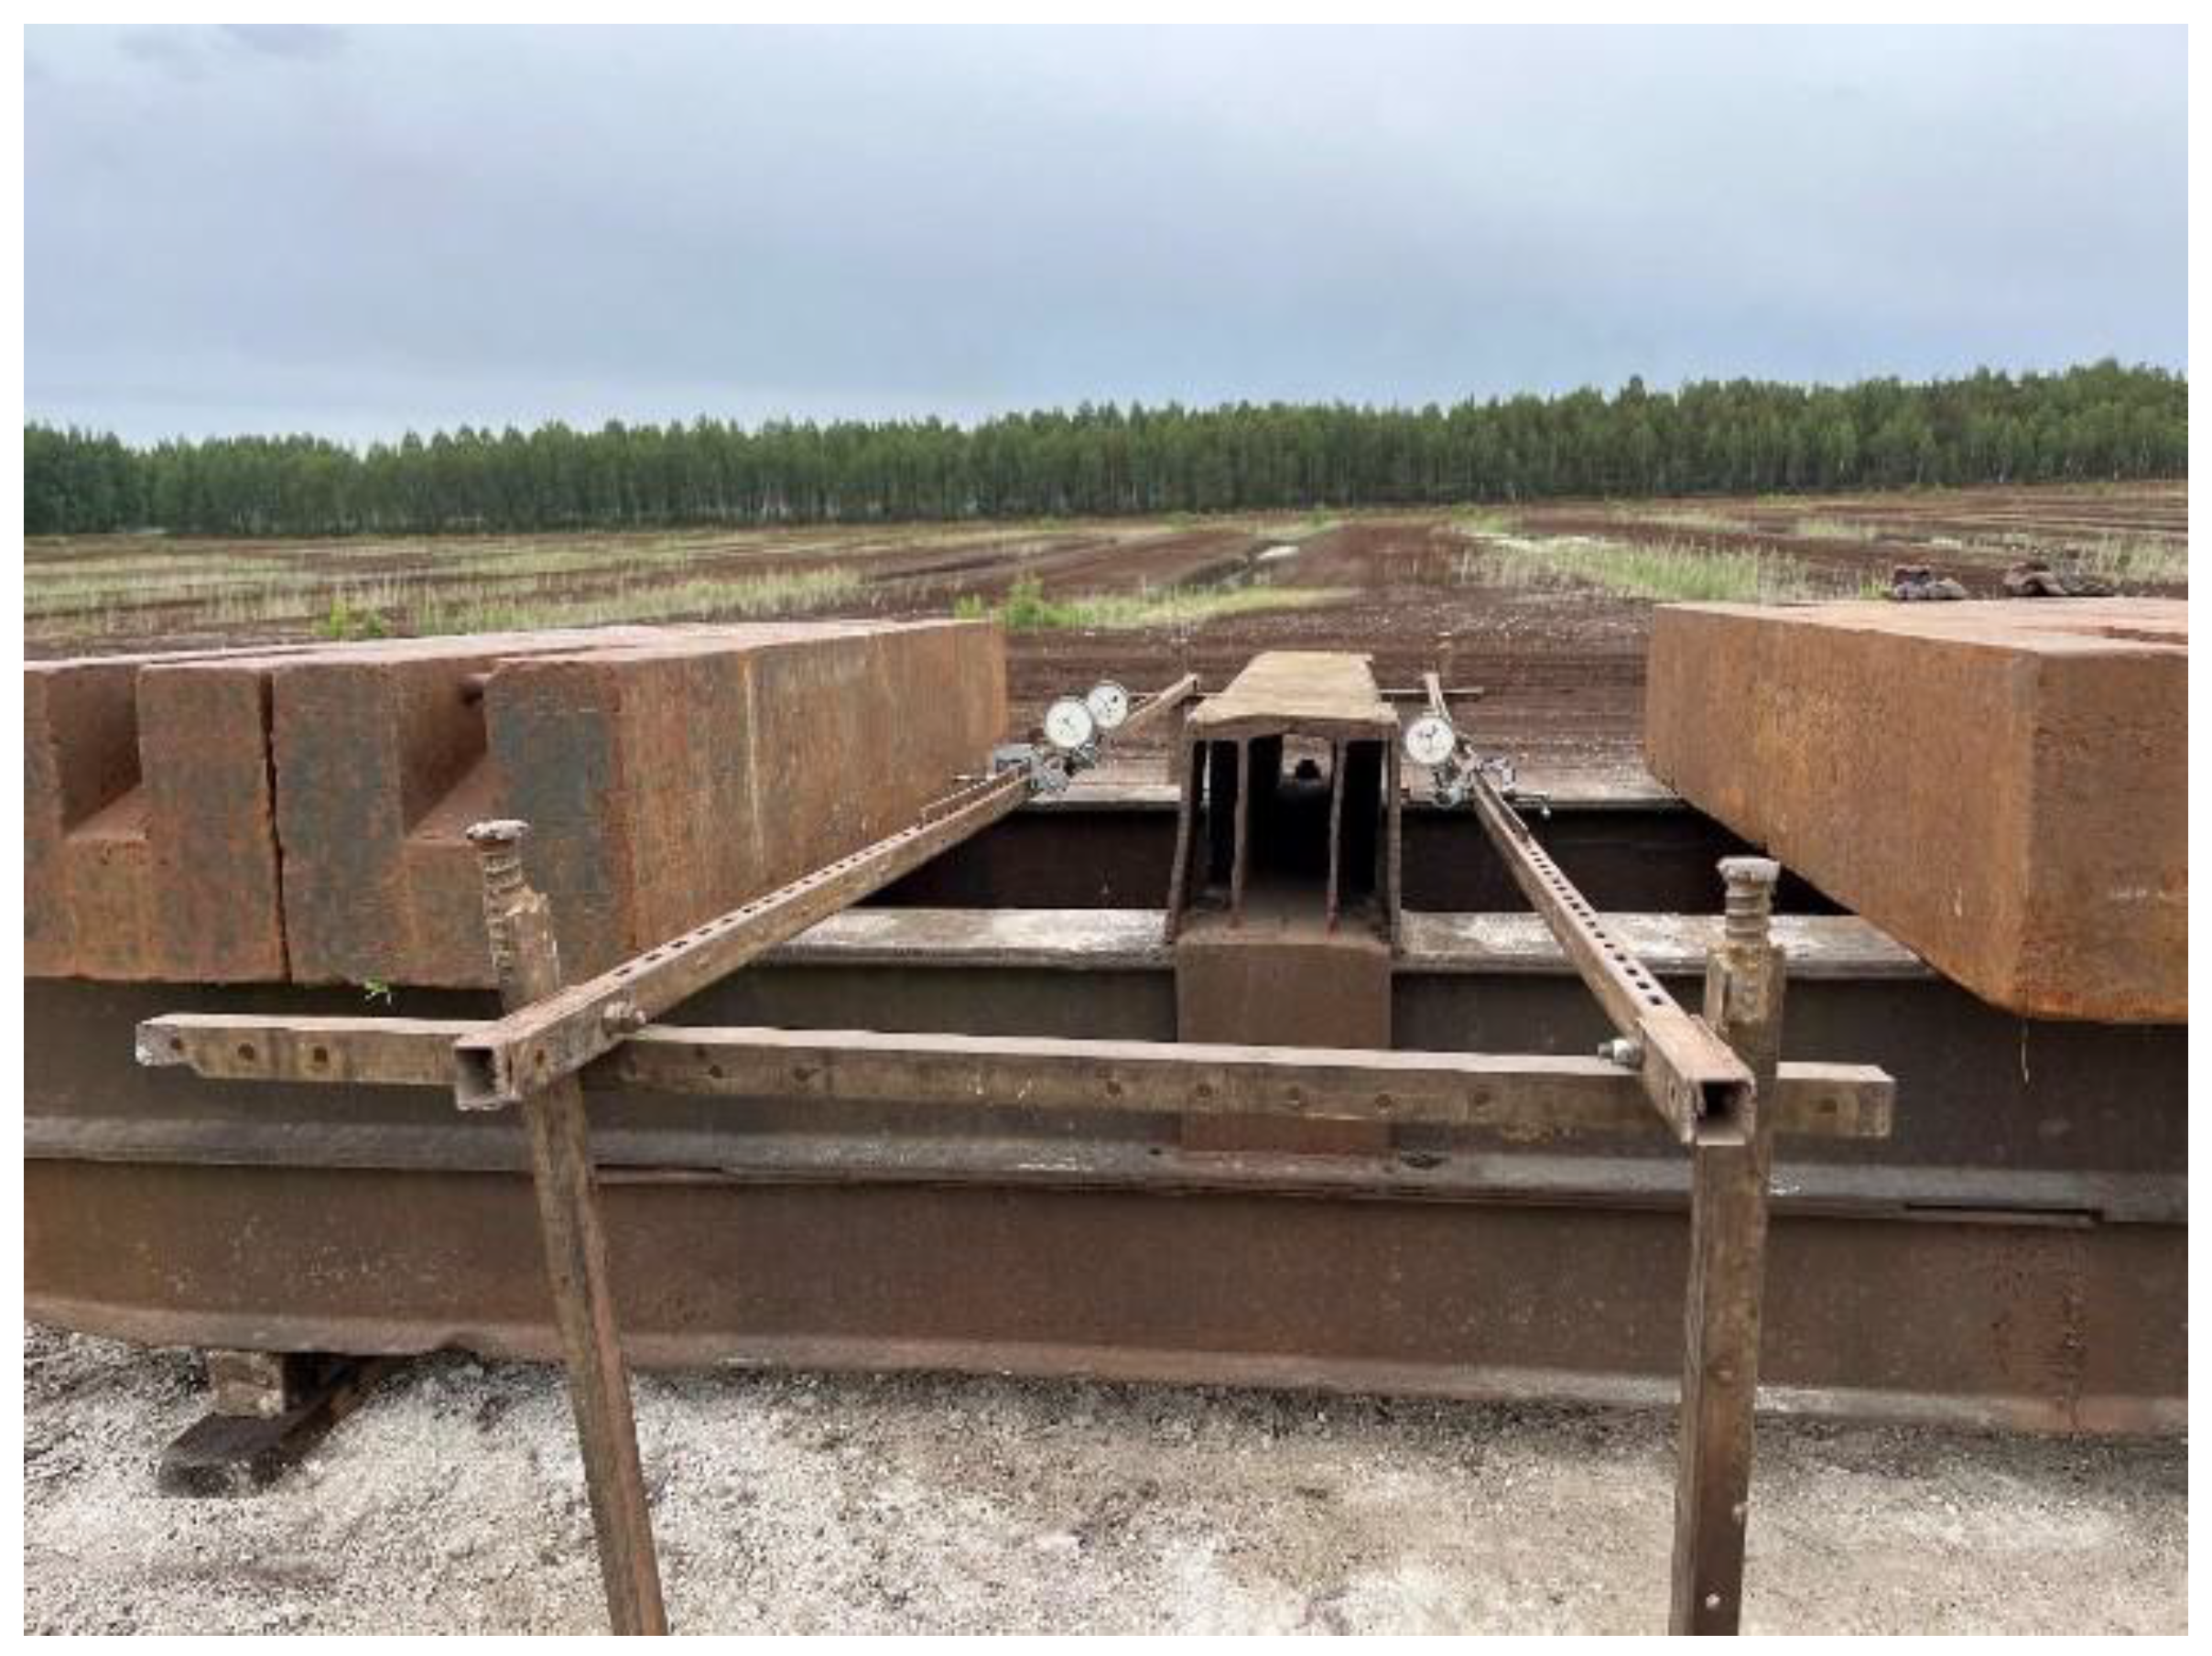
Figure 3 bottom left). The road, completed in the autumn of 2021, was left to stand over the winter. Load tests were carried out after the snow melted in the spring of 2022. The tests were carried out by OÜ REI Geotehnika (
Figure 4).
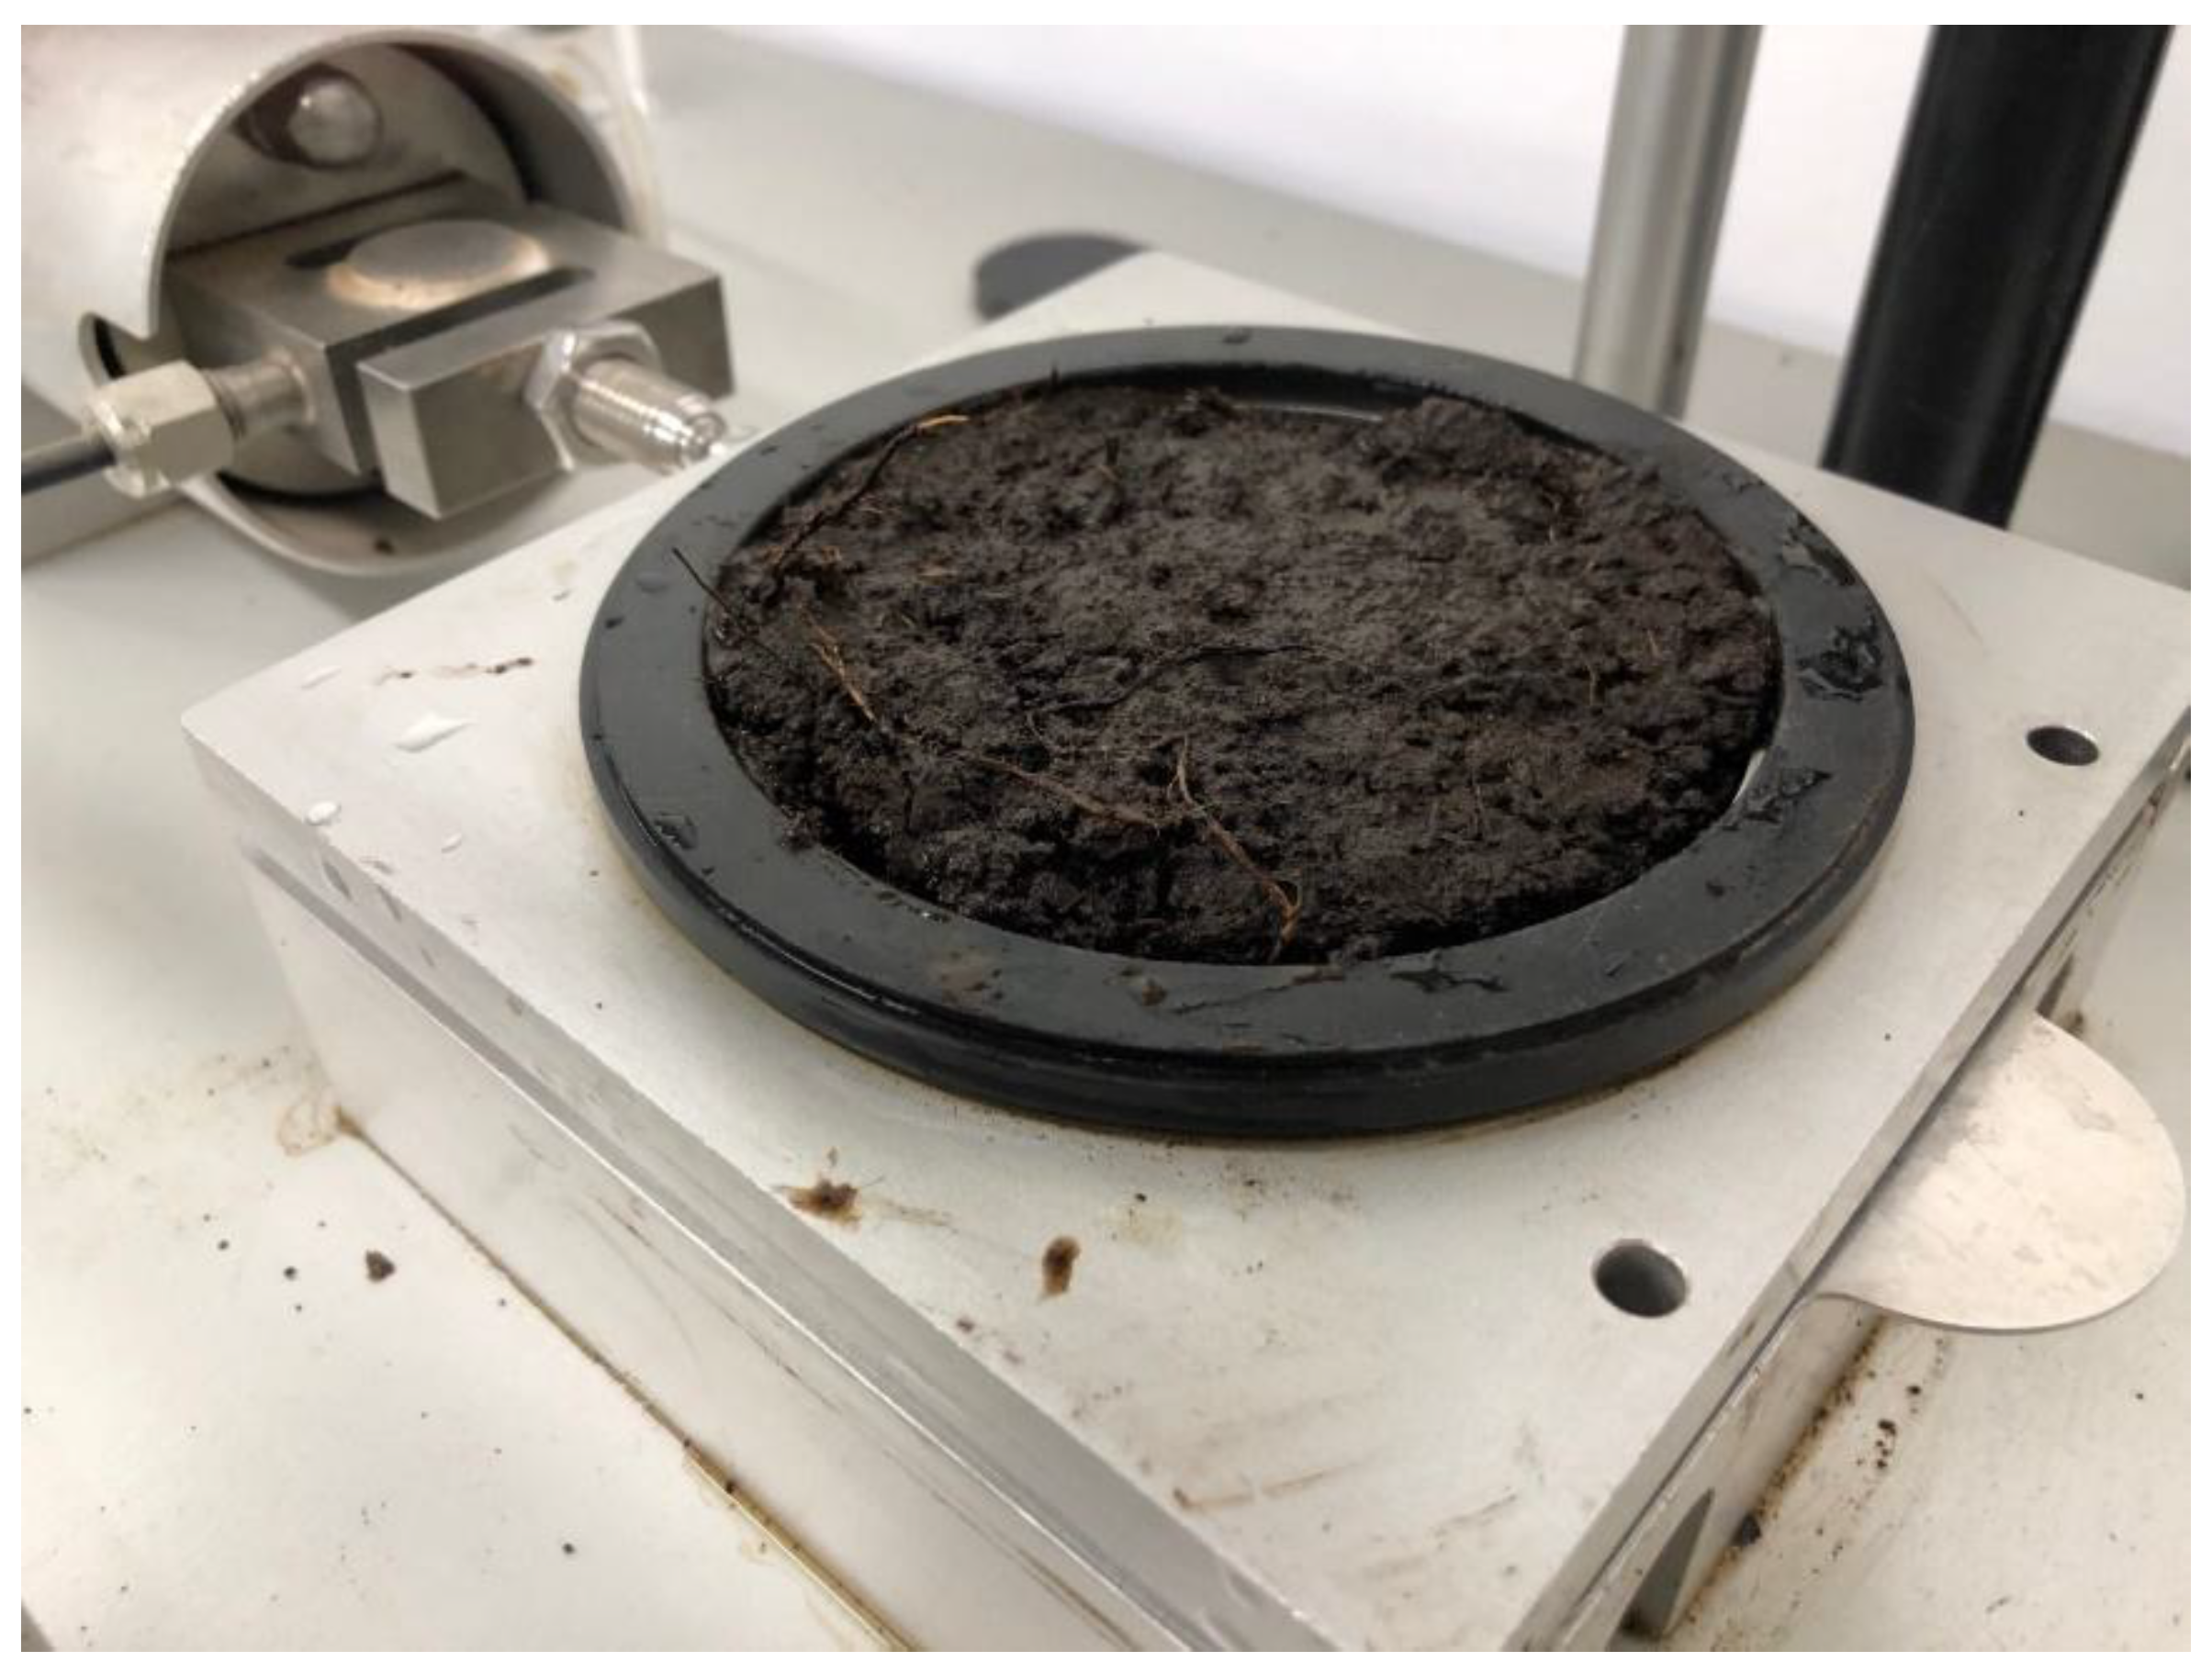
3.4. Mechanical Testing of the Specimens
3.4.1. Uniaxial Compression Tests
After 14 and 28 days of hardening, the compression–strain diagrams of the test specimens were recorded (
Figure 5). Uniaxial compression tests were performed using an Instron model 3369 universal testing machine (maximum load 50 kN).
The preparation of specimens for triaxial tests is costly and labor-intensive. Thus, monoaxial compression tests were selected for the studies of stabilized organic-rich soils. The density and water content were examined. For uniaxial compression tests, test specimens with dimensions of 50 × 50 × 50 mm and 150 × 150 × 150 mm were used.
Before the experiments, the samples were weighed on a Kern 578 electronic balance with an accuracy of 0.05 g. The surfaces of the test specimens were leveled and ground so that the difference in surface smoothness did not exceed 0.1 mm per side with a length of 100 mm and were then placed evenly on the loading plates. A mechanical load was applied to the test specimens with a continuously increasing force until failure or an exact displacement of 16 mm was reached. The maximum force exerted on the test objects in kN and the time of application of the maximum force were recorded, and the compressibility of the test objects in millimeters was measured depending on the force exerted on them. The qu values were determined at compression tests, and then using the qu values, shear strength and the expected load limit qo were calculated. The compressive strength fc [N/mm2] was calculated as the quotient of the maximum compressive force Fc [N] and the total area of the loaded surface [mm2].
3.4.2. Shear Strength Tests
The tests were carried out as part of Andrus Leinpuu’s master’s thesis and were considered indicative, enabling the selection of the optimized composition of the mixture used in the final field tests (see
Section 4.3 and
Section 4.5). In this regard, the solidified test specimens were treated not as mass-stabilized soil, but as lightweight concrete with organic fillers, and the tests were performed according to the national standard “EVS-EN 12390-3:2019 Testing hardened concrete—Part 3: Compressive strength of test specimens”, using the equipment available in the research group’s laboratory. The standard allows the use of cube or cylinder-shaped specimens or drill cores as test pieces. The corresponding ISO standard is “ISO 1920-6 Testing of concrete—Part 6: Sampling, preparing and testing of concrete cores”. The water-saturated samples were weighed on a KERN FKB electronic scale, where the mass of the samples was determined together with the cutting ring and filter paper. The specimens were placed in an electronically controlled Eijkelkamp shear apparatus, and plane shear tests were performed (
Figure 5). Load levels of 100, 200, 300, and 500 kPa were used. The duration of the test cycles was 36 min. The pressure apparatus stopped automatically when the yield point was reached.
3.4.3. Compressibility Tests
The compressibility test, or oedometer test, was prepared based on “EVS-EN 12390-3:2019 Testing hardened concrete—Part 3: Compressive strength of test specimens”.
During the compression tests, load levels of 0.005, 0.01, 0.02, 0.04, 0.08, 0.16, and 0.32 MPa were used. At all load levels, the duration of loading was 12 h. Decompression was carried out at a load level of 0.005 MPa, and the duration of decompression was 2 h.
With oedometer cutting rings, the correct size specimens were taken to perform the compression test. The specimens were weighed together with the oedometer cutting ring and plates (
Figure 6). The specimens were placed in the oedometer KP, with the number of lever press transmissions
n = 10. An initial reading was taken from the gauge, and then the first load level was placed on the test pieces. All load levels were kept for 12 h. After reading the last load stage, the specimens were decompressed for 2 h. Specimens were removed from the oedometer and reweighed with an electronic scale to determine the mass of the specimen after the test. The tested specimens were placed in a drying oven to determine their water content and dry bulk density.
3.5. XRD/XRF Measurements
XRD/XRF tests were performed to determine the phase and elemental composition of the samples.
XRD was performed on a SmartLabTM diffractometer (Rigaku, Tokyo, Japan), tube power 8.1 kW, using Cu rotating anode working at 45 kV and 180 mA, coordinate sensitive 1D detector D/teX Ultra and Bragg–Brentano optical setup. The diffraction pattern was measured between diffraction angles of 8 and 90° with a step size of 0.01° (2θ) and a scan speed of 4 deg/min. PDXL software (Rigaku) and database PDF-2 (International Centre of Diffraction Data, 2018) were used for phase identification. TOPAS 6 Academic software was used for the analysis of mass concentrations of crystalline and amorphous phases implementing the Rietveld refinement method.
The initial structural parameters of phases required for the refinements were taken from the database ICSD 2019 (FIZ Karlsruhe, Germany).
The concentration of the amorphous phase was estimated by a quantitative XRD analysis method using zircon (ZrSiO4) as an external standard material for the calculation of calibration constants.
The quantities of Rwp and Rwp’ (given in tables below) were defined as the overall residual error of the Rietveld approximation, i.e., the weighted difference between the theoretically calculated and measured diffraction patterns of the phases found, taking into account the background and excluding the background, correspondingly.
XRF was performed on a spectrometer (ZSX 400, Rigaku, Tokyo, Japan) using an Rh X-ray tube working at a power of 3 kW.
4. Results and Discussion
4.1. Initial Lab Tests
The results of the phase composition analysis for crystalline and semi-amorphous phases determined by the X-ray diffraction (XRD) method are presented in
Table 8.
The elemental compositions of samples T10, T11, and T17 determined by X-ray fluorescence spectroscopy (XRF) (spectrometer ZSX 400, Rigaku, Tokyo, Japan) are given in
Table 9.
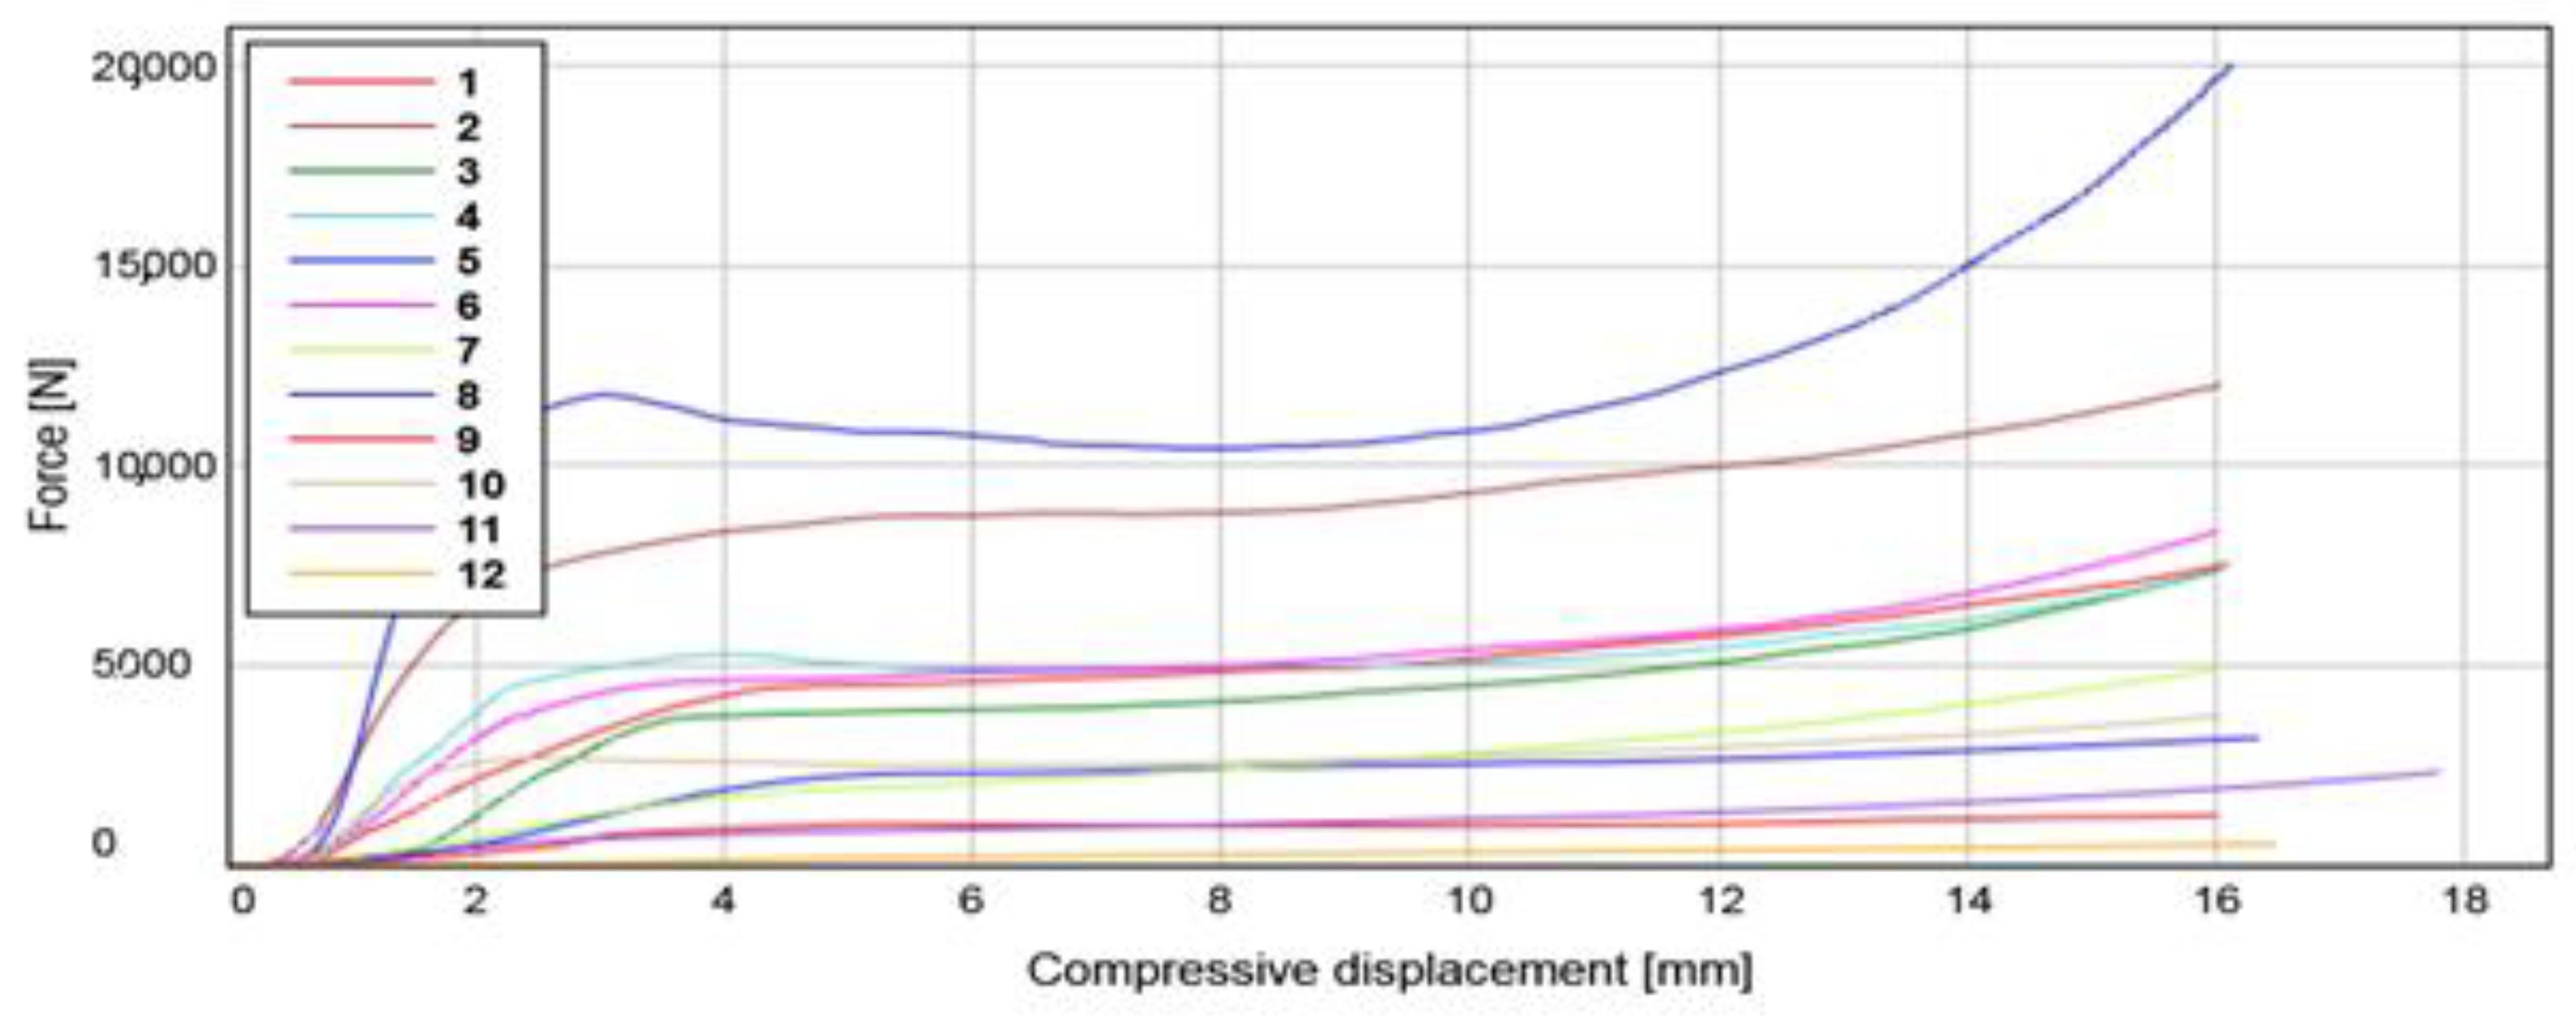
The results of compression–deformation tests show that naturally occurring fibers in peat perform mechanically similarly to steel reinforcement or glass fiber admixtures in conventional cement-based concrete, with a difference appearing when compression occurs. The reinforcement effect and plasticity provided by the peat fiber to the composite are better, and the mechanical pressure exerted on the peat–ash composite is higher.
Figure 8 shows that the compressive strength of the composite increases again under load after crossing the “plateau”, unlike normal concrete. This may be due to the effect of heat from mechanical stress on the lignin contained in the naturally occurring fibers in the peat, creating an additional “glue effect” in the composite. This described phenomenon requires further research.
As shown in
Table 8, the content of the semi-amorphous CSH phase (hydrated semi-amorphous calcium silicate) increased almost four-fold in the order of T17 > T11 > T10, while the content of non-hydrated quartz showed the opposite trend. The quartz content decreased in the order of T10 > T11 > T17 from 33.6% in T10 to 10.3% in T11 and 6.8% in T17. The high SiO
2 content of specimen T10 also indicates that SiO
2 was added in excess, and its hydration and the rate of CSH gel (amorphous and semi-amorphous calcium silicate) formation were limited by the Ca
2+ ion content, resulting in lower plasticity of the specimen compared to other specimens. For specimens T10 and T11, which had a lower content of CSH gel (amorphous and semi-amorphous calcium silicate), the crystallization of alkaline feldspars proceeded faster, while for specimen T17, it proceeded significantly slower. The crystallization of alkaline feldspars was also described in our previous work
3.
Among all samples, a relatively similar amount of the fully amorphous phase, which includes both the organic matter and a portion of the CSH gel, was present. Belite was detected only in specimen T17. The crystal phases of specimen T11 containing CFB ash also showed higher amounts of Mg- and Fe-bearing minerals.
4.2. Simulation of the Natural Conditions in the Lab
Based on the test results, it can be seen that the water content mixtures are 2–3 times lower than those of natural soil under the same conditions. As a result, we can say that mixtures do not absorb water and stay relatively dry.
4.3. Initial Tests in Nature
Five samples were taken, the phase composition and mineral compositions of which are outlined in
Table 10 and
Table 11. The formation of crystalline phases proceeds relatively slowly under swamp conditions, and amorphous phases still make up approximately half of the total mass after 4 months.
Several elements, such as C, Si K, Al, Fe, and S Cl, are concentrated in the upper layer, but the contents of O, Ca, Mg, Ba, and Na are higher in deeper layers. The contents of P and Mn do not change significantly with depth.
4.4. Mechanical Testing of the Specimens
All the results of mechanical tests are summarized in
Table 12 (see below).
During the compression tests, the water content and density of the test body were determined. The density of the soil is characterized by the compression index Cc. The water content and density were determined before and after compression, and the parameter CC was calculated.
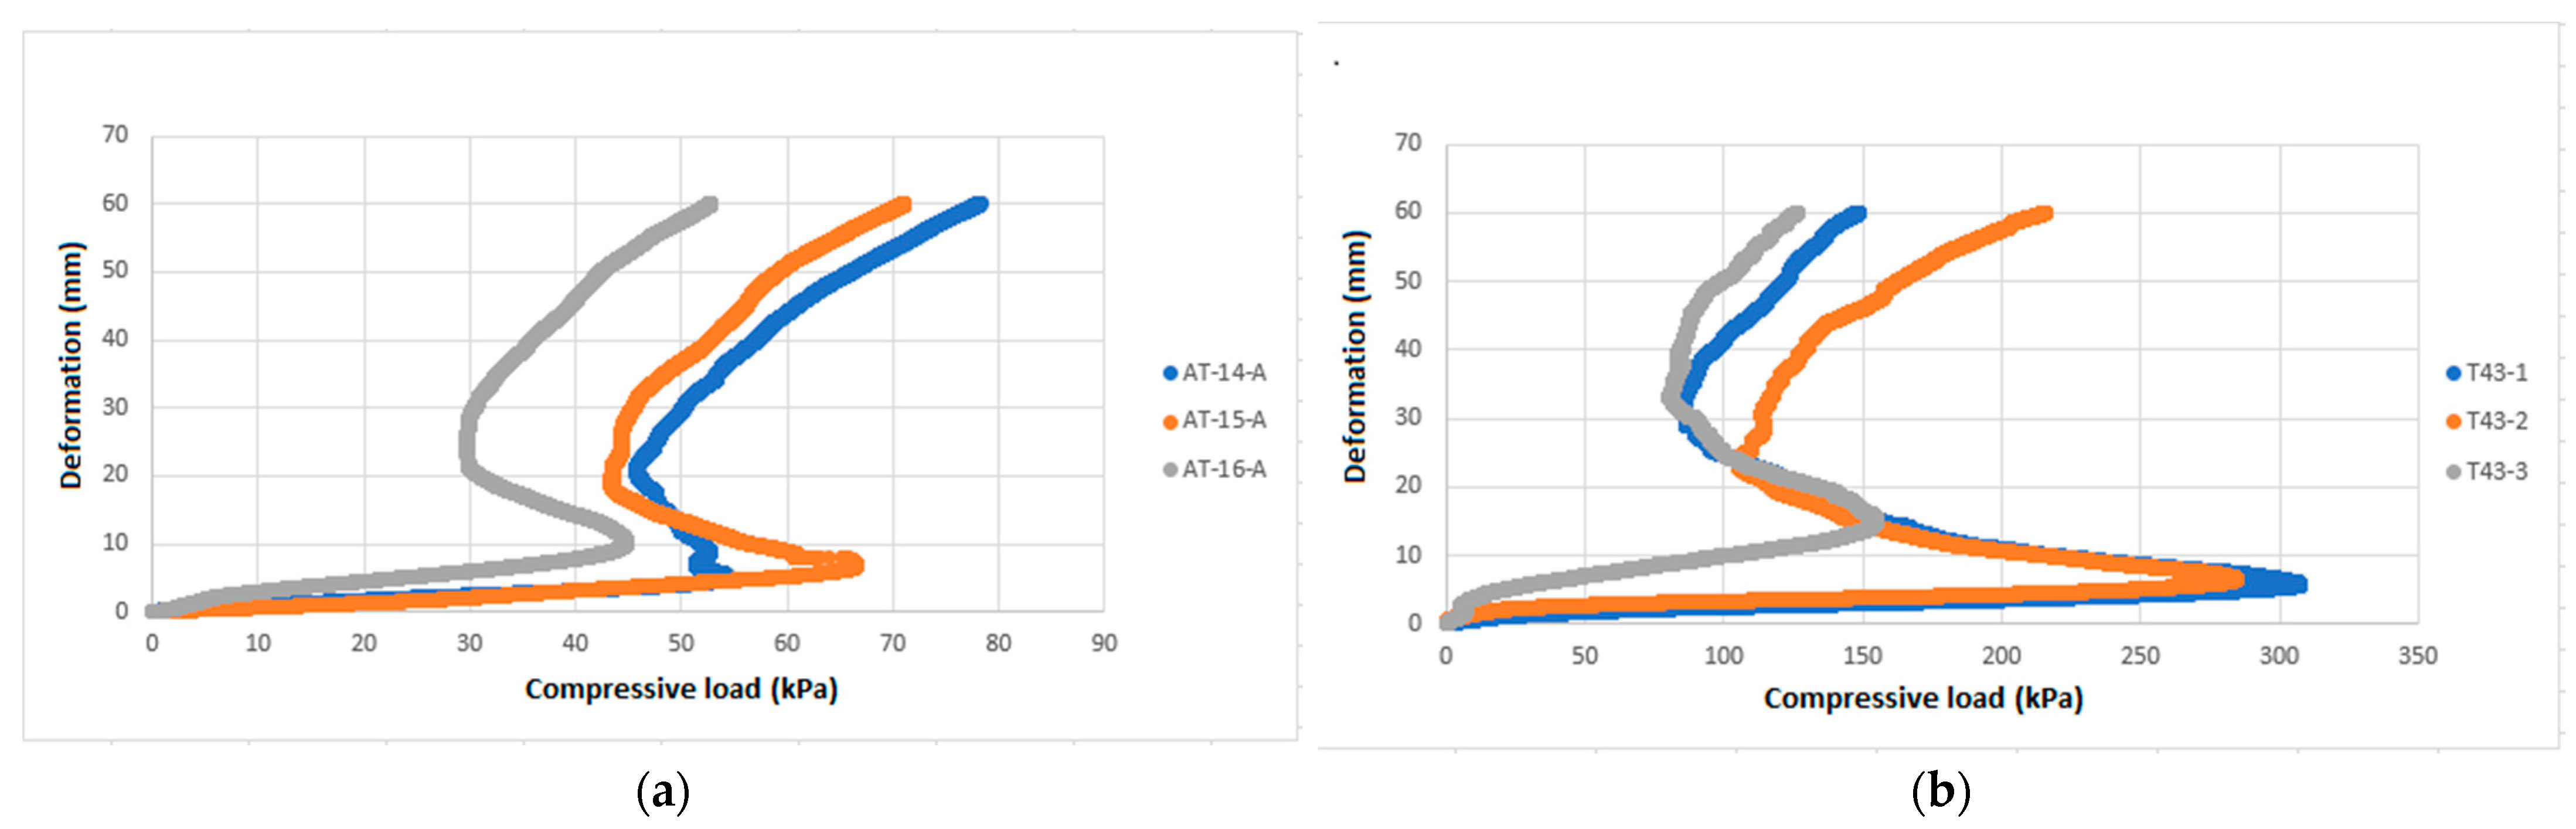
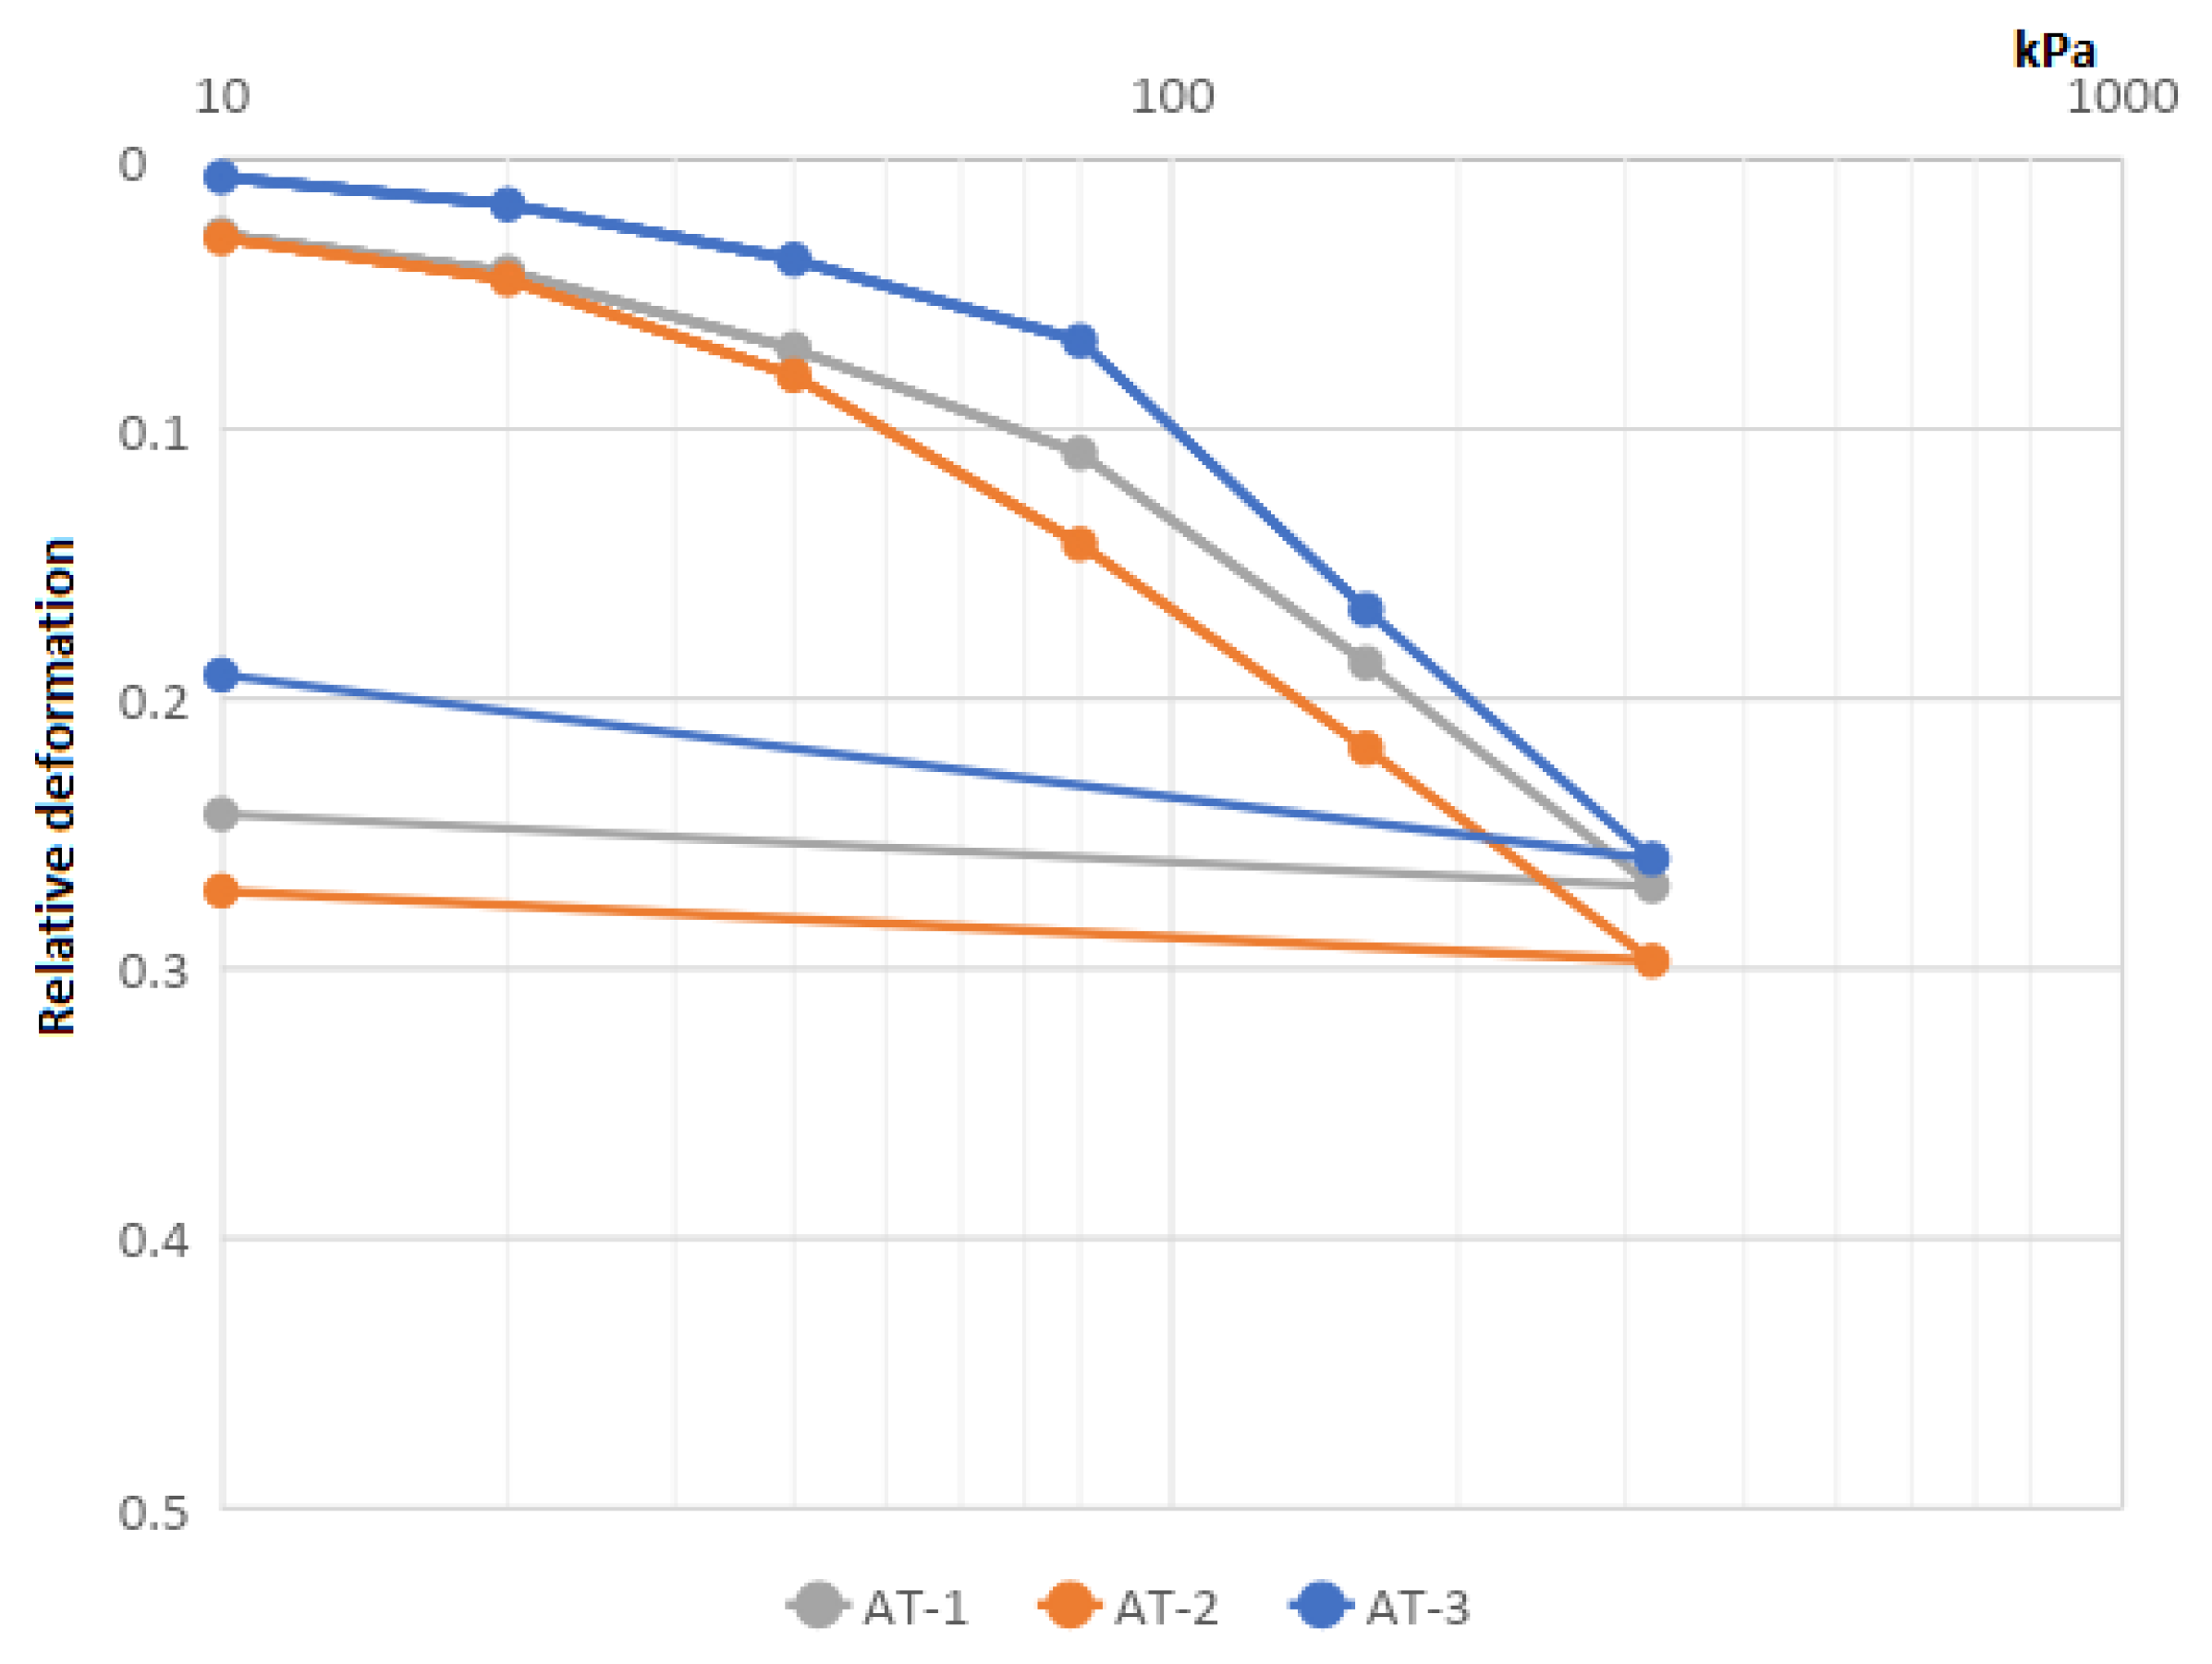
Based on the graph, Δh/h = f(ɕ), the overconsolidation ratio ɕ
p was determined. During the tests, the water content was changed, reducing it from 400% to 250%. The calculated deformation modules were in the range of 0.3–0.7 MPa (see
Figure 9); therefore, they indicate that the behavior of the material was at a compression exceeding the creep limit. The value of ɕ
p was 90 kPa, slightly higher than that obtained from the plate load test (see below).
Based on the results of the uniaxial compression test, it can be said that the compressive strength q
u of the soils used is in the range of 12–30 kPa (
Table 12). The compressive strengths of different composites are in the range of 25–100 kPa.
In the graphs above (
Figure 9), we can see a swan-neck-shaped curve that can be explained by the fact that after reaching a certain compression ratio, the peat fibers in the material behave like reinforcement structures (similar to steel or fiber reinforcement in concrete). Unlike concrete, the material is not broken, but after reaching a certain compression ratio, the compressive strength of the material increases again.
4.5. Investigation of Properties of Test Roads
Property determination results must always be verified with plate load tests in complicated cases such as the current one [
16]. With these tests, we can assess distinctive points in the material under testing, where changes in physical processes occur which allows us to evaluate the actual load capacity of the material [
17].
For weak materials, such as our improved peat, the load capacity is limited by the creep limit (the maximum stress that will cause less than a specified quantity of creep in a given time). Until it reaches this limit, the material can be compressed [
18]. Beyond the creep limit, changes in the shape of the specimen occur, and it may flow out from under the plate. In our tests, we did not reach complete disintegration.
Previous laboratory studies showed that soil that improved with oil shale ash on a uniaxial test behaves differently from ordinary soil; its arrangements are mainly related to changes in form, and common compaction does not take place.
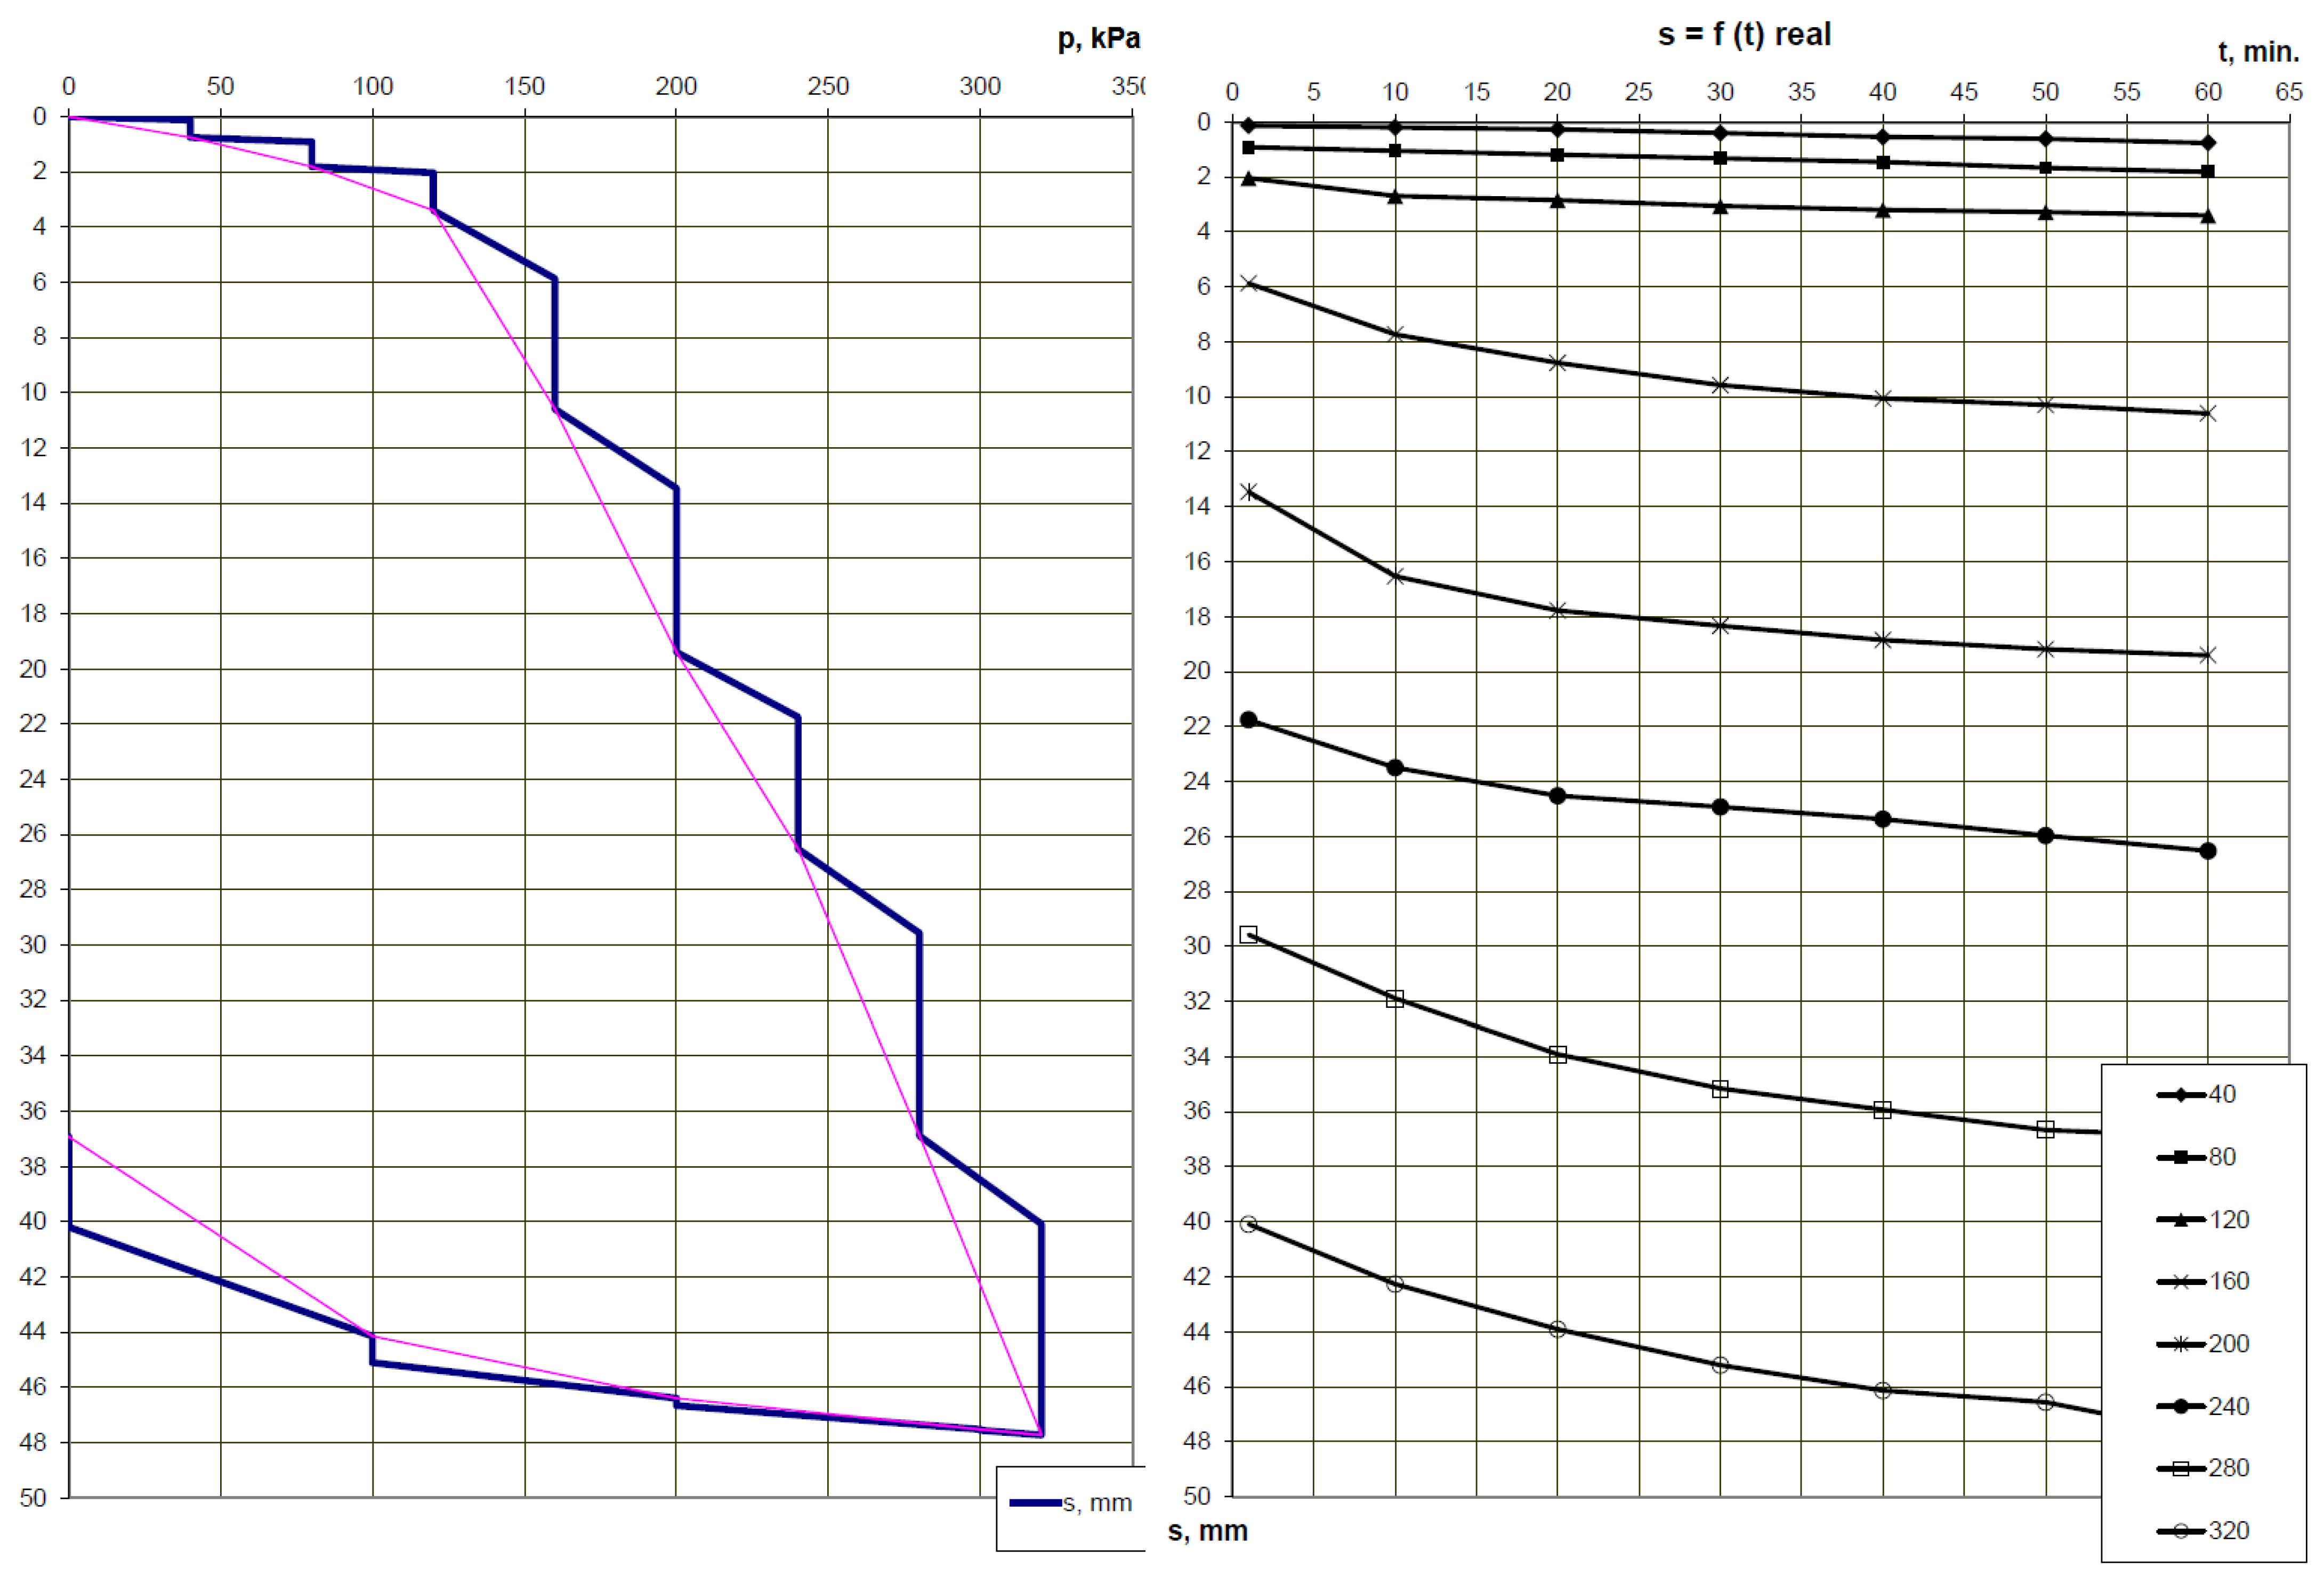
All tests provided are characterized by the development of low-intensity deformations up to the yield point as the load increases. At the creep limit, the intensity of deformations increases significantly, and the circumference of the specimens increases in the process. The formation of a larger surface area leads to a decrease in the intensity of the deformation and apparent strengthening. If the new diameter is taken into account, this strengthening is practically absent, and the improved soil actually behaves like a liquid (
Figure 10).
In the plate load test, the improved soil behaved similarly. On the graph S = f(q) (q—pressure), two segments can be separated, the first 0 to 120 kPa and the second 12 to 320 kPa. In both sections, there is a linear relationship between the pressure q and the settlement S.
In the first section, the size of the initial deformation at the load level is 0.1 to 0.2 mm. The creep index K (mm), which characterizes the intensity of the deformations, is determined by the following formula:
which is relatively small—0.3 to 0.37 mm. S is the subsidence at the 60th and 20th minutes.
After reaching the creep limit, the initial deformations increased significantly from 2.5 to 3.2 mm, almost 10 times, and the creep index increased from 1.12 to 2.5 mm, almost 4 to 8 times. In the first section of the test, the deformation modulus calculated on the basis of test data was 13 MPa, and the deformation modulus considering time was 7 MPa. At pressures exceeding the yield strength, these numbers are 1.5 MPa and 0.5 MPa.
The average shear strength of the undrained unconsolidated improved soil calculated based on the results was 0.087 MPa. However, the creep limit value of 135 kPa calculated by L. Jürgenson’s formula [
19] is somewhat higher than the 120 kPa determined by the plate load test.
—creep limit value.
—undrained shear strength of soil.
5. Conclusions
Using kukersite oil shale ash to stabilize peat soils has been largely unsuccessful in studies published so far. However, the current study shows that excellent results can be achieved when the chemistry of the process is altered. For this purpose, two changes are necessary:
First, the pH of the mixture must be raised to over 13 to allow the retarding influence of humic acids to be eliminated.
Second, pozzolanic agents must be added to form the C–S–H phase which binds the organic fibers together and allows the organic fibers to function as a reinforcement.
Based on an experiment and tests, it can be said that the strength of the test embankment material is sufficient up to pressures of 100 kPa, and the arrangements accompanying its loading do not pose a threat to transport. The load-bearing capacity can be increased by using a geotextile, but this needs to be evaluated with corresponding plate load tests.
In any case, the achieved compression strength is sufficient for building roads with a moderate load capacity, such as roads serving natural reserves or military objects. The building costs of such roads are several times lower than those using traditional methods. For full-scale applications, a machine with a continuous mode of operation must be constructed. A matter of importance is also the significantly lower environmental impact of this method; the water regime of peat soils remains presumably unchanged, thus preventing GHG emissions and reducing negative impacts on biodiversity in comparison with traditional mass-stabilization methods. The tests were planned to be carried out sequentially in order to reach a satisfactory result with a minimum amount of time, labor, and material consumption. Each subsequent series of tests was based on the previous series, on the basis of which a limited number of test samples were selected for further studies; therefore, the results cannot be summarized.


 ,
, 


