Article

Initial Student Attention-Allocation and Flight-Performance Improvements Based on Eye-Movement Data

1
School of Flight Technology, Civil Aviation Flight University of China, Guanghan 618307, China
2
Guanghan Campus, Civil Aviation Flight University of China, Guanghan 618307, China
3
School of Civil Aviation Inspector Training, Civil Aviation Flight University of China, Guanghan 618307, China
*
Author to whom correspondence should be addressed.
Appl. Sci. 2023, 13(17), 9876; https://doi.org/10.3390/app13179876
Submission received: 19 July 2023 / Revised: 18 August 2023 / Accepted: 30 August 2023 / Published: 31 August 2023
(This article belongs to the Special Issue Research on Aviation Safety)

Abstract

:
At the onset of their flight careers, novice pilots often lack clarity regarding the standard attention-allocation pattern. Therefore, to enhance the efficiency of initial flight training, it is crucial for students to develop a comprehensive understanding of flight control and attention-allocation behavior during the learning process. In this study, flight-performance data and eye-movement data from experienced instructors in no-power stall scenarios were collected to create an attention-allocation training course. An experimental group underwent the attention-allocation training course, while a control group followed the traditional teaching curriculum. The disparities between the flight performance and eye-movement indices of the two groups after they completed their respective courses were compared to evaluate the effectiveness of the training. The finding indicate significant differences between the speed losses, altitude losses, and mean course deviations of the instructors and the control group; these indicators had p-values of 0.01, 0.004, and 0.001, respectively. Moreover, significant differences were observed between the altitude losses and mean course deviations of the instructors and the experimental group; these indicators had p-values of 0.006 and 0.001, respectively. The experimental group, which underwent attention-allocation training, exhibited eye-movement indices that closely resembled those of the instructor group, and its instrument scanning was more strategic, thereby resulting in improved flight performance from that of the control group. Additionally, correlations were observed between flight-performance indices and eye-movement indices of the students. Overall, this study demonstrates the effectiveness of an attention-allocation training course designed specifically for a no-power stall scenario. It effectively enhanced the training outcomes of novice pilots, promoted an appropriate allocation of attention to instrument displays, introduced a novel approach to flight training, and ultimately contributed to aviation safety.

1. Introduction

1.1. Research Background and Study Significance

In recent years, flight training has emerged as a critical concern within the aviation community due to its pivotal role in aviation safety and pilot training. In order to improve the pilot’s ability to monitor the flying environment, the French accident investigation agency has conducted a large number of accident investigations and suggested that various departments start to study the pilot’s eye movement patterns. Among them, the research by Adam et al. [1] showed that more than 900 pilots did not Knowing what the standard distribution of attention looks like requires a more detailed description of visual scanning. At the same time, the International Air Transport Association (IATA) also issued recommendations on strengthening cockpit monitoring and improving situational awareness in its 2016 report [2,3]. According to a survey by Lefrancois [4] et al., nearly 75% of pilots felt that getting a standard scan pattern would allow them to further improve their level of attention allocation. Attention allocation, which is a key cognitive resource, has garnered attention from psychologists, who posit that consuming more than the available resources for a task may lead to performance decline, while appropriate attention allocation allows a person to flexibly adapt to changing task demands [5]. It is widely known that the human visual system plays a paramount role in cognitive processing; more than 80% of the information transmitted to the brain is gathered through vision [6,7]. Eye-tracking technology, which was initially developed by Dodge et al. [8], can offer valuable insight into human cognition, learning, and decision-making processes by studying eye-movement behavior. A large amount of research has demonstrated that a strong correlation exists between eye-movement behavior and expertise across a wide variety of fields, which include driving [9], medicine [10,11,12], sports [13], and chess [14] applications. Specifically, these studies revealed that the gaze durations of experienced experts are shorter than those of inexperienced novices within the same field of study. In the aviation field, Song et al. [15] demonstrated the efficacy of studying the differences between eye-movement characteristics of novice and expert pilots by analyzing eye-movement indices for different flight scenarios. Shriver et al. [16] found that experts exhibited enhanced information-processing capabilities and made more accurate decisions during visual searching tasks. In their study regarding the saccade strategies of F-16 fighter pilots, Hsu et al. [17] discovered that expert pilots exhibited more stable scanning paths. Liu et al. [18] employed the expert–novice experimental paradigm to collect eye-movement indicators from flight instructors and trainees during approach maneuvers. They used gaze entropy to quantify the gaze randomness within areas of interest (AOIs) and found that flight instructors exhibited more random and flexible eye-movement patterns during approach than novice pilots. Zhu et al. [19] investigated the eye-movement characteristics of pilots during instrument-approach flights and identified significant differences between the gaze and saccade patterns of experts and novices, which directly impacted the flight performance.
Similar correlations between eye-movement data and job performance have also been observed in other fields. In the industrial production and manufacturing realm, Wu et al. [20] determined that the use of color cues significantly influenced visual cognition during numerical comparison tasks. Wang et al. [21] identified notable differences in visual behaviors that were based on various saccade modes and priority divisions in the engineering field. Their findings offer insight for optimizing human–computer interaction interfaces to improve practitioner performance. Chen et al. [22] conducted a medical image search experiment and demonstrated that different scanning modes directly affected abnormality detection. Since it is a measure of pilot control, flight performance has traditionally been assessed through instructor evaluations or the analysis of quick access recorder (QAR) data [23]. However, with the advancement of eye-tracking technology, eye-movement indices have also been incorporated into pilot performance evaluations. Yang et al. [24] analyzed several eye-movement indicators, such as fixation, saccade, and pupil diameter, at different flight stages to evaluate the correlation between pilot workload and flight performance. Chen et al. [25] observed changes in pilots’ visual scanning patterns after engine failure; they found that these failures impacted subsequent flight performance. Wang et al. [26] collected eye-movement data from cadets during uniform straight-line and variable-speed curved motion exercises; the results suggested that incorporating eye-movement indices into existing pilot selection mechanisms can enhance the pilot selection quality.
During flight training, the eye-movement behavior of instructors can also provide valuable insight into their focus, attention allocation, and problem-solving strategies during flight missions. Traditional flight training relies heavily on instructor observations and feedback, which have inherent limitations. However, with the advancement of eye-tracking technology, recording and analyzing student eye-movement behaviors can offer more accurate information and data for training and evaluation, thereby allowing for a more precise assessment of student skills and proficiency [27]. Rudi et al. [28] conducted a study that developed different eye-tracking visualization methods that flight instructors could use to evaluate the eye-movement behaviors of pilots, as well as a teacher-assisted system for data reporting with the goal of enhancing visualization during pilot training. Lounis et al. [29] focused on investigating the visual scanning strategy and flight performance differences between novice and professional pilots in multi-mission situations. The results of their study can aid the aviation industry in evaluating the monitoring performance of flight crews and improving both initial and recurrent training. Shao et al. [30] analyzed the relationships between the attention spans, instrument-reading performance, and eye-movement patterns of pilots. They found that comprehensive training involving attention allocation and instrument-reading capabilities effectively improved pilot efficiency during take-off training. Ledegang et al. [31] conducted a study involving pilot spatial disorientation and demonstrated how eye-tracking technology can provide valuable feedback regarding pilot instrument reading during spatial-disorientation simulator training; this additional feedback could enhance the flight performance. Muehlethale et al. [32] developed a novel training course for general aviation pilots that utilizes eye-tracking technology. The course covers theoretical information regarding visual scanning techniques and situational awareness and combines this training with simulator exercises or actual flights. The study results showed that this training effectively improved pilot scanning skills and situational awareness and thus enhanced flight safety. Li et al. [33] explored the attention distributions of military pilots during the pursuit of moving and stationary targets, discovering significant correlations between pilot gazing behavior and task characteristics and that the combined use of eye-tracking devices and flight simulators can effectively improve the efficiency and safety of tactical training. Haslbeck et al. [34] categorized pilots from an airline company into two groups based on flight duration (long flights and short flights) and investigated the correlation between different fixation patterns and flight performance. They found that pilots accustomed to long flights exhibited less proficiency in visual instrument scanning than those accustomed to short flights. Ryffel et al. [35] incorporated eye-tracking technology into upset-prevention and recovery training (UPRT), demonstrating that it can provide effective performance feedback, thereby improving the training quality. They recommended including the use and interpretation of eye-tracking outputs and standardized feedback in UPRT instructor training. Skvarekova et al. [36] integrated eye-tracking devices into pilot training and provided pilots with individualized visual-scanning feedback and standardized visual-scanning results after training.
In this study, a simulated flight experiment was conducted with flight trainees experiencing a typical no-power stall scenario. Flight performance data and eye-movement data were collected from both instructors and trainees during the flight training. These data were then used to develop a comprehensive set of flight training courses for beginner pilots. Statistical methods, such as correlation analyses and difference testing, were used during the development. The goal of the study was to investigate the eye-movement behavior of flight trainees during the learning and task-performance phases. This was done to help students acquire flight skills more effectively and to improve the overall flight-student training efficiency.

1.2. Objectives and Assumptions

Through the collection of flight-performance data and eye-movement data from flight instructors, standards for attention-allocation courses were established during this study. These courses were then applied to an experimental group of pilots, while a control group received traditional training courses. The flight-performance and eye-movement data from both groups were compared to evaluate the effectiveness of the attention-allocation training courses for improving trainee flight-performance and attention-allocation skills, with the ultimate goal of enhancing the quality of flight training. It was hypothesized that the flight-performance and eye-movement indexes of the experimental group, which underwent eye-movement training, would be closer to those of the instructors than those of the control group would be.

2. Materials and Methods

2.1. Subjects

A total of 38 subjects, including 8 flight instructors and 30 flight trainees, were recruited from the Guanghan Branch of the Civil Aviation Flight Academy of China. All the participants were male. To minimize the potential impact trainees previous flight experience on the experiment [16], the 30 trainees selected for the study were individuals who had flown a SR-20 aircraft but had not undergone further training on the subject of flight, no-power-stall. The flight instructors, however, possessed significant flight experience; thus, their average flight performance was a suitable reference standard. The group of flight instructors had a mean age of 27.8 years (SD = 2.9 years) and an average flight time of 3412.5 h (SD = 1795.6 h). The group of flight trainees had a mean age of 21.8 years (SD = 0.48 years) and an average flight time of 5.7 h (SD = 0.81 h). None of the participants had physiological impairments that would affect the collection of eye-movement data. Prior to the start of the experiment, the participants were provided with a mission briefing without being informed about the specific purpose of the study.

2.2. Equipment

The experiment was conducted using an SR20 single-engine fixed simulator at the Guanghan Branch of the Civil Aviation Flight Academy of China. This simulator is a flight simulation trainer officially certified by the Civil Aviation Administration of China. Eye-movement data were recorded using Tobii Pro Glasses 3, developed by Tobii Technology, with a sampling rate of 100 Hz. The experimental equipment and setting is shown in Figure 1.

2.3. Experimental Procedure

At the beginning of the experiment, Subject 1 was responsible for setting up the experimental platform. When the subjects arrived at the site, they were informed about the nature of the experiment and were asked to provide certain information, such as name, age, and number of flight hours. The subjects then proceeded to enter the simulator for pre-flight preparations. During the primary test phase, Test 1 was conducted with the simulator set to an initial altitude of 5900 feet above the Guanghan Airport, a speed of 90 knots, and a heading angle of 0°. In Test 2, the subjects were assisted in the putting on and calibrating of the eye-tracking device. This experiment began with the subject flying levelly. Then, the subject gradually closed the throttle, increased the pitch attitude continuously until stall occurred, and then immediately responded to the stall warning by changing the stall, reducing the angle of attack, filling the throttle, and recovering the wing. The subject focused on minimizing altitude losses until a recovery altitude of 5900 feet, a speed of 90 knots, and a 0 course were achieved, at which point the experiment ended. After the experiment was completed, the next subject replaced Subject 1 and Tests 1 and 2 were repeated.

2.4. Data Acquisition

2.4.1. Methods of Eye-Movement Data Acquisition and Analysis

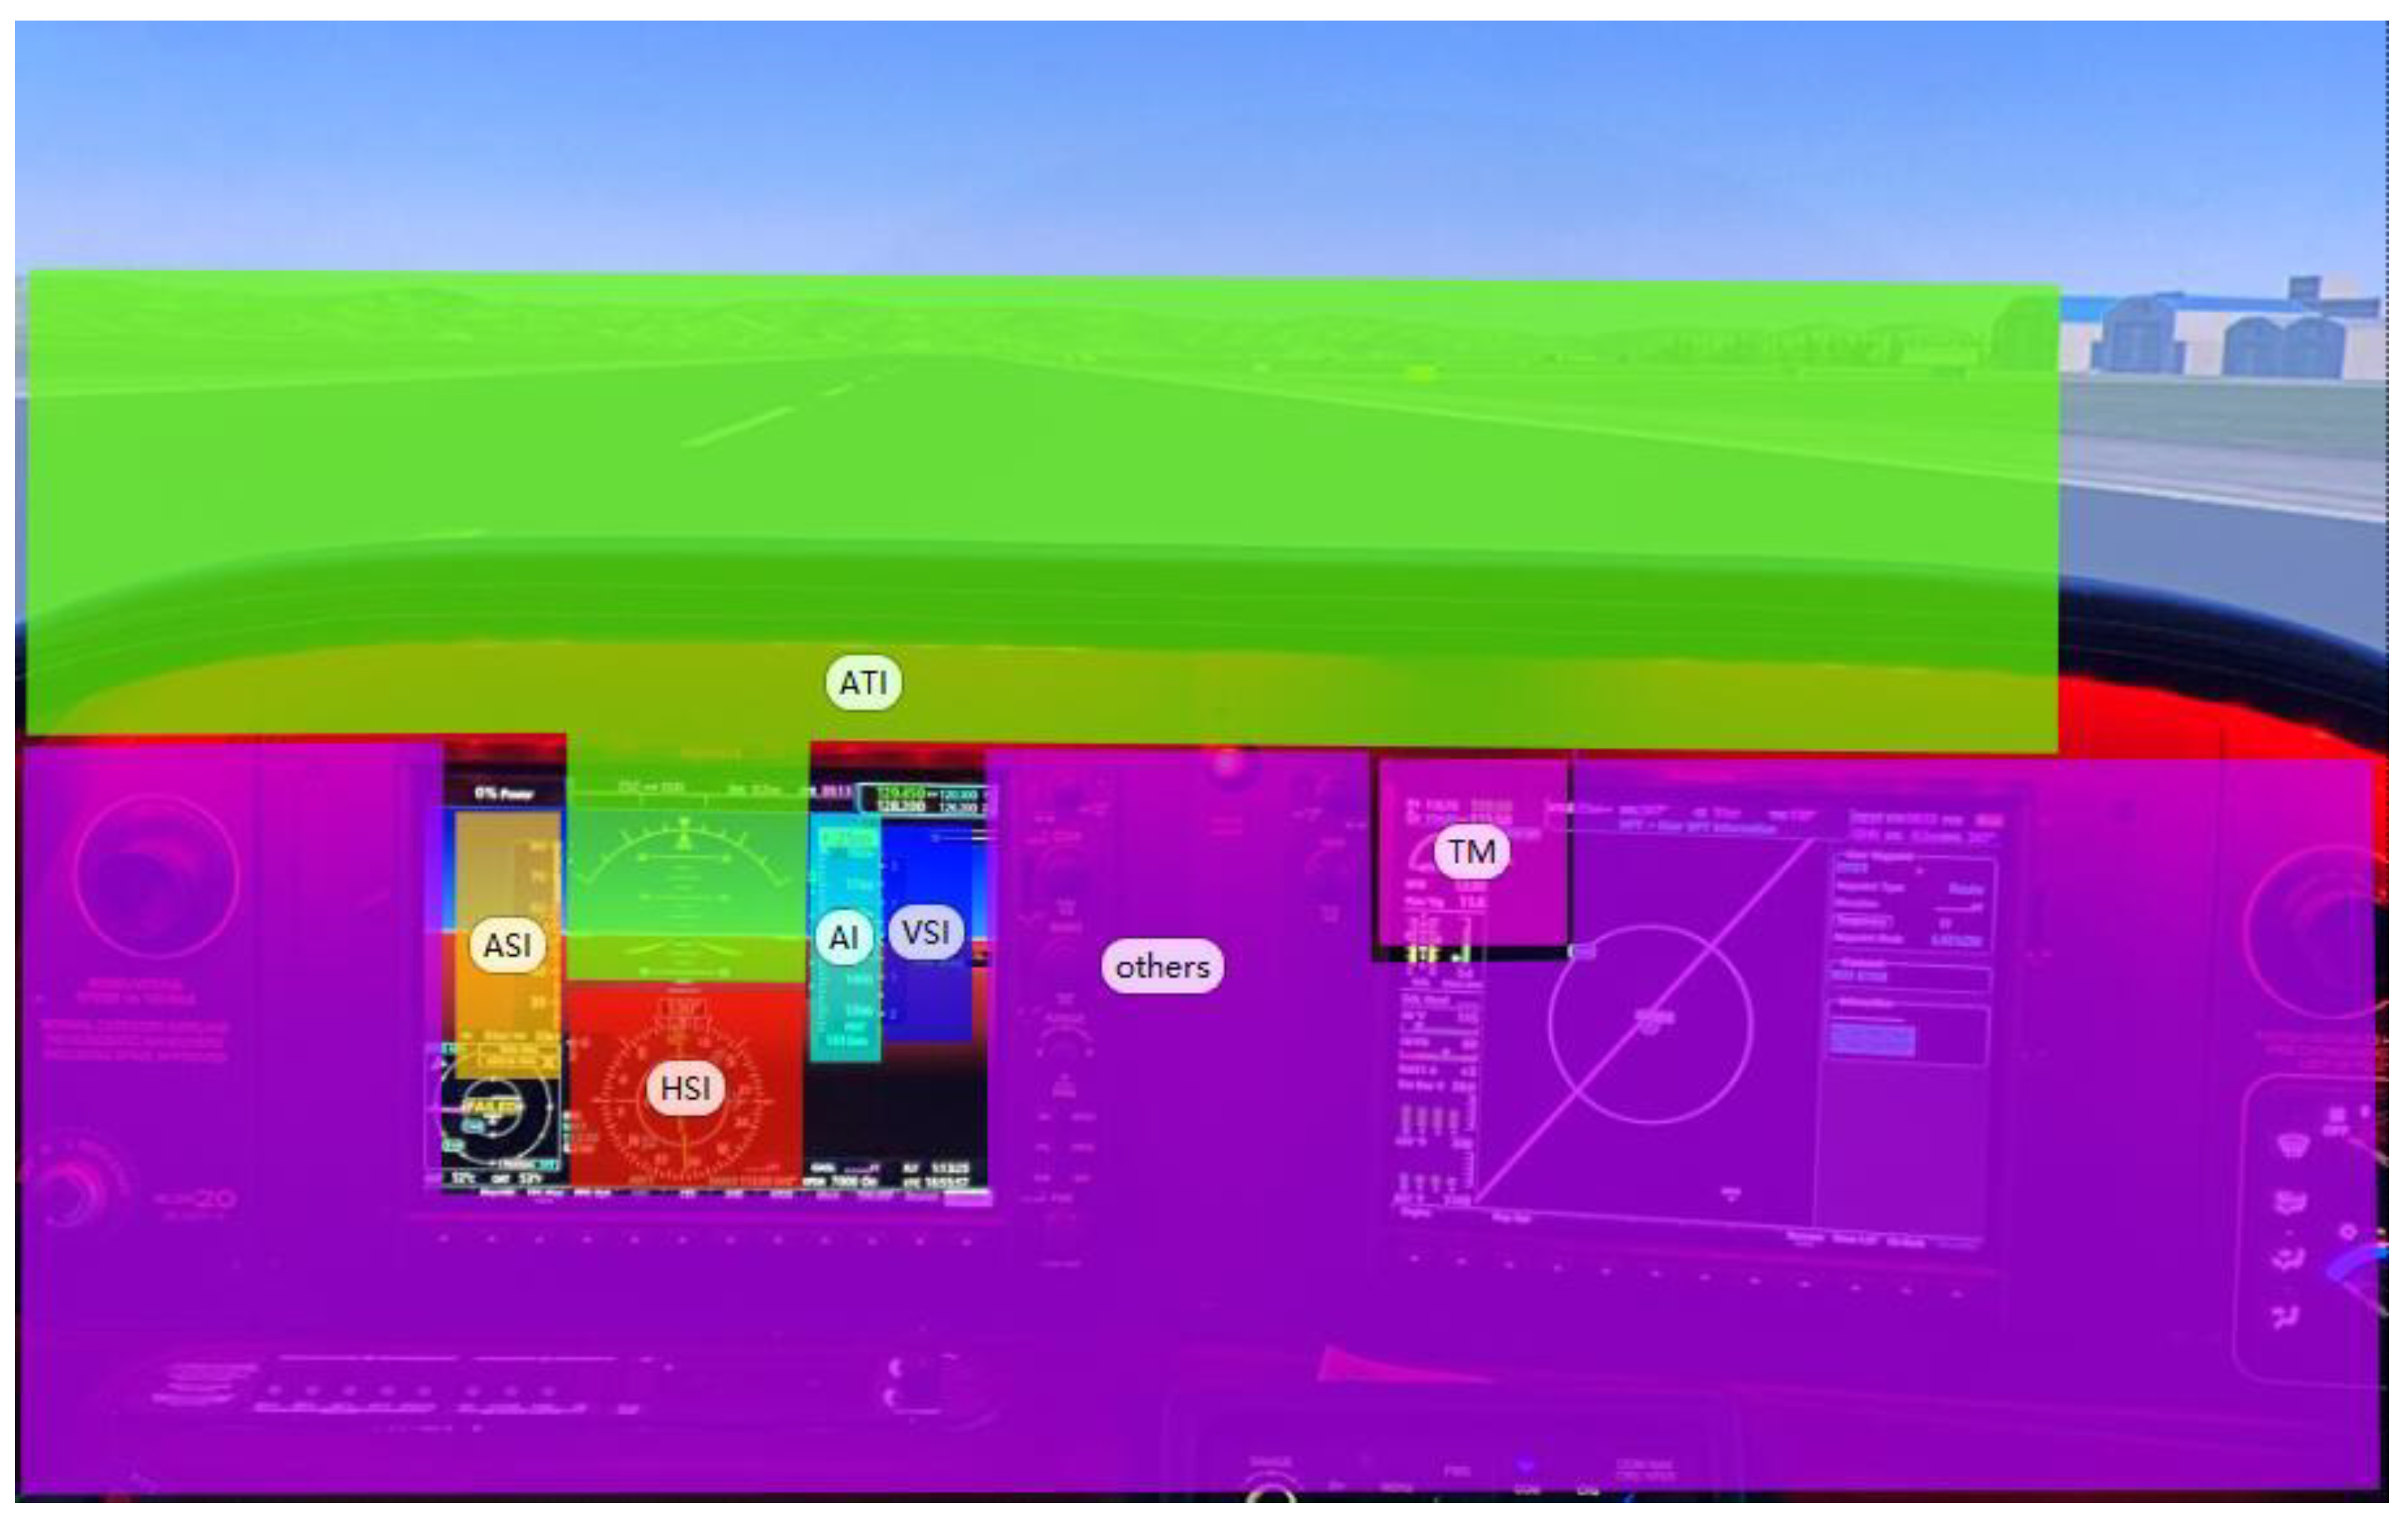
During the experiments, the Tobii Glasses 3, which is a head-mounted eye tracker with a sampling rate of 100 Hz, was utilized to record subject eye-movement data throughout the flight course. To ensure the data were of high quality, each subject underwent eye-tracker calibration before commencing the task. The calibration process involved wearing the eye tracker and focusing on a calibration card provided by Tobii Technology. The calibration process was performed by clicking on the calibration option in the data-recording software. The original eye-movement data of the subjects were collected during the experiments using the Tobii Glasses 3 software. Additionally, eye-movement videos with marked fixation points were recorded for further analysis of the course content. The raw data were processed using the Tobii Pro Lab software. During this processing, a fixation was defined as a gaze directed at a specific point for a minimum duration of 100 ms. The software had a built-in algorithm, I-VT, that was used to identify fixation points. These AOIs are illustrated in Figure 2.

2.4.2. Flight Data Acquisition and Analysis Methods

A camera was used to record the instrument changes performed by the subjects during the entire flight task. In the later stages of analysis, the instrument data in the recorded videos were identified using the Tesseract OCR algorithm. To ensure data accuracy, frame-by-frame screening and comparisons were conducted to verify the instrument data. For this study, only data gathered from pilots who had average course deviations of less than 10° were used. This threshold was set because deviations beyond ±10° are not comparable for assessing stall recovery. The average duration of the considered cycles was 120 s. This period was divided into two stages: the level phase, which lasted 60 s, and the period of stalling and recovering until a return to 5900 ft was achieved. This division allowed for instrument attention-distribution comparisons between the flight trainees during both stages, thereby capturing the normal phase as well as the phase in which stall occurred. It is important to note that strict manual control was required throughout the second stage of the flight.

2.5. Data Sources for the Experimental and Control Groups

After the data were collected by the flight instructors, both the experimental group and the control group received training materials. The experimental group received eye-movement training materials, which were new and not part of the traditional teaching approach. The control group received traditional training materials, which did not include any specific focus on eye-movement training.

2.5.1. Flight Data Acquisition and Analysis Methods

Each flight trainee in the experimental group received feedback regarding their eye-movement data from the outstanding flight instructor. The feedback included several types of information:
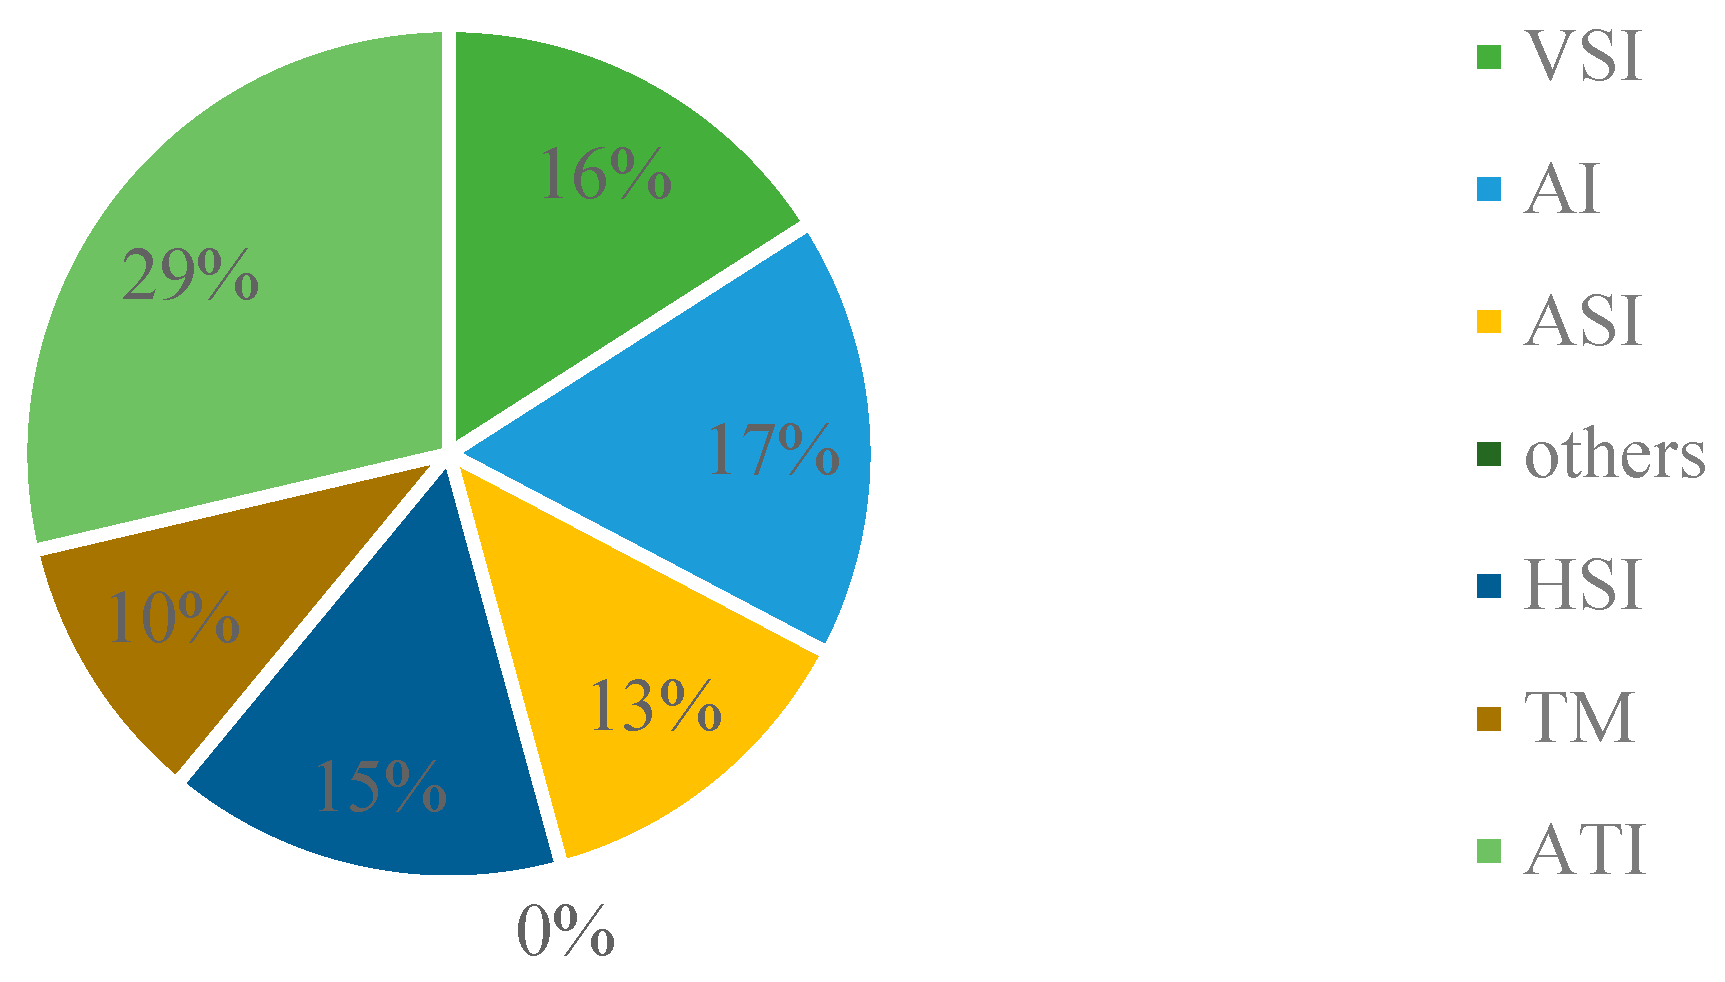
The distribution and percentage of the gazing time directed toward each AOI for the outstanding flight instructors, which are shown in Figure 3.
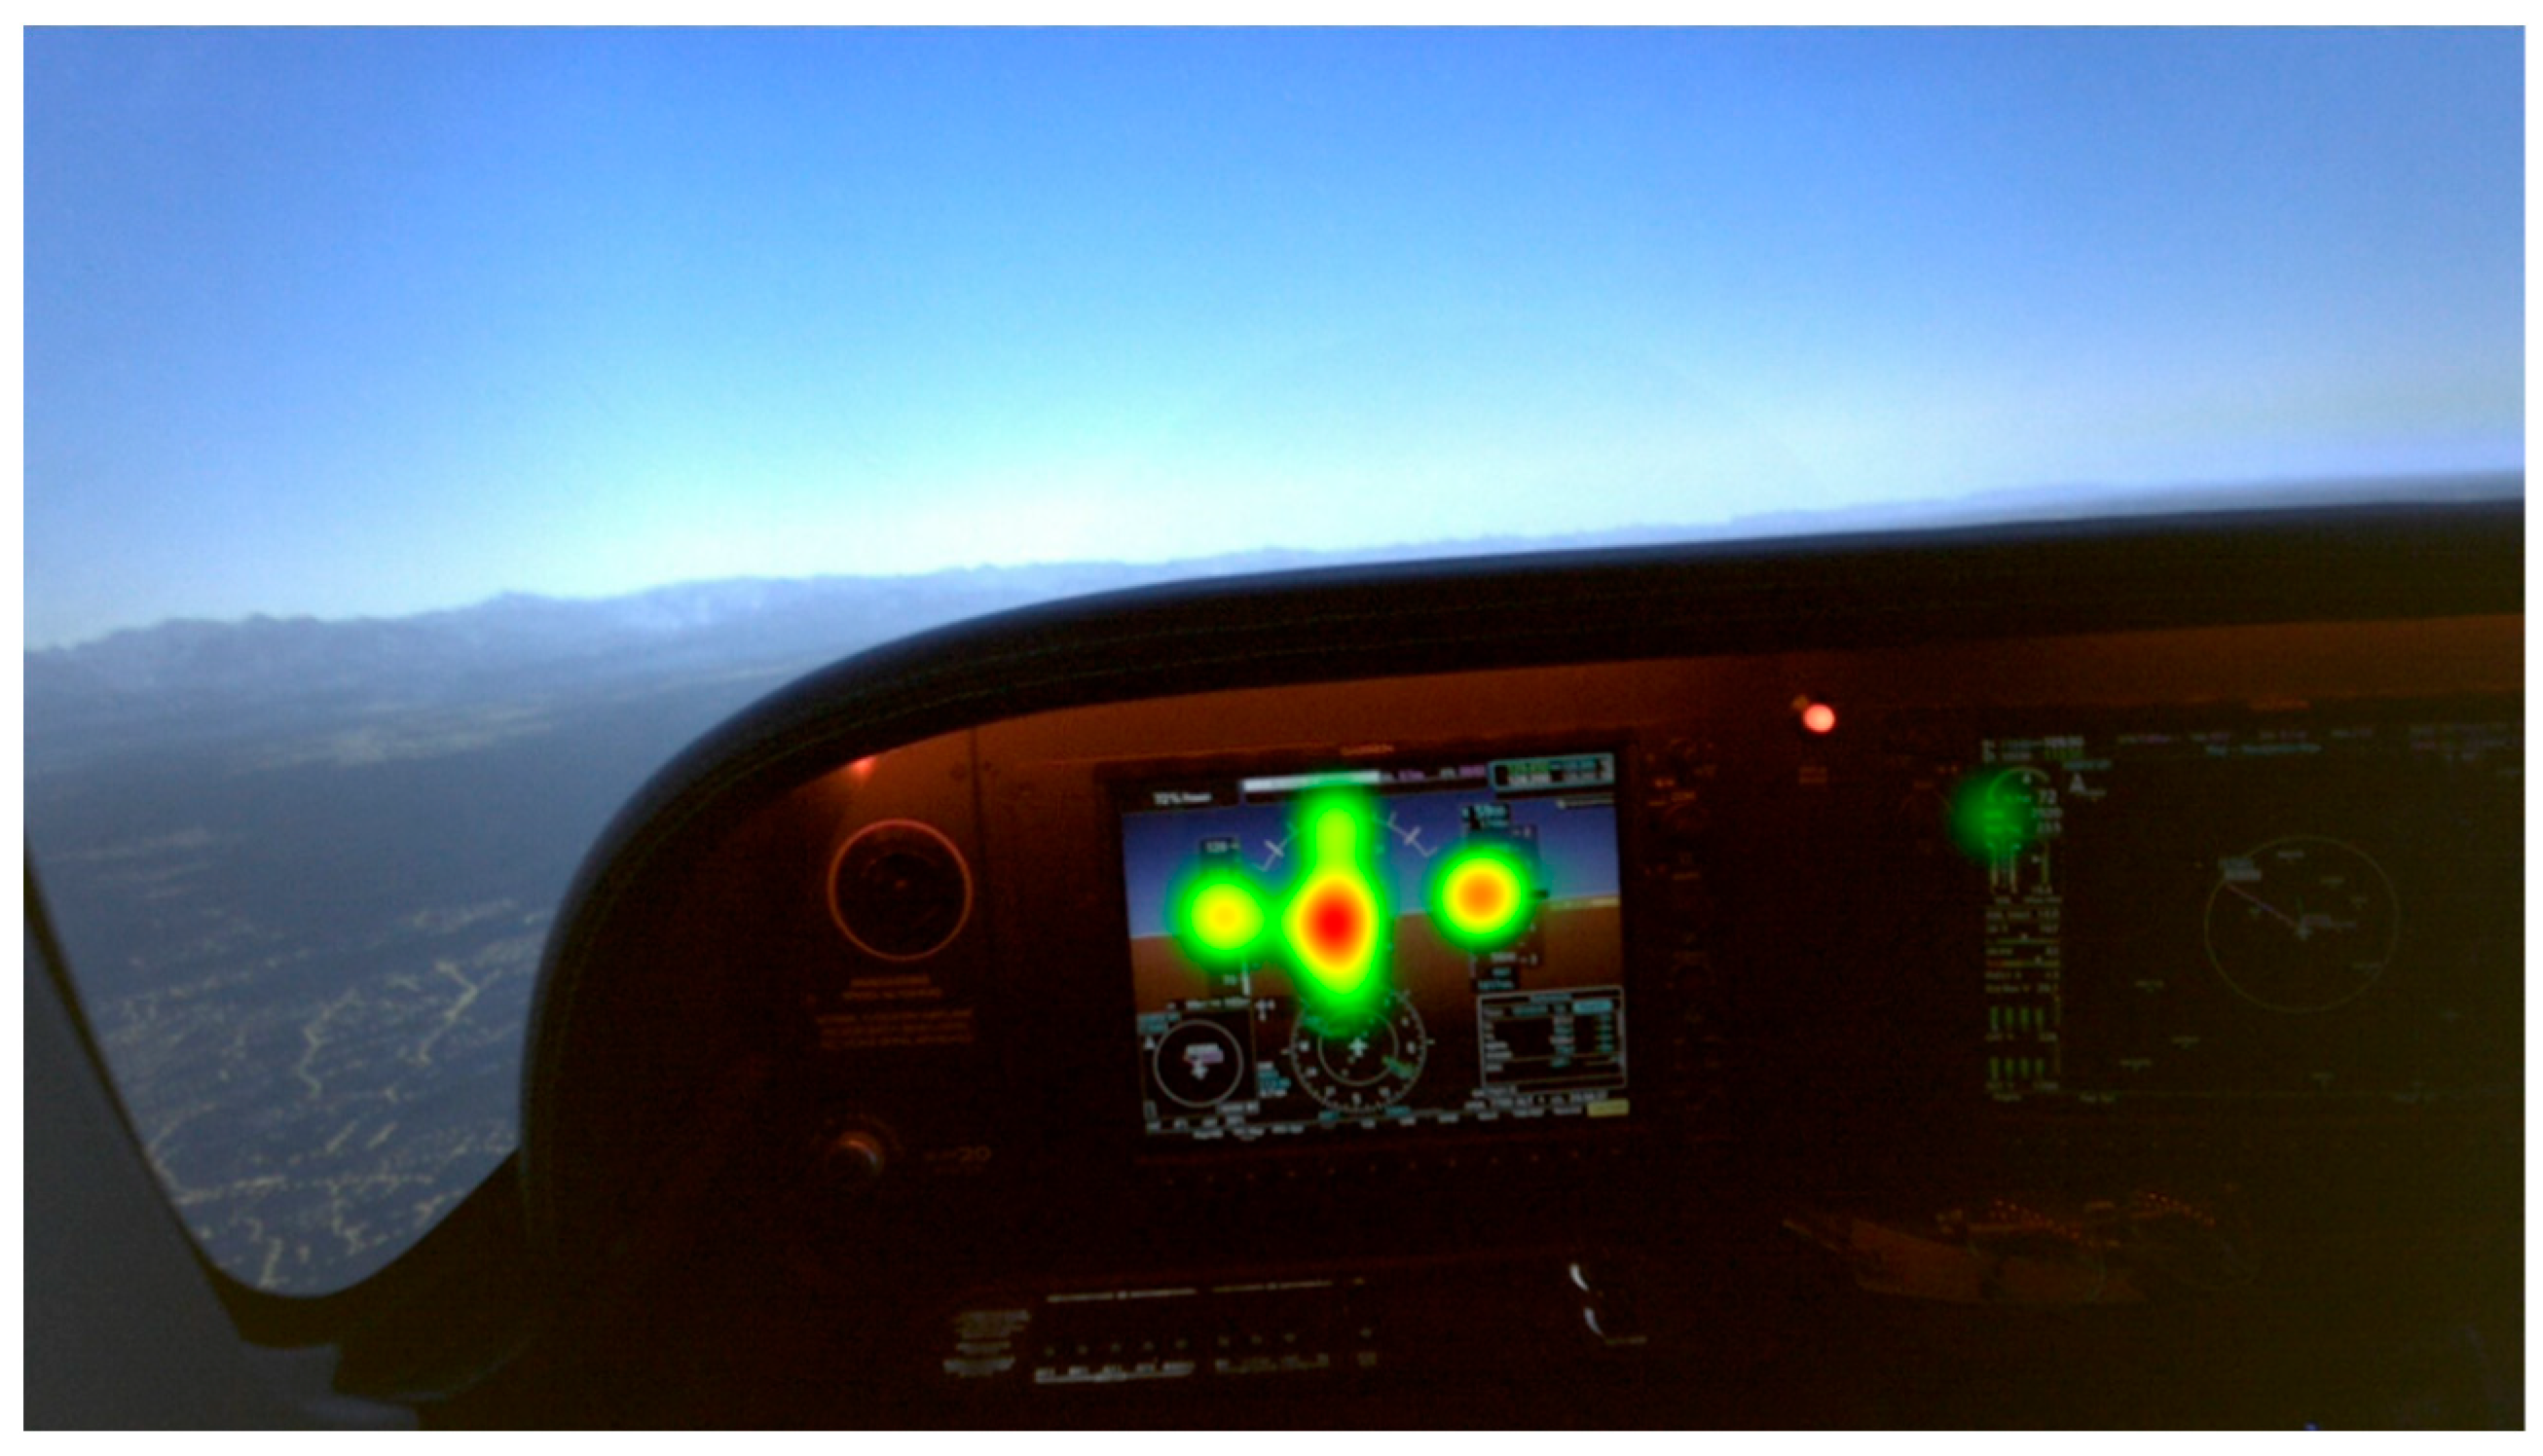
A sample gaze heat map is shown in Figure 4.
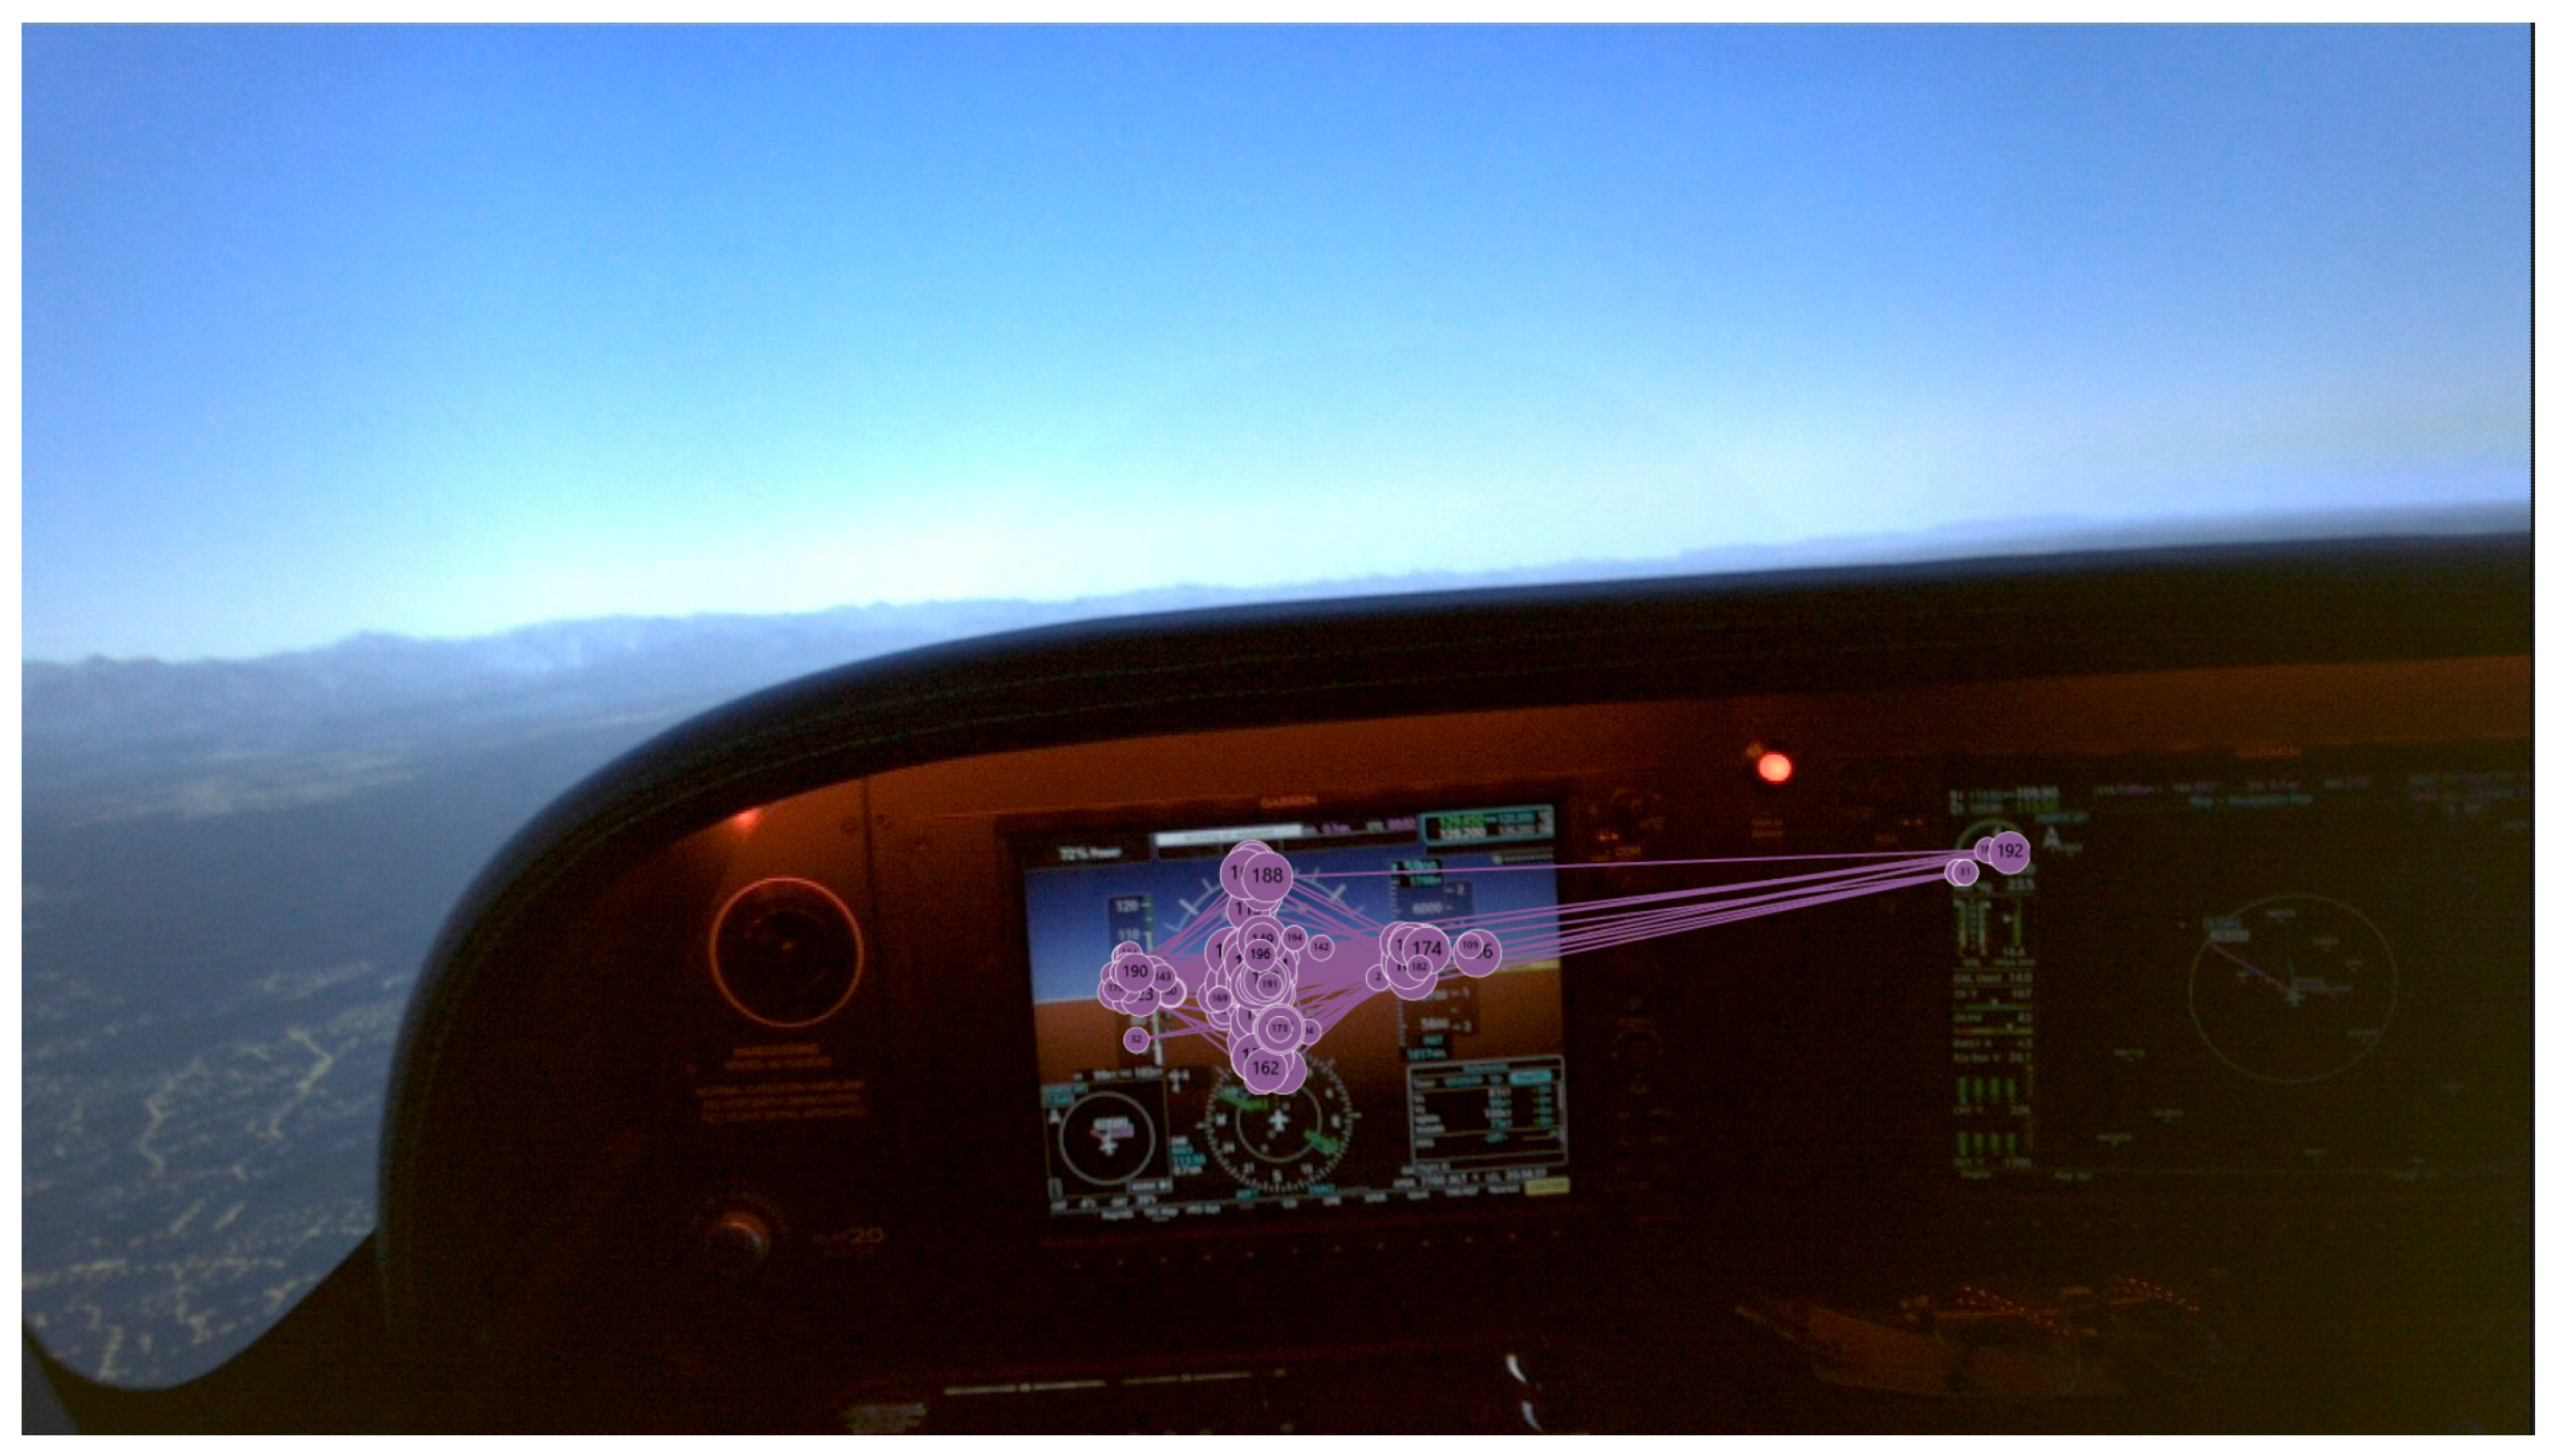
A gaze diagram, which depicted the gaze sequence and position with respect to the stimuli, is shown in Figure 5.
A first-person eye-movement video of the outstanding flight instructor during the experiment; this video reflected the gazing points of the flight instructor in real time with red circles.

2.5.2. Training Data for the Control Group

The members of the control group were only given the contents of traditional flight training courses:
A traditional flight course video (which included no eye-movement data).
Faculty according to the pilot training manual, without no-power-stall subject requirements.

3. Results

3.1. Analysis of the Differences between the Three Groups of Subjects

3.1.1. Flight Performance Differences between the Three Groups

Since the flight performance indicators did not exhibit normal distributions, non-parametric tests were employed to examine the differences between the stall correction times, stall warnings, speed losses, altitude losses, and average course deviations of the flight instructors and the flight trainees. The Mann–Whitney test statistic was utilized for the analysis. The results, which are presented in Table 1, demonstrated significant differences between the speed losses, altitude losses, and mean course deviations of the instructors and the control group; these indicators had p-values of 0.01, 0.004, and 0.001, respectively. Moreover, significant differences were observed between the altitude losses and mean course deviations of the instructors and the experimental group; these indicators had p-values of 0.006 and 0.001, respectively. Additionally, a significant difference was found between the altitude losses of the experimental group and the control group, with a p-value of 0.008.
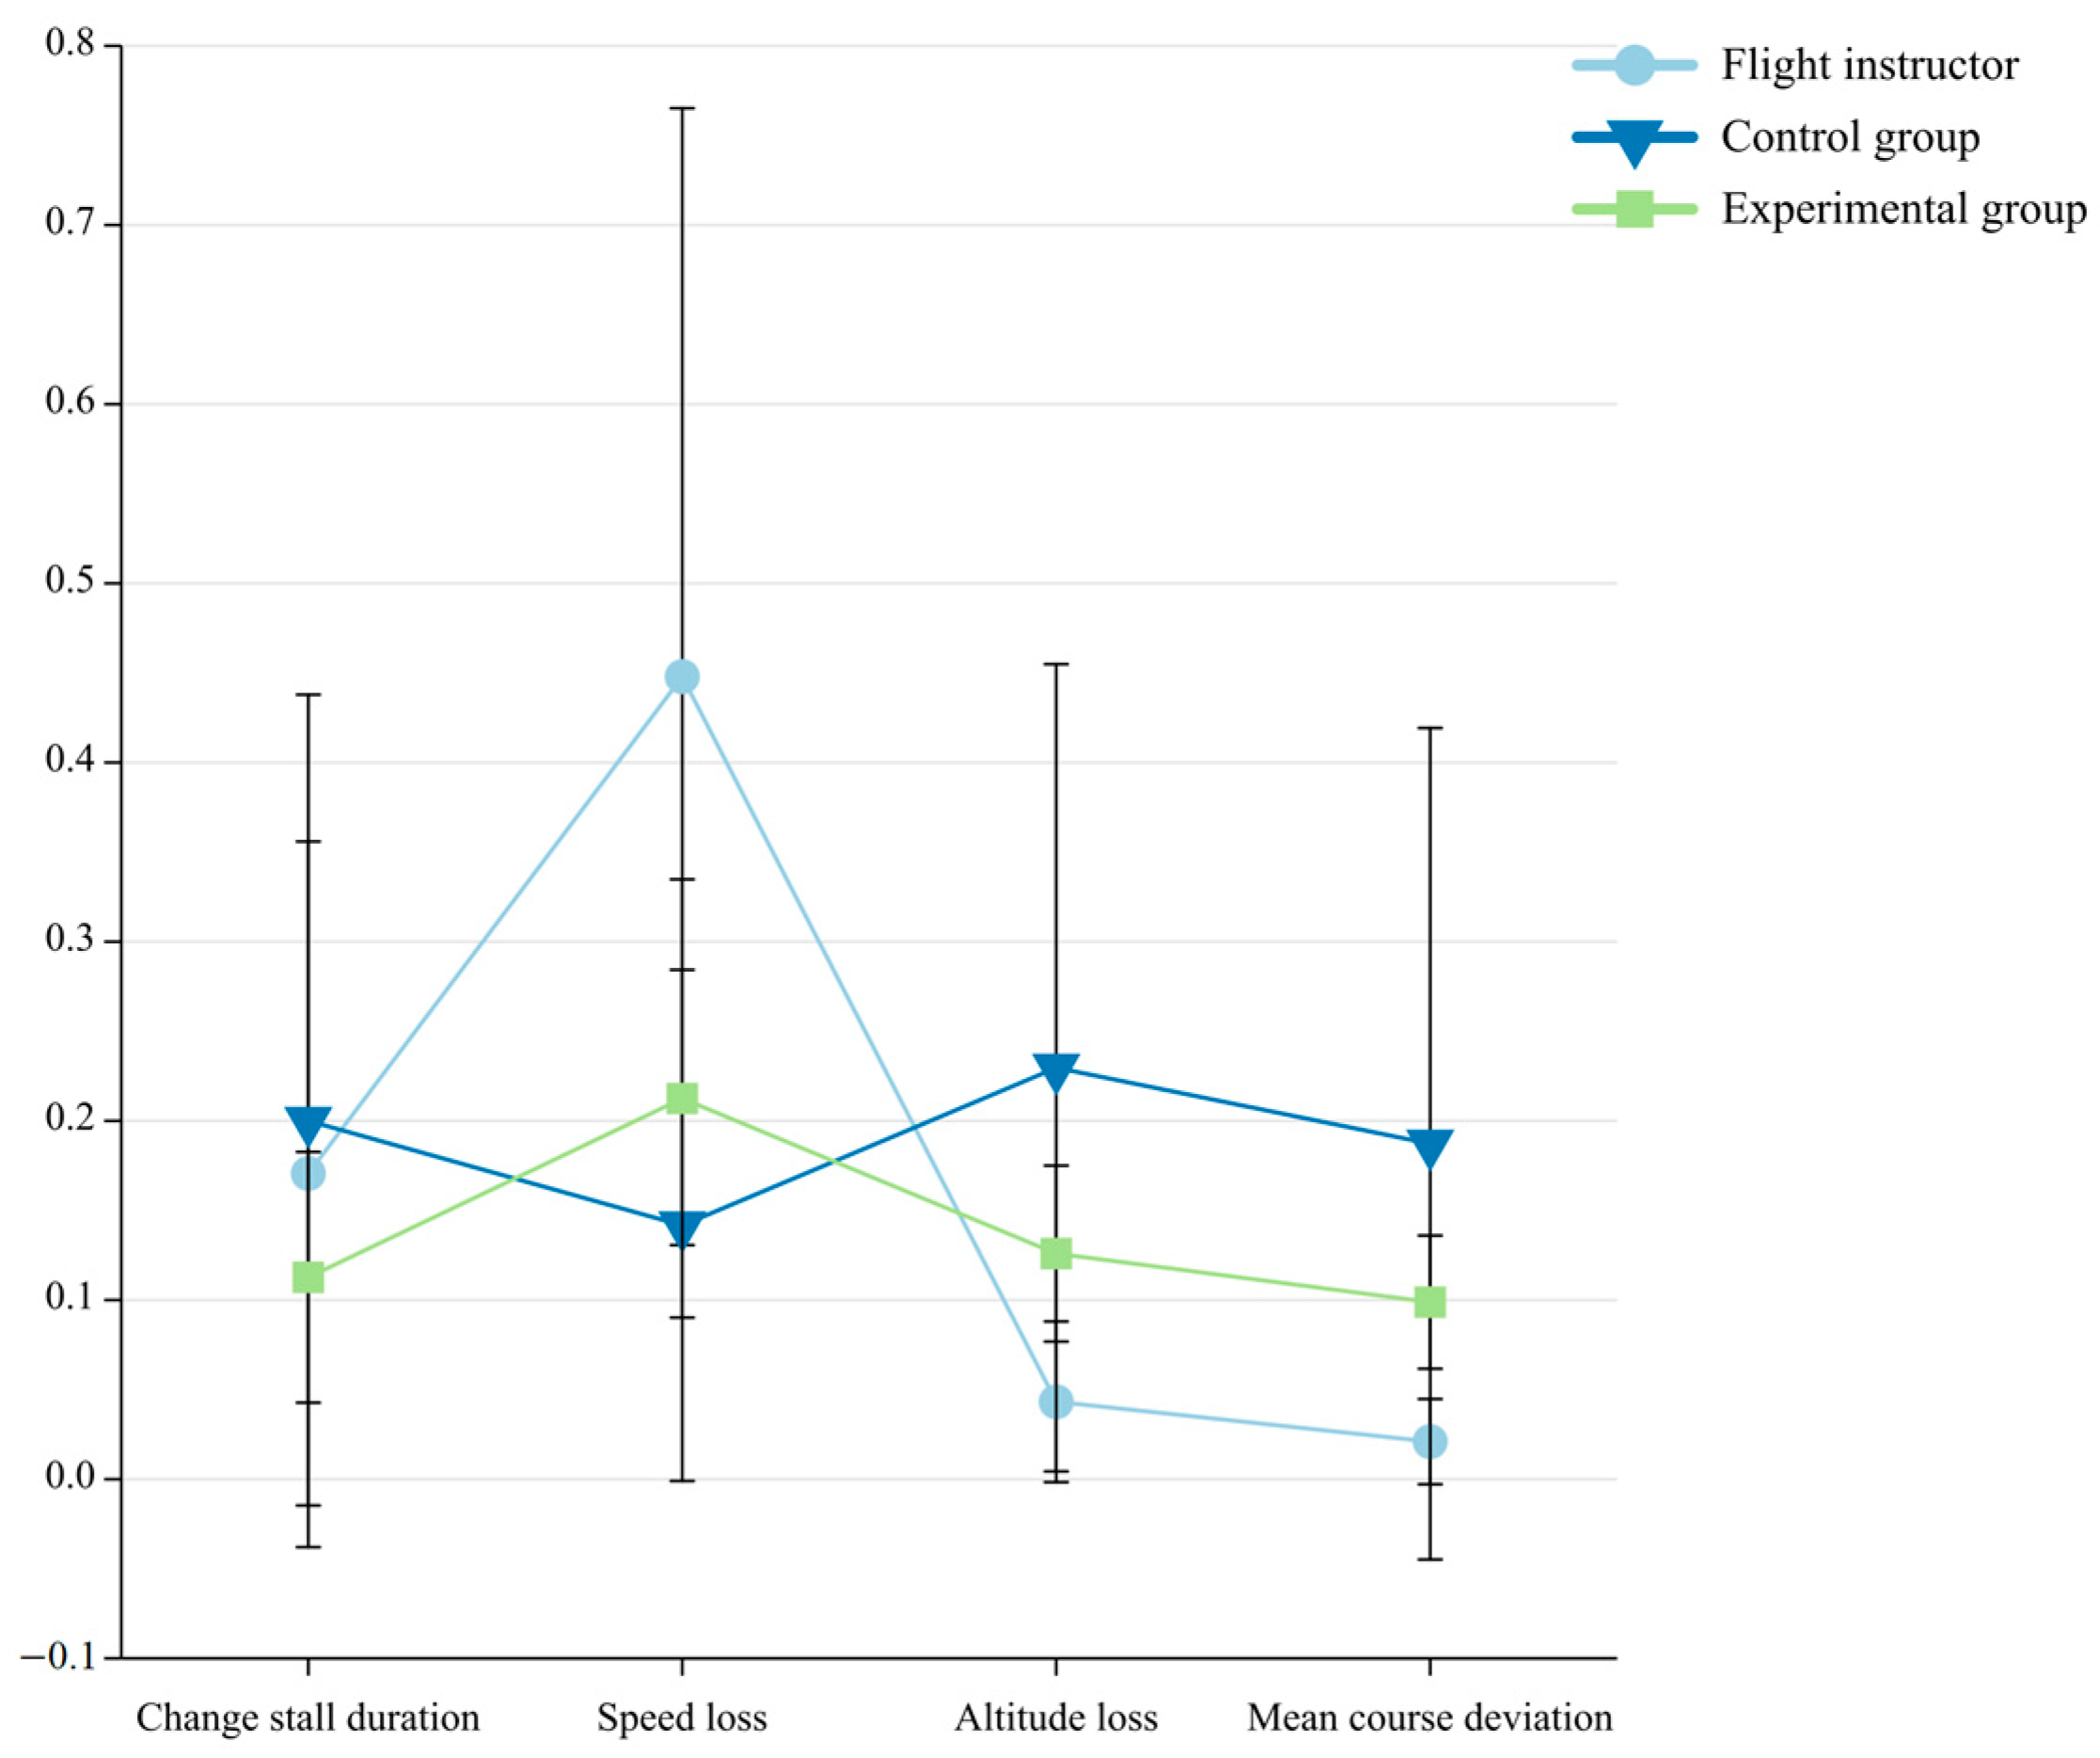
It is evident from the results in Table 1 that flight experience and the training materials had significant impacts on the speed losses, altitude losses, and average course deviations following the stall warnings. To standardize the measurements, the flight performance indicators of the three groups of subjects were normalized. Figure 6 illustrates the normalization results, which indicate that the instructor group exhibited significantly higher speed losses than did the control group, which had speed losses relatively close to those of the experimental group. The altitude losses of the instructors were much lower than those of the other two groups, and the experimental group demonstrated smaller altitude losses than the control group. The average course deviations of the instructors were lower than those of the control group but were similar to those of the experimental group.
Video playback and observations of the maneuvers performed by the instructors and trainees during the flight tasks demonstrated that the flight instructors employed smooth stabilizer-rod control, thereby effectively maintaining the required course-deviation and attitude ranges. In contrast, the students in the experimental and control groups exhibited poorer stabilizer-rod control, with the control group demonstrating significant fluctuations. Moreover, the occurrence of sideslip during the stall led to excessive course deviations and further altitude losses. Although both student groups adjusted the rod faster than the instructors and experienced smaller speed losses during the stall, their adjustments were not as accurate as those made by the instructors; this resulted in less time for corrective action. Consequently, differences between the altitude losses and average course deviations of the instructor and experimental groups were observed, while the control group exhibited significant speed-loss, altitude-loss, and average-course-deviation differences. However, there was no difference between the two groups in terms of the correction duration. The sideslip experienced by the control group during the stall further increased the difficulty of regaining altitude, thereby resulting in greater altitude losses than those experienced by the experimental group.

3.1.2. Eye-Movement Index Differences between the Three Groups

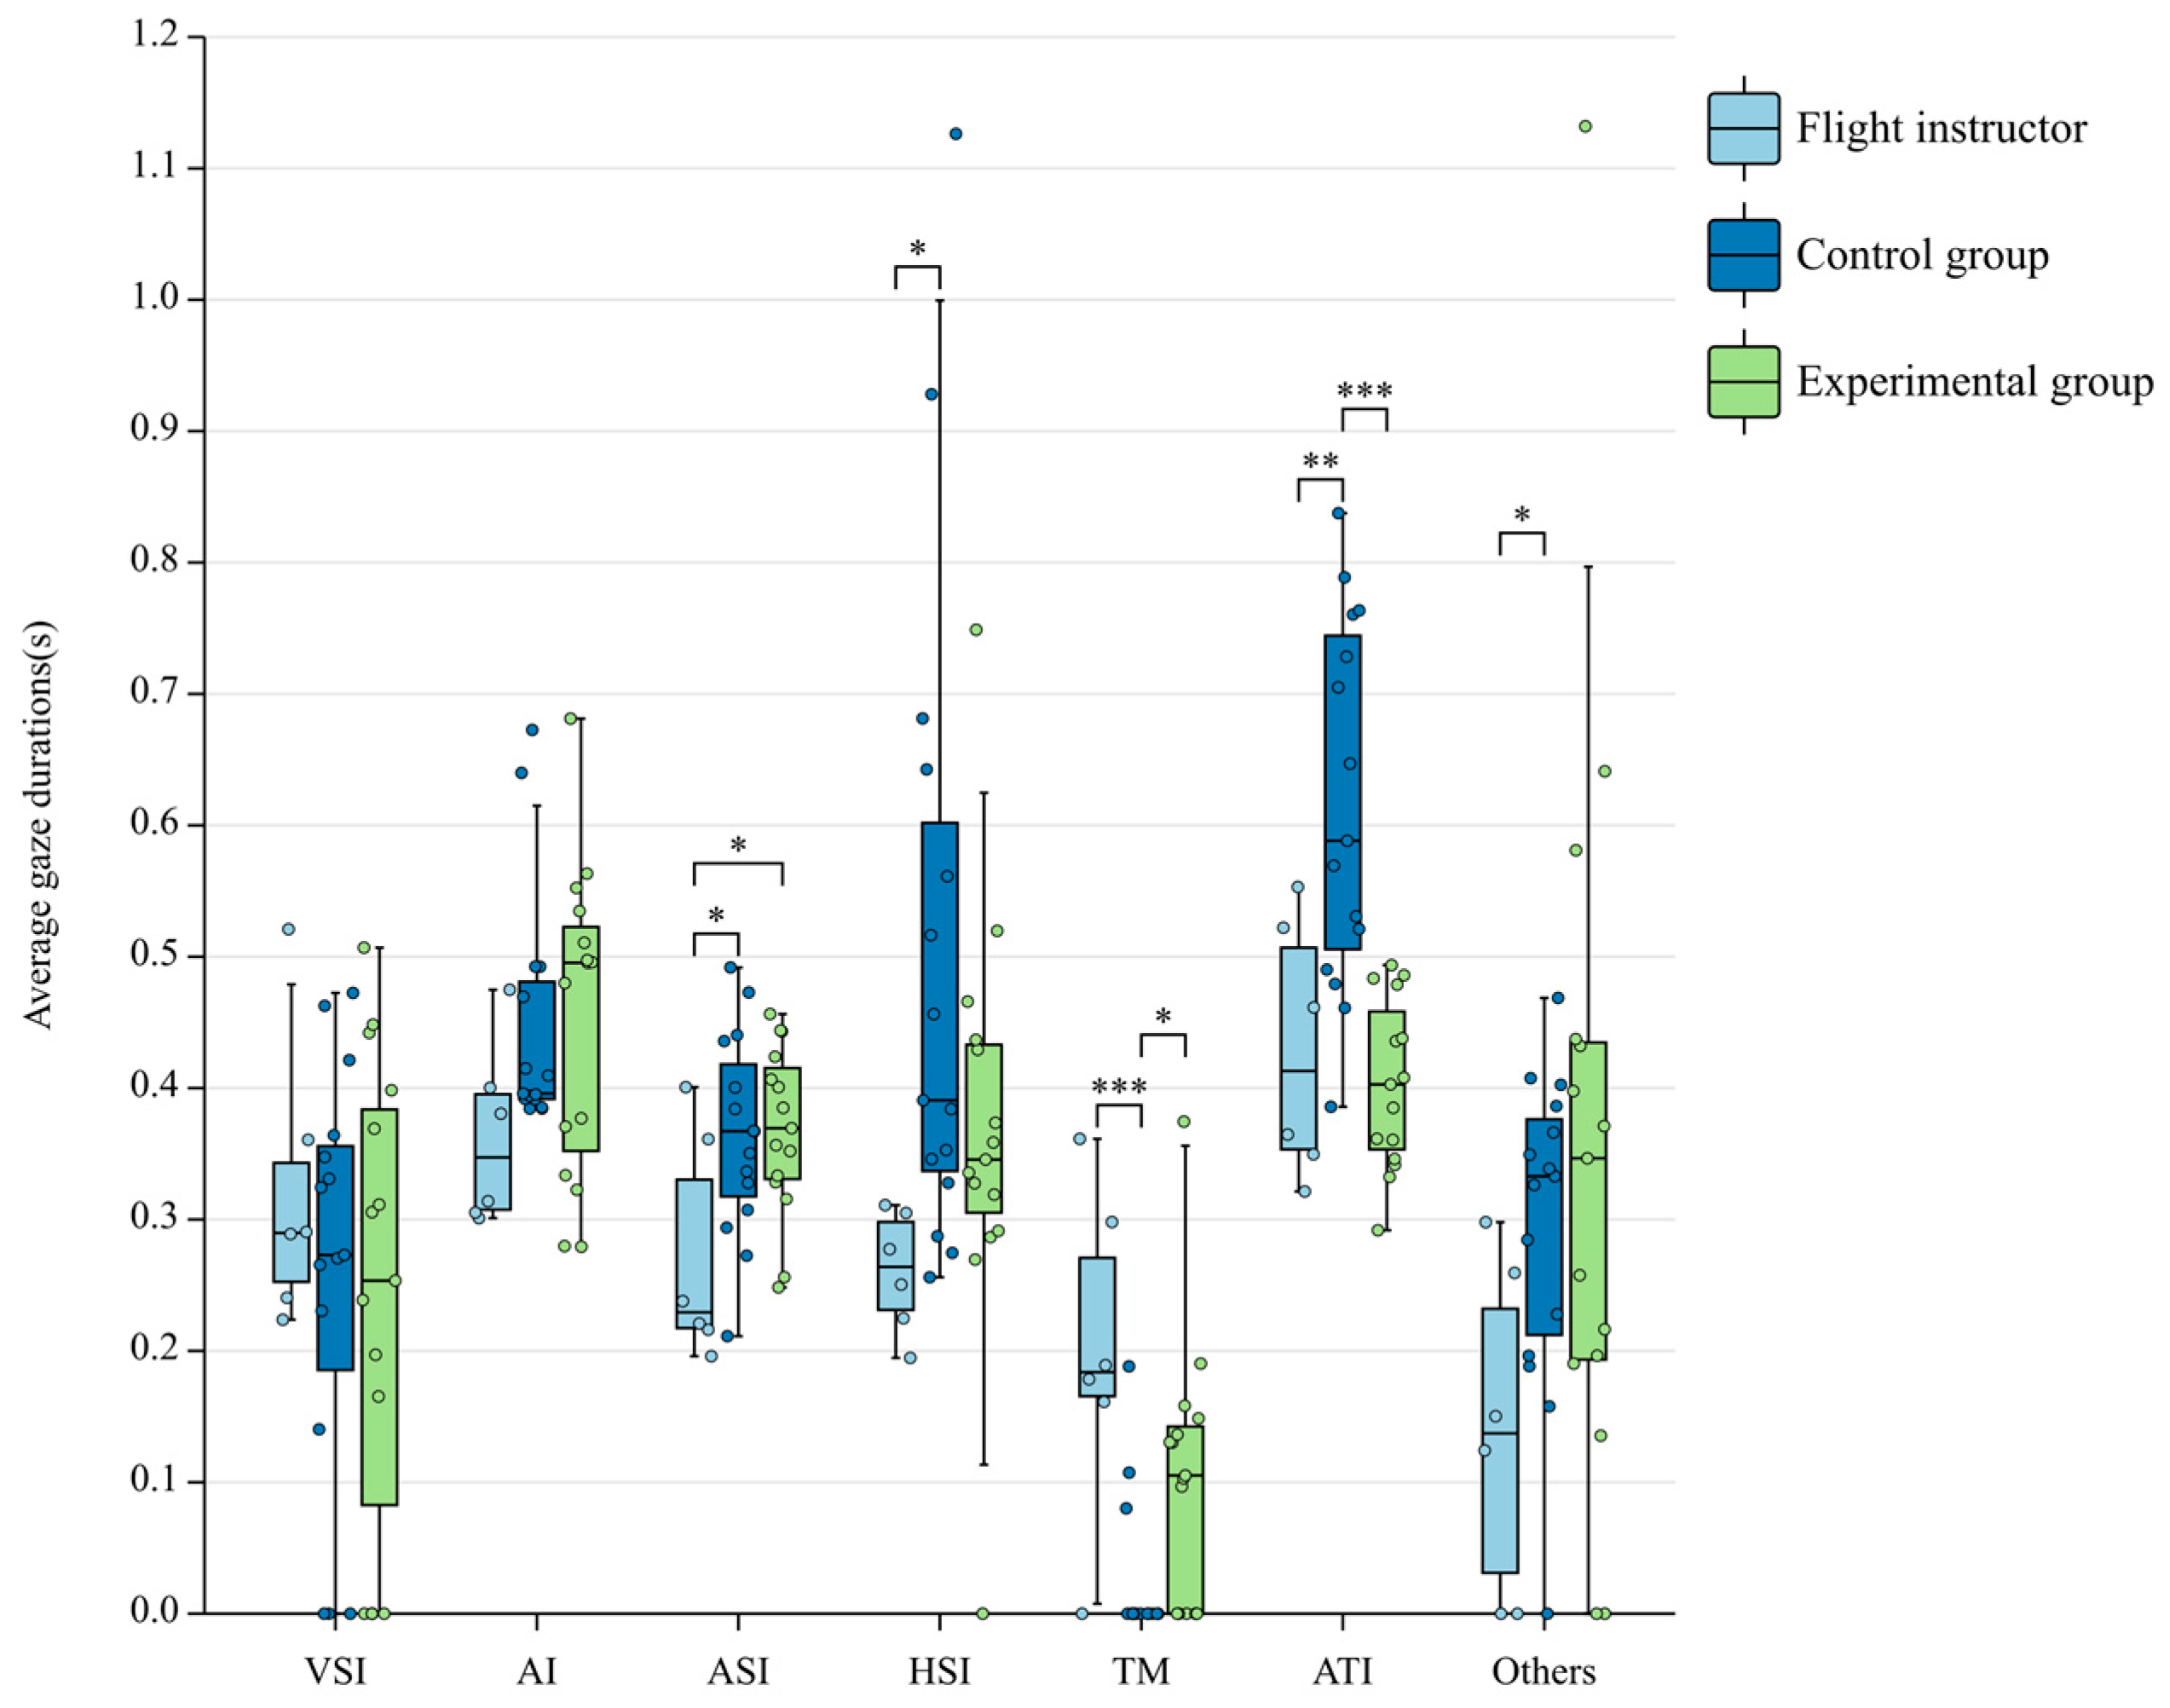
Since the eye-movement index satisfied the assumption of normality, a T-test was employed to examine the differences in these indicator values due to flight experience and training content. The experimental group still received the conventional ground course training for seven items: the vertical speedometer, the altimeter, the airspeed indicator, others, the horizontal status indicator, the tachometer, and the attitude indicator. Figure 7 illustrates the gaze-duration findings. The gaze durations of the instructors and the control group were significant differences between the gaze durations of the two groups were observed for the remaining five items (p = 0.027, cohen’d = 1.155, p = 0.016, cohen’d = 1.28, p = 0.003, cohen’d = 1.109, p = 0.001, cohen’d = 2.162, and p = 0.007, cohen’d = 1.449 for the airspeed indicator, other areas, horizontal status indicator, tachometer, and attitude indicator, respectively). The gaze durations of the instructors and the experimental group were only significantly different with respect to one item, the airspeed indicator (p = 0.011, cohen’d = 1.354). After completing the attention-allocation training, both the experimental group and the control group demonstrated significant differences in gaze-duration results for the tachometer and the attitude indicator, with significance levels of p = 0.012, cohen’d = 0.98 and p = 0.000, cohen’d = 1.967, respectively.
With regard to the eye-movement indicators, significant differences were observed between the average gaze durations of different subjects for the airspeed indicator, other areas, the horizontal status indicator, the tachometer, and the attitude indicator. Comparisons of the mean differences indicated that the instructors spent significantly more time observing the tachometer than did the trainees, particularly those in the control group. However, the gaze durations with respect to the airspeed indicator, the horizontal status indicator, the attitude indicator, and other areas were significantly longer for the trainees.
Based on the eye-movement data analysis, it was inferred that, after identifying the aircraft stall, the instructors focused on the original cause of the problem, which was reflected by the tachometer since it indicates the engine power output. In contrast, the students in the control group primarily paid attention to the airspeed indicator, the horizontal status indicator, the attitude indicator, and other areas. This result further confirms that the control group experienced more significant speed and altitude losses, as well as course deviations, than the instructors because of their lack of flight experience. The sudden reductions in speed and altitude after the aircraft stalled led to panic, which resulted in attention shifts toward other areas, particularly the instrument panel. Although there were significant differences between the instrument attention allocations of the students and the instructors in the control group, all the participants in the control group managed to correct the stall, which explains the lack of significant differences between the gaze durations with respect to the altimeter. The lack of significant differences between the gaze durations with respect to the vertical speedometer may be attributed to its proximity to the altimeter.
The largest gaze-duration percentage of the instructor group was focused on the attitude indicator, which aligns with the findings of Ziv et al. [37]. The attention-allocation training received by the experimental group significantly improved the gaze duration with respect to the tachometer compared to that of the control group, although its average gaze duration remained lower than that of the control group with respect to the attitude indicator. Nevertheless, its average gaze duration with respect to the attitude indicator approached that of the instructors.

3.2. Entropy of Fixation

The entropy of fixation [38] is further calculated as an indicator to measure the difference in eye movement strategies of different pilots. Entropy provides a measure of the statistical randomness or aggregation of participants’ eye movements, so that the spatially diffused fixation will lead to higher entropy, while the spatially tightly focused fixation will lead to lower entropy. The entropy of fixation represents the randomness of visual scanning of subjects. The higher the entropy, the more random the scanning strategy. Therefore, if each subject uses a more similar instrument scanning strategy throughout the experiment, their fixation entropy will be lower, as shown in Equation (1).
H t = i = 1 n p i j = 1 n p i j log 2 p i j
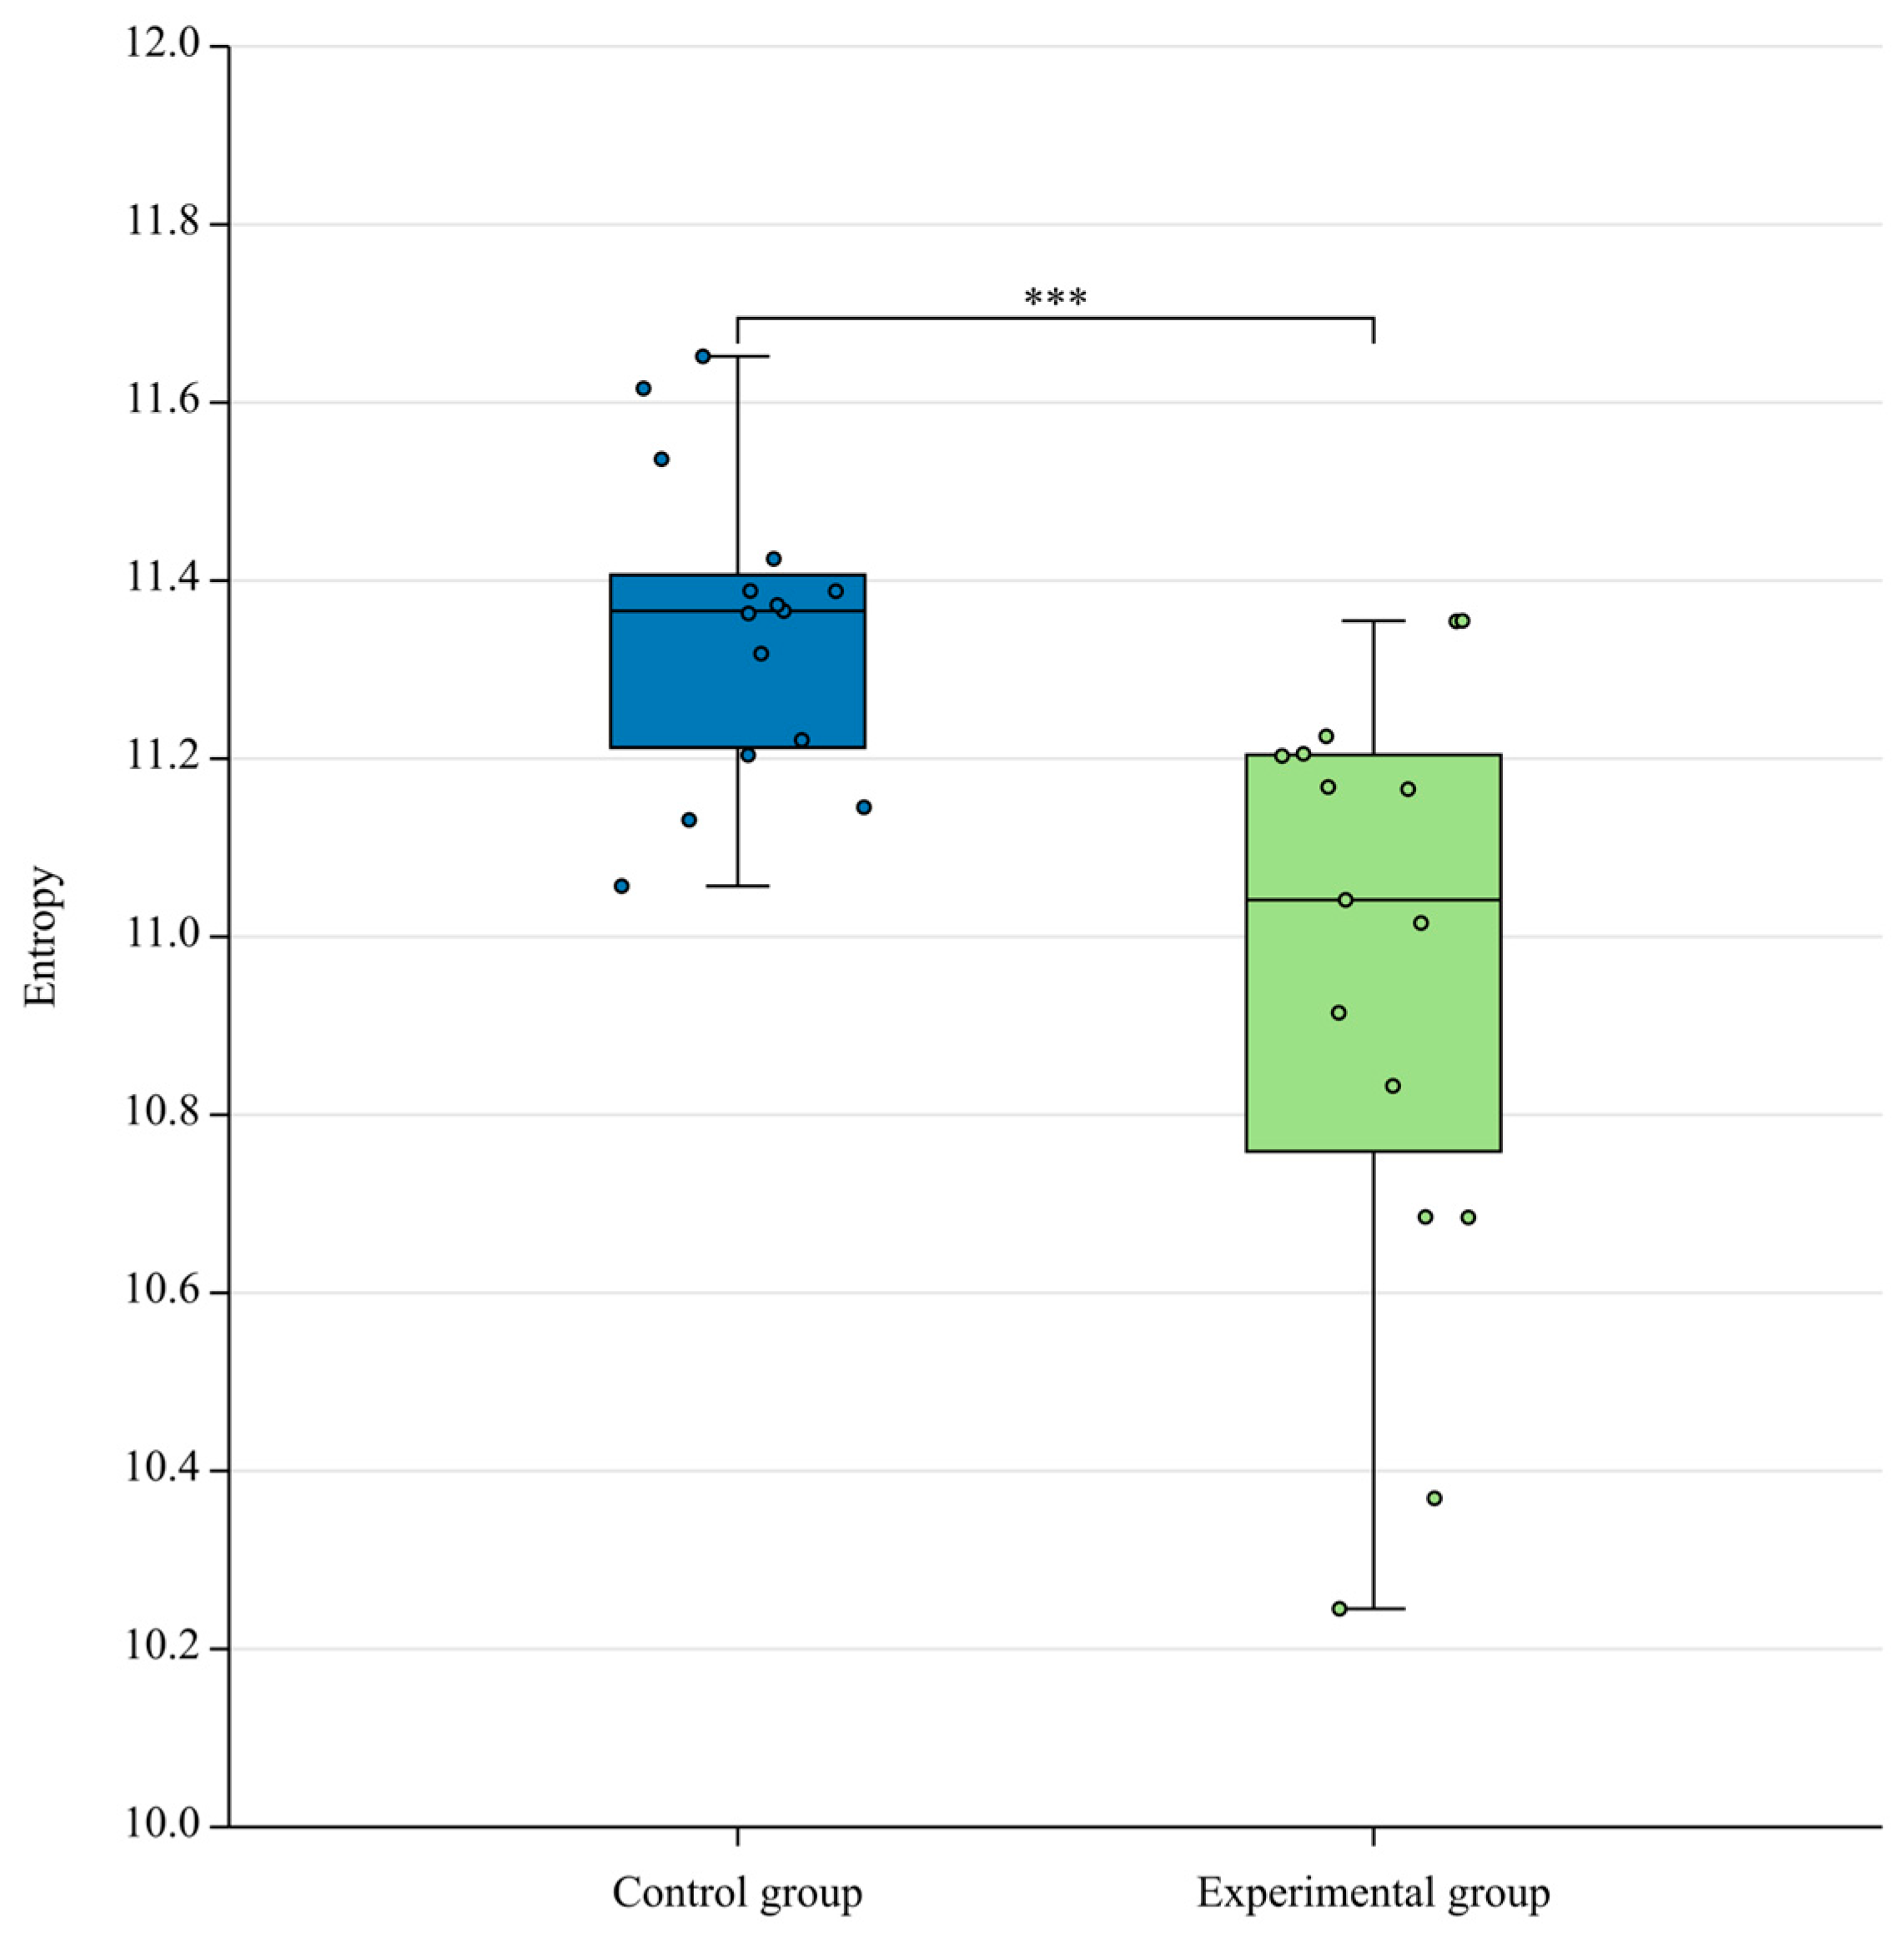
where p i represents the probability of fixating on the i-th AOI, while p i j denotes the conditional probability of fixating on the j-th AOI given that the i-th AOI was previously fixated upon. n refers to the total number of AOIs, and H t stands for fixation entropy. The results indicate significant differences in fixation entropy between experimental and control groups (p = 0.001, cohen’d = 1.41). As shown in Figure 8, the entropy of fixation of the control group was significantly higher than that of the experimental group, indicating that the members of the experimental group were more strategic in instrument scanning after the attention allocation course training.

3.3. Correlation between Flight-Performance Indicators and Eye-Movement Indicators

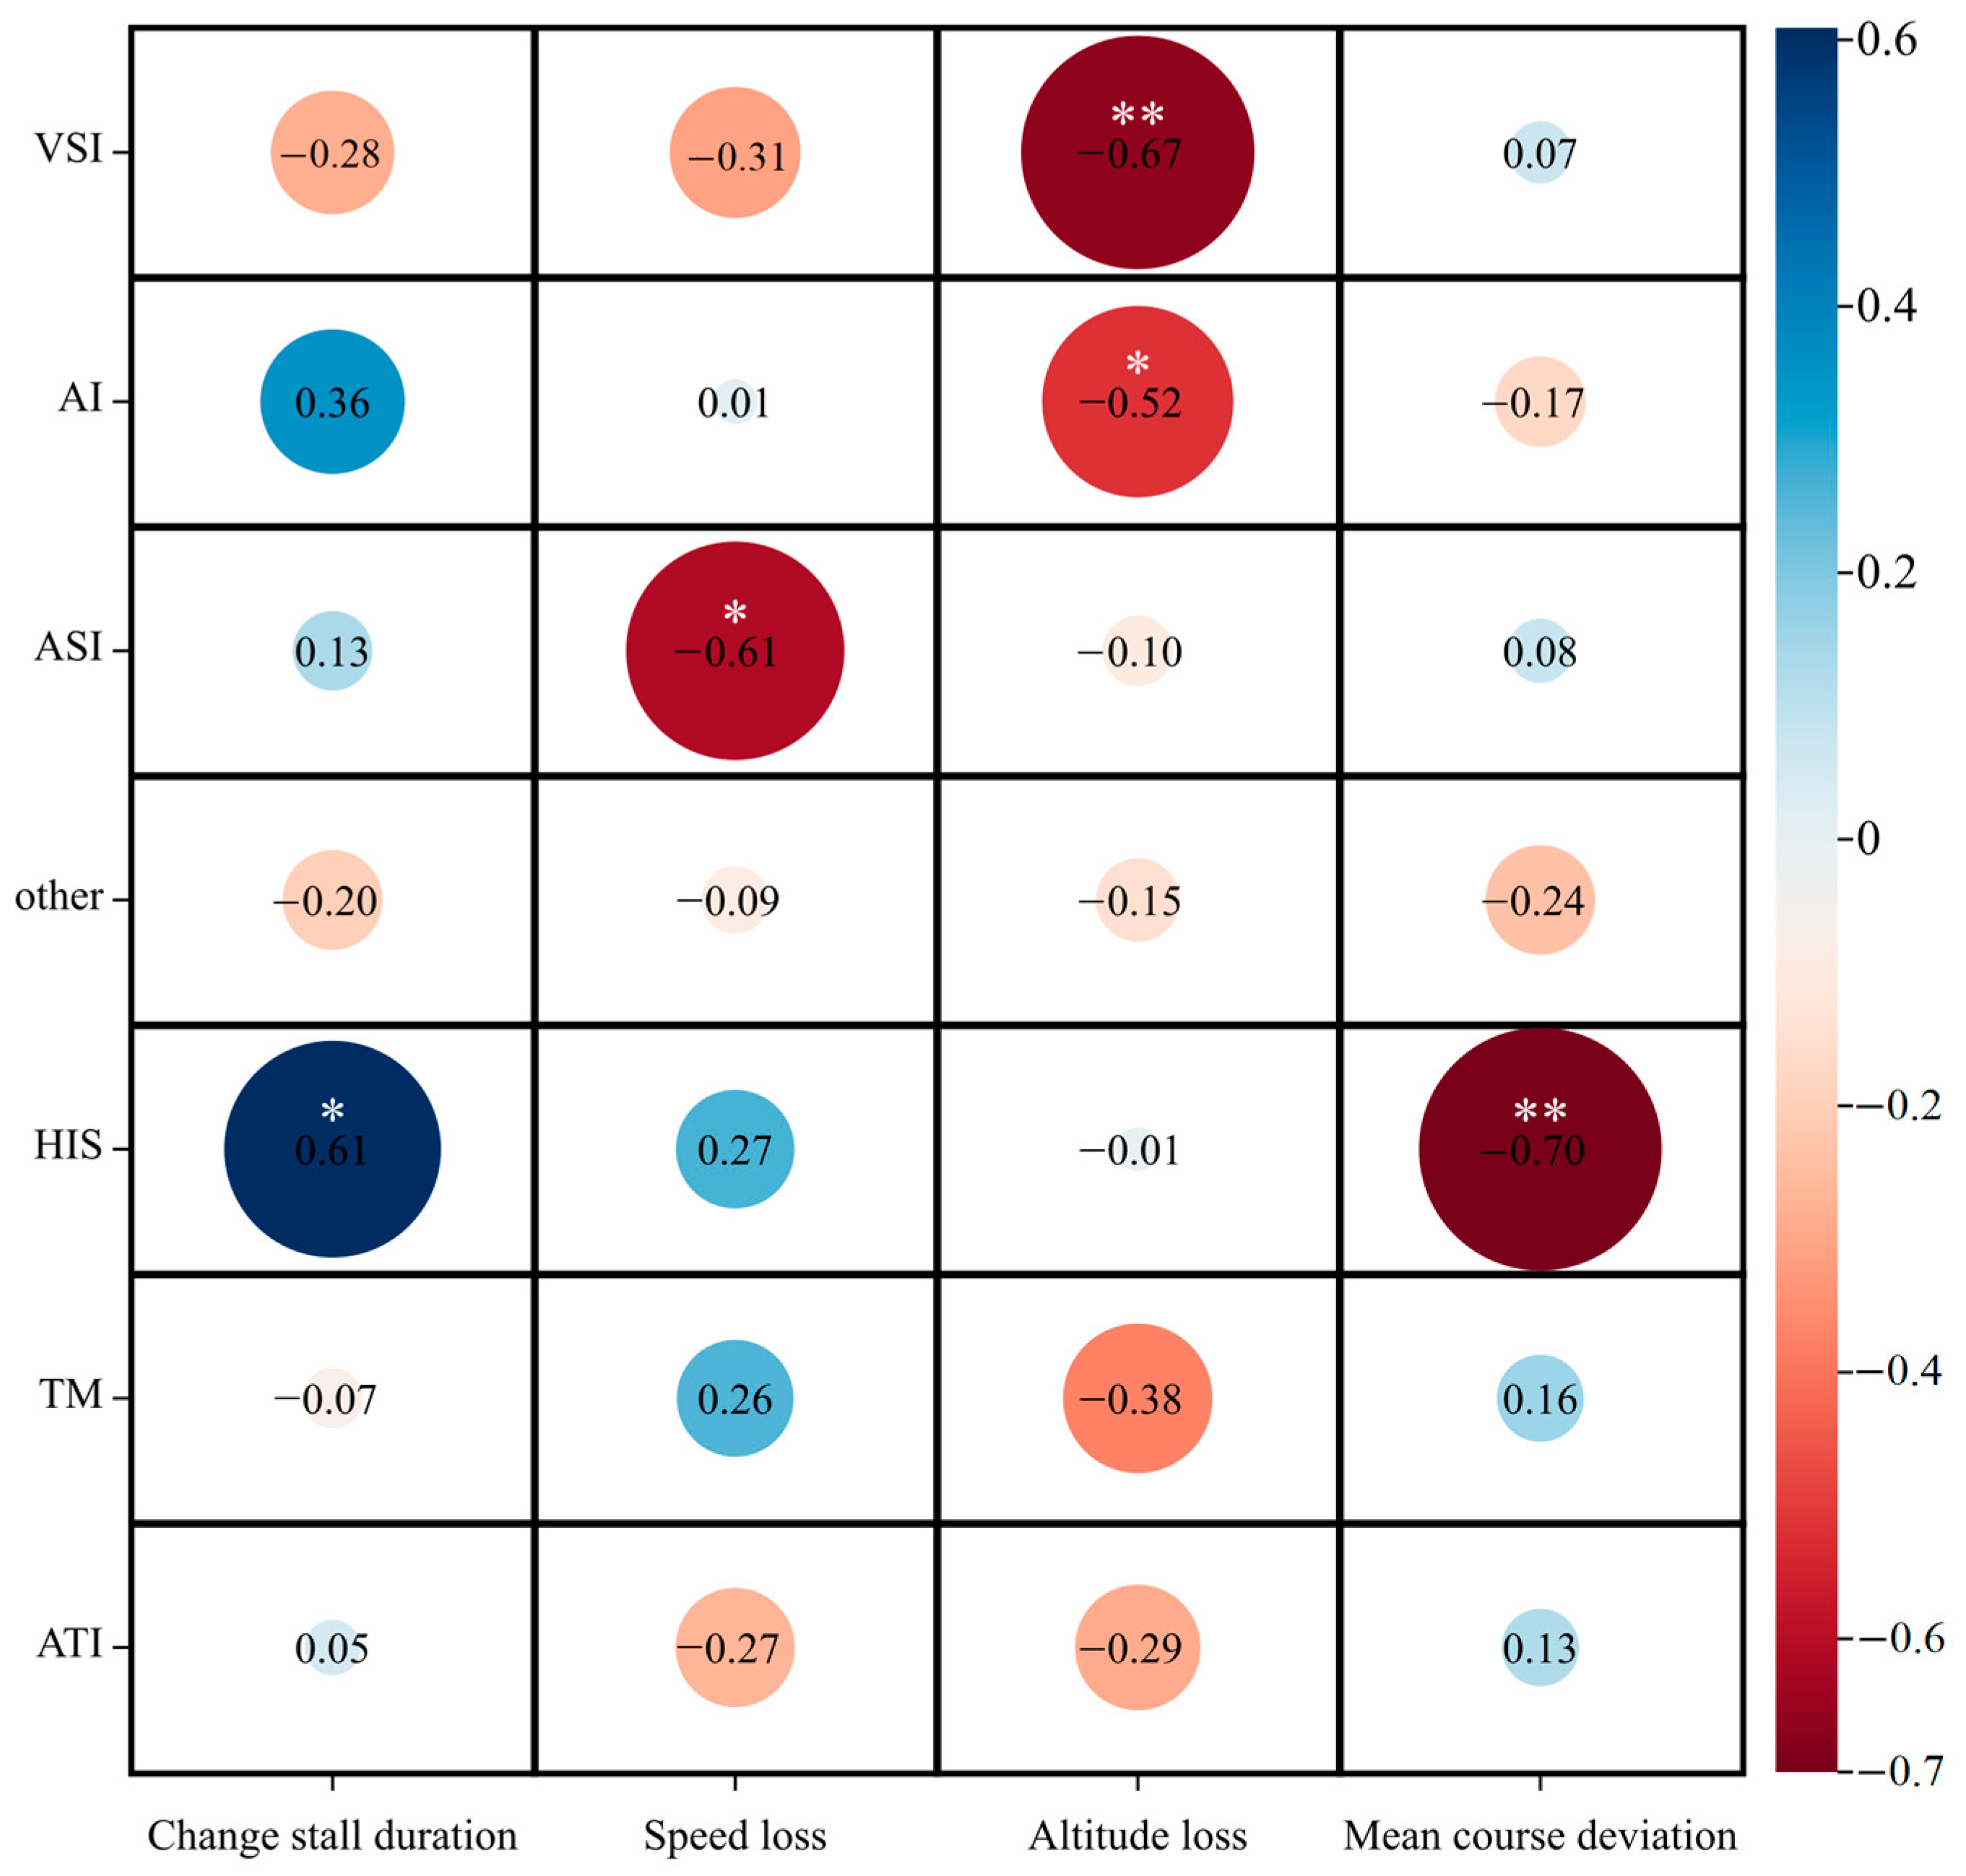
Fifteen student participants in the experiment were randomly selected for a Spearman correlation analysis. The goal of the analysis was to examine the relationship between the average fixation duration for each AOI and the flight performance. The Spearman correlation coefficient was used to determine the strengths of the correlations. The results, as shown in Figure 9, indicate that a change in the stall duration was positively correlated with the horizontal status indicator. Additionally, speed losses were positively correlated with the airspeed indicator, while altitude losses were positively correlated with both the vertical speedometer and the altimeter. Furthermore, there was a correlation between the mean course deviation and one item, the horizontal status indicator, as depicted in Figure 9.
In terms of the correlations between the flight performance and the eye-movement indicators, the correlation coefficient between changes in the stall duration and the horizontal status indicator was 0.609, which indicates a positive correlation. The correlation coefficient between speed losses and the airspeed indicator was 0.615, which indicates a negative correlation. Furthermore, the correlation coefficients between altitude losses and the vertical speedometer and between altitude losses and the altimeter were −0.667 and −0.521, respectively, which both indicate negative correlations. Finally, the correlation coefficient between the mean course deviation and the horizontal status indicator was −0.700, which also indicates a negative correlation. These results suggest that gazing longer at the horizontal status indicator was associated with a longer stalling duration and a smaller course deviation. Similarly, longer fixations on the airspeed indicator were associated with smaller speed losses. Additionally, longer fixations on the vertical speedometer and altimeter were associated with smaller altitude losses. These findings align with the conclusions of Vlacic [39], although the sample size used in that study was small, thereby leading to non-significant correlations between performance indicators and eye-movement indicators. The current study used a larger sample size of 38 subjects and employed immediate post-course training; therefore, the training effect was more significant and was consistent with the research results of Lefrancois [40]. Furthermore, this research demonstrates that timely performance feedback can help pilots to better understand flight tasks.

4. Conclusions

In this study, we recruited 8 instructors and 30 novice pilots from the Guanghan Branch of Civil Aviation Flight University of China, an SR20 simulator was selected to conduct a flight course involving no-power stalls, and exceptional flight instructors were chosen based on flight-performance data. Standard attention-allocation charts and eye-tracking videos were created for the subjects, who each experienced a stall and performed a stall recovery; instructor eye-movement data were used as a basis for attention-allocation training courses. These training courses were then applied to an experimental group of trainees. Comparisons of the differences between three groups of subjects yielded three primary conclusions:
  • During the no-power stall course, the instructors gazed longer at the tachometer than did the students, while they spent less time gazing at other instruments. This discrepancy can be attributed to the instructors’ deeper understanding of the instruments and their more accurate information processing.
  • In the initial pilot sample data, a significant correlation was observed between the flight performance and the attention distribution. The correlation coefficients of horizontal status indicator, stall recovery time and heading offset are 0.609 and −0.7 respectively, the correlation coefficients of airspeed indicator and lost speed are −0.615, and the correlation coefficients of lost altitude and vertical speed indicator and altimeter are −0.667 respectively and −0.521. Specifically, longer gaze durations with respect to the horizontal status indicator during stall recovery were associated with longer stall durations and smaller course deviations. Similarly, longer fixation times on the airspeed indicator were associated with smaller speed losses, while longer gaze durations with respect to the vertical speedometer and the altimeter were associated with smaller altitude losses.
  • The attention-allocation training course implemented by the institute significantly improved the flight performance of the trainees. The difference between the trainees in the experimental group and the instructors in the attention distribution training is only in the gaze time of the airspeed indicator (p = 0.011), and there are more differences in flight performance in the control group than in the experimental group and the instructors (lost speed, p = 0.01). An analysis of the eye-movement-index data of the experimental group of students showed that the attention-distribution patterns of these students were more similar to those of the instructors after the training, and its instrument scanning was more strategic. Consequently, the flight performance of the experimental group of students surpassed that of the control group of students.
These findings highlight the effectiveness of using attention-allocation training for enhancing flight performance and align with the objectives of this study.
In the future, when analyzing eye movement data, machine learning methods can be added and combined with other physiological factors such as EEG to increase the reliability of the data; in terms of teaching, flight instructors can refer to the real-time attention of pilot students in subjects The allocation situation and objective parameters are used to correct the attention distribution of the pilot students in real time, so as to improve the quality of the flight training of the pilot students and promote aviation safety.

Author Contributions

Conceptualization: Y.Q. and J.Y.; methodology: Z.Q. and X.C.; software: Z.Q. and X.C.; validation: Z.Q., Y.Q. and Z.S.; formal analysis: Z.Q. and Y.Q.; writing—original draft preparation: Z.Q.; writing—review and editing: Z.Q., Y.Q. and Z.S.; supervision: J.Y.; project administration: X.L. All authors have read and agreed to the published version of the manuscript.

Funding

This research was funded by National Natural Science Foundation of China (No. U2133209); Safety ability Foundation of Civil Aviation Administration of China (No. 2022-239), China Scholarship Council and the local innovation sub-project of the Western Project of the Sichuan Provincial (202108510118), scientific research and innovation team of CAFUC (JG2022-23), Civil Aviation Flight Technology and Flight Safety Key Laboratory Foundation (No. FZ2020ZZ01), The APC was funded by Safety ability Foundation of Civil Aviation Administration of China (No. 2022-239).

Institutional Review Board Statement

Informed consent was obtained from all the subjects involved in the study.

Informed Consent Statement

Informed consent was obtained from all subjects involved in the study.

Data Availability Statement

Not applicable.

Conflicts of Interest

The authors declare that they have no conflict of interest to report regarding the present study.

References

  1. Adam, G.; Condette, J. Study on Aeroplane State Awareness during Go-Around; Bureau d’Enquetes et d’Analyses pour la Securite de L’Aviation Civile: Le Bourget, France, 2013. [Google Scholar]
  2. Federal Aviation Administration (FAA). Operational Use of Flight Path Managements Systems; Final Report of the Performance Based Operations Aviation Rulemaking Committee; Commercial Aviation Safety Team Flight Deck Automation Working Group: Washington, DC, USA, 2013.
  3. International Air Transport Association (IATA). Guidance Material for Improving Flight Crew Monitoring; International Air Transport Association: Geneva, Switzerland, 2016. [Google Scholar]
  4. Lefrancois, O.; Matton, N.; Gourinat, Y. The role of Pilots’ monitoring strategies in flight performance. In Proceedings of the European Association for Aviation Psychology Conference, Cascais, Portugal, 26–30 September 2016. [Google Scholar]
  5. Meinhardt-Injac, B.; Persike, M.; Meinhardt, G. Holistic face perception in young and older adults: Effects of feedback and attentional demand. Front. Aging Neurosci. 2014, 6, 291. [Google Scholar]
  6. Tsotsos, J.-K.; Abid, O.; Kotseruba, I. On the Control of Attentional Processes in Vision. Cortex 2021, 137, 305–329. [Google Scholar]
  7. Goettker, A.; Gegenfurtner, K.-R. A change in perspective: The interaction of saccadic and pursuit eye movements in oculomotor control and perception. Vis. Res. 2021, 188, 283–296. [Google Scholar]
  8. Carlos, H.; Morimoto; Marcio, R.-M. Eye gaze tracking techniques for interactive applications. Comput. Vis. Image Underst. 2005, 98, 4–24. [Google Scholar]
  9. Kovacsova, N.; Vlakveld, W.-P.; Winter, J. PC-based hazard anticipation training for experienced cyclists: Design and evaluation. Saf. Sci. 2019, 123, 104561. [Google Scholar]
  10. Tad, T.; Nallamothu, B.-K.; Elmore, J.-G. Eye-tracking for assessing medical image interpretation: Apilot feasibility study comparing novice vs expert cardiologists. Perspect. Med. Educ. 2019, 8, 65–73. [Google Scholar]
  11. Borg, L.-K.; Harrison, T.-K. Preliminary Experience Using Eye-Tracking Technology to Differentiate Novice and Expert Image Interpretation for Ultrasound-Guided Regional Anesthesia. J. Ultrasound Med. 2018, 37, 329–336. [Google Scholar]
  12. Koury, H.-F.; Leonard, C.-J.; Carry, P.-M. An Expert Derived Feedforward Histology Module Improves Pattern Recognition Efficiency in Novice Students. Anat. Sci. Educ. 2019, 12, 645–654. [Google Scholar] [PubMed]
  13. Meyer, J.; Fasold, F.; Schul, K. The Defender’s Vision-Gaze Behavior of One-on-One Defenders in Basketball. J. Sport Exerc. Psychol. 2022, 44, 127–137. [Google Scholar]
  14. Sheridan, H.; Reingold, E.-M. Chess players’ eye movements reveal rapid recognition of complex visual patterns: Evidence from a chess-related visual search task. J. Vis. 2017, 17, 4. [Google Scholar]
  15. Song, C.-C. A Study on the Fixation Pattern of Civil Aviation Cadets Based on Eye Movement Analysis; Civil Aviation University of China: Tianjin, China, 2014. [Google Scholar]
  16. Schriver, A.-T.; Morrow, D.-G.; Wickens, C.-D. Expertise differences in attentional strategies related to pilot decision making. Hum. Factors 2008, 50, 864–878. [Google Scholar] [CrossRef]
  17. Hsu, C.-K.; Lin, S.-C.; LI, W.-C. Visual movement and mental-workload for pilot performance assessment. Eng. Psychol. Cogn. Ergon. 2015, 9174, 356–364. [Google Scholar]
  18. Liu, Y.W.; Guo, X.; Lv, Q. Study on the difference of pilot simulated instrument approach fixation characteristics based on expert-novice paradigm. J. Saf. Environ. 2021, 21, 2086–2092. [Google Scholar]
  19. Zhu, G. Study on the Characteristics of Eye Movement during Simulated Approach Flight; Civil Aviation University of China: Tianjin, China, 2020. [Google Scholar]
  20. Wu, X.L.; Sun, Y.; Tang, Y. The association effect of industrial data chart presentation style with visual physiological cognitive performance such as gaze/pupil. Ind. Eng. Manag. 2023, 28, 9–16. [Google Scholar]
  21. Wang, A.-R.; Lv, J.; Liu, X. The influence of attention allocation strategies on interface task performance and visual behavior. Comput. Syst. Appl. 2022, 31, 11. [Google Scholar]
  22. Chen, M.-X.; Bai, X.-J. The effect of event rates on visual search of medical images for expert and novice radiologists: Evidence from eye movements. Psychol. Behav. Res. 2017, 15, 302–308. [Google Scholar]
  23. Zhu, Z.-Y.; Qian, Y.; Wang, J.; Yi, X.-J. Research on flight training quality evaluation based on time series similarity. Flight Mech. 2021, 39, 75–81. [Google Scholar]
  24. Yang, C.; Liu, Z.; Zhou, Q. Analysis on Eye Movement Indexes Based on Simulated Flight Task. In International Conference on Engineering Psychology and Cognitive Ergonomics; Springer: Cham, Switzerland, 2014. [Google Scholar]
  25. Chen, B.; Cao, B.-S.; Yu, G.-H. Analysis of pilot eye movement characteristics under single fire failure situation. J. Saf. Environ. 2019, 19, 1282–1287. [Google Scholar]
  26. Wang, Y.-Q.; Li, R.; Ding, D. Analysis of motion inference ability of civil aviation cadets based on eye movement data. Sci. Technol. Eng. 2020, 20, 1238–1242. [Google Scholar]
  27. Liu, Z.-F.; Chen, C.-Y.; Su, Y.-Q. Usability evaluation of aircraft instrument display systems: Eye movement and performance data evidence. Aerosp. Med. Med. Eng. 2018, 31, 341–346. [Google Scholar]
  28. Rudi, D.; Kiefer, P.; Raubal, M. Visualizing pilot eye movements for flight instructors. In Proceedings of the 3rd Workshop on Eye Tracking and Visualization Proceedings, Warsaw, Poland, 14–17 June 2018. [Google Scholar]
  29. Lounis, C.; Peysakhovich, V.; Causse, M. Visual scanning strategies in the cockpit are modulated by pilots’ expertise: A flight simulator study. PLoS ONE 2023, 16, e0247061. [Google Scholar] [CrossRef] [PubMed]
  30. Shao, F.; Lu, T.-J.; Wang, X.-C. The influence of pilot’s attention allocation on instrument reading during take-off: The mediating effect of attention span. Appl. Ergon. 2021, 90, 103245. [Google Scholar] [CrossRef]
  31. Ledegang, W.-D.; Groen, E.-L. Spatial Disorientation Influences on Pilots’ Visual Scanning and Flight Performance. Aerosp. Med. Hum. Perform. 2018, 89, 873–882. [Google Scholar] [CrossRef]
  32. Muehlethaler, C.-M.; Knecht, C.-P. Situation Awareness Training for General Aviation Pilots using Eye Tracking. Ifac Pap. 2016, 49, 66–71. [Google Scholar] [CrossRef]
  33. Li, W.-C.; Yu, C.-S.; Braithwaite, G. Pilots’ Attention Distributions Between Chasing a Moving Target and a Stationary Target. Aerosp. Med. Hum. Perform. 2016, 87, 989–995. [Google Scholar] [CrossRef]
  34. Haslbeck, A.; Zhang, B. I spy with my little eye: Analysis of airline pilots’ gaze patterns in a manual instrument flight scenario. Appl. Ergon. 2017, 63, 62–71. [Google Scholar] [CrossRef]
  35. Ryffel, C.-P.; Muehlethaler, C.-M.; Huber, S.-M. Eye tracking as a debriefing tool in upset prevention and recovery training (UPRT) for general aviation pilots. Ergonomics 2019, 62, 319–329. [Google Scholar] [CrossRef]
  36. Skvarekova, I.; Skultety, F. Objective Measurement of Pilot’s Attention Using Eye Track Technology during IFR Flights. Transp. Res. Procedia 2019, 40, 1555–1562. [Google Scholar] [CrossRef]
  37. Ziv, G. Gaze Behavior and Visual Attention: A Review of Eye Tracking Studies in Aviation. Int. J. Aviat. Psychol. 2016, 26, 75–104. [Google Scholar] [CrossRef]
  38. Wang, Q.; Hoi, S.; Wang, Y.; Song, C. Out of mind, out of sight? Investigating abnormal face scanning in Autism Spectrum Disorder using gaze-contingent paradigm. Dev. Sci. 2020, 23, e12856. [Google Scholar] [CrossRef]
  39. Vlacic, S.; Knezevic, A.; Mandal, S. Improving the pilot selection process by using eye-tracking tools. J. Eye Mov. Res. 2019, 12, 4. [Google Scholar]
  40. Lefrançois, O.; Matton, N.; Causse, M. Improving Airline Pilots’ Visual Scanning and Manual Flight Performance through Training on Skilled Eye Gaze Strategies. Safety 2021, 7, 70. [Google Scholar] [CrossRef]
Figure 1. Experimental equipment and setting: (a) Eye tracker, (b) SR20 simulator, and (c) laboratory photograph.
Applsci 13 09876 g001
Figure 2. Identification of the areas of interest. Seven AOIs were defined for analysis, including the vertical speed indicator (VSI), the altitude indicator (AI), the airspeed indicator (ASI), the horizontal status indicator (HSI), the tachometer (TM), and the attitude indicator (ATI).
Applsci 13 09876 g002
Figure 3. Percentage of the gazing times of excellent instructors directed toward each AOI A gaze heat map, which used different colors to indicate how long subjects gazed at the simulated AOIs.
Applsci 13 09876 g003
Figure 4. Eye-movement data of the exceptional flight instructors, which depict their attention allocation on the instrument panel, were presented through heat maps. These heat maps utilized different colors to indicate the specific areas where the participants focused their gazes or the durations of their gazes. Red represented the longest fixation durations, while green represented the shortest fixation durations; other colors represented the varying durations in between.
Applsci 13 09876 g004
Figure 5. Gazes of the exceptional flight instructors with respect to the instrument panel were depicted in gaze charts, in which the dot size illustrated the fixation duration and the dot order indicated the gaze sequence. These gaze charts provided visual representations of the gazing patterns of the individual test participants throughout the recording sessions or of multiple participants within short time intervals.
Applsci 13 09876 g005
Figure 6. Comparison chart of the normalized flight performance indicators for the three groups.
Applsci 13 09876 g006
Figure 7. Average gaze durations of the three groups of subjects with respect to different AOIs (each point represents one individual data, * p < 0.05 ** p < 0.01 *** p < 0.00.).
Applsci 13 09876 g007
Figure 8. Comparison of entropy of fixation between experimental group and control group (each point represents one individual data, *** p < 0.00).
Applsci 13 09876 g008
Figure 9. Spearman correlation heat map(* p < 0.05 ** p < 0.01).
Applsci 13 09876 g009
Table 1. Flight performance differences between three groups of participants.
GroupIndicatorMedian Comparisonp-Value
Instructors–Control groupStall-recovery duration 6.25 s, 7.00 s0.814
Speed loss8.00 knots, 4.00 knots0.010 *
Altitude loss160.0 ft, 250.0 ft0.004 **
Mean course deviation2.67°, 7.78°0.001 **
Instructors–Experimental groupStall-recovery duration 6.25 s, 6.00 s0.844
Speed loss8.00 knots, 5.00 knots0.050
Altitude loss160.0 ft, 200.0 ft0.006 **
Mean course deviation2.67°, 5.97°0.001 **
Control group–Experimental groupStall-recovery duration 7.00 s, 6.00 s0.248
Speed loss4.00 knots, 5.00 knots0.068
Altitude loss250.0 ft, 200.0 ft0.008 **
Mean course deviation7.78°, 5.97°0.078
* p < 0.05 ** p < 0.01.
Disclaimer/Publisher’s Note: The statements, opinions and data contained in all publications are solely those of the individual author(s) and contributor(s) and not of MDPI and/or the editor(s). MDPI and/or the editor(s) disclaim responsibility for any injury to people or property resulting from any ideas, methods, instructions or products referred to in the content.