Article

A Numerical Gear Rolling Test Method for Face-Hobbed Hypoid Gears

1
School of Mechanical and Precision Instrument Engineering, Xi’an University of Technology, Xi’an 710048, China
2
Research Center of Highway Large Structure Engineering on Safety, Ministery of Education, Chang’an University, Xi’an 710064, China
*
Author to whom correspondence should be addressed.
Appl. Sci. 2023, 13(18), 10278; https://doi.org/10.3390/app131810278
Submission received: 28 August 2023 / Revised: 10 September 2023 / Accepted: 12 September 2023 / Published: 13 September 2023

Abstract

:
A numerical gear rolling test (NGRT) method for actual tooth surfaces was proposed. The non-uniform rational B-spline (NURBS) fitting method was adapted to reconstruct the actual tooth surface, and the instant meshing point as well as the transmission error of two meshing gears were solved. The instant contact ellipse boundary of each meshing point can be accurately searched, and then the contact pattern formed by a series of contact ellipses on the actual tooth surface can be obtained. Finally, the rolling test experiment for a pair of hypoid gears was conducted to verify the feasibility of the proposed method. The result shows that the contact pattern obtained is consistent with the actual rolling test result, the relative errors of the transmission error amplitudes were only 4.5% and 5.3% for the drive and coast sides, respectively, and the contact ellipse of the actual tooth surface is not necessarily a standard ellipse and the instant contact path is not necessarily a straight line. This NGRT method helps to reduce equipment and time costs in closed-loop gear manufacturing, which is of great significance for mass production.

1. Introduction

The rolling test is important in gear manufacturing, and the result of the test is an essential reference for evaluating the gear meshing performance. However, the actual tooth surface deviates from the theoretical tooth surface owing to the elastic deformation of the machine, tool wear, and heat treatment deformation in gear machining [1]. Therefore, the rolling test result for an actual tooth surface is different from the theoretical tooth contact analysis (TCA) result [2], and comparative verification is invalid due to inconsistent evaluation criteria. Moreover, the cost of equipment and time brought by rolling tests is unacceptable in closed-loop gear manufacturing. Therefore, it is necessary to explore a method to obtain accurate meshing information of real tooth surfaces without relying on rolling tests.
In recent years, many researchers have conducted fruitful research on numerical tooth surface modeling and real tooth surface contact analysis (RTCA) to address these problems. Li et al. [3,4] reconstructed the numerical actual tooth surface model of hypoid and involute gears based on non-geometric-feature segmentation and an interpolation algorithm. Zhang et al. [5] used the superposition of the theoretical tooth surface and the error tooth surface to obtain the actual tooth surface of a spiral bevel gear. Li et al. [6] proposed the application of discrete data points to establish an actual tooth surface model that can reflect the relationship between the actual tooth surface deviations with misalignments and the theoretical tooth surface. Using a large-diameter conical grinding wheel for face-hobbed hypoid gears, Zhang et al. [7] proposed a tooth grinding method that can machine a tooth surface without theoretical deviation. Liu et al. [8] obtained the tooth surface deviation through computational tooth surface grids coinciding with the original tooth surface grids. The tooth surface deviation was taken as the objective function for optimization for obtaining the actual tooth surface of the spiral bevel gear.
The numerical actual tooth surface modeling method based on measuring data is the foundation for the actual tooth surface contact simulation technology. Du and Fang [9] established an actual tooth surface with tooth surface deviation and conducted RTCA of hypoid gears. Ma et al. [10] used a series of continuously changing cylindrical surfaces to intercept the meshing tooth surface for RTCA. Utilizing the least rotation angle method and the improved quad-tree search algorithm, Lin and Fong [11] calculated the continuous transmission error and contact pattern in the numerical tooth contact analysis. Gosselin et al. [12] developed an algorithm to approximate the actual tooth surface and calculated the contact pattern. Wang et al. [13] used the interference of the tooth surface to solve the contact spot for an actual tooth surface.
The above research enables us to compare and verify RTCA results with rolling test results to solve the problem of inconsistent evaluation standards. For this method to be feasible, the RTCA result must accurately reflect the meshing conditions of the actual tooth surface, and the contact pattern and transmission error must be determined with high accuracy. However, the solution of the contact pattern relies on the quadratic approximation near the meshing point, the complicated main curvature, and the principal direction derivation in the RTCA method [14,15], which is inaccurate because the instant contact ellipse is not the actual contact ellipse. Du et al. [16] proposed a new TCA method based on numerical iteration that produces accurate contact ellipse boundaries and instant contact lines through the TCA of theoretical tooth surfaces. However, this method has not been used for the TCA of the actual tooth surface.
Therefore, the NGRT method is proposed to replace traditional rolling tests, improve gear production efficiency, and reduce equipment costs.

2. Tooth Surface Measuring Points

The distribution of measuring points on the tooth surface directly influences the fitting accuracy. A denser distribution of measuring points produces a higher fitting accuracy, with increased calculation. To take into account both fitting accuracy and computational efficiency, this study refers to the measuring center of the Klingelnberg P65 gear measuring center and uses 15 × 15 measuring points. As indicated in Figure 1, u is the tooth height direction and v is the tooth width direction.

3. Actual Tooth Surface Fitting

The non-uniform rational B-spline (NURBS) method was adapted to fit the actual tooth surface. The mathematical equations of the NURBS surface are [17]
P u , v = R u , v W u , v
R u , v = i = 0 m j = 0 n w i , j d i , j N i , k u N j , l v
W u , v = i = 0 m j = 0 n w i , j N i , k u N j , l v
where u and v are surface parameters, wi,j is the weight factor, di,j is the control vertex, Ni,k(u) is the canonical B-spline basis function of k times in the u direction, and Nj,l(v) is the canonical B-spline basis function of l times in the v direction.
The fitting process is as follows.
First, the curve fits along the u direction. The 17 × 15 control vertex d and weighting factor w are calculated back in the u direction [18]. Then, the curve fits along the v direction. The 17 × 15 control vertex d and weight factor w obtained in the previous step are taken as new measuring points to calculate the 17 × 17 control vertex d and weight factor w in the v direction in the same method. Finally, the obtained 17 × 17 control vertex d and weight factor w are introduced into Equation (1), and the NURBS surface equation of the actual tooth surface can be obtained.
Based on the above method, a hypoid gear was taken as an example (see reference [19] for detailed parameters) to fit the 15 × 15 data points on the theoretical tooth surface, the concave and convex of both pinion and gear can be obtained, as shown in Figure 2, Figure 3, Figure 4 and Figure 5.
The fitting tooth surface obtained by NURBS coincides with the actual tooth surface only at the measuring point, and the positions that are not at the measuring points are obtained by fitting algorithms. Therefore, it is necessary to analyze whether these points can represent the points on the actual tooth surface. That is, the fitting accuracy of these areas needs to be verified. The forward algorithm of NURBS surface fitting was adopted in this work to calculate the 14 × 14 coordinates (x, y, z) of the center point [18], the verification points shown in Figure 6.
The X and Y of the center point on the theoretical tooth surface are equal to the X and Y of the point on the NURBS surface, and the Z can be obtained on the theoretical tooth surface. The distance between the two center points was calculated, and the maximum distance between the center points of each column was used to draw the curve shown in Figure 7. These errors are the Z direction distances between the center of each surface piece of the original tooth surface and that of the fitting tooth surface.
It can be seen from Figure 7 that the fitting errors of the pinion and gear do not exceed 0.1 μm, which can meet the engineering requirements [20].

4. Numerical Gear Rolling Test Method

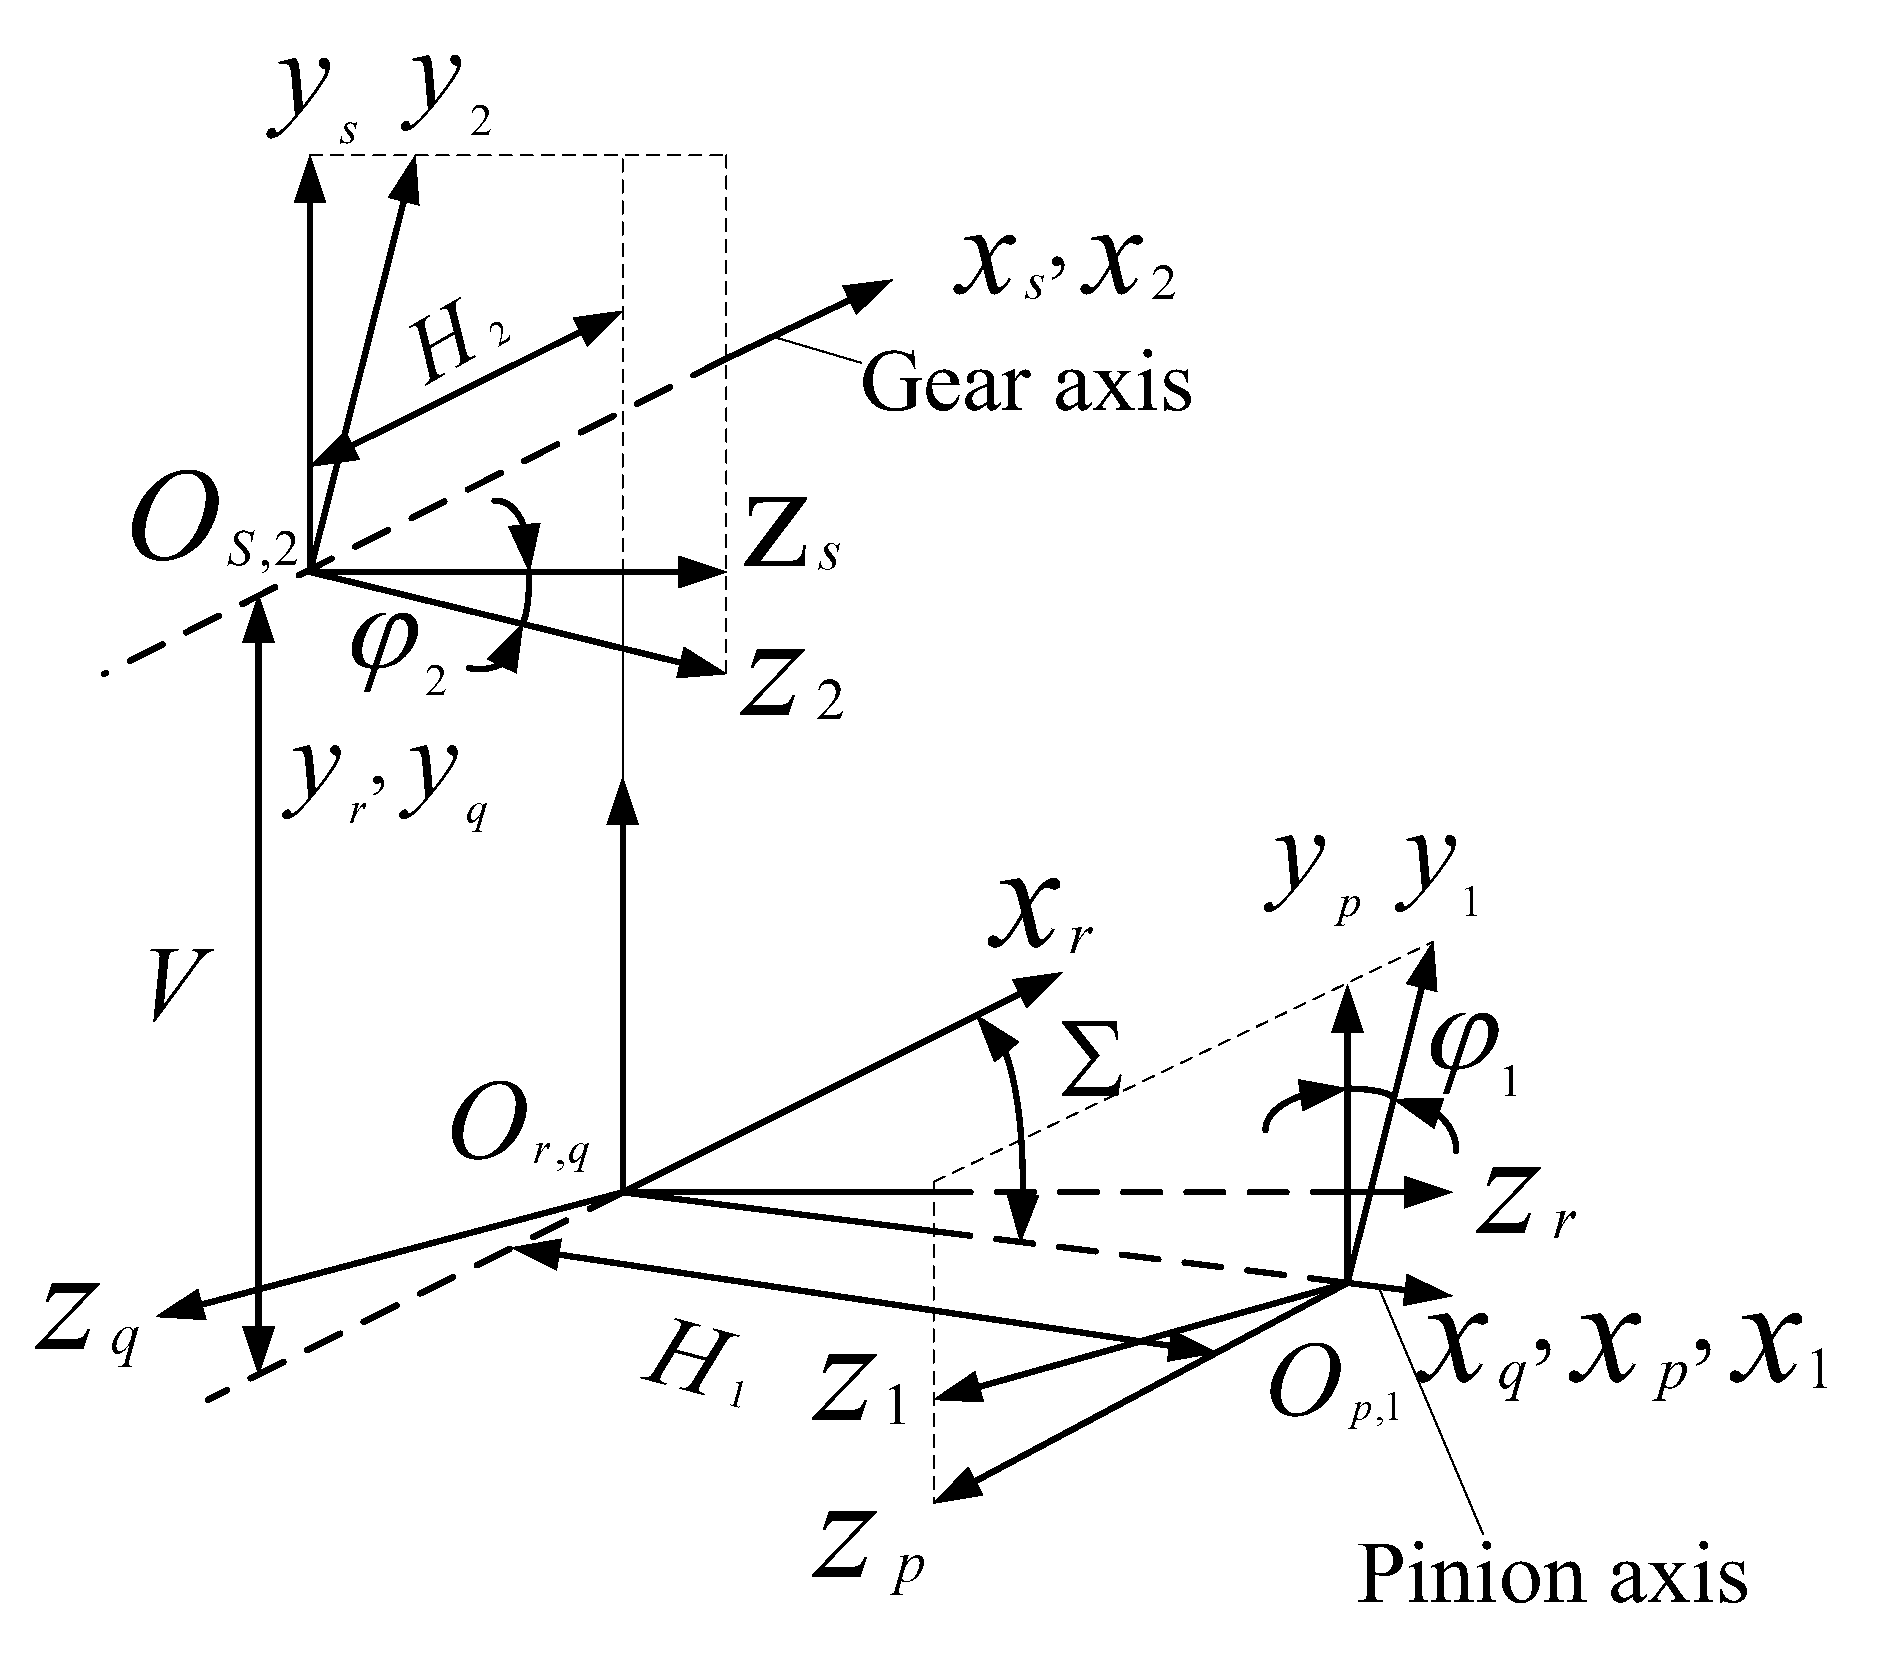
4.1. Coordinate Transformation

The actual tooth surfaces of the pinion and gear are placed in the meshing coordinate system through coordinate transformation, as shown in Figure 8. Ref. [19] provides the detailed process.

4.2. Calculation of Instant Meshing Point and Transmission Error

The meshing point can be calculated by the following steps:
Step 1: Tooth surface discretization. The gear tooth surface Σ2 is discretized into the grids, the pinion tooth surface Σ1 is discretized into 15 × 15 grids, and the three-dimensional coordinate of each grid point can be determined.
Step 2: Adjustment of the position of the tooth surface. Adjusting the rotation angle φ2 or φ1, until the normal at a node on the gear tooth surface passes through the pinion tooth surface Σ1 (Figure 9a). In this study, the pinion is fixed, and φ2 is clockwise rotated to facilitate the calculation.
Step 3: Intersection points determination. Because the pinion tooth surface Σ1 has 14 × 14 surface patches, it is necessary to determine which surface patch the intersection point is located on. If the intersection point falls within the first surface patch or on the edge of the first surface patch, there are four lines from the intersection point to the four corner points of the surface patch, and the sum of the angles α1, α2, α3, and α4 between the four lines is 360° (Figure 9b). If this condition is not satisfied, the intersection point falls outside the area of the surface patch, and then surface patches will continue to be examined until the surface patch with the intersection point is discovered. The NURBS surface equation can accurately express the surface patch equation. The shortest distance dmin from the grid point on Σ2 to Σ1 can be calculated using the formula for the shortest distance from the point to the surface.
Step 4: Calculation of meshing points. When the shortest distance dmin from each grid point of the gear to the pinion tooth surface is calculated, the minimum value Dmin of the shortest distance dmin is determined, as shown in Figure 9c (dmin and dmin represent dmin at different positions). The minimum value Dmin corresponds to the following three meshing conditions:
(1)
If the smallest value Dmin is less than 0.01 μm and other positions do not interfere, this point is considered to be the meshing point. Step 6 is performed.
(2)
If the smallest value Dmin is less than 0.01 μm but there is interference, the rotary angle φ2 is too large and must be adjusted. Step 5 is done for detailed adjustment.
(3)
If the smallest value Dmin is not less than 0.01 μm, the grid is too sparse and the rotary angle φ2 is too small. Local grid refinement near the minimum value Dmin is performed on the gear, and the shortest distance dmin corresponding to all refined grid points and the minimum value Dmin are calculated again, as shown in Figure 9d. If the decrease in amplitude of Dmin is greater than 1%, the grid continues to be refined. If the decrease in amplitude of Dmin is lower than 1%, the rotary angle φ2 is rotated in a clockwise direction according to Equation (4), and Step 3 has to be carried out. The adjusted step length formula is
h = k · D min
where k is the step length coefficient, h is the adjusted step length, and Dmin is the minimum value of the shortest distance dmin between the tooth surfaces of the pinion and gear. The initial step coefficient k is 0.5, and the subsequent k value is the h value obtained in the previous step.
Step 5: Rotation angle adjustment. Adjusting the rotation angle φ2 according to Equation (4) in the counterclockwise direction, the dmin corresponding to all grid points of the gear and Dmin must be calculated again, which determines whether the new Dmin is increased or decreased from the previous Dmin. If it decreases without interference, the program returns to Step 3 to calculate the meshing point. If it decreases and there is interference, φ2 rotates h/2 in the counterclockwise direction and the program returns to Step 3 to calculate the meshing point. If it increases, φ2 rotates in the clockwise direction according to the step length of Equation (4) and the program returns to Step 3 to calculate the meshing point. The flowchart of the numerical gear rolling test method is illustrated in Figure 10.
Step 6: Calculation of the next meshing point. When calculating the next meshing point, the gear and pinion may not be at the meshing position according to the rotation of the theoretical transmission ratio because the tooth surface is obtained by the fitting. Thus, it is still necessary to calculate the meshing point at the current location by Step 3.
Step 7: Calculation of transmission error. When the actual rotation angles and the theoretical rotation angles of both pinion and gear at each meshing point position are calculated, the transmission error can be calculated:
Δ E = φ 2 φ 20 Z 1 Z 2 φ 1 φ 10
where φ10 and φ20 are the initial rotation angles of the pinion and gear, respectively, φ1 and φ2 are the actual rotation angles of the pinion and gear, respectively, and Z1 and Z2 are the tooth numbers of the pinion and gear, respectively.

4.3. Calculation of Contact Ellipse and Contact Path

Step 1: As indicated in Figure 11, P is the meshing point and M is the rotary projection of the tooth surface. A cylindrical surface is established with point P as the center, r as the radius, and the normal vector as the axis of rotation. The generatrices of the cylindrical surface are intercepted by two meshing tooth surfaces to extract a series of intercepted generatrices. When the length of the intercepted generatrices does not reach the amount of elastic deformation (0.00635 mm according to Gleason’s experience [21]), the two endpoints corresponding to the shortest intercepted generatrices appear on the long axis of the instant contact ellipse, and the two endpoints corresponding to the longest intercepted generatrices appear on the short axis of the instant contact ellipse. When the length of the intercepted generatrices is equal to the amount of elastic deformation, the two endpoints of the intercepted generatrices appear on the boundary of the instant contact ellipse.
Step 2: The radius r increases from 0 until the length of all intercepted generatrices is greater than the elastic deformation. A series of points on the long and short axes, and the boundary of the instant contact ellipse can be obtained. When the longest intercepted generatrix has not reached the amount of elastic deformation, there are two points in each contact ellipse corresponding to the shortest intercepted generatrices that appear on the long axis, indicated by points e and f in Figure 12a, and two points corresponding to the longest intercepted generatrices appear on the short axis, indicated by points m and n. When the longest intercepted generatrix is greater than the elastic deformation, there are three conditions because the actual tooth surface contact ellipse is a non-standard ellipse (a, b, and c in Figure 12b). In Figure 12b, the points a, b, c, and d correspond to the length of the intercepted generatrices equal to the amount of elastic deformation appearing on the boundary of the instant contact ellipse, e and f correspond to the shortest intercepted generatrices appearing on the long axis, and n corresponds to the longest intercepted generatrix appearing on the short axis. These points are projected onto the rotary projection surface M, and the boundary of the instant contact ellipse and long axis can be obtained for meshing point P.
Step 3: The contact pattern and contact path of the entire tooth surface can be calculated by repeating these steps at each contact position in the meshing cycle.
Unlike the traditional method, contact pattern and transmission error can be obtained without quadratic approximation of the surface and curvature derivation, so the results are closer to the actual meshing conditions of the gear.

5. Numerical Examples

The numerical gear rolling test method program was compiled. Taking a face-hobbed hypoid gear of a drive axle as an example (see Table 1 for parameters), the 15 × 15 measuring data on the actual tooth surface was obtained by the Klingelnberg gear measuring center P65, the number of measuring points in both tooth width and tooth profile direction is 15, the measurement results are shown in Figure 13 and Figure 14.

5.1. Actual Tooth Surface Modeling

The actual tooth surface model of the gear pair was reconstructed by using the reverse modeling method, the results are shown in Figure 15.

5.2. Contact Pattern and Transmission Error

The numerical gear rolling test method program was conducted based on the actual tooth surface model (see Figure 15). The contact pattern and transmission error curves of the drive side and the coast side were obtained, as indicated in Figure 16. The contact ellipse of the sixth meshing point on the drive side (gear convex) is shown in Figure 16c. The small * corresponds to points e and f, and the fat * corresponds to point P in Figure 12.

5.3. Finite Element Simulation of Contact Ellipse

To verify the accuracy of the contact ellipse obtained by the NGRT, mature commercial finite element software is used to simulate the contact ellipse of the tooth surfaces, and the results are compared with those obtained by the NGRT method.
The measuring points were used to establish a five-tooth surface model in Solidworks, and Hypermesh was used to mesh the model, as shown in Figure 17a. The single-tooth end face is divided into a regular quadrilateral, and then the single-tooth hexahedron mesh model can be obtained by 3D mesh scanning with the SolidMap function. Considering the contact ratio and computational efficiency, the five-tooth model is then obtained by the array. The mesh model was imported into Abaqus for pre-processing and simulation by the following steps:
Step 1: Material properties: The material density was 7850 kg/m3, the elastic modulus was 210,000 MPa, and the Poisson’s ratio was 0.3;
Step 2: Analysis step: Three general static analyses were used as the solver;
Step 3: Interaction: The continuous pinion concave and gear convex were used as contact pairs, and the contact mode was hard friction with a friction coefficient of 0.1. The calculation was conducted by the kinematic contact method;
Step 4: Boundary setting: The input torque was 500 N·m for the gear, the pinion concave pushes the gear convex to rotate for contact analysis.
The simulation results on the drive side (gear convex) are shown in Figure 17b. Using imaging technology, the tooth surface boundary and contact ellipse were extracted and rotated to the projection surface, as shown in Figure 17c.
According to results obtained by the numerical gear rolling test method and finite element simulation (Figure 16c and Figure 17c), it can be seen that the contact ellipse on the actual tooth surface is not a standard contact ellipse, and the contact path is not a straight line (Figure 16a,b).

6. Experimental Validation

The rolling test experiment was conducted under light load to further validate the results in Section 5.2 and Section 5.3, as shown in Figure 18a, and the results are shown in Figure 18b,c.
In order to further verify the method in this paper, the soft KIMoS5 was used to calculate the contact pattern and the transmission error curves of the gear pairs with the same parameters, as shown in Figure 19.
According to the experimental results, it can be seen that the positions of the tooth surface patterns were distributed in the middle one-third of the tooth width, as shown in Figure 18b,c. Comparing Figure 16a,b with Figure 18b,c and Figure 19a, the shape, size, and direction of the pattern obtained by the numerical gear rolling test method in Section 5.2 are consistent with the rolling test and KIMoS5 results.
Comparing Figure 16d,e with Figure 19b,c, the transmission error amplitudes of the drive side and the coast side as well as the relative errors of the results obtained by the numerical gear rolling test method and experiment are shown in Table 2.
According to Table 2, the relative errors of the amplitudes of the transmission errors of the drive side and the coast side obtained by the numerical gear rolling test method and experiment are 4.5% and 5.3%, respectively, which may be due to the deviation of the installation position of the pinion and gear in the rolling test. However, the small relative errors still prove the accuracy of the numerical gear rolling test method.

7. Conclusions

A numerical gear rolling test method with high accuracy was proposed in this study. Through simulations and experiments, it was demonstrated that the contact ellipse of the actual tooth surface is not necessarily a standard ellipse, and the instant contact path is not necessarily a straight line. The contact pattern obtained utilizing the NGRT method is consistent with the actual rolling test result; the relative errors of the transmission error amplitudes were 4.5% and 5.3% for the drive and coast sides, respectively. The transmission error results obtained by KIMoS5 are theoretical; the relative error between theoretical and experimental results is acceptable. The proposed NGRT method will play an important role in the closed-loop gear manufacturing process, which can provide cost reduction and increase efficiency, especially in automobile mass production. To this end, it is necessary to explore the loaded NGRT method in future work.

Author Contributions

Conceptualization, J.D. and Q.Z; methodology, J.D. and Q.Z; software, Y.L.; validation, J.D. and Q.Z., Y.L. and H.M.; formal analysis, Y.L. and H.M.; investigation, Y.L.; writing—original draft preparation, Y.L. and H.M.; writing—review and editing, Y.L. and H.M.; visualization, Y.L.; supervision, J.D.; funding acquisition, J.D. and Q.Z. All authors have read and agreed to the published version of the manuscript.

Funding

This work was supported by the Fundamental Research Funds for the Central Universities, CHD (grant no. 300102211521), China; the National Natural Science Foundation of China (grant no. 51705419), China; the Natural Science Basic Research Program of Shaanxi (grant no. 2022JM271), China; the Postdoctoral research project of Shaanxi Province (grant no. 2018BSHEDZZ10), China; and the Science and Technology Plan Project of Xi’an (grant no. 22GXFW0091), China.

Institutional Review Board Statement

Not applicable.

Informed Consent Statement

Not applicable.

Data Availability Statement

The data used to support the findings of the study are available from the corresponding author.

Conflicts of Interest

The authors declare no conflict of interest.

References

  1. Ding, H.; Tang, J.K.; Shao, W.; Zhou, Y.S.; Wang, G.X. Optimal modification of tooth flank form error considering measurement and compensation of cutter geometric errors for spiral bevel and hypoid gears. Mech. Mach. Theory 2017, 118, 14–37. [Google Scholar] [CrossRef]
  2. Artoni, A.; Gabiccini, M.; Kolivand, M. Ease-off based compensation of tooth surface deviations for spiral bevel and hypoid gears: Only the pinion needs corrections. Mech. Mach. Theory 2012, 61, 84–101. [Google Scholar] [CrossRef]
  3. Li, G.; Wang, Z.H.; Zhu, W.D. Prediction of surface wear of involute gears based on a modified fractal method. J. Tribol. 2019, 141, 031603. [Google Scholar] [CrossRef]
  4. Li, G.; Wang, Z.H.; Kubo, A. The modeling approach of digital real tooth surfaces of hypoid gears based on non-geometric-feature segmentation and interpolation algorithm. Int. J. Precis. Eng. Manuf. 2016, 17, 281–292. [Google Scholar] [CrossRef]
  5. Zhang, Y.; Litvin, F.L.; Maruyama, N.; Takeda, R.; Sugimoto, M. Computerized Analysis of Meshing and Contact of Gear Actual tooth surfaces. J. Mech. Des. 1994, 116, 677–682. [Google Scholar] [CrossRef]
  6. Li, G.; Wang, Z.H.; Kubo, A. Error-sensitivity Analysis for Hypoid Gears Using a Actual tooth surface Contact Mode. P. I. Mech. Eng. C-J. Mec. 2016, 231, 507–521. [Google Scholar] [CrossRef]
  7. Zhang, W.Q.; Guo, X.D.; Wang, Y.W.; Wen, Y.K.; Lin, C.C.; Lim, T.C. A CNC Tooth Grinding Method for Formate Face Hobbed Hypoid Gears. Mech. Mach. Theory 2020, 144, 103628. [Google Scholar] [CrossRef]
  8. Liu, G.L.; Li, D.G.; Wang, L.Y. Reconstruction of real tooth surfaces of Spiral Bevel Pinions with Modified Offset. Inverse Probl. Sci. En. 2015, 23, 214–234. [Google Scholar] [CrossRef]
  9. Du, J.F.; Fang, Z.D. An Active Tooth Surface Design Methodology for Face-hobbed Hypoid Gears Based on Measuring Coordinates. Mech. Mach. Theory 2016, 99, 140–154. [Google Scholar] [CrossRef]
  10. Ma, Z.Q.; Wang, X.C.; Shen, B. Real Tooth Contact Analysis of the Cylindrical Gears with Symmetrical Arcuate Tooth Trace. J. Xi’Jiaotong Univ. 2005, 39, 722–725. [Google Scholar]
  11. Lin, C.H.; Fong, Z.H. Numerical Tooth Contact Analysis of a Bevel Gear Set by Using Measured Tooth Geometry Data. Mech. Mach. Theory 2015, 84, 1–24. [Google Scholar] [CrossRef]
  12. Gosselin, C.; Shiono, Y.; Kagimoto, H.; Aoyama, N. Corrective Machine Settings of Spiral-bevel and Hypoid Gears with Profile Deviations. In Proceedings of the 4th World Congress on Gearing and Power Transmissions, Paris, France, 16–18 March 1999; pp. 543–555. [Google Scholar]
  13. Wang, Z.H.; Li, G.; Kubo, A. Tooth Contact Analysis of Spiral Bevel Gears Based on Digital Actual tooth surfaces. Chin. J. Mech. Eng. 2014, 50, 1–11. [Google Scholar]
  14. Litvin, F.L. Applied Theory of Gearing: State of the Art. J. Vib. Acoust. 1995, 117, 128–134. [Google Scholar] [CrossRef]
  15. Wu, X.C.; Mao, S.M.; Wu, X.T. On Function-Oriented Design of Point-Contact Tooth Surface. Mech. Sci. Technol. 2000, 19, 347–349. [Google Scholar] [CrossRef]
  16. Du, J.F.; Wang, Z.R.; Liu, K. A Novel Tooth Contact Analysis Method Based on Value Iteration. Adv. Mech. Eng. 2020, 77, 162–169. [Google Scholar]
  17. Zhu, X.X. Free Curves and Surfaces Modeling Technology; Science Press: Beijing, China, 2000. [Google Scholar]
  18. Shi, F.Z. CAGD & NURBS; Higher Education Press: Beijing, China, 2001. [Google Scholar]
  19. Shih, Y.P.; Fong, Z.H.; Lin, J.C.Y. Mathematical Model for a Universal Face-Hobbing Hypoid Gear Generator. J. Mech. Des. 2007, 129, 38–47. [Google Scholar] [CrossRef]
  20. Wang, S.H.; Zhou, Y.S.; Tang, J.Y.; Tang, K.; Li, Z.M.Q. Digital Tooth Contact Analysis of Face Gear Drives with an Accurate Measurement Model of Face Gear Tooth Surface Inspected by CMMs. Mech. Mach. Theory 2022, 167, 104498. [Google Scholar] [CrossRef]
  21. Fan, Q. Enhanced Algorithms of Contact Simulation for Hypoid Gear Drives Produced by Face-milling and Face-hobbing Processes. J. Mech. Des. 2007, 129, 31–37. [Google Scholar] [CrossRef]
Figure 1. Distribution of measuring points.
Applsci 13 10278 g001
Figure 2. Pinion concave: NURBS surface.
Applsci 13 10278 g002
Figure 3. Gear convex: NURBS surface.
Applsci 13 10278 g003
Figure 4. Pinion convex: NURBS surface.
Applsci 13 10278 g004
Figure 5. Gear concave: NURBS surface.
Applsci 13 10278 g005
Figure 6. Grid center point obtained using forward algorithm.
Applsci 13 10278 g006
Figure 7. Curve of fitting errors.
Applsci 13 10278 g007
Figure 8. Meshing coordinate systems.
Applsci 13 10278 g008
Figure 9. Schematic diagram of the calculation process of the meshing point: (a) intersection point on the pinion tooth surface; (b) location determination of the intersection point; (c) shortest distance of two meshing tooth surfaces; (d) local grid refinement.
Applsci 13 10278 g009aApplsci 13 10278 g009b
Figure 10. Numerical gear rolling test method.
Applsci 13 10278 g010
Figure 11. Cylindrical intercepted meshing surface.
Applsci 13 10278 g011
Figure 12. Pattern search: (a) within elastic deformation; (b) outside elastic deformation: (I) symmetric type with two points of intersection; (II) symmetric type with four points of intersection; (III) asymmetrical type with two points of intersection.
Applsci 13 10278 g012
Figure 13. Measurement results of the gear tooth surface.
Applsci 13 10278 g013
Figure 14. Measurement results of the pinion tooth surface.
Applsci 13 10278 g014
Figure 15. Actual tooth surface model: (a) actual tooth surface of the pinion concave; (b) actual tooth surface of the gear convex; (c) actual tooth surface of the pinion convex; (d) actual tooth surface of the gear concave.
Applsci 13 10278 g015aApplsci 13 10278 g015b
Figure 16. NGRT results: (a) contact pattern on drive side (gear convex); (b) contact pattern on coast side (gear concave); (c) sixth non-standard contact ellipse on drive side (gear convex); (d) transmission error of drive side; (e) transmission error of coast side.
Applsci 13 10278 g016aApplsci 13 10278 g016b
Figure 17. Finite element simulation results: (a) finite element model of five tooth; (b) single contact ellipse on the drive side (gear convex); (c) single contact ellipse on the rotary projection surface (gear convex).
Applsci 13 10278 g017
Figure 18. Rolling test pattern: (a) rolling test of drive axle gear; (b) contact pattern of rolling test on the drive side (gear convex); (c) contact pattern of rolling test on the coast side (gear concave).
Applsci 13 10278 g018
Figure 19. Transmission error curves of KIMoS5: (a) contact pattern; (b) transmission error of the drive side; (c) transmission error of the coast side.
Applsci 13 10278 g019
Table 1. FH hypoid gear parameters.
ParametersSymbolsUnitPinionGear
Shaft angleΣdeg90.0000
Hypoid offsetVmm30.000030.0000
Normal modulemnmm7.66417.6641
Number of teethZ--1241
Outer pitch diameter: gearde2mm--452.0000
Face widthFmm80.400076.0000
Whole depthhemm17.660317.6603
Mean pitch cone diameterdmmm125.720380.7530
Pitch angleδdeg20.159669.6298
Mean spiral angleβmdeg42.9845 LH34.3833 RH
Nominal cutter radiusrwmm175.0000175.0000
Nominal pressure angle: driveαNv1deg22.500022.5000
Nominal pressure angle: coastαNx1deg22.500022.5000
Outside diameterdaemm177.2915453.8098
Mean pitch cone distanceRmmm182.3948203.0761
Table 2. Transmission error deviation.
ItemsResults of Numerical Gear Rolling TestResults of KIMoS5Relative Error
Drive side−46.03 μrad−48.2 μrad4.5%
Coast side−45.05 μrad−47.6 μrad5.3%
Disclaimer/Publisher’s Note: The statements, opinions and data contained in all publications are solely those of the individual author(s) and contributor(s) and not of MDPI and/or the editor(s). MDPI and/or the editor(s) disclaim responsibility for any injury to people or property resulting from any ideas, methods, instructions or products referred to in the content.

