Article

Rudomain Iron Ore Treatment by High-Temperature Reduction

1
Faculty of Metallurgy, Technical University of Košice, 042 00 Košice, Slovakia
2
Výskumno-Inovačné a Technologické Centrum, n.o., Werferova 3782/6, 040 11 Košice, Slovakia
3
Rudomain, 301 Pochtovy Ave, 50001 Kryvyi Rih, Ukraine
*
Author to whom correspondence should be addressed.
Appl. Sci. 2023, 13(19), 10698; https://doi.org/10.3390/app131910698
Submission received: 4 September 2023 / Revised: 21 September 2023 / Accepted: 22 September 2023 / Published: 26 September 2023
(This article belongs to the Special Issue Recent Advances in Metallurgical Process Engineering)

Abstract

:
The purpose of this study was to conduct experiments comprising the high-temperature reduction treatment of commercially produced iron ore fines and lumps aimed at increasing the use value of the ore. The analysed ore was Ukrainian iron ore sold under the Rudomain commercial name, mined from a bed located in the southern part of the Saksagan region (Kryvyi Rih, Ukraine). The study describes in detail the basic physical, chemical, and physico-chemical properties of the analysed ore, and it comprised a thermodynamic analysis, which is typically used as the basis for defining reduction conditions. The Ukrainian ore—Rudomain—exhibited a lower total Fe content (58.20 wt%) and, by contrast, the highest SiO2 content (13.40 wt%), whereas SiO2 is present in this type of ore not only in form of silica (SiO2) but also in form of hydrated iron silicate (Fe3Si2O5(OH)4), i.e., the form of iron that is the most difficult to reduce. In the study, tests of thermal stability and thermal shock stability were carried out in various conditions, while the hardened pellets were thermally stable up to temperatures of 950 °C. The results of the performed experiments in high-temperature reduction of Rudomain iron ore were then compared with the results obtained with two other types of iron ores, in particular Krivbas and Carajas. Krivbas and Carajas ores show higher degrees of reduction and degrees of metallization than Rudomain ore. High-temperature experiments in thermal stability and carbothermic reduction have brought favourable information that is useful for the treatment of lower-grade ores with higher contents of SiO2, while Rudomain iron ore exhibited a rather good potential for effective metallisation.

1. Introduction

Steel production is a process with high energy consumption and high emission production, and it represents approximately 8% of the global demand for energy and 7% (2.6 Gt of CO2) of the total emission from the power system. Therefore, decarbonisation of the metallurgical industry will be the key drive of future changes in metallurgy, which must definitely reflect a significant change in the technological processes involved in the steel production [1,2,3,4].
The greatest challenges will be faced by the so-called integrated metallurgical plants (blast furnace–basic oxygen furnace, BF-BOF) that produce steel from iron ores. Such plants produce approximately 1.7–2.1 tonnes of CO2 emissions per 1 tonne of produced steel [5,6,7]. A study [8] that analysed potential methods of decarbonisation in the metallurgical industry identified the most relevant technologies, such as hydrogen-based direct reduction (H2-DR), hydrogen plasma smelting reduction (HPSR), hydrogen flash smelting (HFS), iron bath reactor smelting reduction (IBRSR), electrolysis processes (alkaline iron electrolysis (AIE) and molten oxide electrolysis (MOE)), optimised blast-furnace processes (for example, top gas recycling blast furnace (TGRBF)), or processes for the capture and usage of CO2 (carbon capture and storage (CCS), carbon capture and usage (CCU)). An important indicator is the technology readiness level (TRL), which is indicative in terms of time of the implementation of the obtained knowledge aimed at commercial industrial usage (TRL-9 level) [9,10,11,12,13].
In the long-term prediction after 2030, it would be appropriate to focus on the production of a directly reduced product in the form of hot briquette iron (HBI) or direct reduction iron DRI (DRI/EAF mini-mill plant), and such a change can lead to significant decarbonization. Currently, there are also weak points of decarbonization: limited availability of raw materials, limited availability of renewable energy, and increased operating costs. The quality of input iron-bearing materials is assessed on the basis of their physical, chemical, and metallurgical properties [14]. There are only a few suitable iron ore minerals out of more than 300 types, and these are primarily oxide-based minerals, such as magnetite–Fe3O4 (72.36% of Fe), hematite or martite (pseudomorphosis of hematite after magnetite)–Fe2O3 (69.94% of Fe), limonite (62.85% of Fe) (a mixture of hydrated iron oxides, primarily goethite (HFeO2), and lepidocrocite (γ-FeOOH, frequently with absorbed elements of vanadium, manganese, cobalt, etc.) [14]. Siderite-based carbonate ores, namely FeCO3 (48.20% of Fe), and silicate-based ores (leptochlorites), e.g., chamosite–(Fe2+,Mg,Fe3+)5Al(Si3Al)O10(OH,O)8 (29.43% of Fe), may also be processed. For the purpose of assessing the quality or value of iron-bearing ores and concentrates, it is necessary to know their Fe contents and undesirable contents of SiO2 and other additives. High-quality iron ores exhibit high contents of total iron (minimum 63%), a content of Al2O3 of up to 1.3%, SiO2 of up to 6%, P below 0.04%, and contents of alkalis of up to 0.08% [15]. Undesirable additives mainly include sulphur, phosphorus, zinc, lead, arsenic, copper, sodium, and potassium, which are chemically bound in various minerals [14]. It is necessary to know not only chemical and mineralogical composition of iron ores and concentrates but also their physical properties, in particular moisture, specific gravity, granulometric composition, bulk properties, porosity and specific surface area, mechanical strength, abrasion, compressive strength, and grindability [16]. Granulometry is a parameter that affects air permeability, gas flow intensity, and pressure loss. In terms of pelletisation, it affects its final granulometry, segregation of grains, and pelletisation prior to the high-temperature treatment [16]. The porosity of materials at the macropore level (above 0.1 mm) or a size of the specific surface area of pores are the properties that are important in terms of the reaction surface where reduction-oxidation reactions and processes take place [16]. A value of input metal-bearing raw materials is determined by their chemical and mineralogical composition, physical properties (mainly granulometry), metallurgical properties (mainly reducibility), costs of treatment of those materials, and costs of fuels used for processing them into metals. From this particular point of view, the most suitable materials are those with a high total iron content, without harmful additives, with a suitable mineralogical composition, with a low interval of softening at high temperatures, and those that are easy to reduce and show high thermal stability. Reducibility, in particular, is one of the most important properties of iron-bearing materials, and it reflects not only a physical condition of a material (granulometry and porosity) but also its chemical and mineralogical composition. Globally, reducibility is identified by performing standardised or non-standardised tests. An advantage of a standardised test is its representativeness and an option to confirm results between individual test centres [17]. On the other hand, its disadvantage is that the test parameters are set as fixed (for example, temperature, composition of the reducing atmosphere, time in which a particular degree of reduction is achieved, reduction time, etc.), so it is impossible to adjust testing to site-specific conditions. That is why metallurgical companies all over the world use also non-standardises tests that are adjusted to concrete thermodynamic conditions in a particular blast furnace (for example, used materials, the plasticity zone, a position of the cohesive layer, temperatures in the low- and high-temperature reduction, etc.) [18,19]. Such tests are typically performed by applying methodologies of thermogravimetric analysis (TGA), a fluid layer, and reduction retorts [18,19,20,21,22,23]. Such approaches are innovative and more effective. A high reduction index relates to Fe raw materials such as its higher basicity and its high porosity [17]. The degree of reduction increases with increase in Fe2O3:C ratio, temperature, and time. The maximum degree of reduction is observed at Fe2O3:C ratio of 1:1.75 [24]. One of the key input materials that will be used in the future is a metal-bearing charge made of pre-treated ore materials since there is a continuous assumption of a deficit of steel scrap [22]. Therefore, it is necessary to effectively use primary sources of iron for the production of products with higher added value. Those objectives correlate to the intentions of our experimental works and analyses aimed at finding a new potential of Rudomain iron ore, in particular by increasing its use value.

2. Materials and Experimental Works

The tested iron ore is mined in the “Yuzhny” open pit located in the southern part of the Saksagan region (Kryvyi Rih, Ukraine) [25]. The total recovery level is 4 Mt/year, with a minimum Fe content of 38%. The product portfolio consists of several types of iron ores and lump ores, which are characterised and limited by standard quality indicators describing the contents of selected components and granulometry. The richest products contain a minimum of 60% of Fe and a maximum of 14% of SiO2, whereas the lower-grade ones contain a minimum of 38% of Fe and a maximum of 38% of SiO2. The moisture of the products reaches a maximum of 8%, while the maximum contents of sulphur and phosphorus represent 0.01%.
The study of the processing (pre-treatment) of the tested Rudomain ore was carried out with selected samples, while the R7 sample represents a long-term average of this commodity. Parallel tests were carried out with two other ores that represented the reference samples (Table 1). In Section 3.1, the physico-chemical and metallurgical properties of iron ores are described in detailed specifications of the properties of those iron ores.
Experiments in the reduction of three types of iron ores (KB, Krivbas; R7, Rudomain 7; CAR, Carajas) mixed with a solid reducing agent (charcoal, Table 2) at the ratio of ore to reducing agent of 4:1 (in a dry state) were carried out at various temperatures and various holding times. The experiments were conducted in a muffle furnace (MP-62, type MARK ESA, Electro, Prague, Czech Republic) and in an electric induction furnace (HFR 15, RAJMONT, Prague, Czech Republic). Raw pellets sized ~10–15 mm were inserted into the MP-62 furnace (Electro, Prague, Czech Republic), pre-heated to 600 °C, and then heated up to 1200 °C with a gradient of 40 °C/min. Holding time at the maximum temperature was 10–300 min, followed by gradual cooling in the furnace and in the air. During the experiments, the gaseous phase was monitored in order to control reduction conditions. Measurements were carried out using a Testo 350 (Testo SE & Co., KGaA, Titisee-Neustadt, Germany) exhaust gas analyser with respective O2 and CO modules. The CO2 content was subsequently calculated. Due to the predicted and expected high concentration of CO in the system, the equipment was used in the mode of automatic dilution of exhaust gas (five times) for the purpose of protecting the modules. A gas probe was attached to the outlet of the heated ceramic tube in which a boat containing pellets was placed. During the measurements, it was observed that even the 5-fold dilution did not bring a sufficient dilution effect required for safe continuous measurements, and the equipment exhibited short interruptions (outages) in recording CO, which may be seen in the curves presented in Table 3. Regardless, it may be stated that the conditions of the reducing atmosphere were confirmed while the CO concentrations reached their peaks before achieving the temperature of holding that ranged in an interval of 900–1100 °C with a period of ~5 min. The recordings also clearly showed that the conditions for the Boudouard reaction between CO2 and solid carbon to form CO were successfully created.
The high-temperature reduction of iron ore samples was also carried out in the HFR 15, RAJMONT electric induction furnace in a steel cylinder in a retort made of silica glass, placed inside an inductor of the electric induction furnace. Temperatures were measured by applying a contactless method, using a thermal-imaging camera (Table 4). The carbothermic reduction was carried out using raw pellets that were gradually heated to temperatures ranging from 1100 to 1200 °C with a holding time of 20–150 min (Table 4). The carbothermic reduction was carried out in the inert nitrogen atmosphere with a regulated gas flow rate. During the experiment, gaseous components were monitored (primarily a content of the produced CO) using an exhaust gas analyser (TESTO 350), while the laboratory premises were also monitored using a manual CO analyser.
Values of bulk and true specific gravity were identified for all types of raw samples, while their average values correlated to their declared richness (Table 1). Their chemical composition was identified by applying several methodologies prescribed by ISO, ASTM, and DIN standards as well as company standards. The methods applied mainly included X-ray fluorescence (XRF), atomic absorption spectroscopy (AAS), infrared spectroscopy (IR), and titration and gravimetry methods. Chemical composition was determined with a Niton XL3 Gold XRF spectrometer (Thermo Fisher Scientific, Waltham, MA, USA) and using Thermo Scientific ICE 3500 AAS (Thermo Fisher Scientific, Waltham, MA, USA) elemental analysis. The Elemental Vario (Elementar Analysensysteme GmbH, Langenselbold, Germany) was used for simultaneous carbon, hydrogen, nitrogen, and sulphur analysis. A sieve analysis was carried out using a vibration-pendulum sorting machine KVT-U-2 with a set of sieves, while a chemical analysis was carried out using an XRF spectrometer—Niton XL3 Gold. Phase analyses were performed using an X-ray diffraction analyser—D8 Advance, Bruker AXS (Karlsruhe, Germany), and the melting interval was identified by analysing images from a high-temperature microscope—Leitz WETZLAR (New York Microscope Company, New York, NY, USA). The Rudomain sample was also subjected to thermal-shock testing in oxidation-reduction conditions in an electric resistance furnace (a tube furnace, MP-62 type, MARK ESA up to 1450 °C). In the testing, a TGA analysis was performed as well (Derivatograph-C, MOM Budapest, Hungary). Thermodynamic modelling was carried out using the thermodynamic software “HSC Chemistry”, versions 9 and 5.11, by Outokumpu Research Oy, Pori, Finland.

3. Results and Discussion

3.1. Physico-Chemical and Metallurgical Properties of Iron Ores

Rudomain iron ore is of the hematite type (Fe2O3), with rather low contents of impurities (P2O5, S, and alkalis). A comparison of physico-chemical and metallurgical properties of Rudomain iron ore and those of Krivbas and Carajas iron ores is presented in Table 5.
Results of the identification of physico-chemical and metallurgical properties of iron ores indicated that the Brazilian iron ore, i.e., Carajas, exhibited the highest quality. A total Fe content was found to be approximately 65 wt%, while the major portion of iron was present in form of easy-to-reduce hematite (Fe2O3). The total Fe content of the iron ore Carajas was analysed by two methods (with XRF analysis, Fe content = 65.23%, with AAS analysis, Fe content = 65.17%). High agreement in the analysis of total Fe was achieved within the XRF and AAS methodologies also in the case of Rudomain and Krivbas iron ores. The Carajas ore exhibited a very low content of SiO2 (in form of silica). The Ukrainian ore, i.e., Rudomain, exhibited a lower total Fe content (58.20 wt%) and, by contrast, the highest SiO2 content. In the case of the SiO2 analysis in the iron ore Rudomain, larger deviations were recorded within the XRF (13.40%) and AAS (12.95%) methodologies than in the case of the Fe content. The content of SiO2 is present in this type of ore not only in form of silica (SiO2) but also in form of hydrated iron silicate (Fe3Si2O5(OH)4), i.e., the form of iron that is the most difficult to reduce. The Rudomain iron ore contained more mineralogical forms of iron in addition to hydrated iron silicate, cronstedtite (Fe2+2Fe3+(Si,Fe3+)2O5)(OH)4, and magnetite (Fe3O4). The contents of undesirable phosphorus and sulphur impurities were very low for all iron ores. The sulphur content was analysed not only by XRF analysis but also by IR analysis using the Elemental Vario device. There was a high correlation with both methodologies.
The results of the identification of the granulometric composition indicated that Rudomain iron ore had the lowest porosity (~97% of grains were sized less than 10 mm). As for Krivbas iron ore, ~81% of grains were sized less than 10 mm, while in Carajas iron ore, ~78% of grains were sized less than 10 mm. In these iron ores, a proportion of grains sized less than 0.1 mm ranged from 0.35 to 6.05%; as a result, it is assumed that those iron ores must be subjected to grinding in order to achieve more appropriate surface properties and ensure the subsequent production of pellets for the reduction. In order to facilitate effective carbothermic reduction, reduced ore must have a melting point that is higher than the temperature at which maximum degrees of reduction are achieved. From this point of view, all three analysed iron ores met the criterion of suitability for carbothermic reduction. The Rudomain sample exhibited the lowest melting point (1453 °C) out of all tested materials.

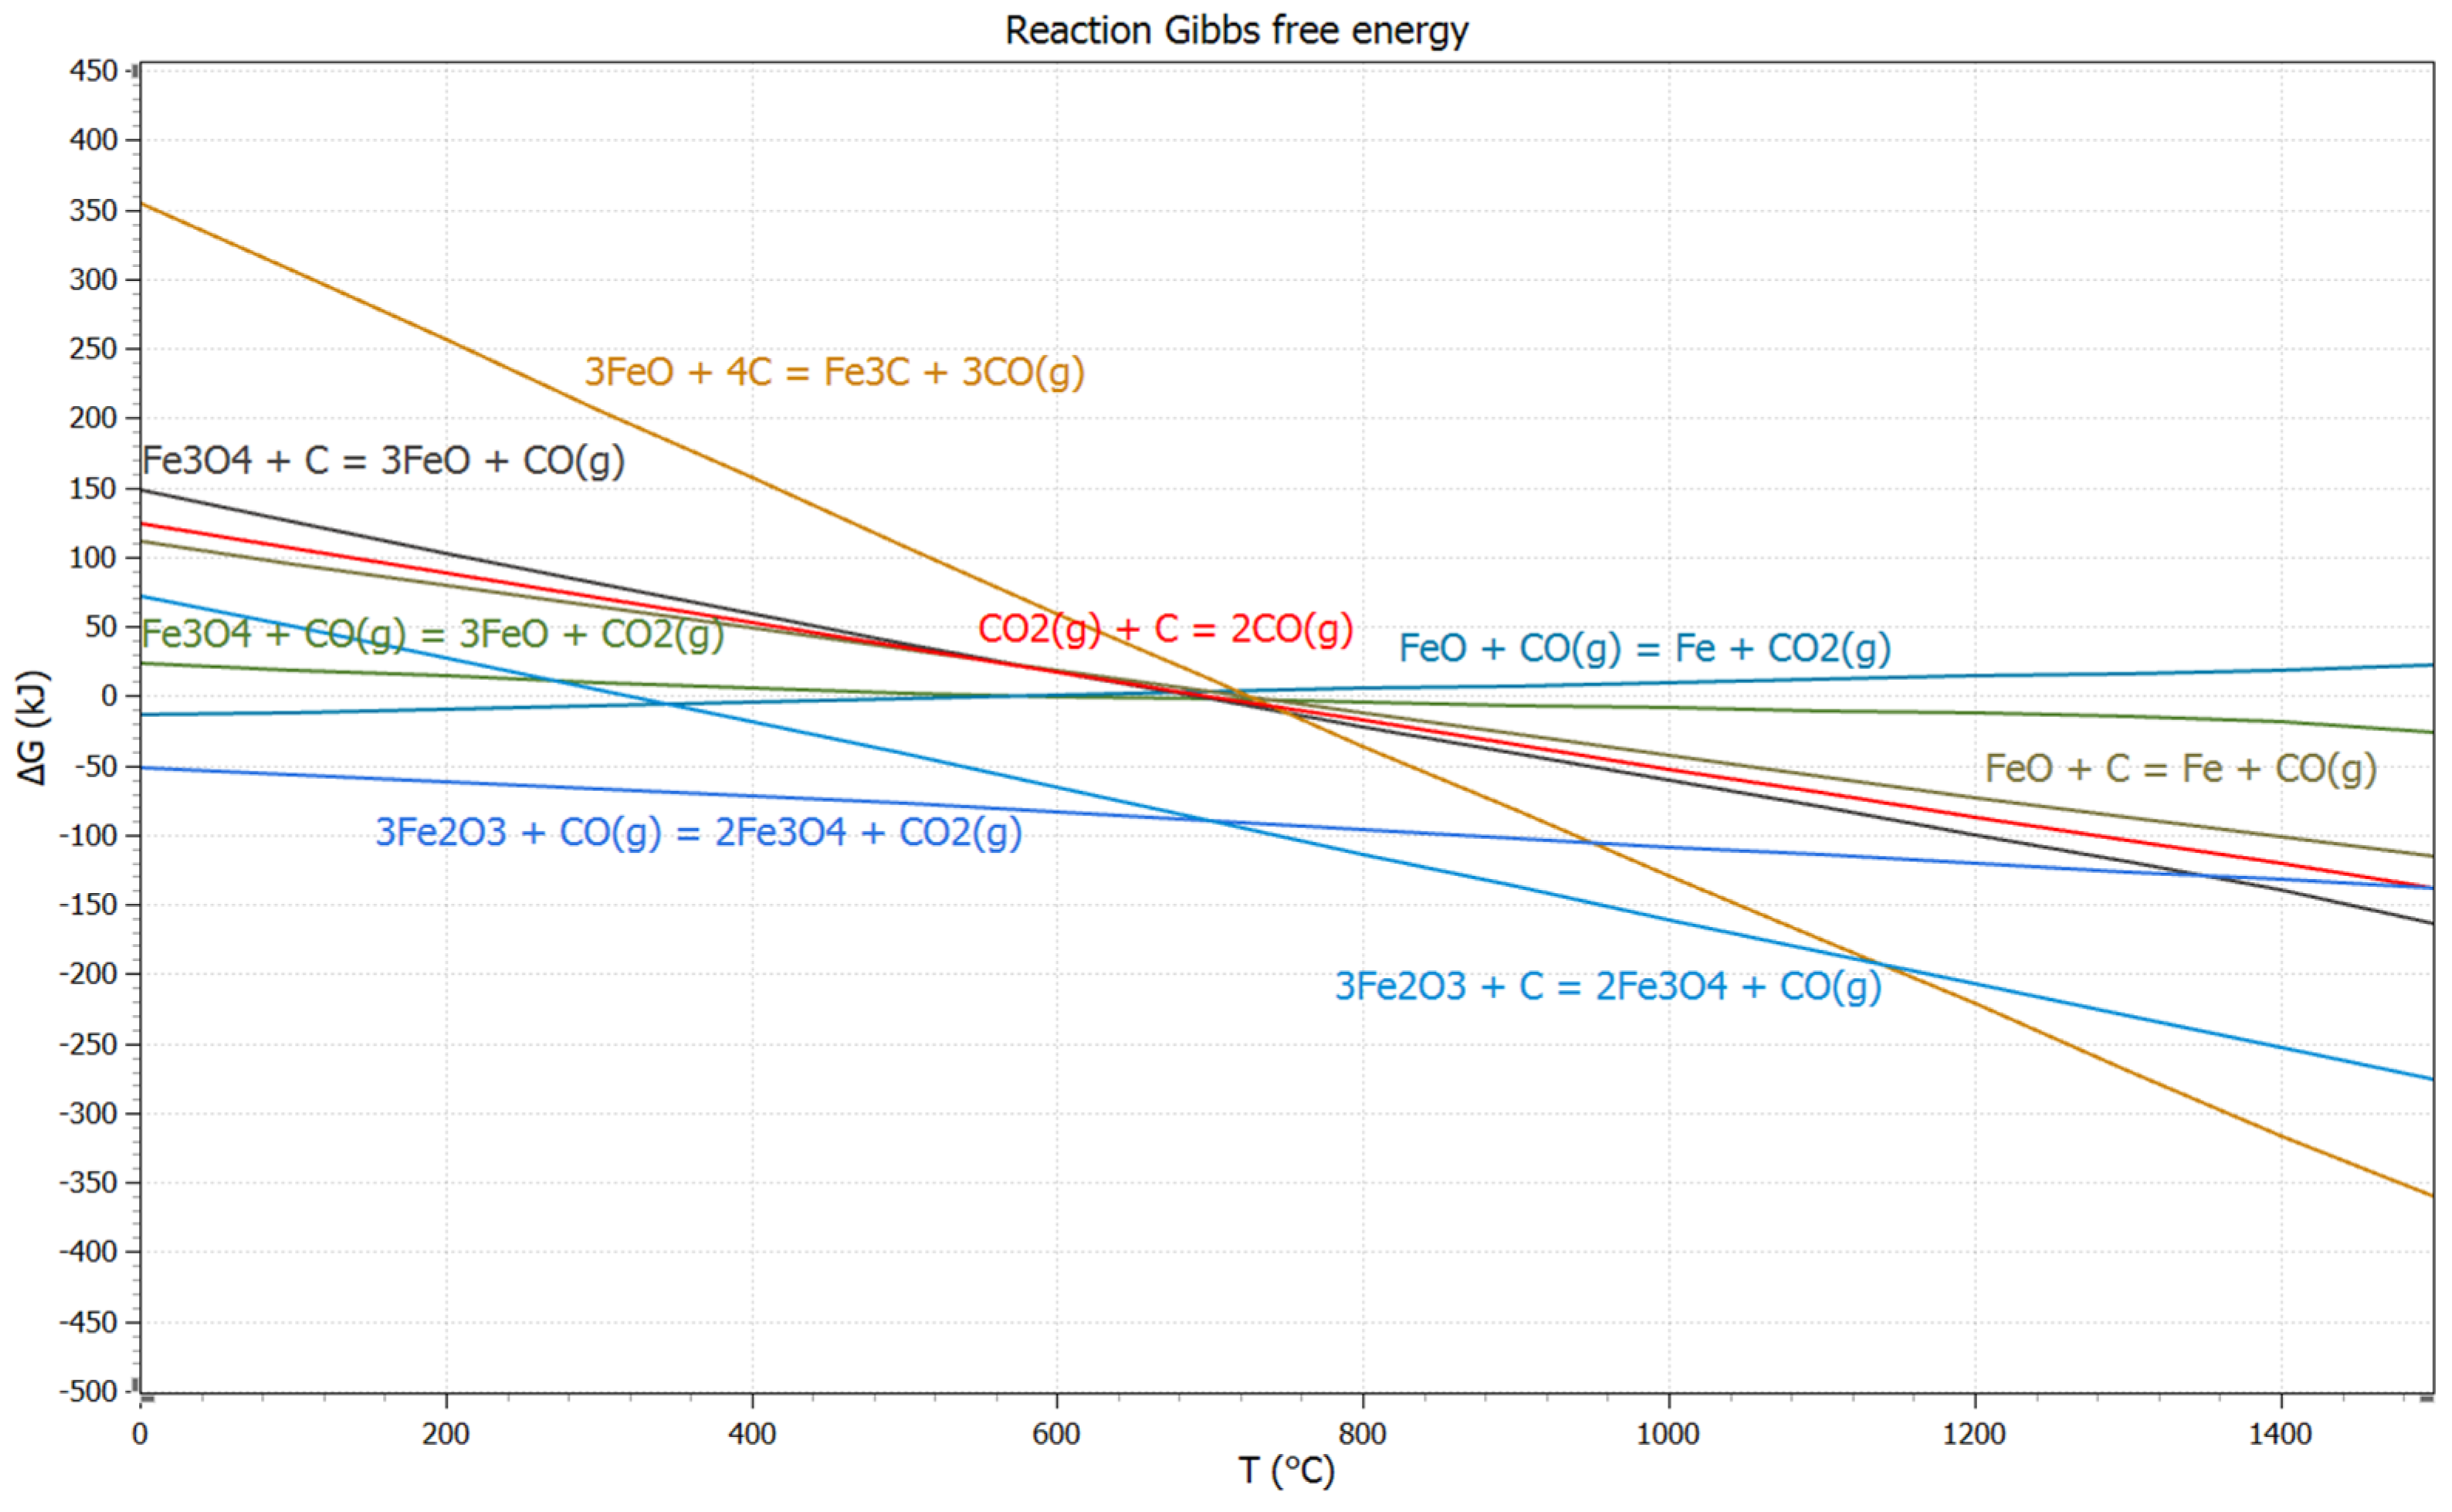
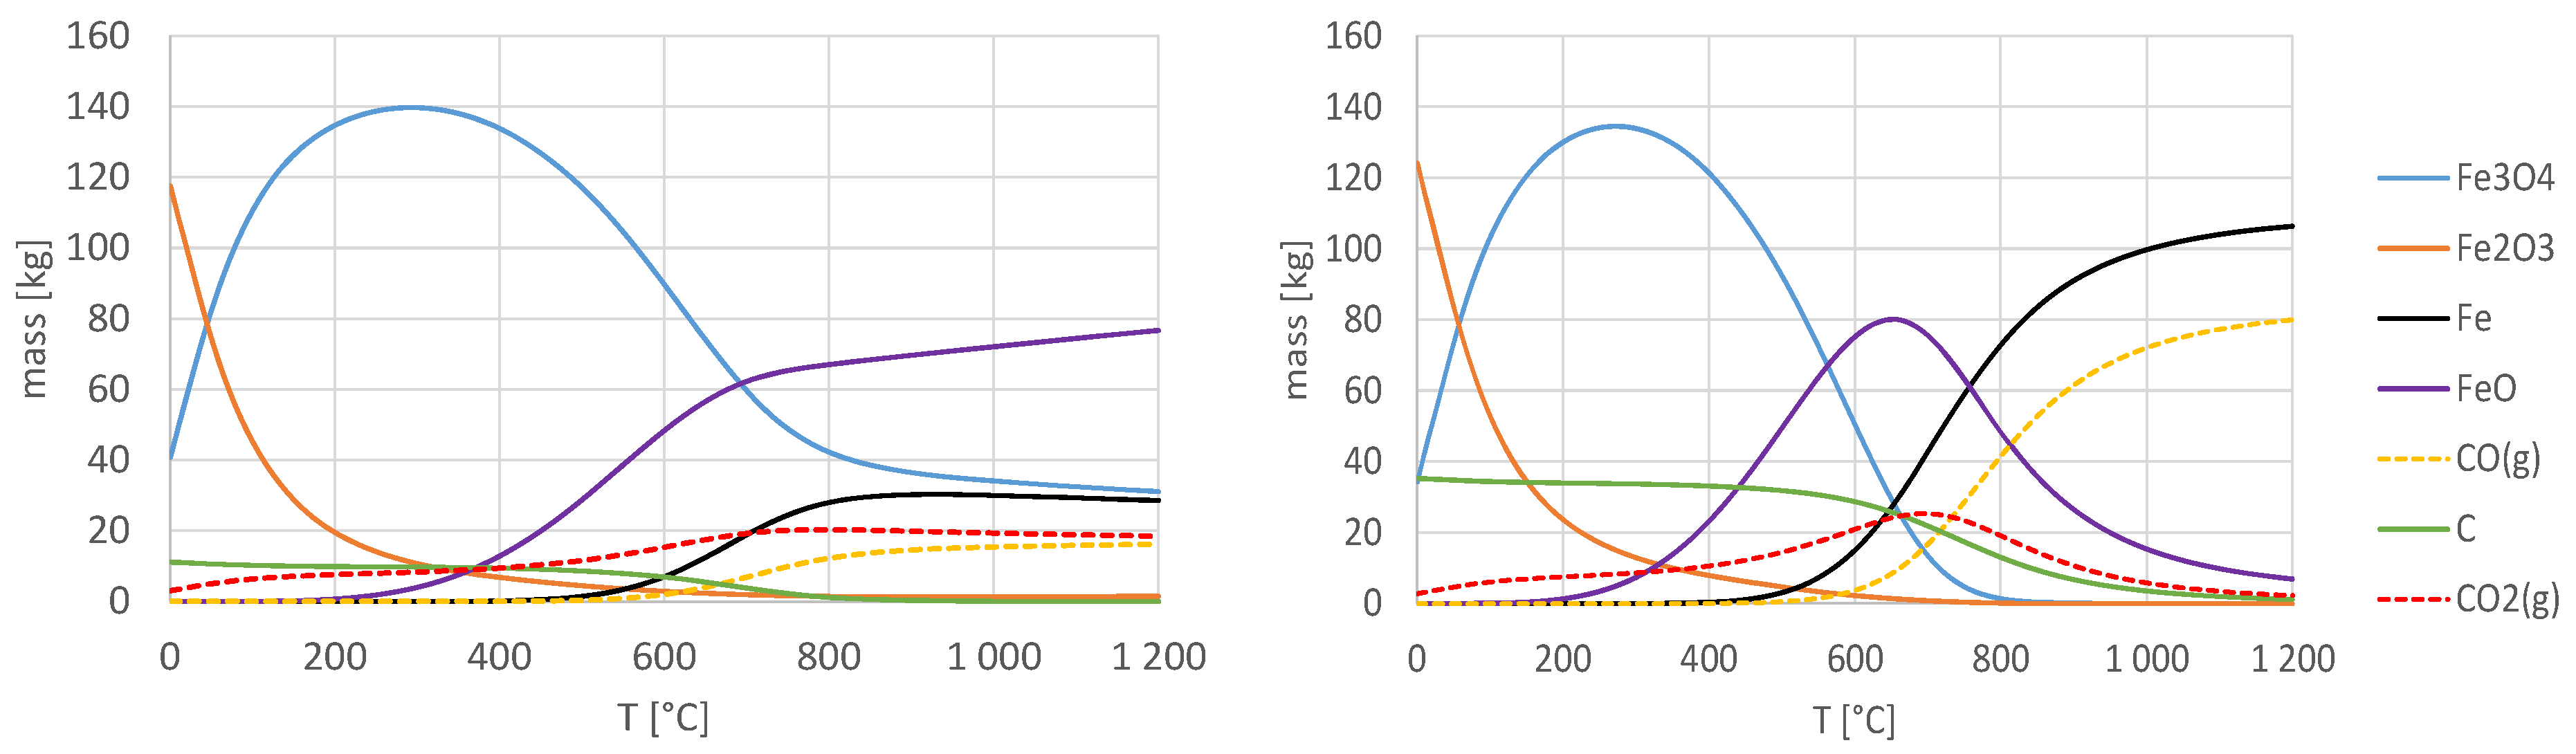
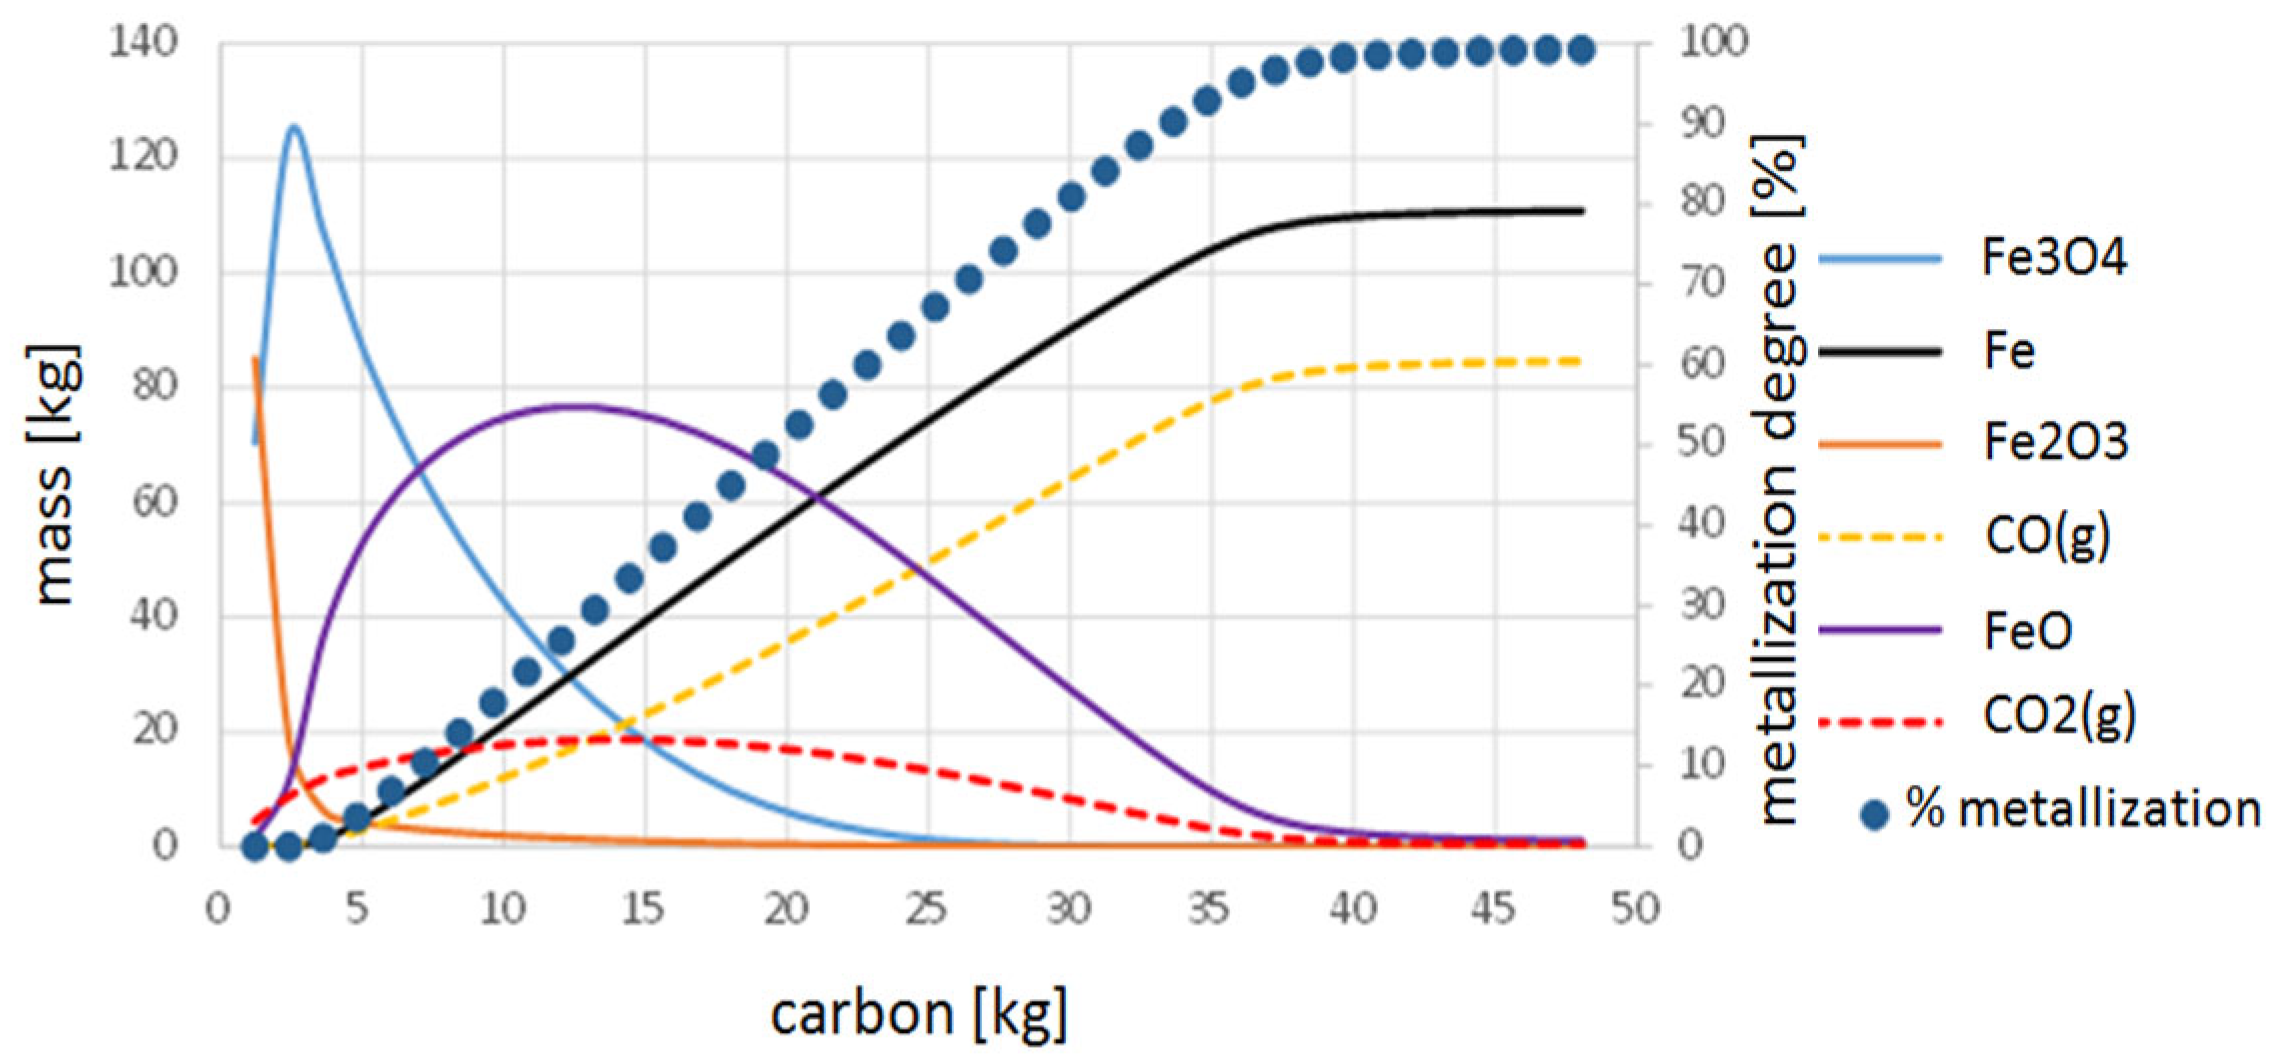
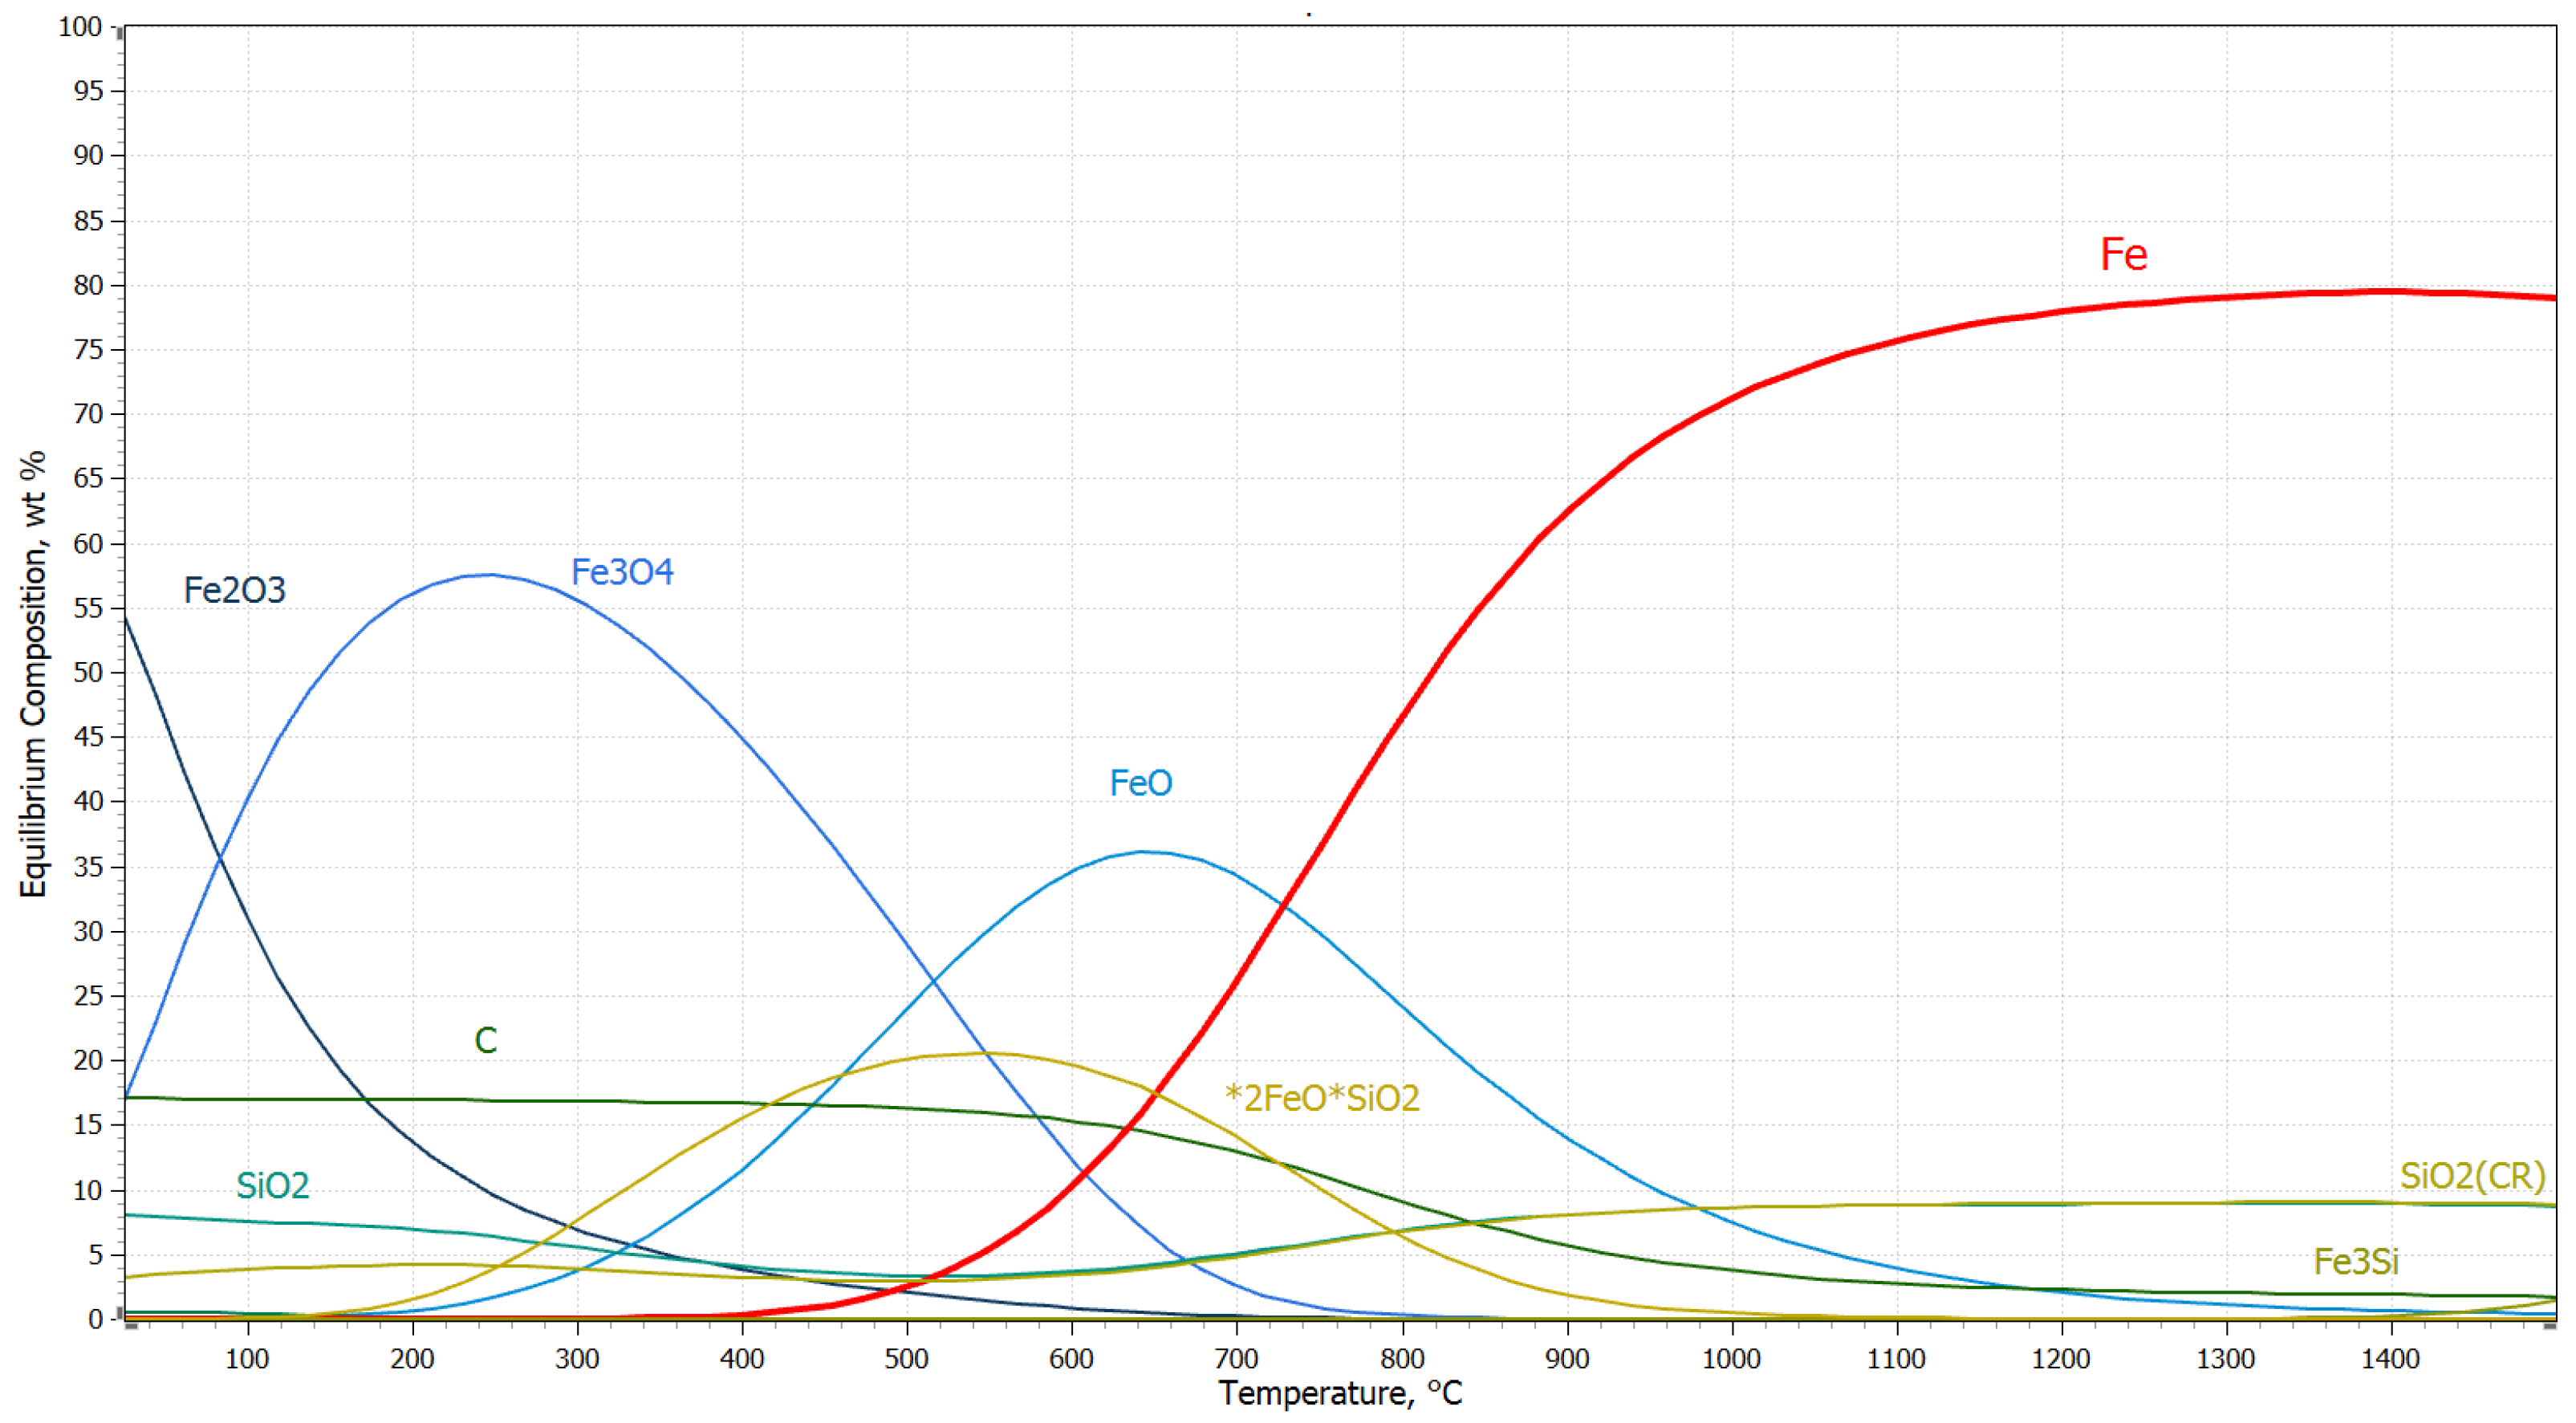
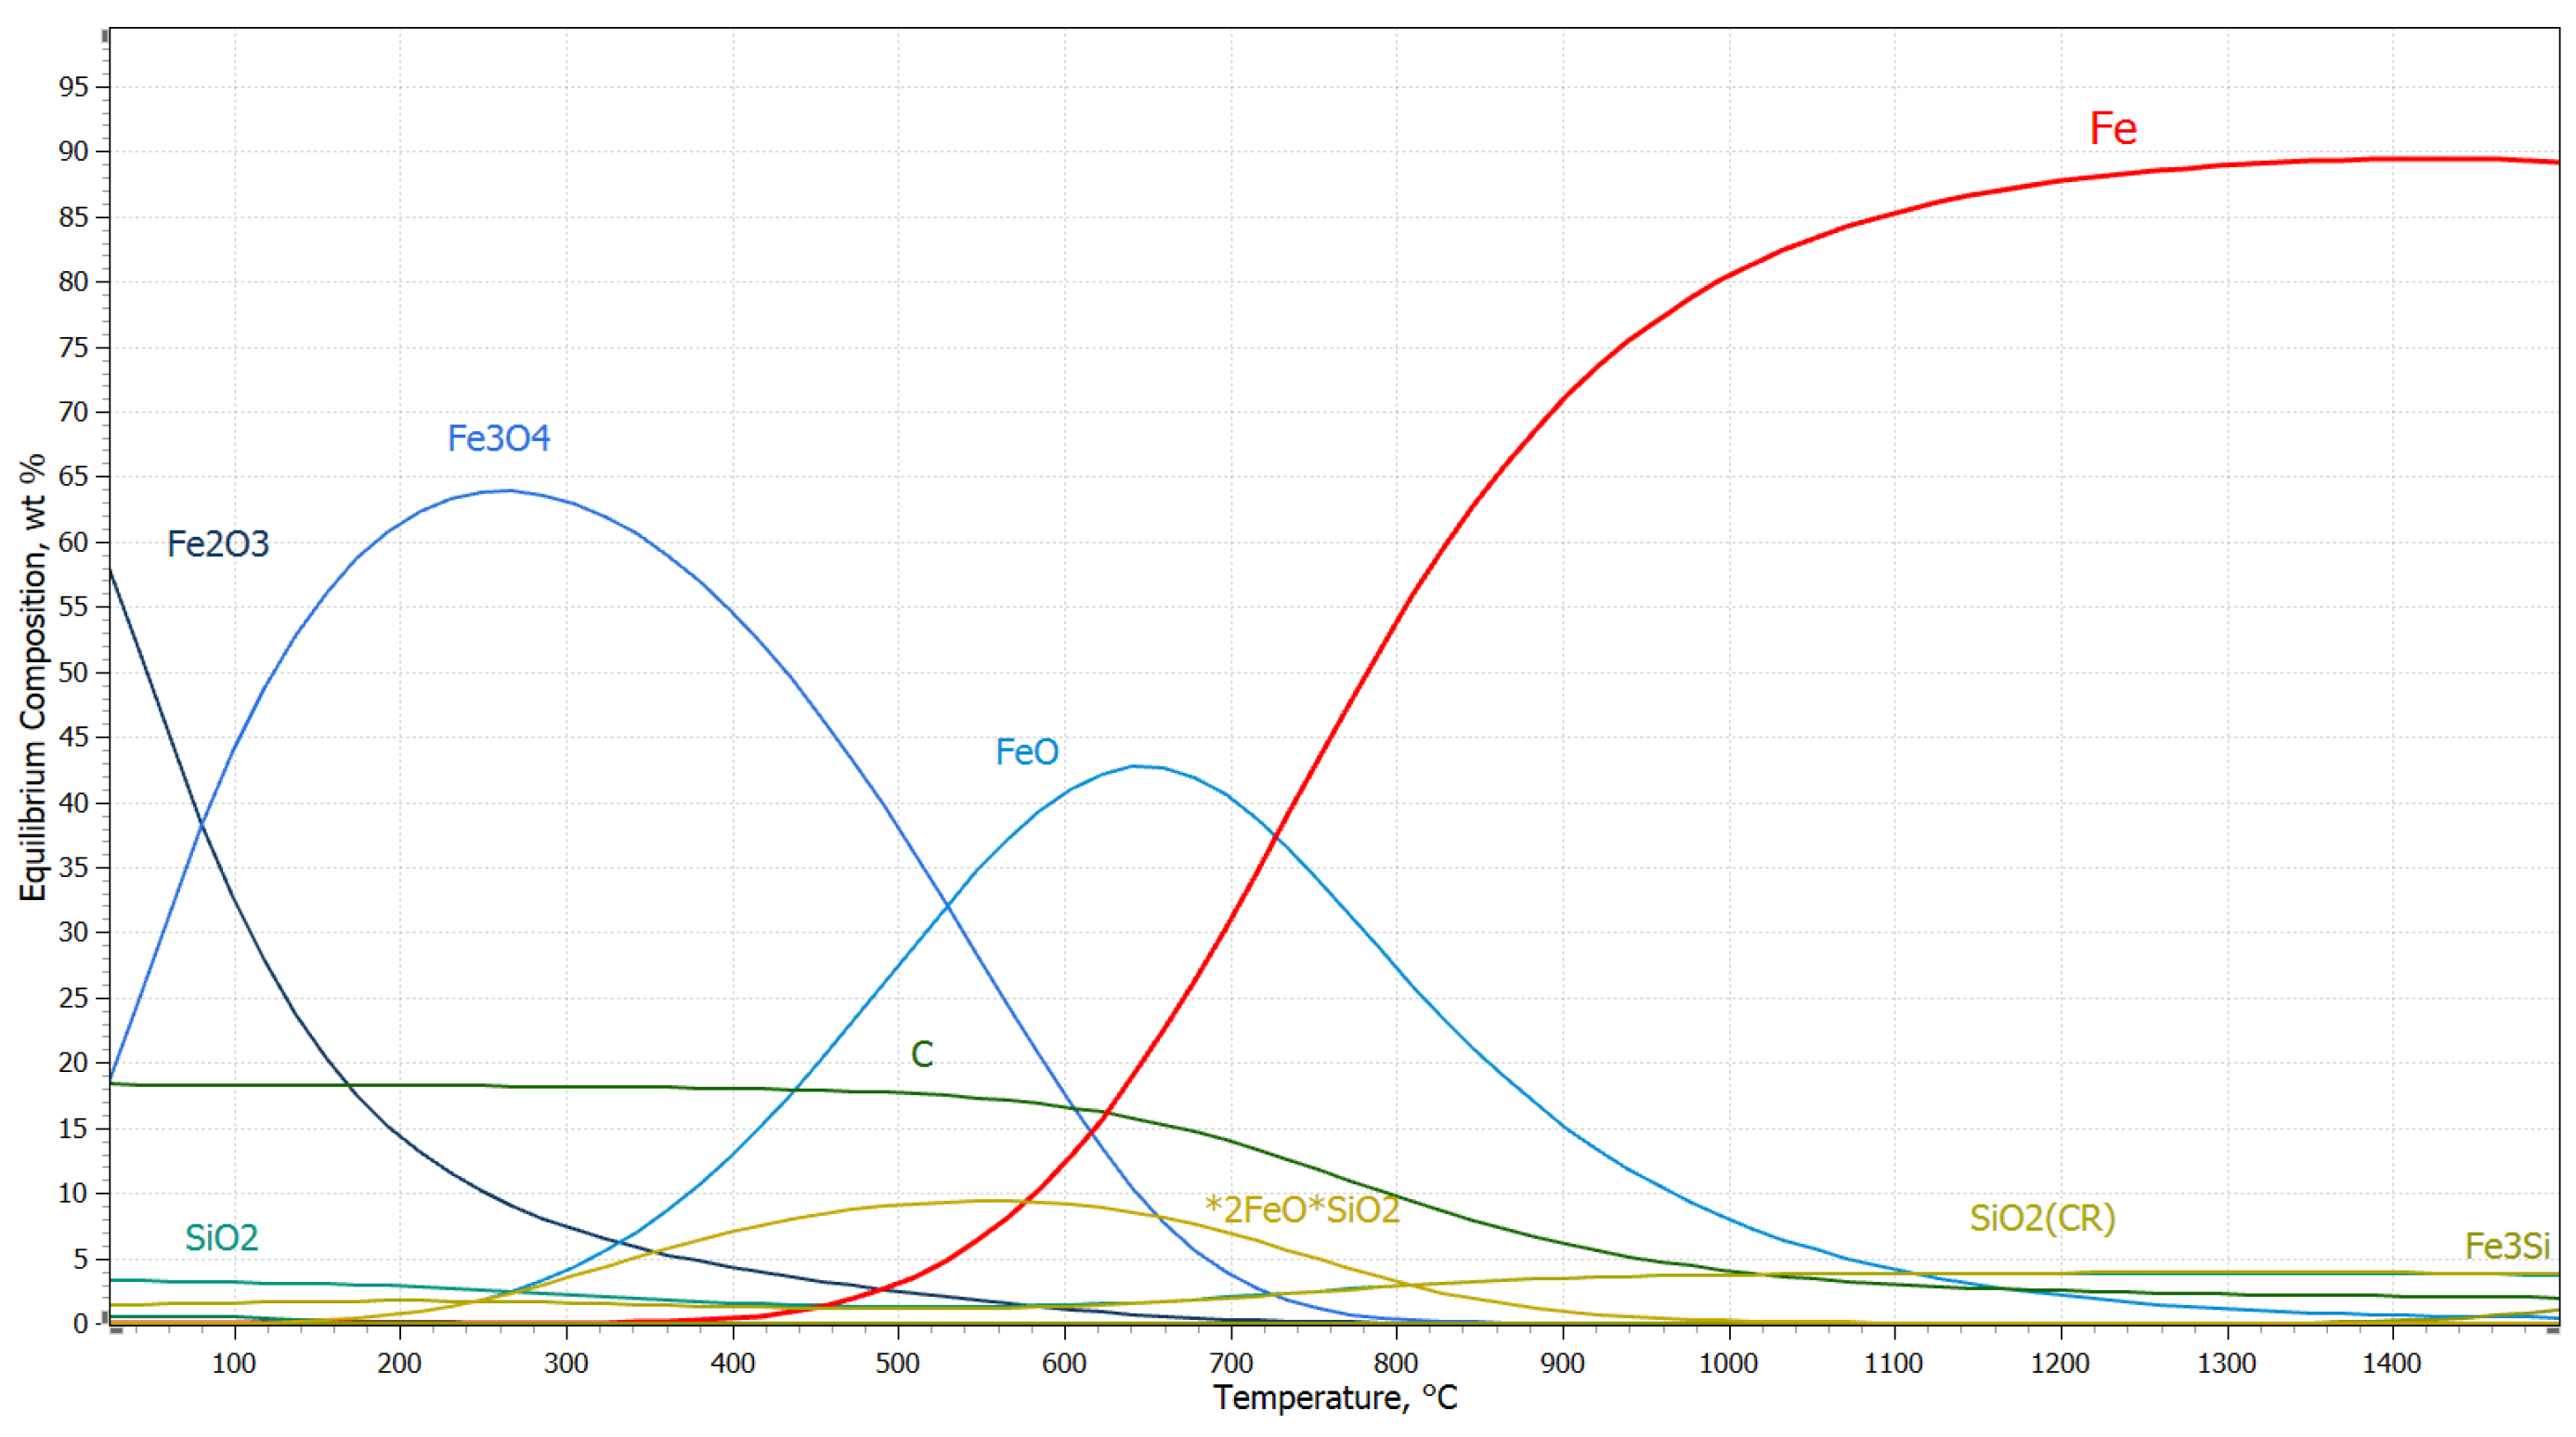
3.2. Thermodynamic Study

Thermodynamic modelling of conditions for the reduction of iron ore using a solid charcoal-based reducing agent was the subject of the subsequent research. The key objective was to create computer simulations of chemical reactions using the HSC Chemistry thermodynamics software [26]. Thermodynamic data were obtained from the software HSC Chemistry (HSC: H, enthalpy; S, entropy; C, heat capacity). HSC Chemistry offers powerful calculation methods for studying the effects of different variables on the chemical system at equilibrium. The aim is to obtain the simplest approach (using this software to calculate equilibrium) that allows one to predict the output parameters (amounts, chemistry, mineralogical composition, and total heat) based on the initial composition analysis. Thermochemical calculations are based on enthalpy (H), entropy (S), heat capacity (Cp), or Gibbs energy (G) values for chemical species. Thermodynamic simulations facilitated predicting the output parameters of direct reduction iron (DRI) products based on the baseline composition of the materials.
Reduction of iron oxides is one of the most important processes that takes place in reduction reactors (for example, Blast Furnace, Midrex, Corex, etc.). Reduction by carbon is referred to as direct reduction, while indirect reduction is the reduction by gases, for example, carbon monoxide. The stability of individual iron oxides, i.e., Fe2O3, Fe3O4, and FeO, is not identical. Out of all iron oxides, Fe2O3 exhibits the lowest stability. When heated to 1360–1370 °C, it undergoes thermal dissociation without the involvement of a reducing agent in the air, while intensive dissociation occurs at a temperature of approximately 1450 °C. The reduction process requires excessive amounts of reducing agents because the reactions of reduction of ferric oxide (Fe2O3) to ferrous oxide (FeO) and reduction of ferrous oxide (FeO) to iron (Fe) are reversible in certain conditions; this means that Fe and FeO easily oxidise in the CO2 environment. The reaction of reduction of Fe2O3 to Fe3O4 is irreversible; this means that excessive amounts of a reducing agent are not required, and ferric oxide does not oxidise in the CO2 atmosphere. Figure 1 shows the feasibility of individual reduction reactions, indicating that the production of iron by reduction using carbon is thermodynamically feasible at temperatures of ~700 °C. With an increasing temperature, the carbothermic reduction will be more effective with a higher degree of metallisation. In addition to iron produced by the reduction, a sequence of several reduction reactions results in the formation of carbides (e.g., Fe3C); at temperatures of ~800–1100 °C and in the presence of silica, hematite may reduce to ferrosilicon.
A step that was necessary in order to perform high-temperature experiments with the analysed commodity was, in addition to identifying its chemical and mineralogical composition, to perform a thermodynamic analysis and define reduction conditions. Those tasks were based on the results obtained by analyses of ores and on a known reducing agent. In our research, we used high-quality charcoal. The effects of a temperature on the reduction process at two predicted levels of carbon consumption per 1 mole of Fe2O3 indicated that it was necessary to use the highest amount of the reducing agent in order to achieve a high degree of metallisation (Figure 2 and Figure 3). With an insufficient amount of the carbon reducing agent, the system contains a high amount of FeO, whereas with an excessive amount of the reducing agent, the quantity of carbides (e.g., Fe3C) increases. Apparently, a temperature of 1200 °C is sufficient to achieve high degrees of metallisation. An optimal content of a carbon reducing agent should be approximately 35–40%. A real mineralogical composition of the ore and a real composition of a reducing agent (e.g., volatile components and ash) will affect the course of the desired metallisation.

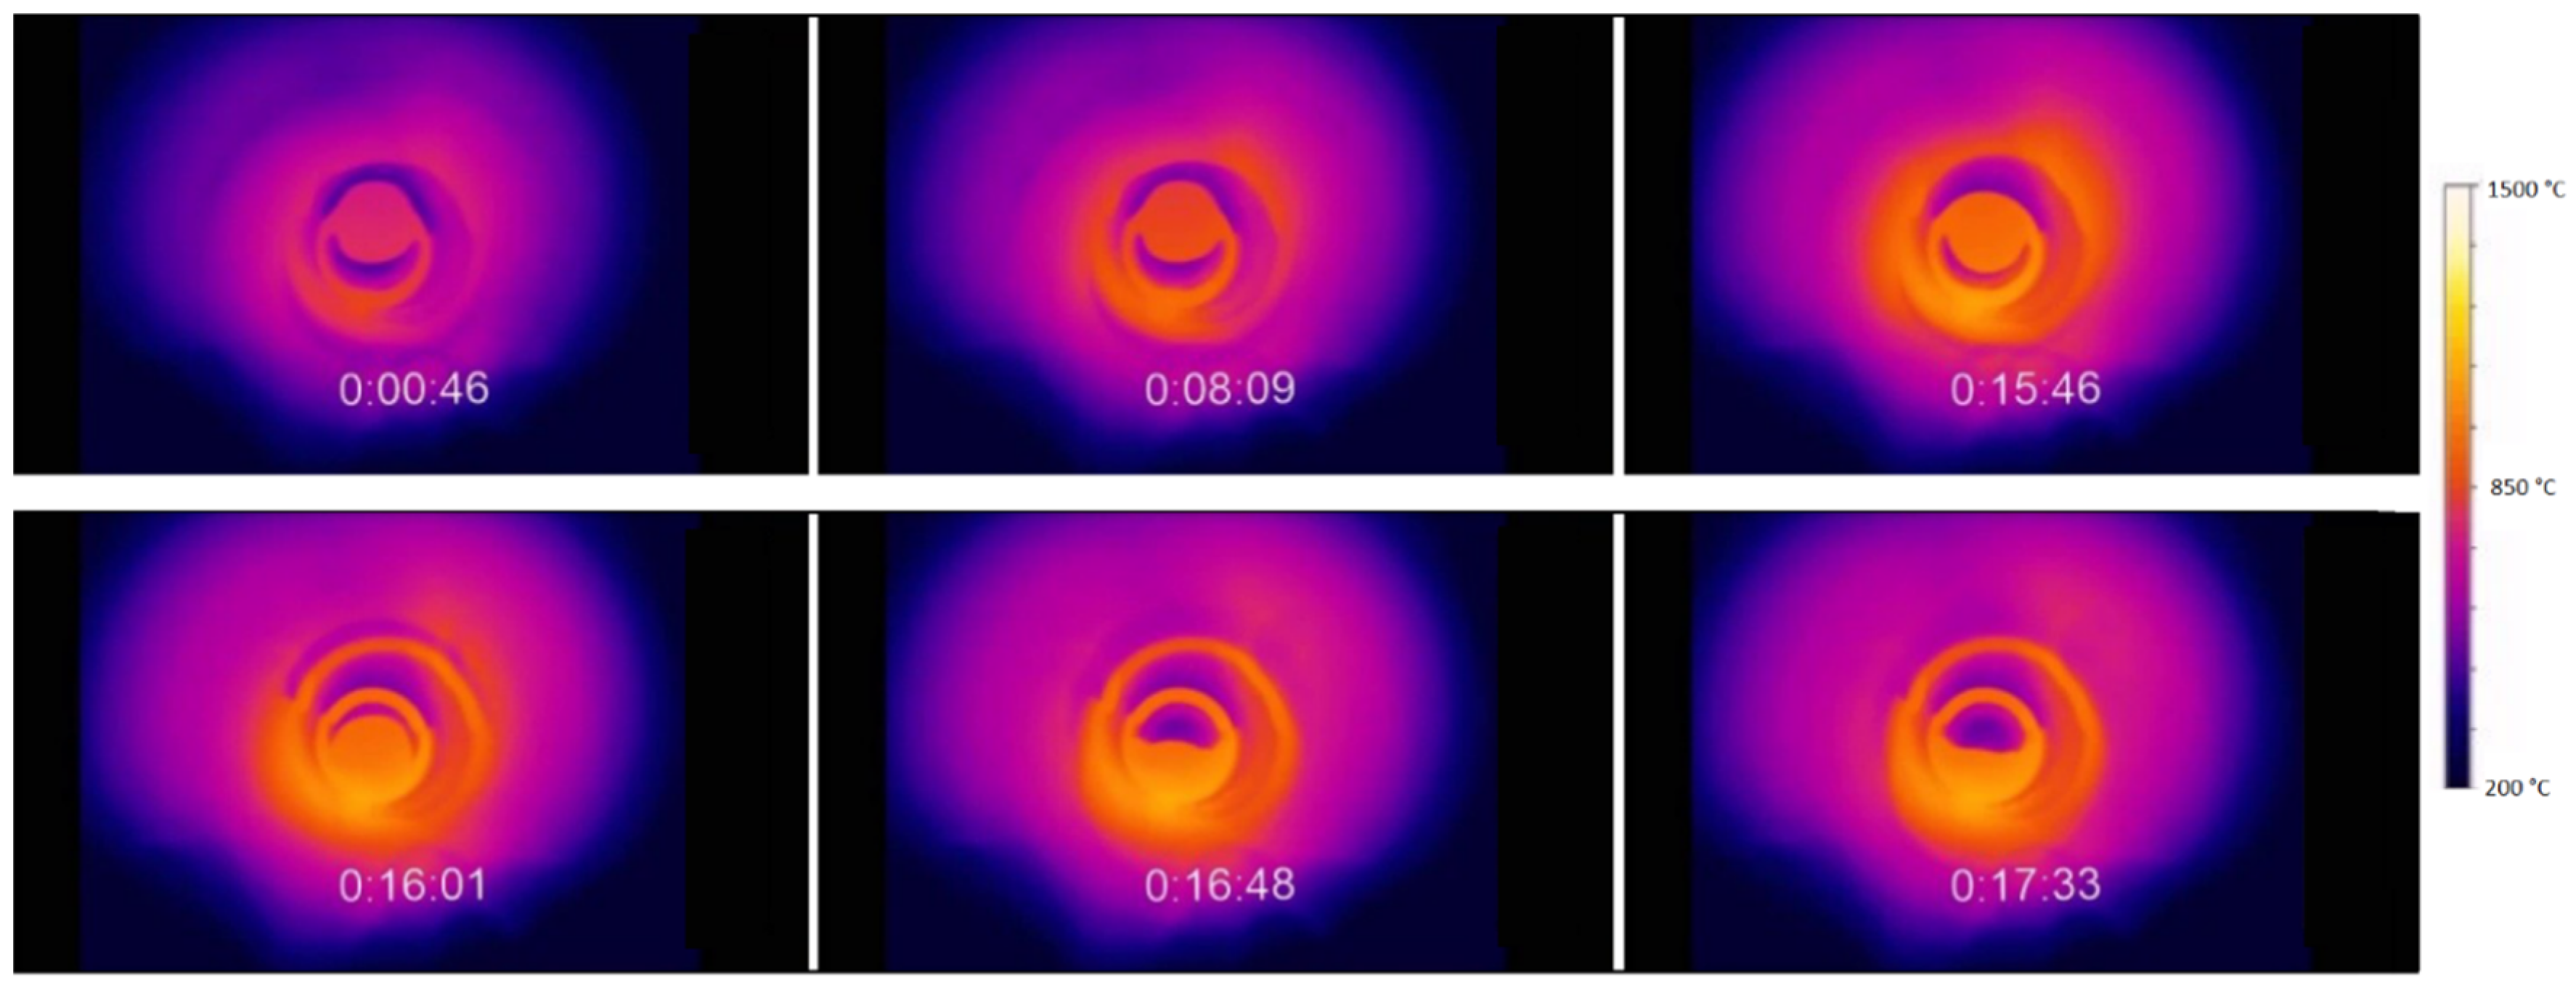
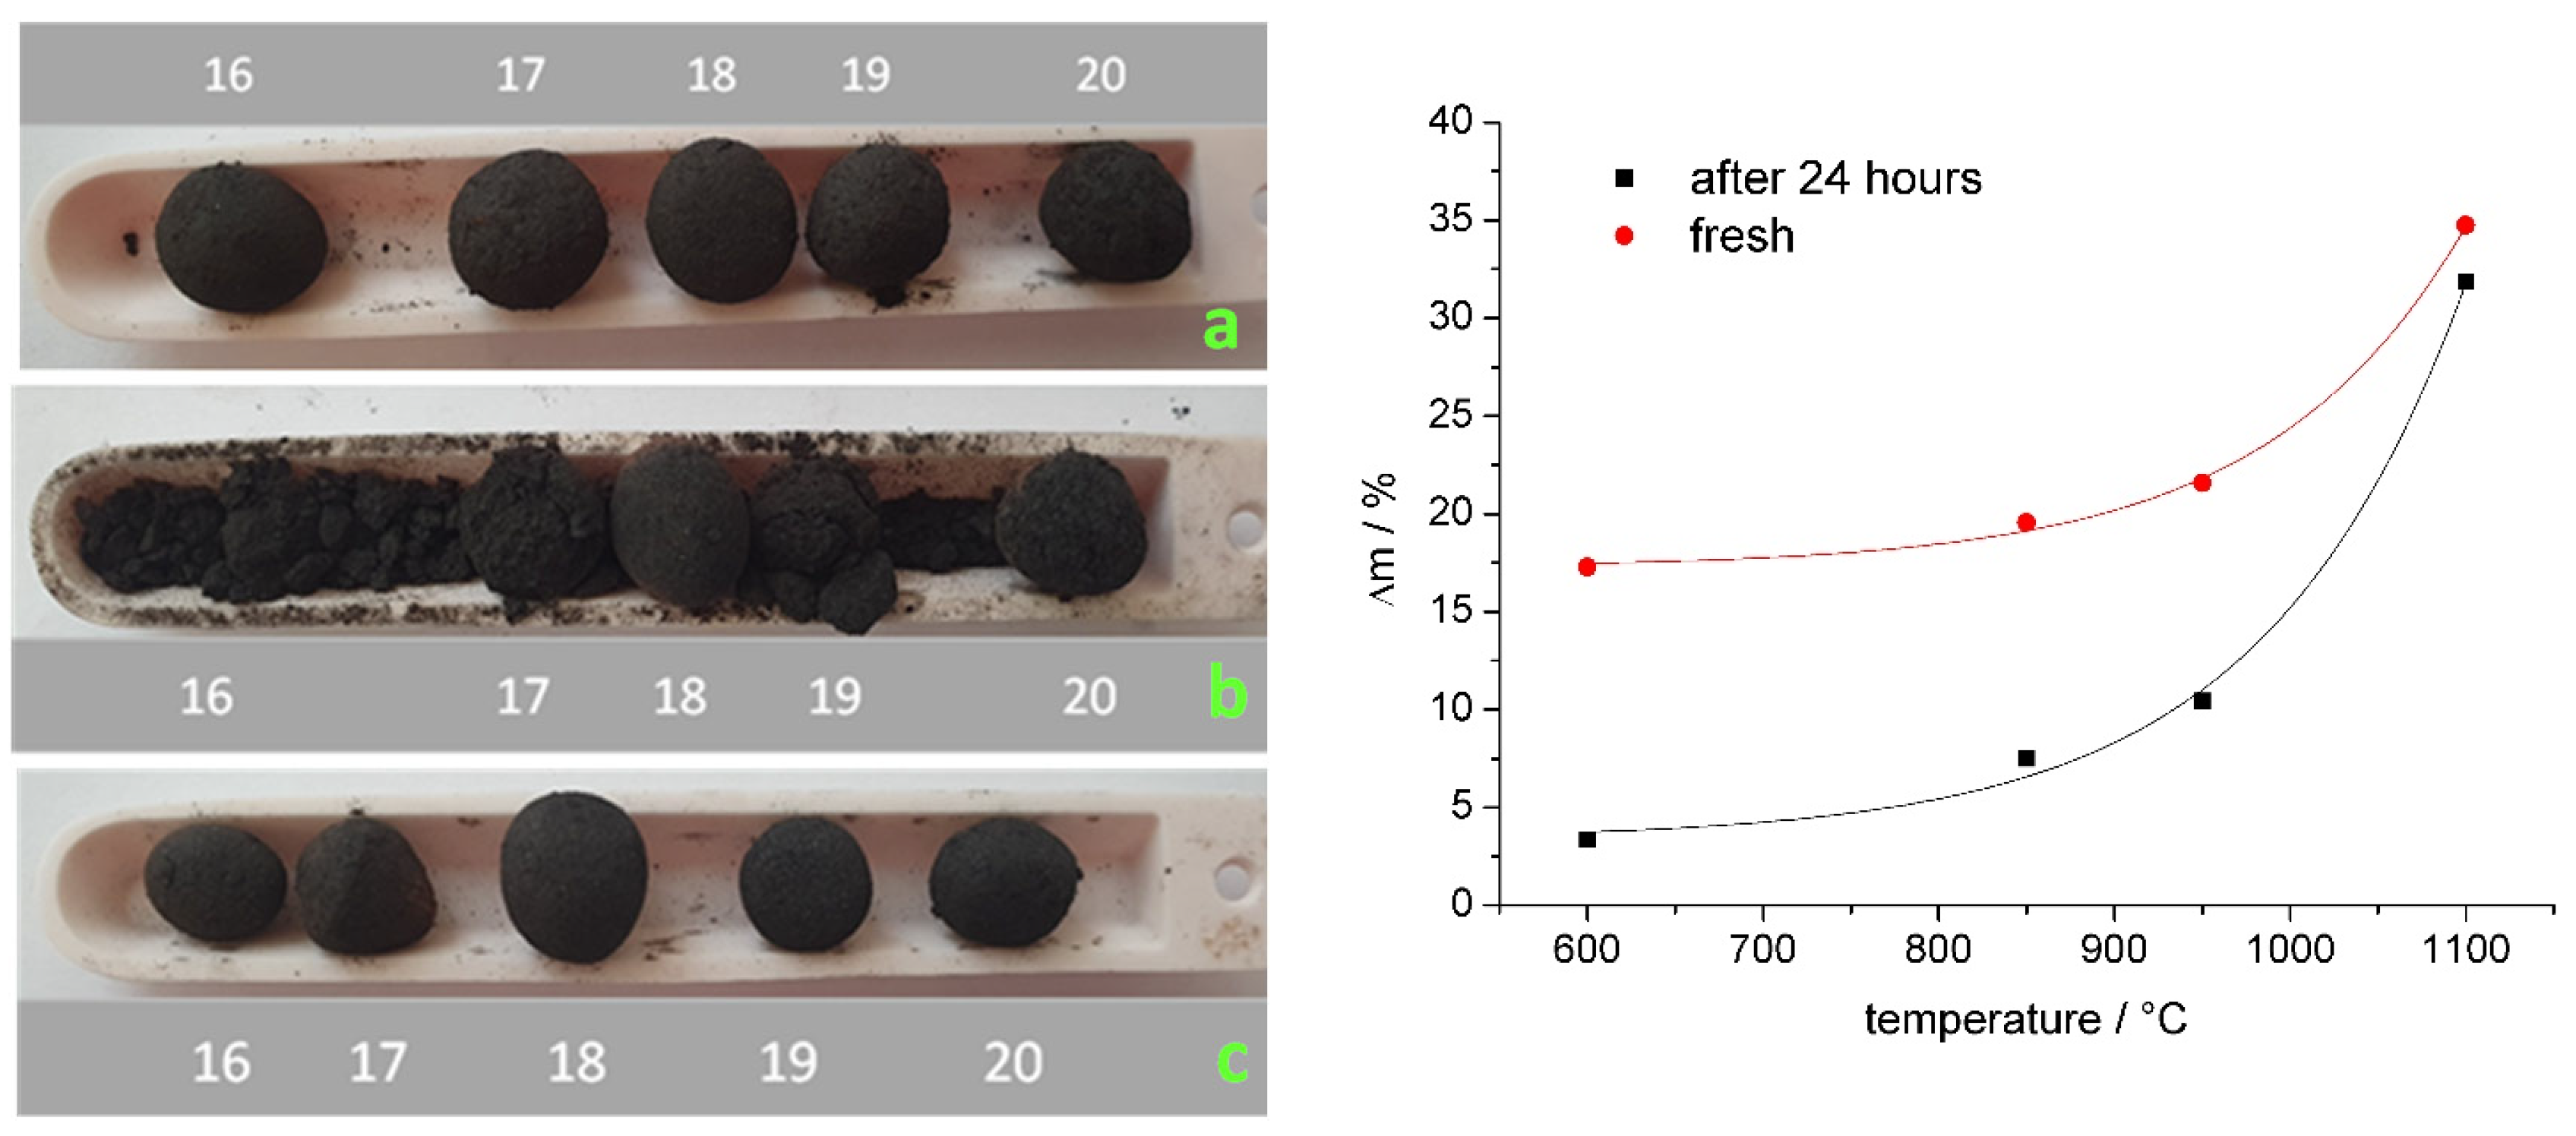
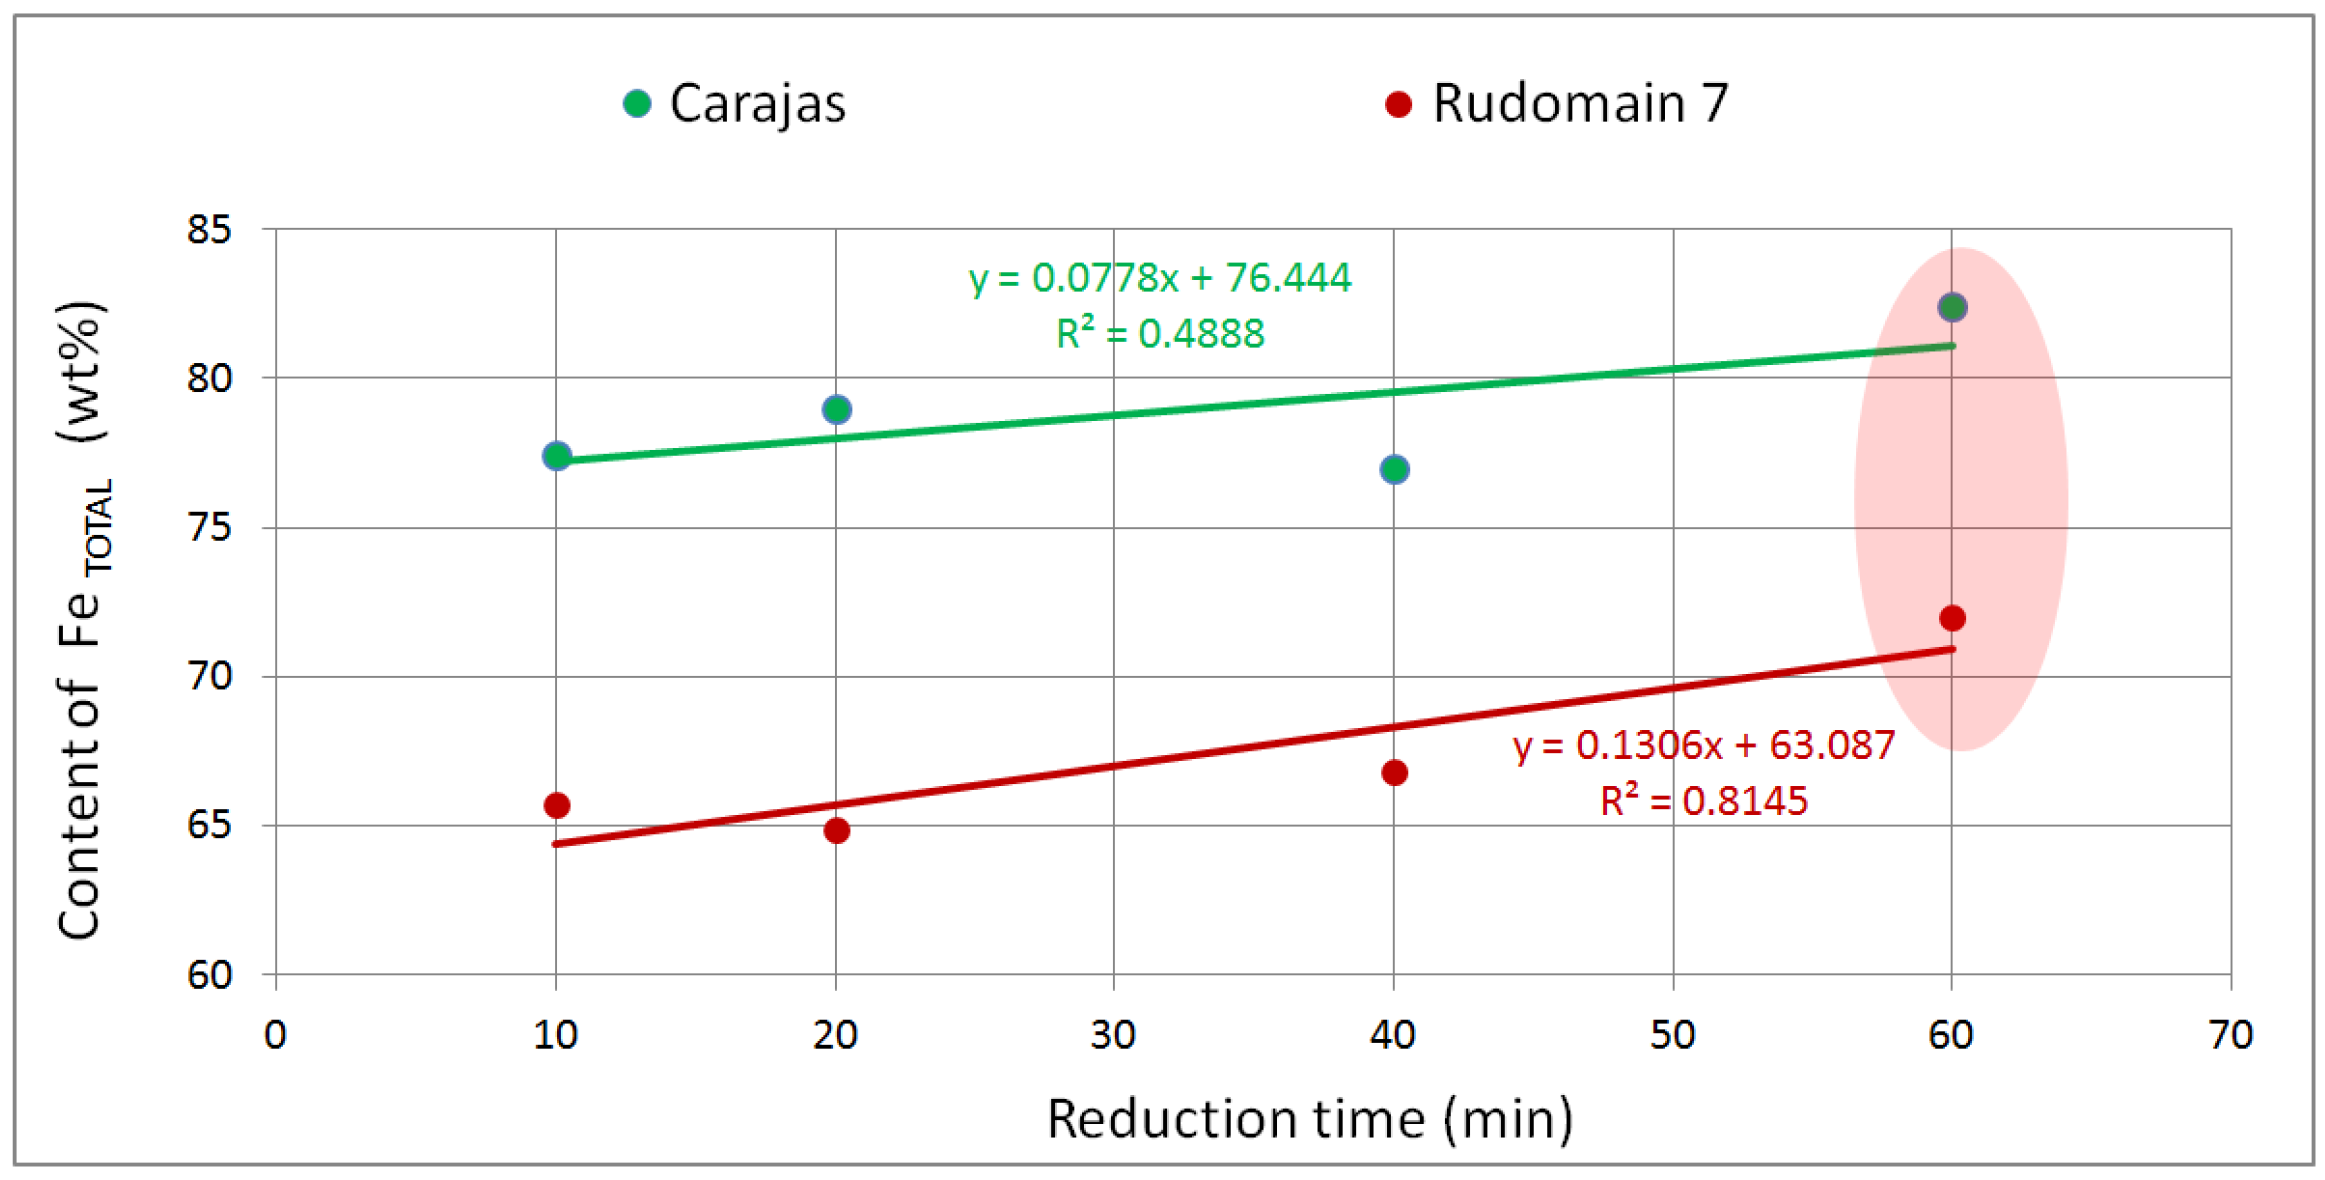
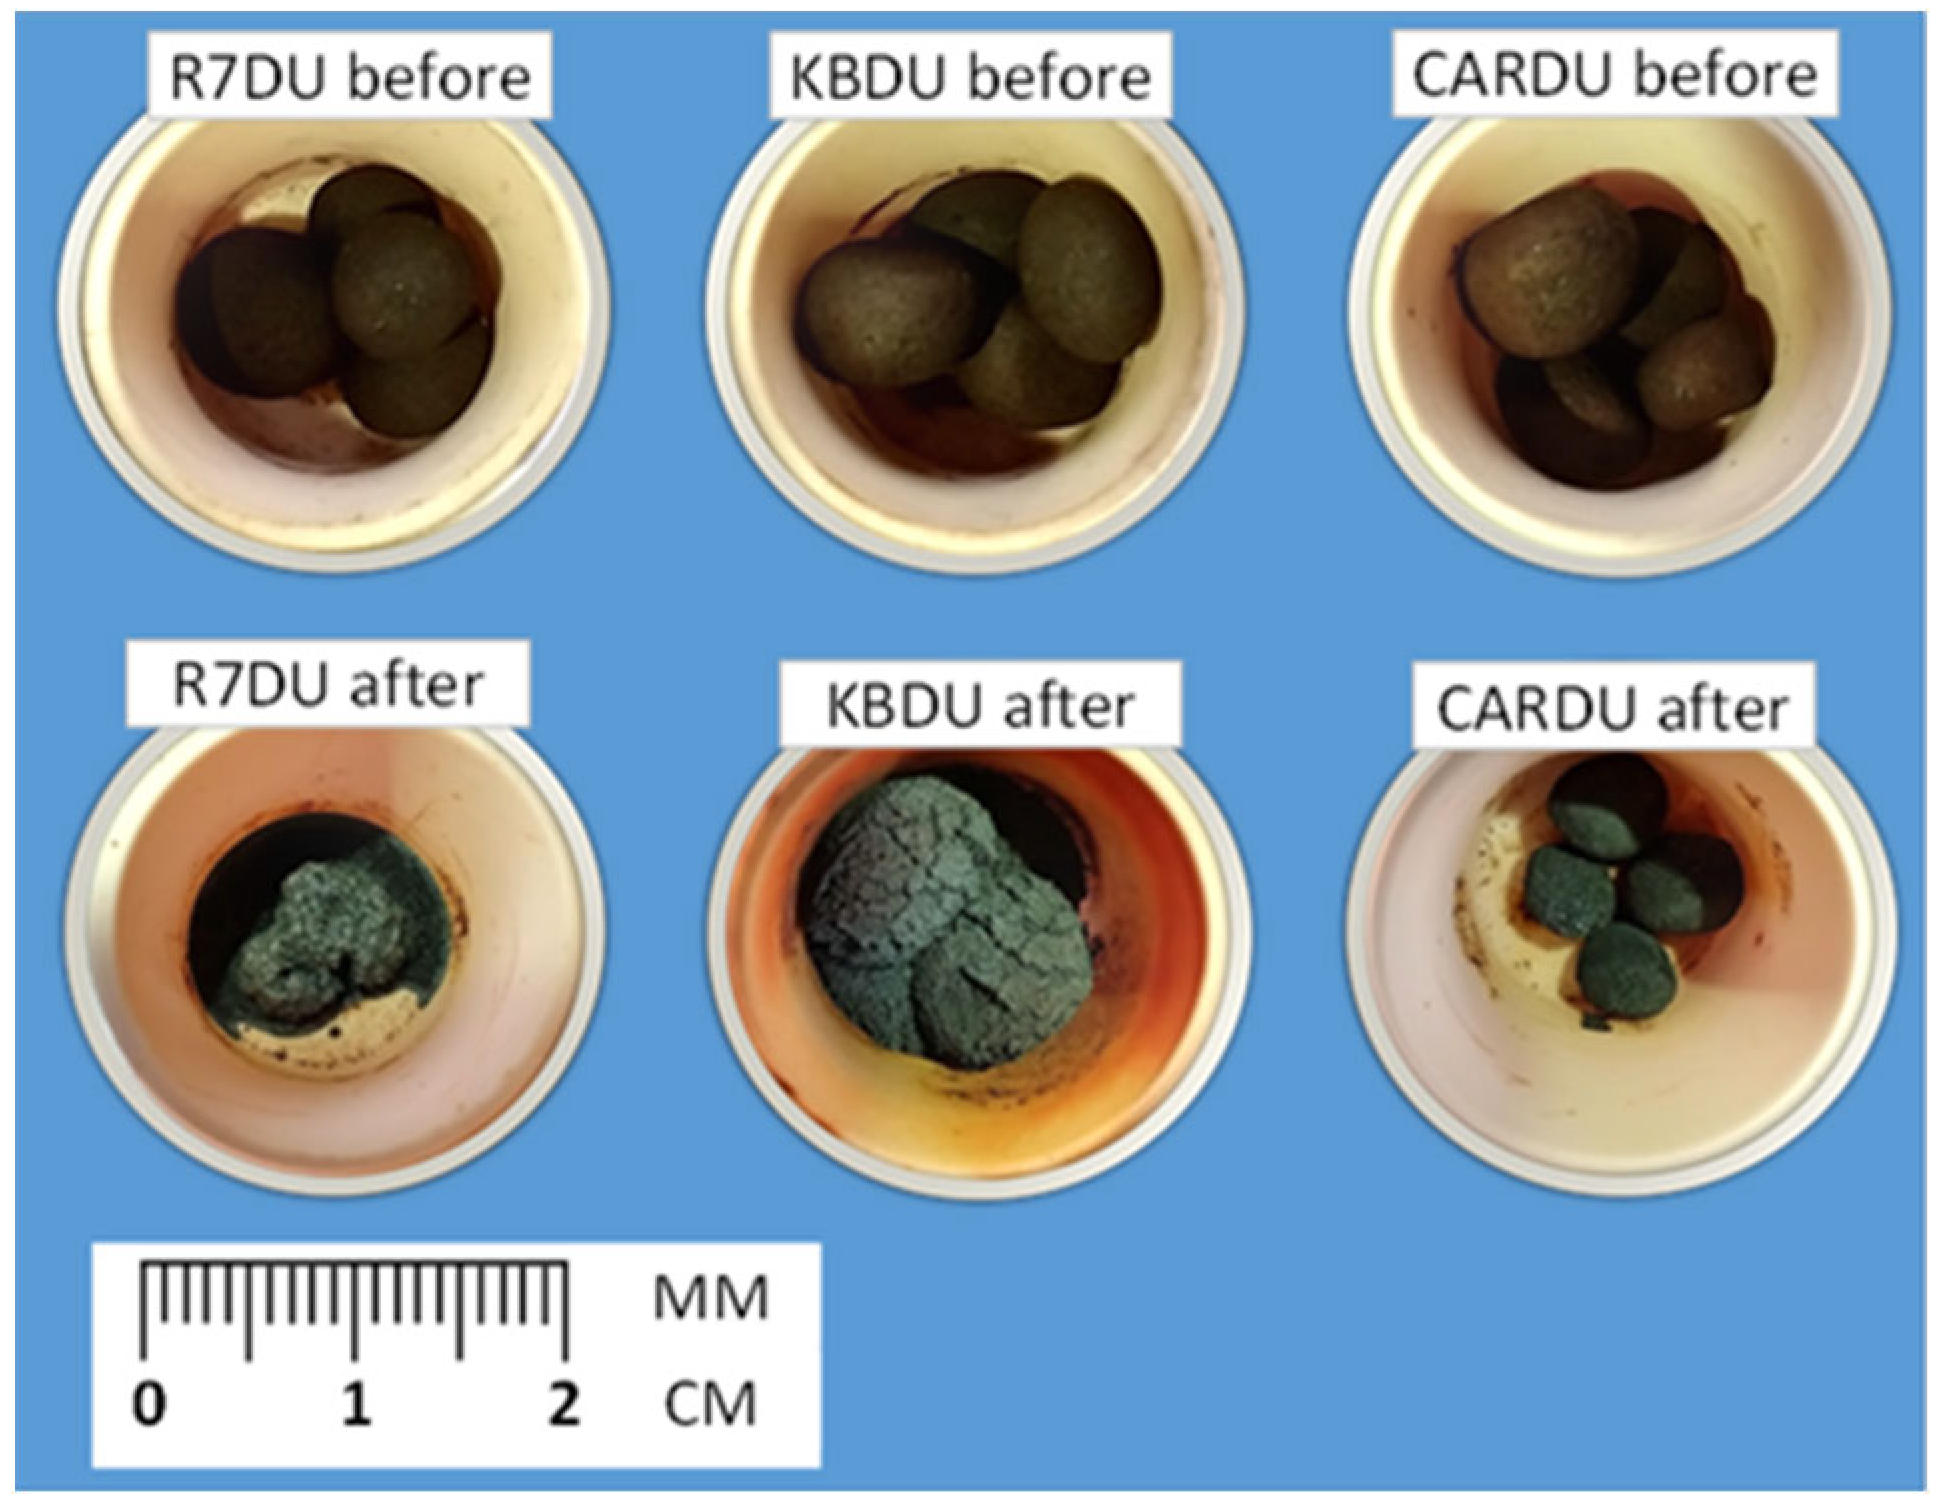
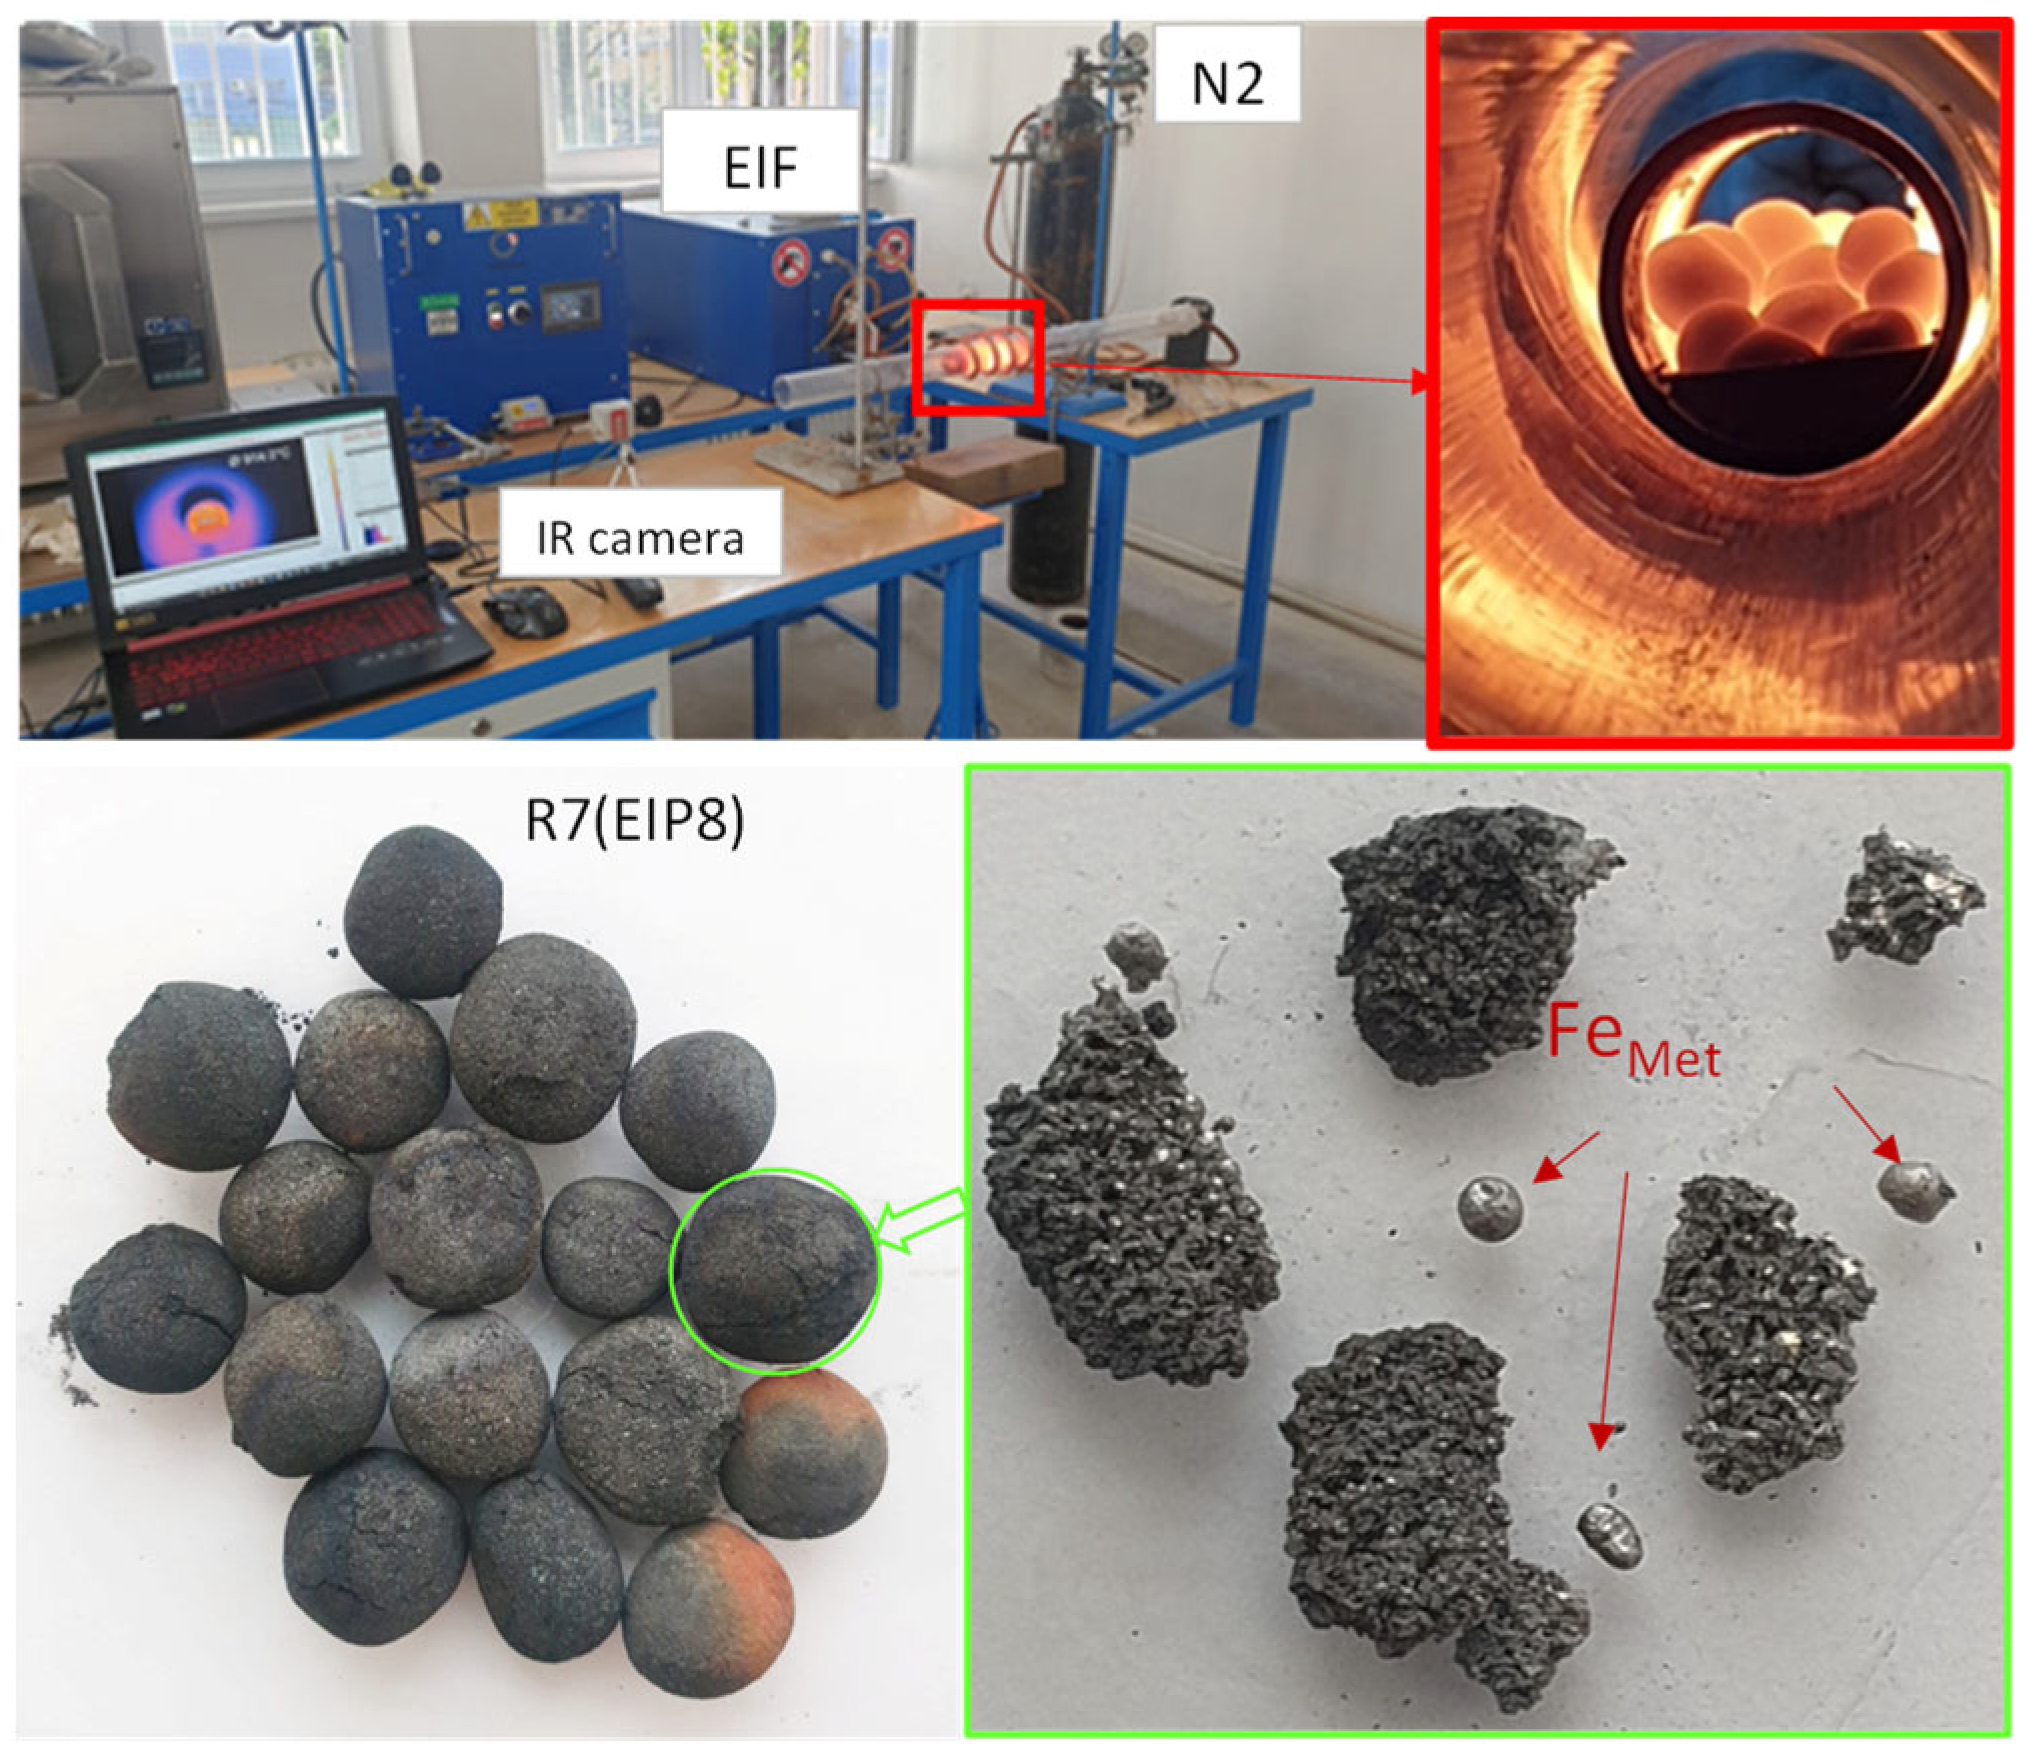
3.3. High-Temperature Experiments

Based on the results of thermodynamic modelling, a composition of a mixture to be used for the production of raw pellets was designed. The mixture consisted of individual iron ores and high-quality charcoal at a mass ratio of 4:1. The individual components of the mixture were ground to a maximum grain size of 0.150 mm, and then, they were homogenised by layering and stirring. The resulting mixture was used to produce raw pellets sized ~8–15 mm using water as an additive (~12–20 g per mixture).
Subsequently, a sample of Rudomain iron ore was subjected to tests of thermal stability in the process of oxidation and reduction in an electric resistance furnace with the use of IR thermography scanning with a high-temperature camera (TIM, Micro-Epsilon, Ortenburg, Germany). The recorded stability of the raw pellet within the interval of reduction temperatures was used to identify the maximum temperature of reduction tests in the solid state (Figure 4).
The video recording showed a real-time process of softening and melting of the sample and the continuing reduction of the melt by solid carbon. The observations indicated that the pellet was stable up to a temperature of 1200 °C and that the IR technology may be used as an optimal auxiliary tool to support research into high-temperature testing.
Based on the aforementioned results, the Rudomain sample was subjected to thermal stress in the mode of linear heating up to 1200 °C in the air atmosphere (RUD0); another analysed sample was a mixture of Rudomain iron ore and a solid reducing agent (coke) in a ratio of 5:1 (RUD1) in the combined conditions of nitrogen atmosphere during the linear heating up to 1200 °C, while in the second phase, it was in the CO2 atmosphere at the isothermal holding at the given temperature for the period of ~60 min. Coke (83% carbon; 12% ash; 5% volatile combustible substance) was selected as a reducing agent to be used in a TGA analysis only. The solid green line shows the mass loss, and the dashed green and blue lines show the increase in temperature. The TG curve (Figure 5) for the iron ore in the given conditions confirmed its thermal stability at temperatures of up to 1200 °C. The ore+reducing agent sample exhibited a two-step mass loss during the linear heating process. The first step corresponded to the moisture in the preparation of the sample mixture, while the second step of decomposition was associated with the maximum values of DTG at 663 °C and 1136 °C, which steadily continued after the atmosphere changed. A mass loss of ~5% corresponded to releasing a residual amount of the volatile combustible substance of coke (still in the N2 atmosphere stage) and steadily continued, with higher intensity, in the CO2 atmosphere also. The CO2 present above the sample in this temperature interval reacted with the carbon reducing agent to form the reduction component CO. The mass loss of the mixture sample, caused by degradation of the carbon-based fuel as well as the reduction of iron ore oxides, corresponded to the phase of isotheral heating. The last phase of ~3% mass gain is probably related to the potential oxidisation of the reduced portion of iron with CO2.
The testing of stability of pellets containing Rudomain and a solid charcoal reducing agent (R7DU) in a thermal shock was carried out with fresh and non-fresh (left in the air for 24 h) samples at 4 different temperatures (600 °C; 850 °C; 950 °C; 1100 °C) and a holding time of 10 min. At temperatures below 850 °C, the pellets exhibited thermal stability and remained undisturbed from the macroscopic point of view. Non-fresh pellets exhibited higher shock resistance than fresh pellets since at 950 °C, they exhibited only cracks without further degradation. At a temperature of 950 °C, fresh pellets partially disintegrated (Figure 6). In the right section, the figure shows the differences in the mass loss of pellets following a thermal shock relative to a temperature.
The effects of temperatures on a mass loss exhibited a similar trend, while more significant losses were obviously observed with fresh pellets compared to non-fresh pellets, which had lower baseline moisture due to ripening and later hardened due to the formation of the so-called mortar bridges. The difference in the moisture caused by leaving pellets in the air for a certain time was approximately 12 wt%. In the interval of maximum thermal shock temperatures, the mass loss amounted to 32–35 wt%; this might have been caused by the more intensive kinetics of reduction processes.
The high-temperature reduction of iron ores was carried out in two stages. The first stage comprised experiments conducted in a Marsh resistance furnace and in a chamber resistance furnace, followed by experiments in an electric induction furnace. During the experiments in the resistance furnace, a correlation between the changes in the mass and the changes in FeTOTAL content in the samples of metallised pellets was examined. A mass loss of Krivbas amounted to 22–42 wt%; for Rudomain, it was 34–48 wt%; and for Carajas, the total loss ranged in the interval from 38 to 43 wt%. The results of the identification of effects of reduction time on a FeTOTAL content and ΔFeTOTAL in the samples of metallised pellets revealed a linear correlation for Carajas and Rudomain samples, as shown in Figure 7. As for Krivbas, the maximum values were achieved after 20 min. Similarly, in the study [21], it is clear that with increase in temperature of the reduction of the Fe ores, the percentage of reduction increased with the increase in time. In the metallisation process, it was observed that there is a rather strong correlation between the changes in the mass and the changes in FeTOTAL content in the samples of metallised pellets, as shown in Figure 8.
The measurements of mass loss during the testing of three types of ores with a solid reducing agent (RUDU, KBDU, and CARDU) indicated that at a temperature of 1200 °C, a holding time longer than 10 min had no significant effect on a decrease in mass (±5%) with an exception of Krivbas ore, which exhibited a mass loss of ~17%.
The following experiment was carried out in a chamber furnace using capped cups and with a holding time of 60 min, at a temperature of 1200 °C, and in the mode of heating from the ambient temperature up to the required maximum temperature and, after the holding time elapsed, in the mode of slow cooling in the furnace. The measured mass losses of the samples after balancing showed that the amount of oxygen removed from the Rudomain sample (8.6%) was more than half the amount lower than that of Carajas (20.97%) and Krivbas (19.76%) samples; this proves that with rich iron ores, the degree of reduction is higher. This hypothesis was also confirmed by testing interactions in the magnetic field. The sample of Rudomain pellet was first melted (Figure 9) due to the presence of a high portion of SiO2 in the ore and due to the conditions suitable for the formation of fayalite (2FeO.SiO2).
Since the metallisation of iron ores in the static air atmosphere was carried out in a slower kinetic mode due to a low rate of removal of gaseous components (primarily CO) after the reduction process, the inert nitrogen atmosphere was used in the subsequent experiments. In the nitrogen atmosphere, in identical thermodynamic (temperature = 1200 °C) and kinetic (reduction time = 60 min.) conditions, FeTOTAL content in the metallised product increased (from 72 to 76%). A comparison of different samples of Rudomain iron ore (R1, R7, and R8) with different values of richness clearly showed that with an increasing FeTOTAL content in the Rudomain ore, the FeTOTAL content in the metallised products proportionally increased, too, as shown in Figure 10.
The average-representing Rudomain sample, R7, was expected to achieve a FeTOTAL content of approximately 80% after effective metallisation. Therefore, in the following experiment, the reduction time was extended to 90 min, which achieved the highest FeTOTAL content of 78.08%; this corresponded to the reduction degree of 95.6% (Rd = loss O/total O × 100, calculated on the basis of the mass of ore and of the reducing agent, molar masses, and mass losses after reduction).
In the following stage, experiments with carbothermic reduction of Rudomain ore (the average-representing R7 sample) were performed in an electric induction furnace (EIF) (Figure 11). The results of the reduction in EIF showed that the achieved results of metallisation were not as positive as those achieved with a Marsh furnace (MF). In the experiments, the inert gas used was nitrogen (N2) in order to utilize the reduction potential of the solid reductant. The highest FeTOTAL content was achieved in the experiments conducted in EIF, namely 72.04%, which corresponded to the reduction degree of 79.3%. One of the reasons the pellets inside the steel tube buried in the silica retort were reduced unevenly is the static layer in which they were placed. The static layer facilitated neither the even exposure of its surface to the inert nor the removal of oxygen in form of a reaction product, namely CO. The reduction process was also affected by the disintegration of some of the pellets in the process and by the layered localisation of the individual pellets in the tube.

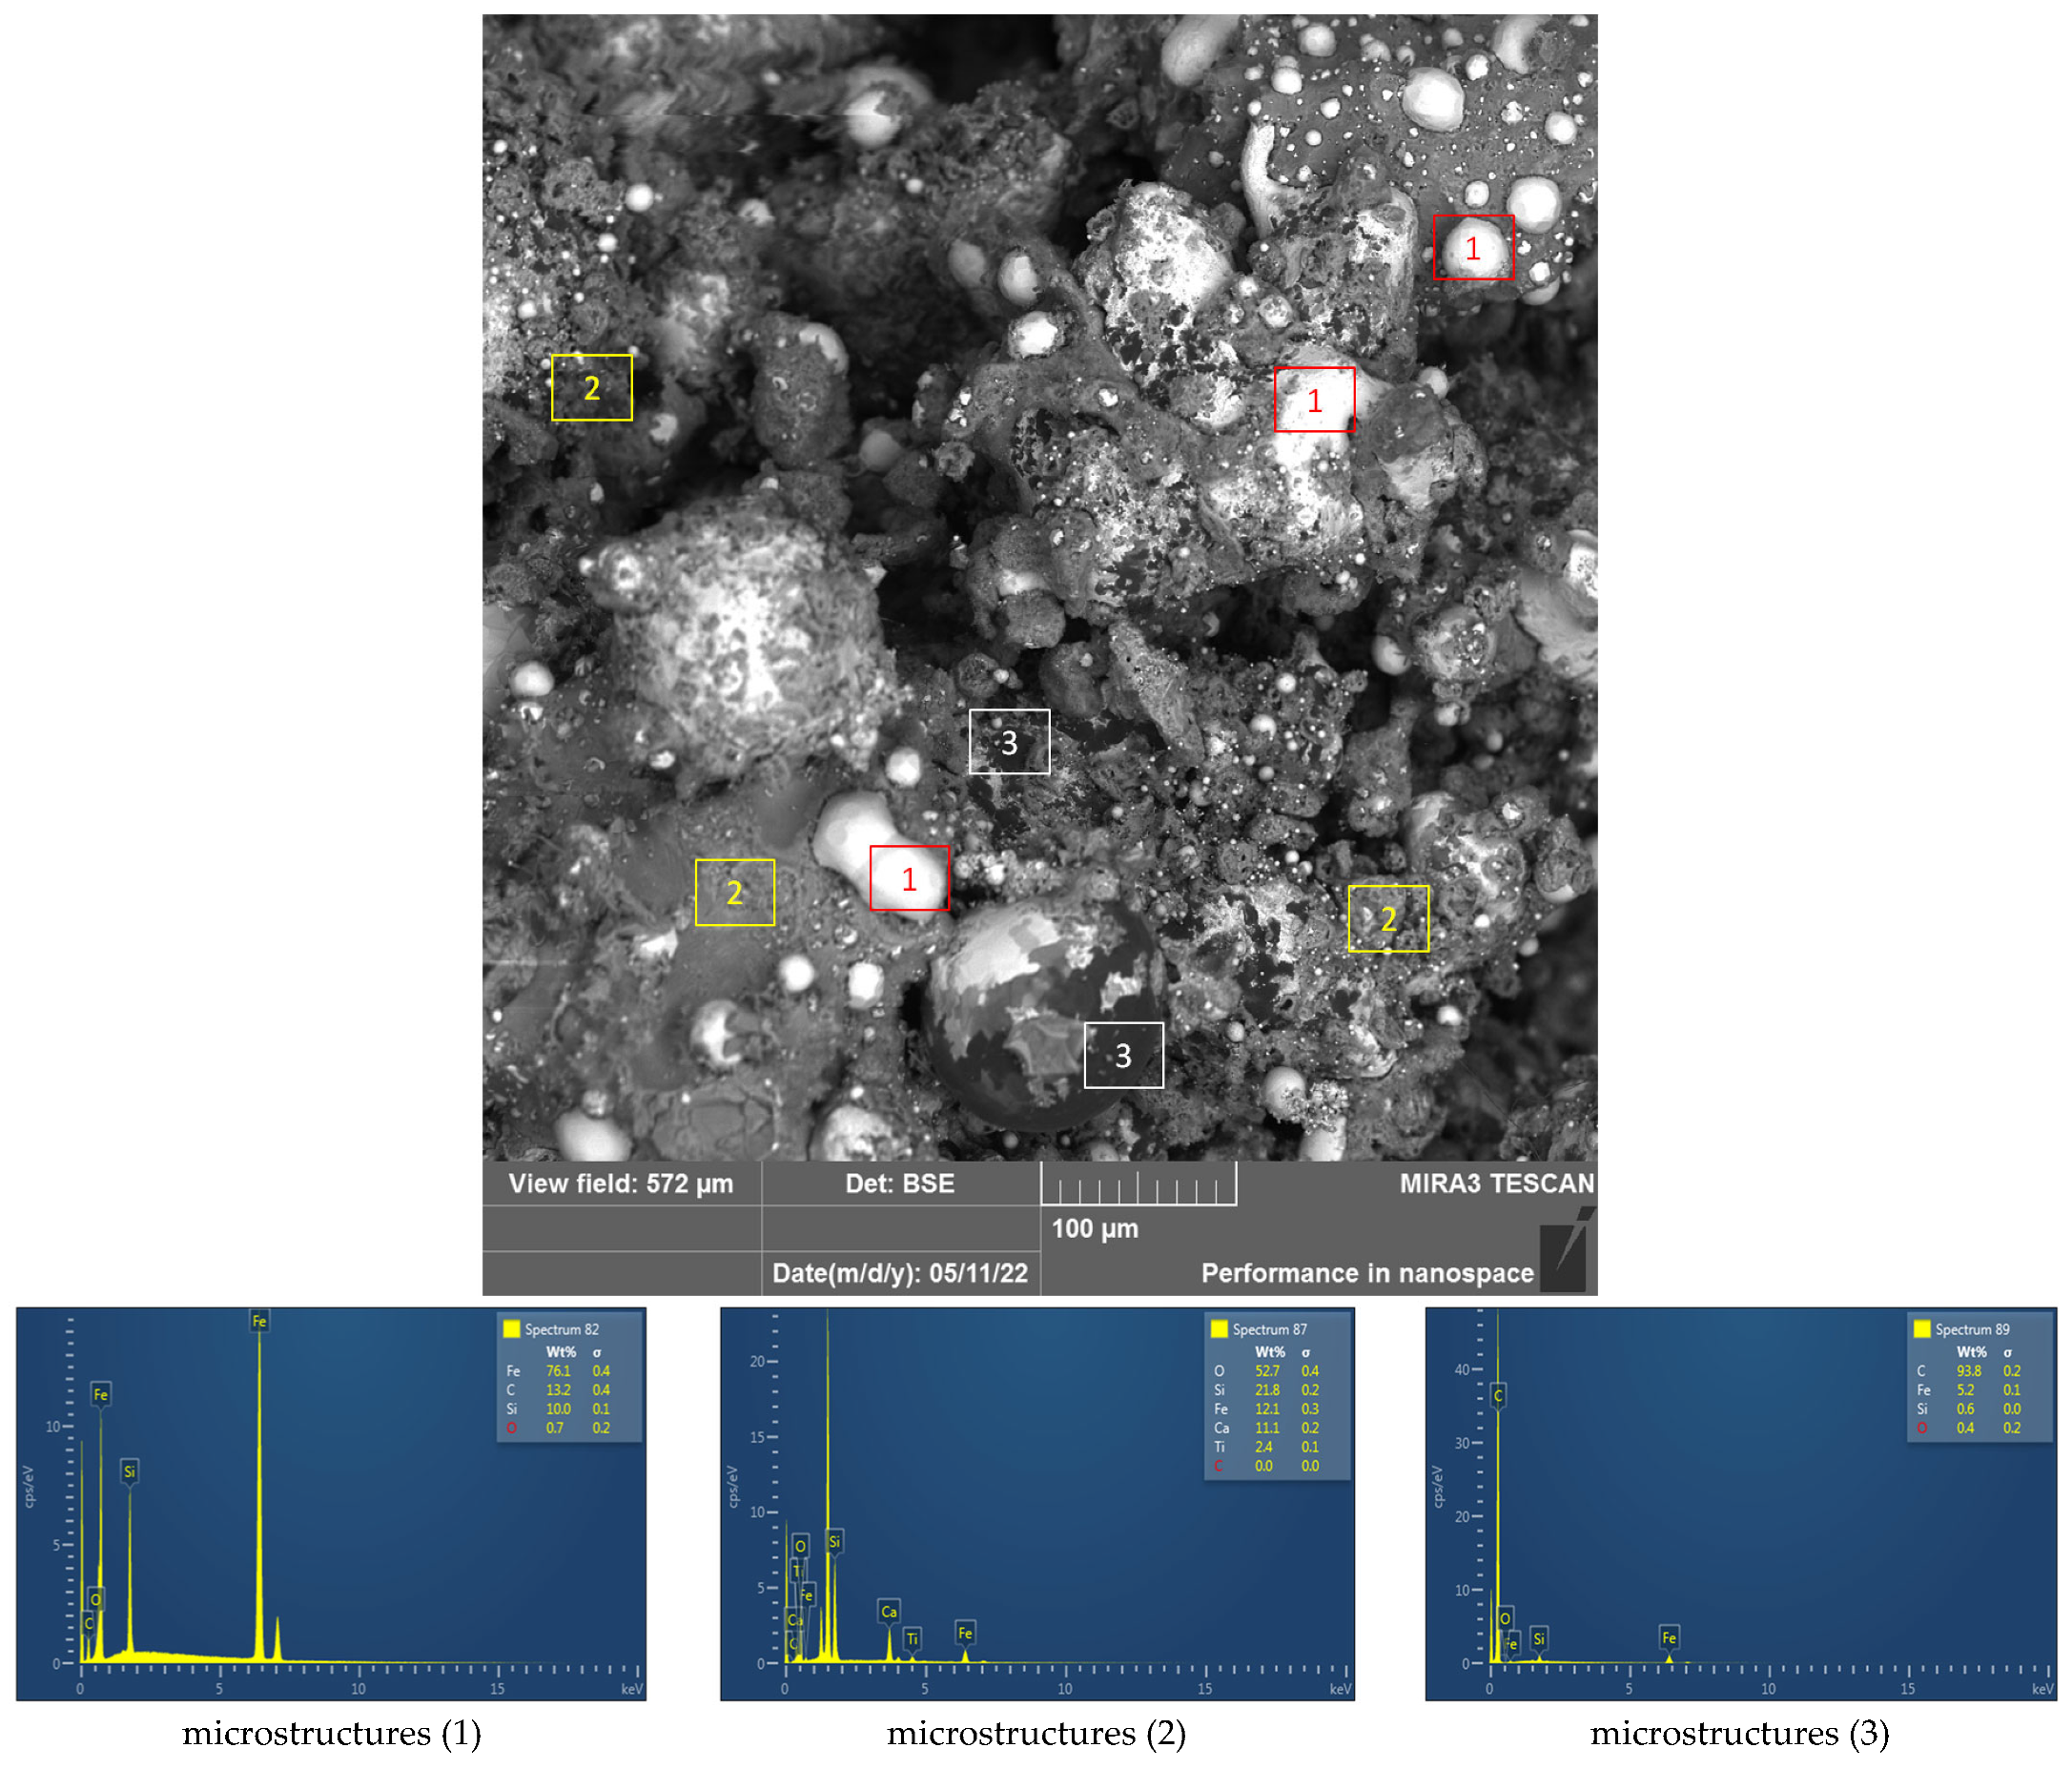
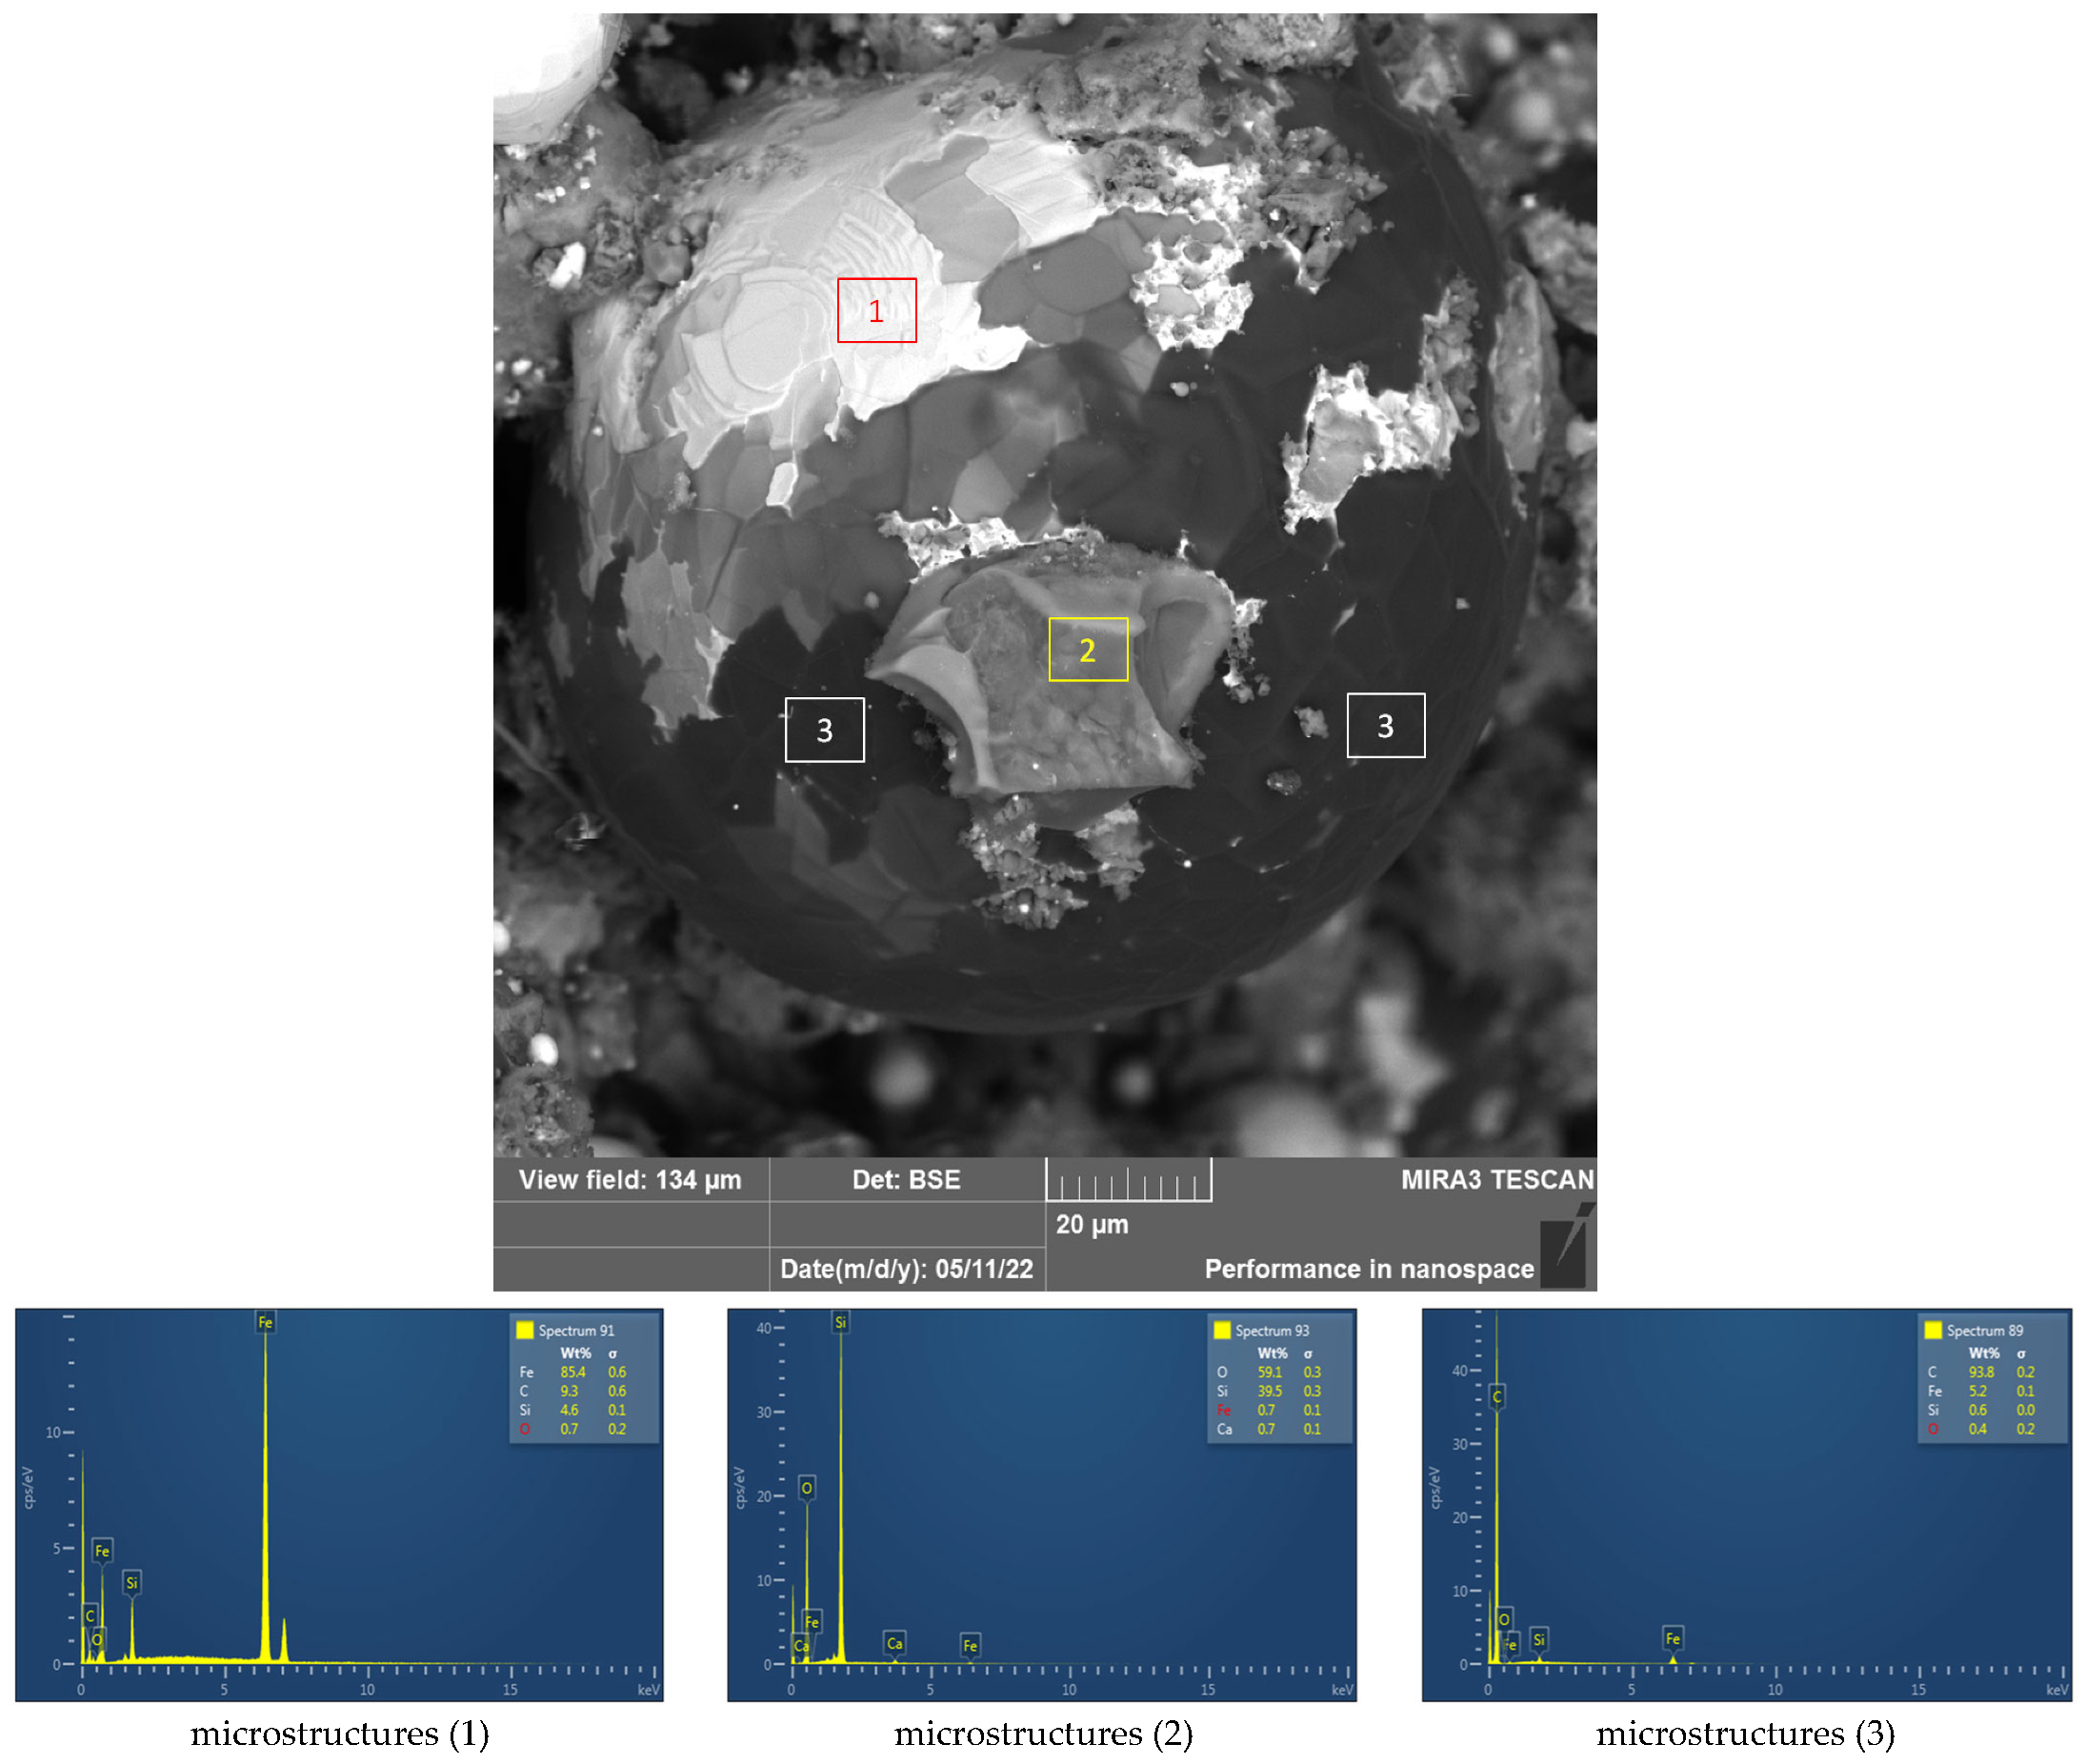
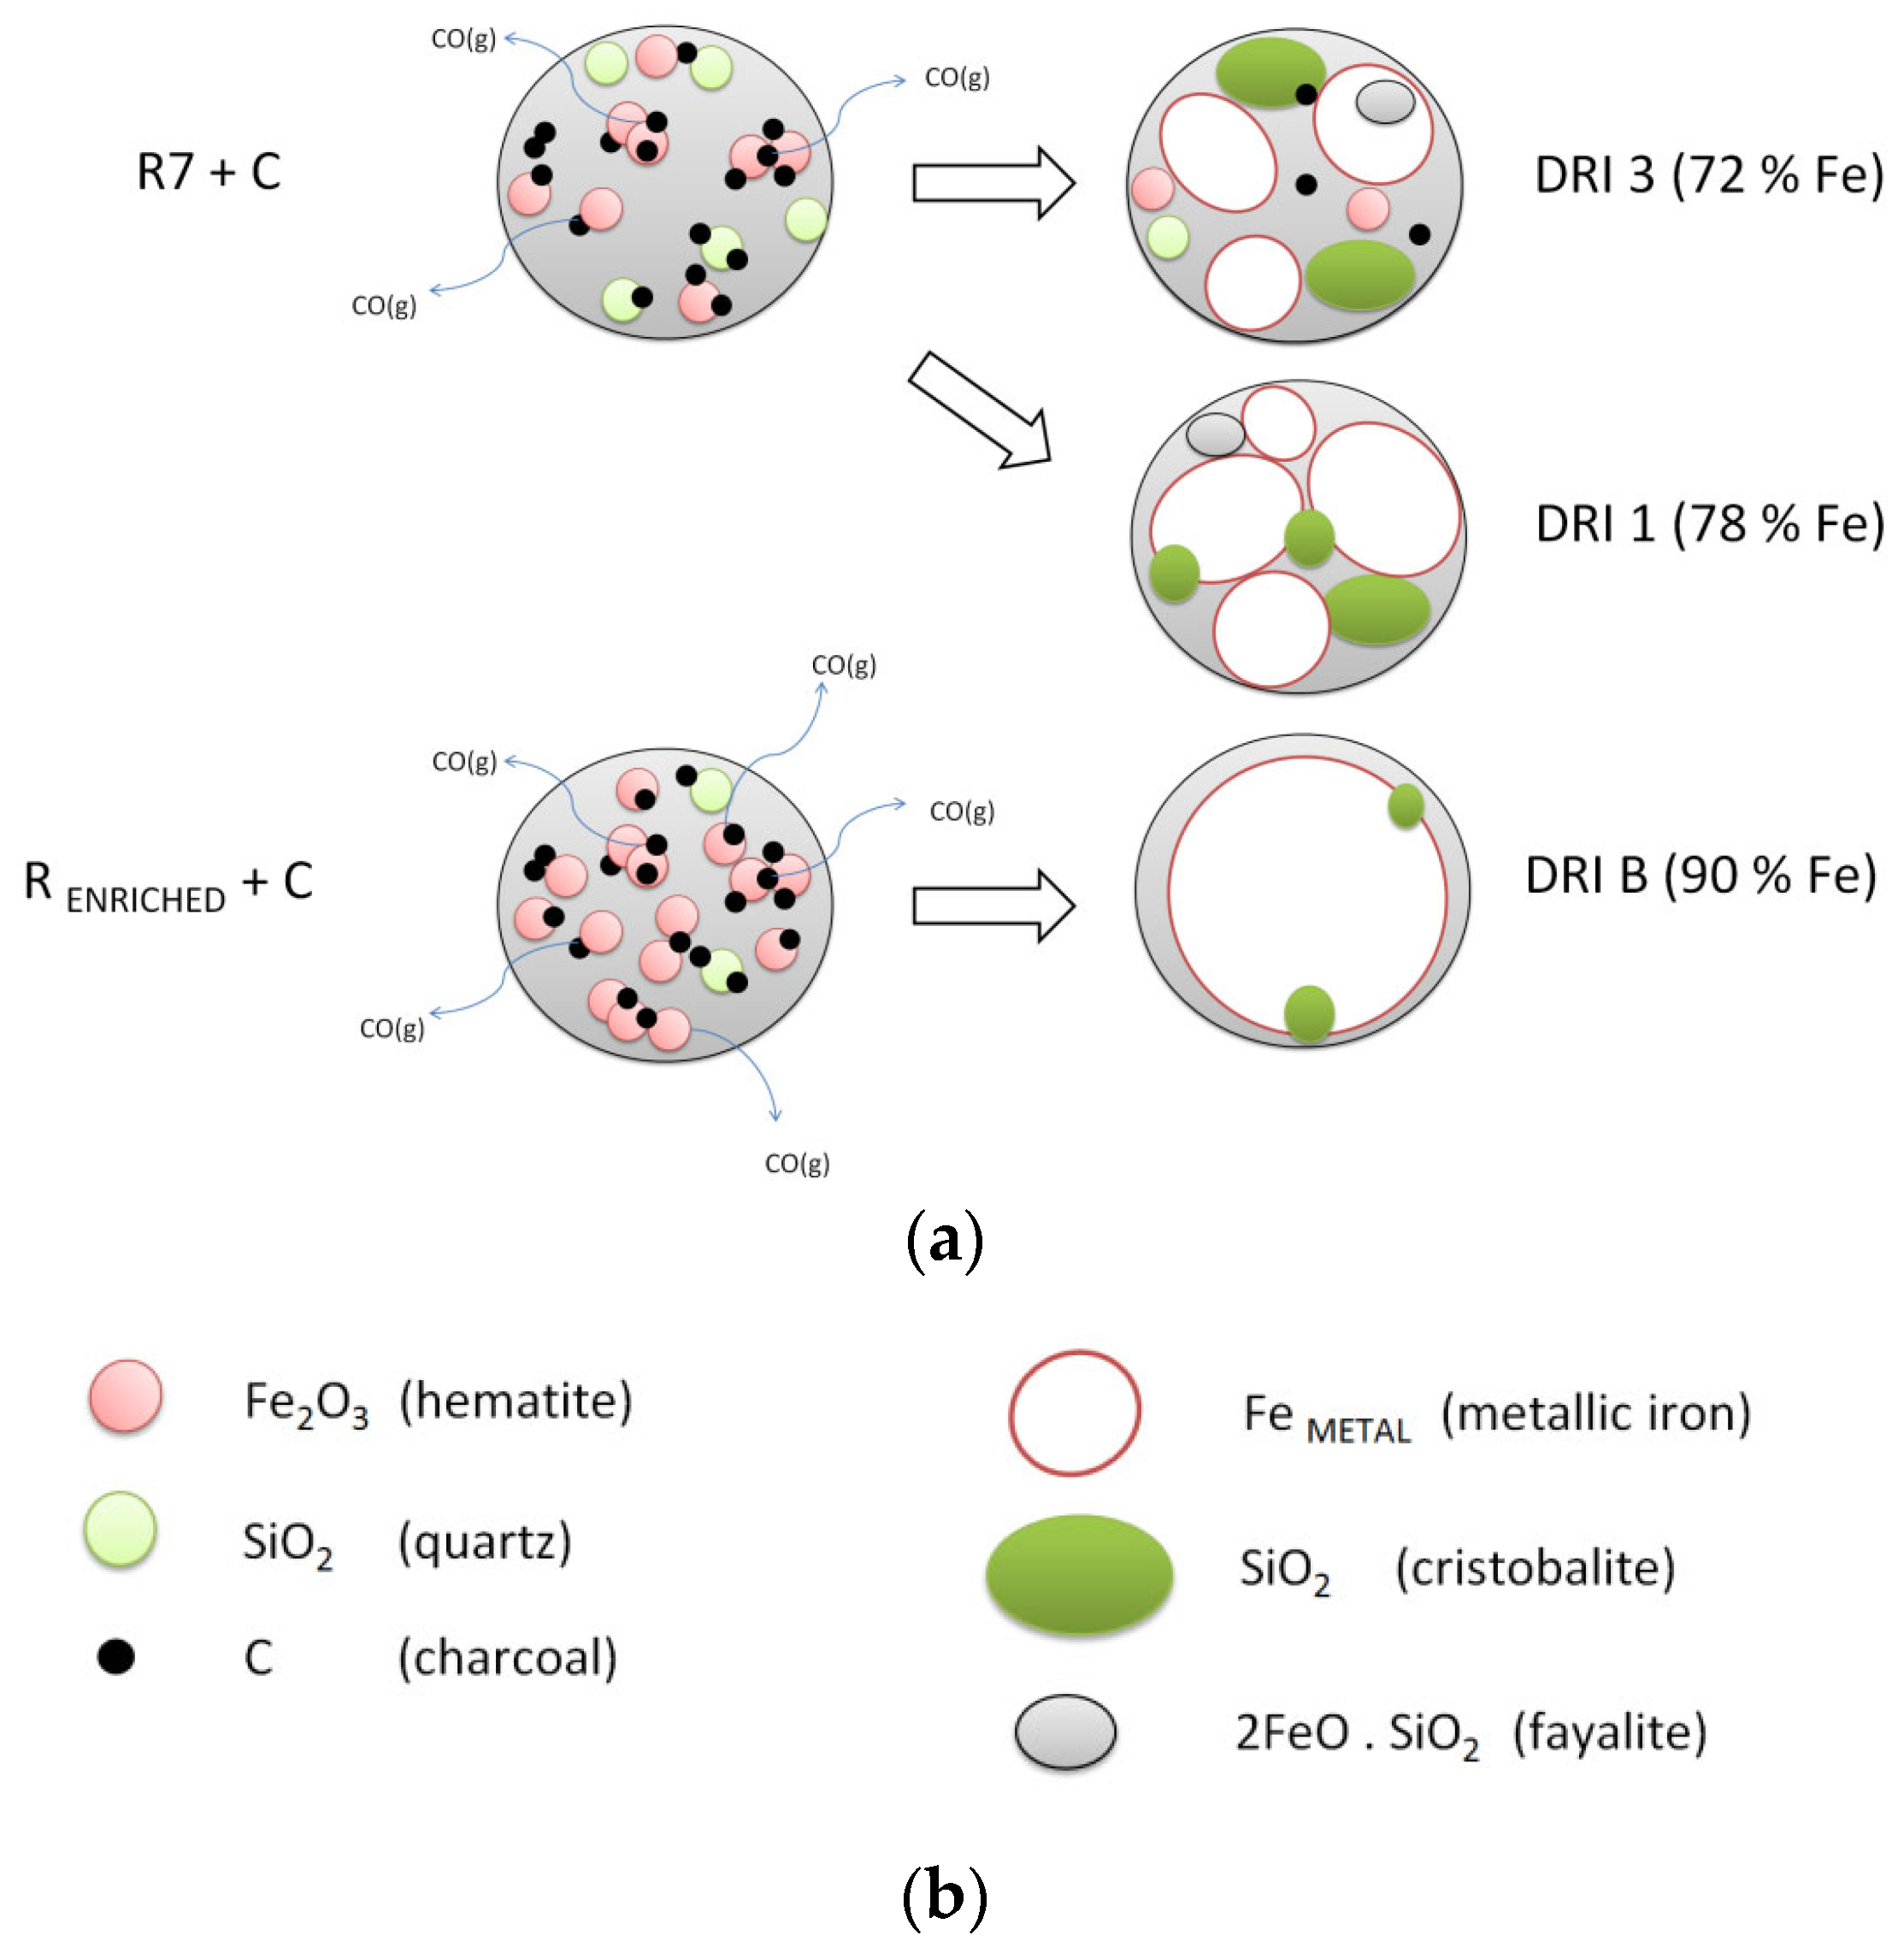
3.4. Material Research of Metallised DRI Pellets

The material research of the produced DRI pellets was primarily focused on the examination of the highest quality products and on the identification of differences in the quality of metallised DRI pellets. The study was carried out with the following samples of metallised pellets that were produced from the Rudomain ore (R7 sample):
DRI 1—a sample obtained by reduction in the Marsh furnace (designated as MF2);
DRI 3—a sample obtained by reduction in the electric induction furnace (designated as EIF8).
The total Fe content of the DRI pellets was analysed by two methods: with XRF and AAS analysis. High agreement in the analysis of total Fe was achieved within both methodologies in the metallised products. The identification of the chemical composition of DRI pellets (Table 6) showed that DRI 1 sample with FeTOTAL of 78.08 wt% approached the maximum theoretical value of FeTOTAL (80 wt%) for 100% reduction of Rudomain. The calculated degree of reduction for DRI 1 was 95.6%. The metallised product DRI 1 exhibited a low content of total carbon (0.68%, analysed by IR with an Elemental Vario device); this result proved not only the effective utilisation of a carbon-based reducing agent (charcoal) but also the fact that the amount of produced carbides (primarily Fe3C) was not large. The contents of undesirable phosphorus and sulphur impurities were very low for DRI pellets. The sulphur content was analysed not only by XRF analysis but also by IR analysis using the Elemental Vario device. There was a high correlation with both methodologies. In the process of metallisation in EIF, we did not manage to reduce the Rudomain iron ore to the same extent as was achieved with the Marsh furnace (DRI 1). The calculated degree of reduction with the DRI 3 sample was 79.3%.
An X-ray diffraction analysis showed that the content of SiO2 (analysed by the XRF) was present in Rudomain samples in the form of silica, and the FeTOTAL was contained in form of hematite. In addition to these major phases, we also identified a complex compound of cronstedtite (chemically alkaline iron silicate Fe2+2Fe3+(Si,Fe3+)2O5)(OH)4) and a complex of hydroxides of iron silicates. We also identified a non-stoichiometric form of magnetite but with a low probability of occurrence (Table 7). An X-ray phase analysis of the metallised product DRI 1 confirmed reduction processes by identifying iron-based phases (metallic Fe, ferrosilicon, and iron carbide) that corresponded to the chemical composition of the samples. Furthermore, the DRI 1 sample contained free graphite, silica, and a high-temperature form of cristobalite (Table 8).
A subsequent microscopic EDX analysis carried out using the Tescan MIRA3 microscope confirmed that there were differences between the quality of DRI 1 (the best product of metallisation in optimal reduction conditions in the Marsh resistance furnace) and the quality of DRI 3 (the product of metallisation in the electric induction furnace) metallised pellets. The microstructure of DRI 1 contained a significantly higher amount of grains formed by the reduction than those observed in DRI 3 pellets produced in EIF. Major parts of the DRI 1 sample consisted of continuous formed areas of metallic iron, low-carbon iron carbide (Fe2C0.05), and ferrosilicon with a low silica content (Fe3Si). The microstructure of the DRI 1 sample was observed to also contain cristobalite (SiO2) located on the surface of the iron areas formed by the reduction. Cristobalite is a high-temperature form of the original silica contained in the Rudomain ore. The microstructure also contained the signs of the reduction mechanism, in particular continuous zones of iron produced by reduction on the original hematite grains. Melted iron grains with residual carbon were also observed as well as the melt with a fayalite-like structure (2FeO.SiO2), and these were reformed in the reduction process into spheres of metallic iron and ferrosilicon with a low content of silica (Fe3Si) (Figure 12). The microstructure of Fe and Fe3Si produced by the reduction also contained zones with complex oxide compounds based on Fe–Ca–Si, probably formed of hedenbergite CaFe(SiO3)2. Oxides of calcium originated from the ash contained in the charcoal reducing agent, while the major component was CaO-based. A detailed image (Figure 13) facilitates the identification of a regular crystalline structure of iron and ferrosilicon with a low content of silica (Fe3Si) produced by the reduction, and on their surface, there are complex oxide compounds based on Fe–Ca–Mg–Si, which were probably formed as a result of reactions between the charcoal ash and the original hematite grains. Similarly, in the study [17], some ferrous oxides contained elements such as Mg and Ca. The study identified higher contents of Ca, Si oxides, and trace amount of Fe and P. After reduction in the samples, porous elements of almost pure Fe and darker segments of Ca and Si oxides were identified [17].
The microstructure of DRI 3 pellets produced in EIF (Figure 14) clearly shows a smaller amount of grains produced by the reduction that those observed in DRI 1. This finding confirmed the chemical analysis of DRI products, which indicated that the pellets metallised in the EIF retort were insufficiently reduced, and their structure contains rather large zones of FeO and unreacted carbon from the reducing agent. The main parts of the DRI 3 sample consisted of relatively small zones of metallic iron, low-carbon iron carbide (Fe2C0.05), and ferrosilicon with a low silica content (Fe3Si). The microstructure of the DRI 3 sample also exhibited the contents of silica (SiO2), cristobalite (SiO2) and grains of hematite and wüstite. The microstructure did not contain any melted grains, which also explains the low hardness of the produced metallised product. Furthermore, DRI pellets exhibited also a relatively large amount of unreacted charcoal. The microstructure of the DRI 3 sample also contained the signs of the reduction mechanism (Figure 14 down), in particular silica and carbon from the reducing agent located on the iron sphere produced by the reduction. The present silica (or a high-temperature form of cristobalite) inhibits the reduction of iron oxides.
A standardised methodology prescribed by STN ISO 540 [27] was applied using a high-temperature microscope in the examination of changes in the surface and volume of the analysed samples of Rudomain R7 iron ore and the metallised pellets produced from it (DRI 1 and DRI 3). During the heating process, with a gradient of 10 °C/min and in an air atmosphere at temperatures of up to ~1520 °C, geometrical changes were examined in the samples pressed into small cylinders (l = 3 mm; d = 3 mm) with the aim of identifying boundary temperatures.
The melting point of Rudomain iron ore (1450 °C) indicated the high effectiveness of the reduction processes with the use of gaseous CO and H2, which is the basic principle of the production of DRI or hot briquetted iron (HBI). In the study [19], the melting interval of the input materials for reduction was found to be approximately 1350–1410 °C. The results of the visual analysis for the identification of melting points indicated that DRI 1 and DRI 3 metallised pellets melted at a temperature that is higher than the melting point of the input Rudomain ore (Figure 15, Table 9). The DRI 3 sample melted at the temperature interval from 1492 to 1513 °C, whereas the DRI 1 sample did not melt even at the maximum operating temperatures available in the high-temperature microscope (~1510–1520 °C) (Figure 15). Since the metallised DRI products contained primarily metallic Fe and a high-temperature form of silica (cristobalite) with the melting point above 1500 °C, the high-temperature observations confirmed the chemical and mineralogical composition as well as the EDX analysis. The DRI 3 sample had a less intensive reduction and melted at the temperature interval of 1492–1513 °C; this confirms that the sample also contained iron oxides that did not fully undergo the reduction process.
Following the metallisation process, the average-representing sample Rudomain R7 (FeTOTAL of 59 wt%) achieved a FeTOTAL content of ~78%. Figure 16 shows a graphical simulation of the equilibrium composition in the metallisation of Rudomain R7. The simulation indicated that at a temperature of 1200 °C, the metallised product DRI should have the following chemical composition: FeTOTAL 78%; SiO2 18% (silica 9% + cristobalite 9%); C 2%; and other components representing 2%. The DRI 1 sample, which was made of Rudomain R7 and exhibited the best result of reduction conducted in a laboratory, had the following chemical composition: FeTOTAL 78.08%; SiO2 19.05%; C 0.68%; and other components representing 2.19% (Table 6). This is clearly shows that the results of laboratory experiments highly correlate with the thermodynamic simulation performed in the HSC program.
With the samples of Rudomain iron ore, it is possible to apply an uncomplicated technological operation in order to increase their richness (FeTOTAL) by ~3–5 wt%, in particular by separating approximately 14% of the largest fractions (above 5 mm). Thicker fractions (above 5 mm) may be further treated to obtain grains containing mostly hematite (above 90%); alternatively, this product may be used for sale (for example, for the production of Portland cement, ceramics, for water treatment, stabilisers, etc.). If this fraction was used for metallisation at a higher temperature of 1400 °C (or if Rudomain iron ore is enriched to ~65 wt% of FeTOTAL), it would be possible to produce a metallised DRI product with a following chemical composition: FeTOTAL 90%; SiO2 8% (silica 4% + cristobalite 4%); C 1.8%; and other components representing 0.2%. Figure 17 shows a predicted equilibrium composition in the metallisation of the enriched Rudomain iron ore.
Figure 18 presents a diagram of a comparison of the reduction of Rudomain iron ores. It is evident that by enriching Rudomain, it will be possible not only to increase the effectiveness of the reduction process but also significantly increase the quality of the metallised DRI product.

4. Conclusions

The contribution of the present manuscript is in the comparison of the physico-chemical and metallurgical properties of three commercial iron ores, in the explanation of the mechanism of reduction of poorer ores, and in the prediction of obtaining higher-quality metallised products based on the results of laboratory experiments. Due to the fact that DRI and HBI are currently produced, at a global level, from iron-bearing materials of the highest quality (FeTOTAL above 65%), the investigation into the research task specified in the present article was limited by the current quality of the Rudomain iron ore (an average content of FeTOTAL = 59%). The purpose of this study was to conduct experiments focused on the high-temperature metallisation of iron ore fines and lumps and aimed at increasing their use value. High-temperature experiments in thermal stability and carbothermic reduction have elucidated knowledge that is also beneficial for the treatment of lower-grade ores with higher SiO2 contents.
Based on the evaluation of a complex chemical composition of Rudomain iron ore, it is possible to conclude that this iron ore exhibits an average richness and low contents of P, S, alkalis, and non-ferrous metals.
Based on the identification of a mineralogical composition of Rudomain ore, it was observed that it contains two major and separated phases: hematite and silica. Self-hardened pellets exhibited higher resistance to thermal shock, which corresponds to the general knowledge of the effects of moisture and hardening on strength characteristics.
A comparison of high-temperature reduction indicated that richer samples, namely that of Carajas and Krivbas, were subjected to greater changes in their FeTOTAL contents and mass losses than those of Rudomain samples; this indicates that Carajas and Krivbas ores achieve higher degrees of reduction and degrees of metallisation. However, the differences between the individual iron ores were not significant; hence, Rudomain also has a good potential for effective metallisation.
A comparison of various samples of the Rudomain ore with different degrees of richness clearly showed that with an increasing FeTOTAL content in the input Rudomain ore, FeTOTAL contents in the products of metallisation of those samples proportionally increased, too.
The identification of a chemical composition of the produced DRI pellets clearly showed that the best-reduced DRI sample achieved a reduction degree of 95.6%. An X-ray phase analysis of the metallised DRI product confirmed reduction processes by identifying the iron-based phases (metallic Fe, ferrosilicon, and iron carbide) that correspond to the chemical composition of the samples.
Important results of the experiments (physical properties of ores and products after reduction) were compared with world studies. The agreement is shown in the parameters that affect the reduction process (for example, temperature and reaction time), and the differences are in the properties of the metallized product since Fe ores with different chemical and mineralogical compositions were used in the studies.
The reduction conditions were predicted by applying unconventional methods for scanning a high-temperature process using real-time thermal imaging and a software-assisted thermodynamic analysis, the results of which correlated very closely to the results of the laboratory experiments.

Author Contributions

Conceptualization and writing—original draft preparation, J.L., R.F. and D.B.; funding acquisition and project administration, J.L. and K.K.; data curation, validation, and formal analysis, K.K.; writing—review and editing, B.B. and P.D.; visualization, data curation, and investigation, S.H. All authors have read and agreed to the published version of the manuscript.

Funding

This research was funded by the Slovak Research and Development Agency (APVV), Slovak Republic, No. APVV-21-0142.

Data Availability Statement

Data are available on request due to restrictions, e.g., privacy or ethical. The data presented in this study are available on request from the corresponding author. The data are not publicly available but are the property of Kostyantyn Karamanits, Rudomain, 301 Pochtovy Ave, Kryvyi Rih, Ukraine, 50001.

Conflicts of Interest

The authors declare no conflict of interest.

References

  1. European Commission. How Are Emissions of Greenhouse Gases by the EU Evolving? Available online: https://ec.europa.eu/eurostat/cache/infographs/energy/bloc-4a.html (accessed on 20 February 2023).
  2. McKinsey & Company. How Industry Can Move toward a Low-Carbon Future. 2018. Available online: https://www.mckinsey.com/business-functions/sustainability/our-insights/how-industry-can-move-toward-a-low-carbon-future (accessed on 20 February 2023).
  3. World Steel Association. Energy Use in the Steel Industry. Available online: https://www.worldsteel.org/en/dam/jcr:f07b864c-908e-4229-9f92-669f1c3abf4c/fact_energy_2019.pdf (accessed on 20 February 2023).
  4. International Energy Agency IEA. Iron and Steel Technology Roadmap. Available online: https://iea.blob.core.windows.net/assets/eb0c8ec1-3665-4959-97d0-187ceca189a8/Iron_and_Steel_Technology_Roadmap.pdf (accessed on 20 February 2023).
  5. IEA Iron and Steel—November 2021. Available online: https://www.iea.org/reports/iron-and-steel (accessed on 20 February 2023).
  6. Bailera, M.; Lisbona, P.; Peña, B.; Romeo, L.M. A review on CO2 mitigation in the Iron and Steel industry through Power to X processes. J. CO2 Util. 2021, 46, 101456. [Google Scholar] [CrossRef]
  7. Vogl, V.; Åhman, M.; Nilsson, L.J. The making of green steel in the EU: A policy evaluation for the early commercialization phase. Clim. Policy 2021, 21, 78–92. [Google Scholar] [CrossRef]
  8. Greensteel for Europe. Technology Assessment and Roadmapping. Available online: 210308-D1-2-Assessment-and-roadmapping-of-technologies-Publishable-version.pdf (accessed on 19 February 2023).
  9. Eurofer. A Steel Roadmap for Low Carbon EUROPE 2050. Available online: https://www.eurofer.eu/assets/publications/archive/archive-of-older-eurofer-documents/2013-Roadmap.pdf (accessed on 19 February 2023).
  10. Hubatka, S.; Branislav, B.; Dana, B.; Peter, D.; Lukáš, F.; Vladimír, Š. Decarbonisation of the Steel Industry–Pathway to Brighter Future–Slovakia and Czech Republic Case Study. In Proceedings of the Anniversary International Conference on Metallurgy and Materials, Brno, Czech Republic, 26–28 May 2021. [Google Scholar] [CrossRef]
  11. Decarbonization Challenge for Steel. Hydrogen as a Solution in Europe. Available online: https://www.mckinsey.com/~/media/McKinsey/Industries/Metals%20and%20Mining/Our%20Insights/Decarbonization%20challenge%20for%20steel/Decarbonization-challenge-for-steel.pdf (accessed on 19 February 2023).
  12. Technologies For a Sustainable Steel Industry. Available online: https://www.green-industrial-hydrogen.com/fileadmin/user_upload/Webinar_GrInHy2.0_-_Another_step_towards_hydrogen_based_steelmaking_Tenova.pdf (accessed on 19 February 2023).
  13. Greensteel for Europe. Collection of Possible Decarbonisation Barriers. Available online: 210308-GreenSteel-D1-5-Decarbonisation-Barriers-Publishable-version.pdf (accessed on 19 February 2023).
  14. Legemza, J.; Findorák, R.; Fröhlichová, M.; Džupková, M. Advances in Sintering of Iron Ores and Concentrates. In Iron Ores; IntechOpen: London, UK, 2021. [Google Scholar] [CrossRef]
  15. Dawson, P. Recent developments in iron ore sintering and sinter quality. Part 2 Research studies on sintering and sinter quality. Ironmak. Steelmak. 1994, 2, 137–143. [Google Scholar]
  16. Findorák, R. Železorudný Aglomerát a Faktory Vplývajúce na Jeho Kvalitu; Habilitation Work; Technical University of Košice: Košice, Slovakia, 2015. [Google Scholar]
  17. Jursova, S.; Pustejovska, P.; Brozova, S. Study on reducibility and porosity of metallurgical sinter. Alex. Eng. J. 2018, 57, 1657–1664. [Google Scholar] [CrossRef]
  18. Zhu, D.; Jiang, Y.; Pan, J.; Yang, C. Study of Mineralogy and Metallurgical Properties of Lump Ores. Metals 2022, 12, 1805. [Google Scholar] [CrossRef]
  19. Wu, S.; Han, H.; Xu, H.; Wang, H.; Liu, X. Increasing Lump Ores Proportion in Blast Furnace Based on the High-temperature Interactivity of Iron Bearing Materials. ISIJ Int. 2010, 50, 686–694. [Google Scholar] [CrossRef]
  20. Mousa, E.A.; Babich, A.; Senk, D. Reduction Behavior of Iron Ore Pellets with Simulated Coke Oven Gas and Natural Gas. Steel Res. Int. 2013, 84, 1085–1097. [Google Scholar] [CrossRef]
  21. Hashem, M.N.; Salah, B.A.; El-Hussiny, N.; Sayed, S.A.; Shalabi, M.E.H. Reduction Kinetics of Egyptian Iron Ore by Non Coking Coal. Int. J. Sci. Eng. Res. 2015, 6, 846–852. [Google Scholar]
  22. Sohn, H.Y.; Roy, S. Development of a Moving-Bed Ironmaking Process for Direct Gaseous Reduction of Iron Ore Concentrate. Metals 2022, 12, 1889. [Google Scholar] [CrossRef]
  23. Rane, K.; Date, P.; Srivatsan, T.S. Influence of Material and Process Parameters on Reduction-Swelling Characteristics of Sintered Iron Pellets. Metals 2023, 13, 141. [Google Scholar] [CrossRef]
  24. Sinha, K.M.K.; Sharma, T.; Haldar, D.D. Reduction of Iron Ore with Non Coking Coal. Int. J. Eng. Adv. Technol. (IJEAT) 2014, 3, 30–33. [Google Scholar]
  25. Rudomain. Available online: https://rudomain.com.ua/en/ (accessed on 19 February 2023).
  26. HSC Chemistry 9, Version 9. Thermodynamic Software for Process Simulation. Outokumpu Research Oy: Pori, Finland, 2018.
  27. STN ISO 540: 2010 (44 1363); Stanovenie Taviteľnosti Materiálov [Determination of the Fusibility of Materials]. Slovak Institute of Technical Standardization: Bratislava, Slovakia, 2010.
Figure 1. Graphical representation of the reduction of iron oxides by carbon (C) and by carbon monoxide CO.
Applsci 13 10698 g001
Figure 2. Effects of temperature on the reduction of 1 mole of Fe2O3 with 1 mole of C (left) and 3 moles of C (right).
Applsci 13 10698 g002
Figure 3. Influence of a C on the reduction and metallisation of Fe2O3 at 1200 °C.
Applsci 13 10698 g003
Figure 4. High-temperature observations of a Rudomain pellet in the Marsh furnace.
Applsci 13 10698 g004
Figure 5. A TGA analysis of Rudomain iron ore (RUD0) and a mixture of Rudomain and a reducing agent (RUD1).
Applsci 13 10698 g005
Figure 6. (Left side): Pellets before (a) and after (b,c) a thermal shock at 950 °C; (b) without hardening; (c) hardened. (Right side): Mass loss of pellets at thermal shock temperatures; black, without hardening; red, hardened.
Applsci 13 10698 g006
Figure 7. Effects of a reduction time on a FeTOTAL content in the samples of metallised pellets at 1200 °C.
Applsci 13 10698 g007
Figure 8. A correlation between the changes in a mass and the changes in a FeTOTAL content in the samples of metallised pellets (reduction times = 10–300 min; temperature = 1200 °C).
Applsci 13 10698 g008
Figure 9. Samples before and after reduction.
Applsci 13 10698 g009
Figure 10. Increased FeTOTAL contents after the reduction of Rudomain iron ore samples (temperature = 1200 °C; reduction time = 60 min.; N2 inert atmosphere).
Applsci 13 10698 g010
Figure 11. Tests of reduction in EIF using an IR camera.
Applsci 13 10698 g011
Figure 12. An EDX analysis of the DRI 1 sample (original structure).
Applsci 13 10698 g012
Figure 13. An EDX analysis of the DRI 1 sample (original structure).
Applsci 13 10698 g013
Figure 14. An EDX analysis of DRI 3 samples (original structure).
Applsci 13 10698 g014aApplsci 13 10698 g014b
Figure 15. High-temperature observation of DRI 1 and DRI 3 iron ore samples before (R10) and after metallisation. NA—not analyzed at higher temperatures due to temperature limit reached, maximum about 1515 °C.
Applsci 13 10698 g015
Figure 16. Equilibrium composition in the metallisation of Rudomain R7. *2FeO*SiO2—standardized notation of a complex compound fayalite (2FeO.SiO2) in the HSC Chemistry thermodynamic program.
Applsci 13 10698 g016
Figure 17. A prediction model of a composition of DRI made of enriched Rudomain at metallisation temperatures. *2FeO*SiO2—standardized notation of a complex compound fayalite (2FeO.SiO2) in the HSC Chemistry thermodynamic program.
Applsci 13 10698 g017
Figure 18. Schematic comparison of the reduction of Rudomain iron ores. (a) schematic illustration of Rudomain ore reduction, (b) legend to schematic illustration. (R7 + C) Input Rudomain ore R7 + reducing agent (charcoal). (RENRICHED + C) Input enriched Rudomain + reducing agent (charcoal). (DRI 3) An insufficiently reduced DRI pellet made of Rudomain R7. (DRI 1) An excellently reduced DRI pellet made of Rudomain R7. (DRI B) A prediction of an excellently reduced DRI pellet made of enriched Rudomain ore.
Applsci 13 10698 g018
Table 1. Selected parameters of tested iron ores.
SampleFe Total
(%)
SiO2
(%)
Bulk Density
(kg/m3)
True Density
(kg/m3)
Rudomain 1 (R1)52.4620.022435.603991.80
Rudomain 7 (R7)58.2013.402609.604412.66
Rudomain 8 (R8)61.718.282678.804580.56
Krivbas (KB)62.257.802810.204460.81
Carajas (C)65.232.212606.404707.56
Table 2. Parameters of charcoal used for the reduction of iron ores.
H2O
(%)
Ash
(%)
Volatile Matter
(%)
Carbon
(%)
Sulphur
(%)
Calorific Value
(MJ/kg)
Charcoal
properties
4.903.508.2088.300.0530.46
Ash composition (%)
SiO2Al2O3Fe2O3CaOMgOK2OP2O5Others *
6.300.851.4737.0012.5011.421.6528.81
Others *, primarily an analysis of carbon and hydrogen since carbonates and hydrates are found in the ash.
Table 3. High-temperature reduction in the muffle furnace (MP-62, type MARK ESA).
EquipmentElectrical resistance furnace
Applsci 13 10698 i001
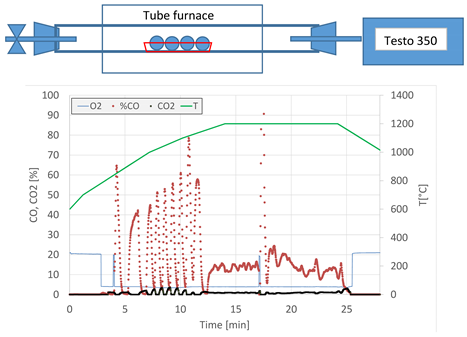
Monitoring of exhaust gases and temperatures
Measurements of temperature and exhaust gasesPtRh10%-Pt thermocouple TESTO 350 analyser
Boat materialCorundum
AtmosphereStill air atmosphere or inert nitrogen atmosphere
Used temperatures1100–1200 °C
Holding time10–300 min
SampleRaw iron ore pellets with an internal charcoal-based reducing agent (ore:charcoal = 4:1)
Table 4. High-temperature reduction in an electric induction furnace.
EquipmentElectric induction furnace with a retort
Applsci 13 10698 i002
Retort materialA steel cylinder inside a retort made of silica glass
AtmosphereInert nitrogen atmosphere with a flow rate of 0.5–3 L/min.
Used temperatures (holding)1100–1200 °C
Monitored temperatureContactless measurements using a thermal-imaging from MicroEpsylon camera (MICRO-EPSILON MESSTECHNIK GmbH & Co., KG, Ortenburg, Germany)
Holding time20–150 min
SampleRaw iron ore pellets with an internal charcoal-based reducing agent (ore:charcoal = 4:1)
Table 5. Properties of tested iron ores.
Iron OreApplsci 13 10698 i003Applsci 13 10698 i004Applsci 13 10698 i005
Krivbas (Ukraine)Rudomain (Ukraine)Carajas
(Brazil)
Chemical composition
(wt%)
FeTOTAL62.2558.2065.23
MnTOTAL0.070.040.57
SiO27.8013.402.21
Al2O31.331.081.05
CaO0.280.130.10
MgO0.600.240.10
P0.030.060.05
S0.030.010.01
Na2O0.1800.1500.005
K2O0.0400.0280.006
Others *27.3926.6630.67
Granulometric composition
(%)
<0.1 mm1.556.050.35
<0.5 mm23.6441.7512.85
<1 mm35.1357.4828.54
<5 mm62.1886.8455.03
<10 mm81.3697.0478.35
Moisture (%) 2.351.751.55
Bulk specific gravity (kg.m−3)ρA282026002680
True specific gravity (kg.m−3)ρ446044204710
Melting point (°C) 147214531540
Mineralogical compositionXRDHematite,
hydrohematite,
silica
Hematite,
hydrohematite,
hydrated iron silicate,
magnetite
cronstedtite,
silica
Hematite,
silica
Others *, primarily an analysis of oxygen and hydrogen in Fe phases.
Table 6. Chemical composition of DRI pellets containing Rudomain 7.
SampleReduction Degree Rd (%) Chemical Composition (wt%)
FeTOTSiO2Al2O3Na2OCSPOthers *
R7-58.2013.401.080.15-0.010.0627.1
DRI 195.6078.0819.051.700.020.680.020.020.43
DRI 379.3072.0417.212.31--0.050.038.36
Others *, primarily an analysis of oxygen in Fe phases.
Table 7. Mineralogical composition of Rudomain iron ore.
Mineralogical NamePhase DesignationChemical Formula
Silicon oxideSilicaSiO2
Iron hydrogen oxideHydrohematiteFe1.67H0.99O3
Iron oxideHematiteFe2O3
Iron silicate hydroxideHydrated iron silicateFe3Si2O5(OH)4
Silicon oxideSilicaSiO2
Iron silicate hydroxideCronstedtiteFe3(Si,Fe)2O5(OH)4
Iron oxideMagnetiteFe2.936O4
Table 8. Mineralogical composition of DRI 1 metallised pellet.
Mineralogical NamePhase DesignationChemical Formula
Aluminium iron siliconAl-ferrosiliconAl0.7Fe3Si0.3
GraphiteGraphiteC
Iron siliconFerrosiliconFe0.905Si0.095
IronIronFe
Carbon ironIron carbideC0.055Fe1.945
Silicon oxideSilicaSiO2
Silicon oxideCristobaliteSiO2
Table 9. Temperatures characteristic of DRI 1 and DRI 3 samples.
DRI 1DRI 3Rudomain R10 (R7)
Deformation temperature DT (°C)145514501438
Shrinkage temperature ST [°C]151014921449
Hemisphere temperature HT (°C)NA15121453
Flow temperature FT (°C)NA14711455
Melting interval (°C)1510–NA1492–15131449–1453
Flow interval (°C)NANA1453–1455
NA—not analyzed at higher temperatures due to temperature limit reached, maximum about 1515 °C.
Disclaimer/Publisher’s Note: The statements, opinions and data contained in all publications are solely those of the individual author(s) and contributor(s) and not of MDPI and/or the editor(s). MDPI and/or the editor(s) disclaim responsibility for any injury to people or property resulting from any ideas, methods, instructions or products referred to in the content.

