1. Introduction
Transmission lines are used for the transmission of electric power and their continuous operation is essential for the reliability of the power grid. Electrical insulators are one of the most important elements of the electric power grid because of their role in the isolation of conductors from the tower and mechanical support for the electric line, affecting the reliability of transmission and distribution lines, which is clearly of huge importance in modern society [
1,
2]. Insulator performance, at any given time, is commonly affected by several factors: material, shape, degradation, and the properties of atmospheric pollution [
3,
4] deposited. The last factor, combined with atmospheric meteorological conditions, plays a relevant role in failures [
5]. It has been reported that high humidity conditions cause insulator outages and consequently network outages [
1].
In fact, it is well known that insulators remain quiescent when dry even if highly polluted. Conversely, when the insulator surface becomes moist because of rain, fog, or dew, these factors may lead to the formation of a conductive layer on the surface and cause leakage of current flow [
6] due to a reduction in its dielectric strength. The leakage current density is non-uniform over the insulating surface, and, in some areas of the surface, sufficient heat is developed, leading to the formation of dry bands. Consequently, voltage redistribution along the insulating surface increases the stress across the dry bands, resulting in partial arcs. When the surface resistance is sufficiently low, the partial arcs will elongate along the insulator profile, and may eventually cause a full insulator flashover [
7].
As aforementioned, atmospheric pollution is among the main natural causes of flashover accidents, which endanger the safety and stability of the power system due to its accumulation on the surface of insulators that operate in the outdoor environment [
5]. However, the term atmospheric pollution is rather vague and refers to the ensemble of atmospheric aerosols that can deposit on surfaces [
8].
The deposition process by itself is a very complex phenomenon as it is, first of all, a function of particle size, shape, and chemical composition, which turns into the particle aerodynamic properties influencing the capability of any particle to diffuse or settle in atmospheric conditions [
9]. Moreover, any force (other than gravity) acting on any particle (such as the wind drag force, and thermophoretic and electrophoretic forces) is an important variable that can affect the particle deposition over the insulators [
10]. Finally, even the properties of the surface over which the deposition phenomena occur are fundamental [
8]. In addition to this, the gas–particle partitioning [
9] can continuously act, affecting the deposit’s chemical characteristics over time [
8].
All the aforementioned processes affect both the amount and the chemical characteristics of the deposit onto an insulator; as a result, any deposit can be composed of internal mixing of soluble and non-soluble compounds (water-soluble ions, organic matter, black carbon, metals, dust, and crustal material) [
2,
9] caused by natural (e.g., sea spray and dust sources) or anthropogenic origins [
11].
As a remarkable fraction (>40%) of an atmospheric aerosol is composed of water-soluble compounds [
12,
13], a direct consequence is its hygroscopicity, such as in saline deposit layers, which causes an aerosol to pass into a liquid phase [
14,
15,
16]. This phenomenon happens when soluble pollution species dissociate in ions, acquiring conductive characteristics. The consequence is a disruptive discharge over the insulator surface [
2,
17,
18], which finally turns into line outages with possible not negligible financial consequences for the grid operator.
With respect to this, the physical state (wet or dry) of atmospheric aerosols is controlled by the synergy between the aerosol deliquescence and the crystallization relative humidity (DRH and CRH) and the history of relative humidity (RH) of the ambient air. In fact, the DRH and CRH determine whether aerosol particles are solid or liquid (i.e., their soluble components are in solution) depending on the variation of the relative humidity (RH) of the surrounding atmosphere. Particularly, starting from an RH < DRH, the aerosol is dry until RH reaches DRH; from this point, the aerosol spontaneously absorbs water, producing a saturated aqueous solution. Any other RH increase leads to further condensation of water (hygroscopic growth). Conversely, a reduction in RH (starting from a value above DRH) leads to evaporation until the CRH is reached, promoting aerosol crystallization and bringing the aerosol to a dry state again. The aforementioned cycle is known as the hysteresis cycle of the aerosol [
2], and a direct consequence of it is that in order to understand if an aerosol particle is “wet” or “dry” and the effect on the insulators, it is fundamentally important to know the RH history together with the DRH and CRH values.
The latter values (DRH and CRH) are a function of the chemical composition of the aerosol itself, making the aerosol chemistry a key parameter to understand and investigate its effect on insulators. In fact, as the aerosol chemical composition is subjected to a high variability in space and time, the DRH and CRH will also vary greatly. In the past, most of the studies investigated the DRH and CRH of single aerosol components (i.e., (NH
4)
2SO
4, NaCl, and NH
4NO
3), but a growing number of papers report on the DRH and CRH of aerosol systems with higher chemical complexity [
13,
19]. Concerning the DRH, Gupta et al. [
20] and Miñambres et al. [
21] studied a mixture of NaCl-NaNO
3 particles; Ling and Chan [
22] studied the phase transitions of systems formed by (NH
4)
2SO
4 and carboxylic acids, evidencing that the organic acids affect the DRH of the system, leading to a gradual dissolution of the solid particles resulting in an early water uptake for a complex system of ammonium. As a result [
9], the DRH of the complex chemical aerosol system can be lower than that of each single chemical compound.
Concerning the CRH, Dougle et al. [
23] studied the effect of black carbon in the CRH of the NH
4NO
3-(NH
4)
2SO
4 system while Han and Martin [
24] investigated the heterogeneous crystallization of a -(NH
4)
2SO
4 aerosol with inclusions of metal oxides, such as TiO
2, Al
2O
3, and ZrO
2, showing that these insoluble inclusions increased the CRH of the complex aerosol system. With respect to this, a step forward useful for ambient particle DRH and CRH determination is represented by the use of mass and electrical techniques used on ambient aerosol samples [
19].
Despite the aforementioned growing attention on the complexity of aerosol particles, up to now, few works have focused their attention on the DRH and CRH of real ambient atmospheric particles, especially on their deposits onto surfaces such as insulators. In fact, the flashover voltage and the hysteresis cycle of the aerosol on the insulators are both influenced by the chemical composition of the deposit. The water-soluble fraction of aerosol particles (i.e., saline species) dissociates in ions when RH > DRH, acquiring conductive characteristics and increasing the risk of flashover conditions [
17] during their water-soluble state; in this respect, a huge variety of water-soluble chemical compounds can influence the final conductivity on an insulator [
25]. It has also been realized that the non-soluble part of the pollution also influences the flashover voltage under contaminated conditions [
26]. Insoluble compounds of atmospheric aerosols consist of, for instance, dust, sand, clay, and water-insoluble organic material. Moreover, it has been demonstrated that even non-electrolyte substances can play a part in adverse phenomena connected to electrical contexts; on the one hand, they promote the adhesion of new particulate matter to the insulator surface, and on the other hand, they absorb the water vapor present in the surrounding air, increasing the possibility of humidification of the soluble salts present into the deposition layer. Among the non-electrolyte substances, black carbon (BC) could play a significant role. Black carbon represents carbonaceous particles deriving from combustion processes; it is composed of graphene layers with small contents of heteroatoms, especially oxygen and hydrogen; flame generated BC can be electrically conductive, even if the measured conductivity values (between 10
−6 and 10
−2 Ω
−1 cm
−1, depending on the sample density and the fuel used for its production) may be lower than those of pure graphite (between 10
−3 and 10
−1 Ω
−1 cm
−1, depending on the sample density). This is caused by the mainly disordered and amorphous structure of BC: in effect, unlike pure graphite that has just hybrid sp
2 C atoms and valence electrons in the remaining π-orbital, flame BC also contains some sp
3 bonds. BC could play a role in electrical bridging processes caused by aerosols deposition as recently demonstrated by Ferrero et al. [
2].
Based on the aforementioned evidence, the International Electrotechnical Commission (IEC) standardized the selection and dimensions of insulators to be used in high-voltage systems with respect to pollution through the IEC/TS 60815-1 [
4] document of 2008 (currently under review). This first edition of IEC/TS 60815-1 cancels and replaces IEC/TR 60815 [
27], which was issued as a technical report in 1986. Of course, the key to applying this standard properly is establishing the correct site pollution severity (SPS) before insulators are specified, and this document provides a guide for the assessment of SPS. If the site pollution is underestimated, the standard can lead to an under-dimensioning of the insulation design with a risk of frequent flashovers. It is important to highlight that there are many guides to help to assess the site pollution severity of any service environment even if they are not standardized solutions in the IEC. Such not standardized procedures have been used in countries such as Iran (by the Niroo Research Institute) [
28] and China (by the State Grid and Southern China Power Grid) [
29].
Another method of insulator pollution characterization [
26] consists of the evaluation of the soluble deposit density through the evaluation of the equivalent salt deposit density (ESDD) and non-soluble deposit density (NSDD) [
11]. Assessing electrically conductive deposits forms a fundamental part of these studies, and the selection of leakage distance based on measuring equivalent salt deposit density (ESDD) is well established. ESDD represents the amount of sodium chloride (NaCl) that, when dissolved in demineralized water, gives the same volume conductivity as that of the natural deposit removed from a given surface of the insulator divided by the area of this surface, generally expressed in mg/cm
2. Hence, according to the definition of ESDD given by IEC/TS 60815-1 [
4], this parameter indicates a fictitious equivalent mass corresponding to the amount of equivalent NaCl that gives the same conductivity as the sample. Therefore, in this paper, the term SDD (salt deposit density) is also used to indicate the real mass of the conductive inorganic ionic fraction (characterized by means of ion chromatography) present in the deposit. The real chemical composition of ESDD will be shown in
Section 3.2.
The IEC 60815 also calls for an estimate of non-soluble deposit density (NSDD) in the accumulated pollution. If the ESDD contribution to the flashover mechanism is known, the NSDD role is still quite unclear. NSDD represents the amount of non-soluble residue removed from a given surface of the insulator divided by the area of this surface, generally expressed in mg/cm
2 [
4].
According to this, site pollution severity (SPS) is defined as the maximum value of ESDD/NSDD recorded over an appropriate period of time. Consequently, the SPS class classifies the pollution severity at a site, from very light to very heavy, as a function of the SPS.
However, despite the aforementioned guidelines and the scientific literature on aerosol pollution–insulator interaction, up to now, to the authors’ knowledge, a full investigation of the aerosol chemical properties, phase transitions, and electrical effects on insulators is lacking.
For this purpose, the present paper aims at experimentally analyzing the chemical composition of both ESDD and NSDD in Italy together with the consequent DRH and CRH values and relationship with the conductance of the aerosol deposit on insulators to identify the possible criticalities relating to flashover events in Italy.
2. Materials and Methods
2.1. Sampling Campaigns
A monitoring campaign was carried out from 2016 to 2019, collecting aerosol deposit samples from insulators located on high-voltage lines in the whole of Italy (the specification of the scheduled time of the sampling campaign is shown in
Supplementary Materials, Table S1). For this purpose, 65 cap-and-pin glass insulator strings (
Figure 1) (producer: Sediver S.p.A.) were installed by Terna S.p.A. at a mean height of 16 m above the ground on 150 kV lattice towers uniformly located in Italy as reported in
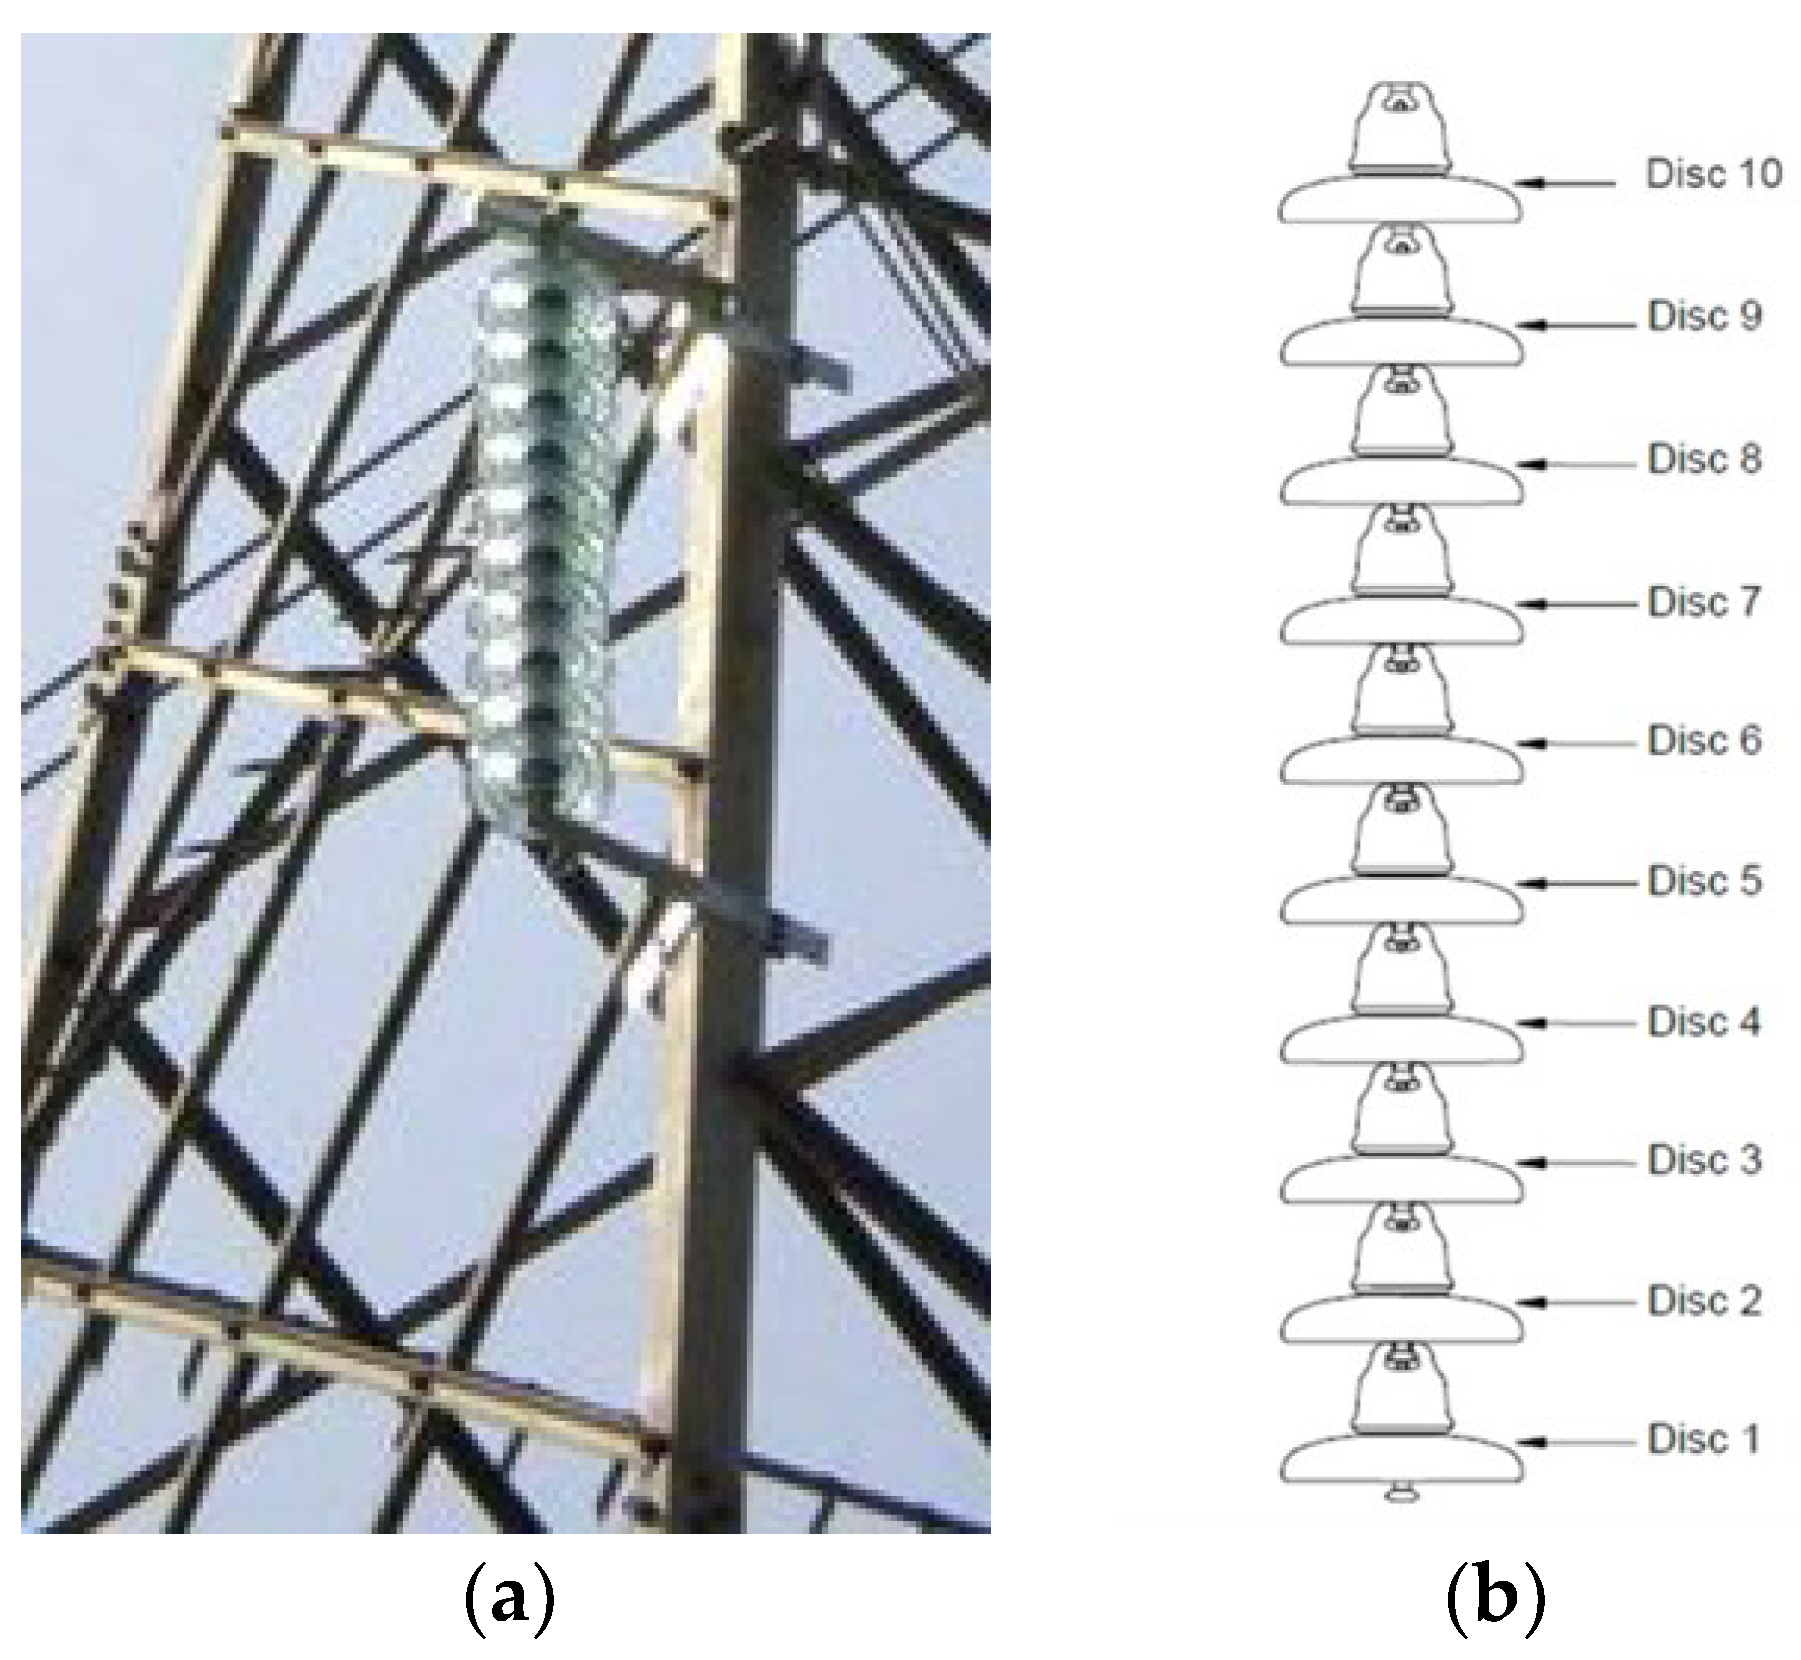
Figure 2. The 65 insulator strings were deliberately unenergized and installed some meters below the lower phase conductor in order to avoid line outages for contamination sampling on the insulator surfaces. Each insulator string was composed of 10 cap-and-pin insulators.
From a temporal point of view, the monitoring campaign was divided into 8 sampling campaigns. In this work, for each sampling campaign, one insulator per string was used for the collection of the contamination in its glass surfaces. The first sampling campaign started with the second insulator in the string from the top. In the second sampling campaign, the third insulator in the string was used, and so on up to the eighth sampling campaign in which the ninth insulator was used. The first and the last (the tenth) insulators in the strings were deliberately not used in order to avoid side effects in the contamination collection. Each sampling campaign was performed maintaining three months of time lag between two consecutive sampling campaigns. Thus, the monitoring campaign lasted two years with the aim of collecting seasonal effects as well.
For each campaign, both the ESDD and the NSDD were determined. The results are discussed in
Section 3.1 while, in
Section 2.2, the ESDD and NSDD methodological determination is presented.
From a spatial point of view, due to the fact that Italy is constituted by a peninsula and islands and that along the peninsula, the Apennines chain divides Italy from north to south into two parts that face two major seas of the Mediterranean, the Adriatic on the eastern side and the Tyrrhenian-Ionic on the southwestern side site, the authors decided to group the 65 insulator strings into three macroregions: MR1 (islands, Sicily and Sardinia), MR2 (mainly the western peninsula), and MR3 (the eastern peninsula), as shown in
Figure 1.
2.2. Deposit Collection, ESDD, and NSDD Measurements
The IEC/TS 60815-1 guideline was taken into account as a procedure reference for sampling and ESDD and NSDD determination.
The sampling procedure was based on the swabbing technique, in accordance with the aforementioned guideline. In this respect, a plastic container of 1 l was filled with distilled water (conductivity <0.001 S/m), and a sponge was immersed in the water. Therefore, before sampling, the sponge was cleaned with the same distilled water; then, the pollutant deposit layer was wiped off from the area of the insulator surface with the squeezed sponge. The sponge with collected aerosol was then put back into the container, and the aerosol was dispersed into the water solution by shaking and squeezing the sponge in the water. The quantity of water did not change before and after the sampling activity.
After the sampling, the 60815-1 guidelines [
4] were also followed for the determination of both the ESDD and NSDD values.
The ESDD determination is based on conductivity measurements that, together with the temperature of the water containing the dispersed aerosol, were recorded. The measurements were carried out after stirring the water solution. A short stirring time, e.g., a few minutes, is required for high-solubility pollutants. The low-solubility pollutants generally require longer stirring time, e.g., 30–40 min.
The conductivity correction is based on Equations (1) and (2); Equations (3) and (4) were used for determining the ESDD on the insulator surface [
4]:
where
- -
θ is the solution temperature (°C);
- -
σθ is the volume conductivity at a temperature of θ °C (S/m);
- -
b is the factor depending on the temperature of θ;
- -
σ20 is the volume conductivity at a temperature of 20 °C (S/m);
- -
Sa is the salinity expressed in kg/m3;
- -
ESDD is the equivalent salt deposit density (mg/cm2);
- -
V is the volume of distilled water (cm3); and
- -
A is the area of the insulator surface for collecting atmospheric aerosol (cm2).
After measuring the ESDD, the water containing the collected aerosol was filtered out by using a funnel and pre-dried and weighed glass filter paper (grade GF/A 1.6 μm from the first to the seventh campaign) and quartz filter (grade QZ/A 1.6 μm) for the final 8th sampling campaign; this was carried out to improve the knowledge of the chemical composition of the NSDD by thermically analyzing it, thus requiring quartz filters for their stability up to 900 °C (see
Section 2.4 for further details). The filters retaining the non-soluble aerosol fraction were dried (40 °C for 3 h) and then weighed (Precisa Gravimetrics AG, Dietikon, Switzerland, mod. 204A, f.s. 240 g, resolution 0.1 mg).
The NSDD was then determined following Equation (5) [
4]:
where
NSDD is the non-soluble material deposit density (mg/cm2);
Wf is the weight of the filter paper containing non-soluble material under dry conditions (after the filtering, the filter was dried at 40 °C for 3 h) (g);
Wi is the initial weight of the filter paper under dry conditions (g); and
A is the area of the insulator surface for collecting pollutants (cm2).
2.3. Chemical Characterization of ESDD
A quantitative chemical analysis was performed on the ESDD solutions as they play the major role (when in solution) in reducing the insulator electrical surface resistance and making any water layer electrically conductive. The analysis is useful in order to identify the chemical nature of the soluble salts responsible for the ESDD values. The chemical analysis of soluble salts was conducted by using solutions only from the sixth sampling campaign onward (i.e., sixth seventh, and eighth sampling campaigns, see
Table 1) as it represented the starting time of the present research study. The solutions of the previous five sampling campaigns (from the first to the fifth) were discarded after ESDD and NSDD measurements.
In order to chemically characterize the ESDD, a coupled ion chromatography system (Dionex ICS-90 and ICS-2000) was employed to analyze the ionic inorganic fraction. Firstly, samples were homogenized with a 20 min ultrasonic bath. Prior to analysis, the solutions were filtered (0.45 μm PTFE membrane, 15 mm Syringe Filters, Alltech, Nicholasville, KY, USA) to remove any possible solid particles in suspension that would damage the chromatographic system. The ICS2000 and ICS90 were equipped with an AS3000 Autosampler. Anions (F−, Cl−, NO3−, SO42−, PO43−) were analyzed with a Dionex Ion Pac AG11 (4 × 50 mm) and AS11 (4 × 250 mm) Guard and Analytical columns in a gradient elution, from 0.1 to 50 mM of KOH (KOH EGC II cartridge) at a flow rate of 0.8 mL/min. The electrical signal of the eluent was lowered by means of a chemical suppressor (Dionex AMMS III 2 mm MicroMembrane Suppressor, regenerant solution: H2SO4, 0.05 M, Fluka 84720). Cations (Na+, NH4+, K+, Mg2+, Ca2+) were analyzed with a CG12A-5 μm and CS12A-5 μm Guard and analytical columns by an isocratic elution of MSA (methanesulfonic acid, CH3SO3H, 20 mM, Fluka 64280) at a flow rate of 0.5 mL/min. Also in this case, the signal of the eluent was reduced with a chemical suppressor (Dionex CMMS III 4 mm MicroMembrane Suppressor, regenerant solution: tetrabutylammonium hydroxide, TBA-OH, 0.1 M, Fluka).
The quantification was performed using the external standard method. For inorganic ions, single liquid standards were used (1000 g L−1, Fluka, Sigma-Aldrich, St. Louis, MO, USA).
The methodology used is described and validated in [
8,
13,
14] and presented as a percentage accuracy, over the whole dynamic range of calibration from 100 μg mL
−1 to 0.010 μg mL
−1, respectively, by 4.8% (Na
+), 2.8% (NH
4+), 2.7% (K
+), 3.8% (Mg
2+), 6.1% (Ca
2+), 0.7% (F
−), 0.9% (Cl
−), 0.9% (NO
3−), 2.7% (SO
42−), and 6.1% (PO
43−).
2.4. NSDD Characterization
NSDD collected over filters (as detailed in
Section 2.2) was first analyzed for the carbon content. As stated in
Section 1, it is known that BC could potentially decrease the resistivity, making its determination important for the deposit characterization. Therefore, the analysis of the concentration of the Total Carbon (TC) and black carbon (BC) fractions was carried out using a total carbon analyzer (Model TCA08 Total Carbon Aerosol Analyzer, Magee Scientific) coupled to an optical transmissometer (“SootScan™” Model OT21 Optical Transmissometer, Aerosol d.o.o.) on the filters of the 8th sampling campaign; as reported below, the TC determination is based on combustion at 700 °C, leading to the opportunity to perform it only on the quartz fiber filters of the last sampling campaign.
The BC fraction was measured by means of the optical transmissometer as reported by Chow et al. [
30]. It uses a non-destructive method by measuring the attenuation of transmitted light through each sample (and compared to an analogous measurement relating to a blank filter) at a wavelength of 370 nm (UV) and 880 nm (IR). The attenuation is experimentally determined as follows (Equation (6)):
where
Due to the high concentration of crustal material on the deposit (see
Section 2.5 and
Section 3.3), a correction of the measured ATN was necessary in order to obtain the ATN value only due to the presence of BC (ATN
BC) and not to the presence of other absorbing material (e.g., crustal iron oxides). Thus, the final ATN
BC value was calculated as follows (Equation (7)):
where ATN
pre-TCA is the ATN value measured before TCA analysis and ATN
post-TCA is the ATN value measured after TCA analysis when all the carbonaceous material is removed. An example of an NSDD filter is shown in
Supplementary Materials, Figure S1.
The BC mass concentration was then calculated following Equation (8) based on the attenuation coefficient (b
atn, Mm
−1) of the deposit on the filter surface [
30]:
where
A is the exposed surface of the filter (m2) equal to 0.00096 m2. This value is the result of the average value of different filter diameters measured by means of a caliber (35.77 mm).
V is the volume of analyzed fluid (m3).
ATNBC is the attenuation related to the BC fraction only.
σatn is the mass attenuation cross section of BC (10 m2 g−1).
The TC fraction was measured by means of a total carbon analyzer as aforementioned. It uses a destructive method based on the combustion of all carbonaceous compounds deposited on the filter. The combustion produces carbon dioxide, which is detected by a Li-Cor detector inside the TCA, which has the task of integrating the peaks of CO2 and providing the amount of TC on the filter.
For this analysis, a 12 mm spot was derived from each filter, and the obtained TC was obtained with a proportion of the total filter area.
Lastly, the water-insoluble organic matter (WINSOM) and unknown fraction (UF) were determined.
In particular, the WINSOM represents the fraction of organic material that (being present on the NSDD filter) was water insoluble; it was determined as follows (Equation (9)):
where
C
f is the multiplication factor pointed out by Turpin and Lim [
31] for the calculation of the organic material of aged aerosols. C
f is study specific and therefore, for the purpose of the present analysis, this factor was experimentally determined by determining the loss of mass of the filter pre- and post-combustion and resulting on average in a C
f equal to 3.2 ± 0.8.
At the end of the carbonaceous analysis, the mass of the residual NSDD (unknown fraction: UFNSDD) was determined. The UFNSDD was determined by a gravimetric method, subtracting the mass of BC + WINSOM from the mass of NSDD of each site. This fraction can be explained by terrigenous components (alkali and alkaline-earth metal oxides) as suggested by XRF analysis (see
Section 2.5 and
Section 3.3).
2.5. XRF Analysis of the UFNSDD
Energy dispersive X-ray micro-fluorescence analysis (ED-µ-XRF) was performed by means of a Bruker M4 Tornado spectrometer equipped with Rh-source. Analysis was carried out directly on the collection substrates. In more detail, the analysis were performed on the smaller 12 mm areas, which underwent TCA analysis, without any further manipulation, using the following power parameters: V = 50 kV and I = 200 µA. Deadtime of the detector was maintained always below 10%, in order to limit pulse pile-up effects. Each sample was analyzed on a square area of 8 × 8 mm, with a spatial resolution of 20 µm and three measurement integrations. Quantification of elements was performed in standardless mode, after suitable energy calibration was carried out on Zr standard over the entire energy range of interest (0–40 keV). All elements with atomic weight higher than Sodium (Z > 11) were detected and quantified.
2.6. DRH, CRH, and Related Electric Effect Determination
Both the DRH and CRH and the related phase transitions of the aerosol deposit of each macroregion (MR1, MR2, and MR3) were identified by means of gravimetric hygroscopic determination together with measurements of the corresponding electrical effect in terms of conductance.
All these measurements required two steps: (1) the sample preparation and deposition and (2) the use of a specifically designed aerosol exposure chamber (AEC).
In order to investigate the phase transition of the aerosol deposit in each macroregion, pure saline aerosols were generated by means of the Aerosol Generator ATM 220 (Topas GmbH) from aqueous solutions. Some salts were investigated, namely: ammonium sulfate (AS: (NH4)2SO4, VWR International S.r.l.), ammonium nitrate (AN: NH4NO3, VWR International S.r.l.), sodium chloride (SC: NaCl, Sigma-Aldrich), sodium sulfate (SS: Na2SO4, Sigma-Aldrich), sodium nitrate (SN: NaNO3, Laboratoriumdiscounter), calcium sulfate dihydrate (CS: CaSO4·2H2O, VWR International S.r.l.), calcium nitrate tetrahydrate (CN: Ca(NO3)2·4H2O, Laboratoriumdiscounter), potassium dihydrogen phosphate (KDP: KH2PO4, Laboratoriumdisciunter), potassium sulfate anhydrous (PS: K2SO4, VWR International S.r.l.), and magnesium chloride hexahydrate (MC: MgCl2·6H2O, VWR International S.r.l.).
The starting solution was prepared at 10,000 ppm, with a composition similar to those of each macroregion (the theoretical and the real composition for MR1, MR2, and MR3 are shown in
Supplementary Materials, Figure S2). Saline aerosol was generated into a mini-AEC (50 L volume, TEFLON
® FEP type 200 A, thickness 50 μm), as shown in the schematic in
Figure 3 following the methodology validated and reported in [
2]. The generated aerosol was collected on a PTFE filter (Ø = 47 mm, porosity 2 μm) by means of a Mega System pump with a flux of 20 L/min.
The PTFE filters (after aerosol collection) were used for the gravimetric DRH-CRH determination (see below).
In addition, in order to carry out the conductivity measurements, a specific calcium-sodium tempered glass specimen (5 × 5 cm) simulating the insulator surface was used as a standard for the Italian system. The glass specimen presents two conductive silver bands with a width of 0.4 cm and a length of 3 cm, placed 1 cm apart, as reported in
Figure 4.
Even for the glass specimen, a saline mix, prepared according to the ionic composition resulting from the analysis of the deposit on the insulator surface, was deposited upon the calcium-sodium samples. This saline mix was deposited via a rotating impactor as reported in [
32] with an amount of kaolin proportional to the NSDD mass to simulate the presence of the crustal material (black carbon was negligible in the chemical analysis results;
Section 3.3).
Both the PTFE filters and the glass specimen behavior in relation to the RH were analyzed in the AEC [
13,
19]. The AEC is a sealed 1 m
3 glass chamber in which the samples are exposed to humidification and dehumidification cycles, from 20 to 90% RH and vice versa, with RH steps of 2%. The RH is varied inside the chamber by phasing ultrapure water vapor (Milli-Q
®; 18.2 MΩ ∙ cm at 25 °C) into the AEC during humidification; conversely, during dehumidification, pre-filtered pure air was phased in to reduce the RH (Aria Zero
®, Sapio, Monza, Italy).
In order to carry out the gravimetric measures, a precision analytical balance (Sartorius SE-2F; accuracy ±0.1 μg) was placed into the AEC to record the rising (falling) mass measurements for each PTFE-sampled filter while varying the relative humidity.
At the same time, conductance measurements were obtained. Within the AEC, up to 6 samples can be housed at a time, in specifically designed PTFE filter holders. Each support is provided with a pair of electrodes that allows the measurement of the electrical resistance of the deposit at each RH step. The electrical measurements were performed with a multimeter (Hewlett-Packard-Agilent 3421A Data Acquisition Unit); data were sent to a PC and their processing was carried out using software created in LabView, which allowed the recording of resistance and conductivity measurements for each RH step established by the operator. During the humidification phase, the hygroscopic components of the deposit promote water uptake and a steep increase in the samples’ conductance can be observed in correspondence to the deliquescence of water-soluble compounds, because of the formation of a conductive electrolytic solution. On the contrary, during dehumidification, when a strong decrease in conductance is measured, the crystallization of water-soluble compounds occurs [
2].
The experiments were carried out at a fixed temperature (10, 22, 30 °C) for the entire duration of the cycle; no temperature fluctuations above 1 °C were recorded. Temperature and relative humidity were monitored by means of a thermo-hygrometric sensor (DMA572 and DMA672, LSI-LASTEM, with a resolution of 0.25% for RH and 0.035 °C for temperature) during the whole cycle.
Figure 5 shows a picture and the scheme of the chamber.
The deliquescence and crystallization regions were determined according to the gradient method [
13,
19]. The variation of water mass’ derivative as a function of RH was studied, identifying three key points: the beginning of the process (start: “s”), the maximum gradient of the derivative (gradient: “g”), and the end of the process (end: “e”).
2.7. Statistical Approach
All the data obtained from the application of the methods described in the previous sections were handled according to the following statistical indicators:
The minimum–maximum range was employed as a descriptive tool for ESDD and NSDD given their substantially high variability across Italy’s geographical regions; this approach effectively conveys the full range of values, thereby illuminating the significant heterogeneity present.
Percentile indexes were introduced to enrich the statistical insights of the aforementioned minimum–maximum ranges of ESDD and NSDD values, providing a more detailed perspective on their distribution.
Mean values and the confidence interval at 95% probability were employed to compare chemical and electrical data among different macroregions of Italy; this approach allowed us to underline statistically significant differences at a 95% confidence level, reinforcing the statistical rigor of the data analysis.
3. Results and Discussion
3.1. ESDD and NSDD Evaluation
The variational range of ESDD and NSDD, expressed in mg cm
−2, of the monitoring campaign carried out from 2016 to 2019 is shown in
Table 1. These values represent the minimum and maximum surface deposit of the soluble and non-soluble fraction accumulated on the total insulator surface (1585.33 cm
2) that can be found from regular measurements over a two-year period in Italy.
The minimum values of ESDD recorded during the whole campaign range from 0.007 to 0.029 mg cm−2 for MR1, from 0.005 to 0.014 mg cm−2 for MR2, and from 0.004 to 0.006 mg cm−2 for MR3; while the maximum values range from 0.088 to 0.227 mg cm−2, from 0.052 to 0.236 mg cm−2, and from 0.020 to 0.084 mg cm−2 for MR1, MR2, and MR3, respectively. The corresponding minimum values of NSDD vary from 0.003 to 0.012 mg cm−2 for MR1, from 0.002 to 0.006 mg cm−2 for MR2, and from 0.001 to 0.004 mg cm−2 for MR3; conversely, the maximum variation of NSDD was 0.044–0.312 mg cm−2, 0.025–0.116 mg cm−2, and 0.014–0.110 mg cm−2 for the three MRs. It emerges that the highest values, for both ESDD and NSDD, were mostly associated with MR1 (Sardinia and Sicily), markedly characterized by marine pollution and possible transport of material from the close African Sahara Desert. Indeed, the 25th, 50th, and 75th percentile values of ESDD and NSDD, respectively, for Sardinia and Sicily, were 0.032, 0.051, 0.125 mg cm−2 and 0.034, 0.063, 0.100 mg cm−2 for ESDD, and 0.019, 0.046, 0.109 mg cm−2 and 0.018, 0.033, 0.080 mg cm−2 for NSDD.
By contrast, both ESDD and NSDD decrease going northeast toward MR2 and MR3, which presented the lowest values, underlying the reliability of macroregion definitions on the basis of the geographical features of Italy (the statistical indexes and the 25th, 50th, and 75th percentile values for the three MRs of ESDD and NSDD are shown in
Supplementary Materials, Figure S3).
The aforementioned data are in line with observed ESDD and NSDD deposition in Shantou, China, where Lu et al. [
33] found values between 0.032 and 0.083 mg cm
−2 and between 0.026 and0.3046 mg cm
−2, respectively, for ESDD and NSDD for a two-year-long natural pollution deposit on 220 kV lines; a similar comparison can be made with the ESDD values measured in the inland area of Japan [
34] for an exposure period of more than one and a half years: their maximum values ranged between 0.0032 and 0.0052 mg cm
−2 and 0.0116–0.0126 mg cm
−2, respectively, on top and bottom insulator surfaces [
34]. Referring to these values, Italy shows the lowest hazard compared to the Shantou area and an analogous one compared to the inland area of Japan. The level of pollution could be affected by different factors, such the meteorological conditions and the geographical environment. For example, Castro et al. [
35] measured the pollution class, using ANSI52-3 insulators for exposure periods of two, six, and twelve months, considering five substations in Barranquilla, Colombia, and they found that rainfall affects the insulator’s surface contamination markedly. Wang et al. [
36] carried out a multi-year sampling campaign on a similar number of samples in five different areas (i.e., the coastal region, the highway region, the suburb region, the mountain region, and the urban region), and they found that the geographical environment has an impact on the pollution: the contamination of the coastal region is the heaviest and the mountain region the lightest, in keeping with the aforementioned results from Italy. In fact, considering the topographical features of the Italian peninsula, MR1, which includes the islands of Sardinia and Sicily, showed the highest contamination values in line with the type of environment characterizing these specific regions, marked by marine inflows; while MR3, which includes the Po Valley and the eastern peninsula, shows the lowest contamination values. MR2, which includes the southwestern peninsula, shows contamination values between MR1 and MR3, with the highest values in the southern regions (i.e., Calabria ESDD ranges from 0.006 to 0.236 mg cm
−2, and from 0.003 to 0.094 mg cm
−2 for NSDD; Puglia from 0.005 to 0.179 mg cm
−2 (ESDD) and from 0.004 to 0.116 mg cm
−2 (NSDD); Campania from 0.008 to 0.137 mg cm
−2 (ESDD) and from 0.005 to 0.070 mg cm
−2 (NSDD)).
3.2. Chemical Composition
3.2.1. Chemical Composition of ESDD
Using the methodology described in
Section 2.3, the concentrations of inorganic ions were determined for the ESDD solutions obtained from the sixth, seventh, and eighth sampling campaigns. In addition to them, seven blank field samples were analyzed, which were blanks of the sponging procedure to test the accuracy of the analytical results.
Table 2 shows the relative contribution of each ion to the total (more details of the inorganic ionic composition are shown in
Supplementary Material, Table S2–S5 and in Figure S4). The results underlined a non-negligible contribution of Na
+ and Cl
− for all three MRs. In particular, the highest values were found in the islands (MR1) while a decrease in their values can be observed moving toward MR2 and MR3, in agreement with the trend of the total ESDD. For MR1, the mean values (± 95% confidence interval) of Na
+ and Cl
− were 12.51 ± 3.30 μg cm
−2 and 20.82 ± 5.89 μg cm
−2. For MR2 and MR3, Na
+ concentration was only 38.5 ± 12.7% and 13.7 ± 4.4% of the values measured in MR1; for Cl
−, the same ratios were 38.4 ± 13.9% and 11.3 ± 4.5%, respectively. Furthermore, large concentrations of Ca
2+ and SO
42− were observed, following the same trend as the previous ions: MR1 showed the highest values, while MR3 was the lowest. The measured values of Ca
2+ and SO
42− for MR1 were 13.47 ± 3.65 µg cm
−2 and 25.27 ± 11.38 µg cm
−2; the same values for MR3 were 1.89 ± 0.34 µg cm
−2 and 1.21 ± 0.19 μg cm
−2. MR2 showed values between MR1 and MR3. Considering the concentration of NO
3, it was the second highest ion, after Cl
−, for MR2 and MR3. It is noteworthy that the sulfate within the overall sulfate plus nitrate [SO
42−/(SO
42− + NO
3−)] [
37] exhibits a decrease from MR1 to MR3. The respective ratios for the three macroregions were 0.82 ± 0.48 µg cm
−2, 0.43 ± 0.10 µg cm
−2, and 0.31 ± 0.07 µg cm
−2. This parameter plays an important role in influencing the behavior of DRH as elucidated in
Section 3.4. Lastly, the contents of NH
4+, F
−, and PO
43− were negligible, accounting for about 1.0 ± 0.5% of the total ionic fraction.
As mentioned above, a large section of the ESDD composition was represented by sodium chloride; especially, the contribution of Na
+ and Cl
− was prevalent in MR1 and MR2 due to the geographical position of the regions included in these macrosectors. A progressive reduction in the contribution of sulfates moving from MR1 to MR3 is observed. Vice versa, it is possible to observe an increase in the contribution of nitrates in keeping with the chemical composition in this region [
2]. A significant contribution is represented by Ca
2+, which was higher for the eighth campaign, especially for MR3.
Some research has already been devoted to the chemical analysis of natural contamination collected on insulator surfaces. Previous research indicated that the pollution constituents of outdoor insulators are various. The aforementioned data, for example, are in line with chemical analysis carried out by Li et al. [
38] and Yunhai et al. [
39] in which Cl
−, NO
3−, SO
42−, Na
+, and Ca
2+ are the main ions of the soluble contamination; especially, SO
42− and Ca
2+ are higher than other ions. He et al. [
40] found analogous results, except for NH
4+, which was abundant because of the closeness to vast tracts of farmland of the sampling electric power line.
The chemical composition of the solution was then expressed in terms of normality (equivalents for unit volume of solution) and related to the measurements of conductivity (expressed in μS cm
−1) performed on each solution and reported at 20 °C (as detailed in
Section 2.2). In this respect,
Figure 6a shows an excellent linear correlation (R
2 > 0.9) between the chemical quantity of charges in solution due to the analyzed inorganic ions and the electrical conductivity measured immediately after the sponging is observed in the three campaigns. In addition to the aforementioned result, according to the Equations reported in the IEC/TS 60815-1 [
4] (detailed in
Section 2.2), the expected conductivity of each sample was also computed, starting from the chemical composition analyzed by ion chromatography and compared with the experimental conductivity measured on the same sample. The results are shown in
Figure 6b, which reports the linear correlation between the measured and the estimated conductivity with a 1:1 ratio, highlighting that the whole ensemble of ionic inorganic fraction (i.e., the real salt deposit density, SDD) is responsible for the whole conductivity, and therefore explains the total equivalent ESDD mass deposit.
The linear correlation between the estimated ESDD (mg cm
−2) and the calculated ESDD (mg cm
−2) of the starting solution was computed, and it is shown in
Supplementary Material Figure S5.
Thus, the total measured ionic content represents the real salt deposit density (SDD) and was on average 94.5 ± 18.8% in weight of the ESDD on the whole of Italy.
3.2.2. Chemical Composition of NSDD
Using the methodology described in
Section 2.4, the chemical composition of non-soluble deposit density (NSDD) was determined for the eighth campaign. As explained in
Section 1, NSDD is mainly made up of dust, sand, clay, and water-insoluble organic material.
Figure 7 shows the total composition (SDD+NSDD) for macroregions 1, 2, and 3. For MR1, the water-soluble fraction represented 46.9 ± 22.0%, while 16.6% ± 12.6% is represented by the carbonaceous fraction (WINSOM+BC) and the remaining 36.5 ± 27.3% is represented by an unknown fraction (UF_NSDD). For MR2, the water-soluble fraction represented 57.6 ± 11.0%, while 13.7% ± 4.4% is represented by the carbonaceous fraction and 28.7 ± 15.3% is represented by the UF_NSDD. MR3 is represented 67.2 ± 14.0% by the water-soluble fraction, 17.7 ± 5.1% by the carbonaceous fraction, and 15.1 ± 8.5% by the unknown fraction.
Previous research has already focused on studying the chemical composition of insoluble aerosol compounds. For example, Yunhai et al. [
39] studied two monitoring points, both next to a highway in South China; they found a value of NSDD of 1.79 × 10
−2 and 9.70 × 10
−2 for the two sampling points. The insoluble contamination of both monitoring points is mainly made up of SiO
2, Fe
2O
3, CuO, Al
2O
3, Pb, CaSO
4, and CaO. These results are in agreement with the composition of insoluble contamination measured by He et al. [
40] in China. They found a great amount of SiO
2, followed by Al
2O
3, Fe
2O
3, CaSO
4, and CaO. According to the aforementioned literature, it is reasonable to assume that the unknown fraction (UF_NSDD) mainly consists of crustal and metallic elements. Hence, to investigate this possibility, the samples were analyzed via energy dispersive X-ray micro-fluorescence analysis (ED-µ-XRF) performed on the smaller 12 mm areas, which underwent TCA analysis, as described in
Section 2.5. The main elements that resulted from XRF analysis were Al, Fe, K, Ca, and Mg with a relative proportion among them of 41.5 ± 2.9%, 16.6 ± 1.6%, 14.6 ± 1.3% and 9.7 ± 2.0%, and 6.5 ± 1.6%, respectively. For the rest (percentage less than 13% in total), the contents were Ti > Zn > Pb > P > Mn > Cr > Cu > S (
Supplementary Material, Table S6), The investigation of the unknown fraction (UF_NSDD) will be a subject of a more in-depth examination in future research endeavors. In the context of this study, the aim is to highlight that the obtained results are consistent with prior literature studies, indicating a crustal origin for the non-carbonaceous fraction of NSDD. This underscores the alignment of the obtained findings with established scientific knowledge.
3.2.3. The Role of Sea-Salt and Non-Sea-Salt Sources
The results obtained and reported in
Figure 6 for all the MRs highlight the presence of a significant contribution of both soluble ion tracers of a sea-spray origin (e.g., Na
+, Cl
−) and of the crustal fraction. Therefore, a preliminary source apportionment was carried out to differentiate the ionic component accordingly by separating the species originating from sea spray and those that do not. The ionic components are in fact responsible for both the hygroscopic (
Section 3.3) and electrical (
Section 3.4) behavior of the aerosol deposit onto the insulators.
Thus, in order to quantify the role of sea spray, Na
+, K
+, Mg
2+, Ca
2+, SO
42−, and Cl
− (which can originate both from sea salt, crustal, and other sources) were apportioned between sea-salt (ss) and non-sea-salt (nss) fractions using a previously developed and validated approach [
41,
42,
43,
44], which is presented in the
Supplementary Materials (Table S7).
Table 3 and
Figure 8 show the results obtained for all the three MRs. From a quantitative point of view (
Table 3), the absolute deposit density values (expressed in μg cm
−2) of the contribution of both ss and nss sources are higher in MR1, followed by MR2 and then MR3. Particularly, the ss fraction in MR1 (18.19 ± 5.31 μg cm
−2) was twice that in MR2 (9.59 ± 1.79 μg cm
−2) and eight times higher compared to MR3 (2.54 ± 0.58 μg cm
−2). The results related to the soluble ion amounts due to sea-spray emission can be explained considering the peculiar geographical features of Italy, characterized by islands (MR1) and a peninsula facing both toward the sea and with important inland areas (e.g., the Po Valley belonging to MR3) as detailed in
Section 2.1. It is noteworthy that the water-soluble ions of nss origin also decreased from MR1 toward MR3. In fact,
Figure 7 highlights that the majority of Na
+, Ca
2+, Cl
−, and SO
42− did not originate strictly from sea salt, but from other sources (e.g., crustal fraction) which affected the overall chemical composition of the investigated deposits for the three MRs. In particular, as shown in
Figure 7, the proportion of ss-Na and ss-Cl appear to be lower in MR1 (7.5 ± 3.6% and 13.3 ± 6.5%, respectively) compared to MR2 (13.8 ± 4.2% and 24.6 ± 7.6%, respectively), even though MR1 included the islands. On the contrary, the MR1 exhibits a higher contribution from the nss fraction compared to MR2 (75.96 ± 21.5% and 55.47 ± 7.1%, respectively), possibly attributed to both Saharan dust transport events (due to the proximity to Africa) and local dust resuspension. MR2 also exhibited a significant contribution from the nss fraction, but to a lesser extent than MR1. Indeed, a higher percentage contribution of Na
+ and Cl
− can be observed in MR2 for this reason. This can be explained by the fact that these regions are farther from Africa and, therefore, are less prone to dust transport events from the Sahara Desert. These considerations are in keeping with literature figures reported by [
45,
46], which show a frequency of dust events per year ranging between 21 and 34% in the southern region of Italy, 13 and 21% in central Italian regions, and 5 and 10% in the northern ones; moreover, due to its proximity to the source region, Sicily is the Italian region receiving the largest impact of desert dust transport events, with a maximum number of desert dust days per year (over 150) being comparable to the climatological mean values derived in the Canary Islands (Spain), and in Sardinia, approximately three-quarters of the Saharan dust is deposited with precipitation [
47]. These literature data agree with those reported in
Figure 7, showing a marked north-to-south positive nss gradient, in agreement with the results reported by [
48]. In addition to this, Molinaroli et al. [
49] highlighted the importance for the Italian islands (MR1) of the local crust-enriched aerosol source.
All the aforementioned figures are also in keeping with the UF_NSDD data (
Figure 6) and with the elemental analysis presented in
Section 3.2.2.
These quantitative results highlight the need for future dedicated modeling source-related studies (beyond the aim of the present paper) to develop near real-time warnings and preventive cleaning and conservative procedures.
3.3. DRH and CRH
The chemical composition of ESDD showed an ion content that can strongly affect the deposit’s affinity for water, thus enabling it to promote the formation of an electrolytic solution on the insulators’ surface, increasing the hazard related to a decrease in the resistance (or increase in conductance). Thus, the chemical composition of ESDD was replicated and generated in the laboratory as described in
Section 2.5 in order to investigate the phase transition of the aerosol accumulated on insulators and its related electrical effect.
DRH and CRH curves, averaged for the three temperatures (10°, 22°, and 30 °C), determined for macroregions 1, 2, and 3, are shown in
Figure 9 (the humidograms at the three temperatures are shown in the
Supplementary Material, Figure S6). The width of the hysteresis cycle changes depending on the chemical composition of the macroregion and in all cases, the maximum absorption of water vapor is at 90% of relative humidity (2.01 ± 0.26 mg H
2O/mg of deposit).
The deliquescence and crystallization regions were identified according to the method described in
Section 2.5 (DRH and CRH values at the temperature of 10, 22, and 30 °C are shown in the
Supplementary Material, Table S7). MR1 showed the highest values of DRH (DRH range: 64.7 ± 2.9%–73.3 ± 2.9 RH) while MR3 the lowest (DRH range: 55.3 ± 2.9%–64.7 ± 2.9% RH), relating to their chemical composition: the DRH of MR1 is controlled by the great amount of sulfates and vice versa, but the DRH of MR3 is affected by the nitrates. MR2 showed DRH values between MR1 and MR3 (DRH ± RH). In fact, as Potukuchi and Wexler [
37] have pointed out, the sulfate fraction of the whole sulfate plus nitrate [SO
42−/(SO
42− + NO
3−)] enables us to understand the behavior of DRH; particularly, an increase in the sulfate fraction leads to higher DRHs and vice versa.
Also, the CRH depends on chemical composition: MR1 had the highest values of CRH (CRH range: 44.7 ± 2.9%–38.7 ± 2.9% RH), MR3 the lowest (CRH range: 30.7 ± 2.9%–26.0 ± 0.1% RH), and MR2 showed CRH values between MR1 and MR3 (CRH range: 32.7 ± 2.9%–38.0 ± 0.1% RH). In this respect, Martin et al. [
50] pointed out that the presence of metal oxides (i.e., Fe
2O
3, TiO
2) in the aerosol’s particles can lead to a CRH increase of up to 32% more compared to a pure saline aerosol because such oxides can act as crystallization nuclei driving heterogeneous nucleation, which results in crystallization at higher RH values. Furthermore, the presence of organic material can also increase the aerosol’s CRH [
51]. Indeed, the results presented in
Section 3.3 reveal that, for MR1, 16.6 ± 12.6% of the deposition comprises the carbonaceous fraction (WINSOM + BC), while the remaining 36.5 ± 27.3% is attributed to an unknown fraction (UF_NSDD) of likely crustal origin as indicated from ED-µ-XRF measurements. These percentages exhibit a decrease in MR2 (15.8 ± 4.4% and 25.8 ± 15.3%) and MR3 (16.9 ± 5.1% and 15.1 ± 8.5%), consistent with the observed CRH measurements.
These results underline that, in Italy, due to the temporal behavior of the atmospheric RH, the deposits on insulators can be hydrated or not in different conditions in the three MRs. These results are in agreement with the literature findings of previous works on Italy. For example, D’Angelo et al. [
19] reported the wintertime and summertime behavior of the aerosol’s DRH and CRH; they found that the seasonal behavior of sulfate and nitrate fraction affected both DRH and CRH, which were lower in winter (DRH range: 51.6 ± 0.7%–58.5 ± 0.7% RH; CRH range: 48.1 ± 0.5%–44.3 ± 0.6% RH) when nitrates were the most abundant ionic species with respect to summer (DRH range; 68.3 ± 1.0%–72.8 ± 1.0% RH; CRH range: 63.0 ± 1.2%–59.3 ± 1.3% RH) when the water-soluble inorganic fraction was mainly constituted by sulfates. Ferrero et al. [
13] investigated the aerosol deliquescence and crystallization of samples mainly consisting of nitrates, sulfates, and ammonium, where nitrates were approximately five times greater than sulfates; they found DRH values in agreement with those presented in this paper for MR3 (characterized by nitrates > sulfates) with a DRH region between 56.9 ± 1.0% and 64.5 ± 1.0% RH while the CRH region was between 49.9 ± 0.6% and 45.3 ± 0.7%, which differs by 19.2%–19.3% from the CRH values obtained in the present study because of the presence in the samples of organic acids, which can increase the aerosol’s CRH [
51]. Finally, Ferrero et al. [
12] modeled the DRH of the aerosol using E-AIM and ISORROPIA. They found the highest values of DRH for the sampling collected during the cooler period (from March to April 2010) in which the main components were the nitrates; the lowest values of DRH were found for sampling collected during the warmer period (form June to July 2010) in which the main components were the sulfates.
3.4. Deposit Conductivity
All the aforementioned results have important implications for the conductivity that can be present on each insulator in the different MRs. In order to measure the conductivity of the aerosol, calcium-sodium tempered glass specimens (with conductive silver bands at 1 cm) contaminated with the same aerosol composition of each MR were exposed to RH cycles in the AEC as detailed in
Section 2.5.
An increase in the electrical conductivity during the humidification phase was observed, reaching its maximum at 90% RH; conversely, during the dehumidification phase, between DRH and CRH, the conductivity gradually decreases as water evaporates until crystallization occurs. This is shown in
Figure 10, which indicates the 25th, 50th, and 75th percentile of the conductivity for the three MRs at six relevant points: starting and ending points of the deliquescence process (DRH
s, DRH
e), 80% RH, 90% RH, and starting and ending points of the crystallization process (CRH
s, CRH
e).
The conductivity starts to grow at the beginning of the humidification phase, reaching relevant values at the end of the process; it is noteworthy that the 25th, 50th, and 75th percentile values at the DRHe for MR1 were 1.533, 2.388, and 2.919 μS cm−1; in MR2, the statistical indices were 1.640, 2.352, and 4.562 μS cm−1; while in MR3, they were 0.203, 0.297, and 0.375 μS cm−1. The highest values of conductivity were reached when RH > 80% because, after the deposit activation at DRHs below 80%, further condensation occurs, favoring the formation of a continuous layer of electrolyte solution. In particular, the 25th, 50th, and 75th percentiles at 80%RH for MR1 were 2.251, 3.505, and 4.285 μS cm−1; for MR2, the same index values were 3.249, 4.662, and 9.041 μS cm−1; while for MR3, they were 0.686, 1.003, and 1.267 μS cm−1. The maximum values were reached at 90% RH. The statistical index (25th, 50th, and 75th percentiles) in MR1 were 4.055, 6.314, and 7.720 μS cm−1; in MR2, they were 3.717, 5.332, and 10.342 μS cm−1; while in MR3, they were 1.101, 1.608, and 2.032 μS cm−1.
During the dehumidification path, a progressive reduction in conductivity is observed, reaching at the end of the crystallization process values similar to those measured at DRHs. In particular, at the CRHe in MR1, the 25th, 50th, and 75th percentiles were 0.806, 1.255, and 1.535 μS cm−1; in MR2, the same index values were 0.384, 0.552, and 1.070 μS cm−1; while in MR3, they were 0.0010, 0.0014, and 0.0018 μS cm−1.
As reported in
Section 1, atmospheric pollution is among the main natural causes of flashover accidents that threaten the stability of the electrical system [
5] because of its conductive properties, which lead to the formation of a conductive layer on the surface, causing leakage current flow [
6].
The conductivity can be affected by both chemical composition (which directly affects the DRH and CRH values) and the amount of the deposit on the insulator surface: MR1 and MR2 showed the highest values, while MR3 the lowest, relating to the mass concentration (mg cm−2) of aerosol on insulators of the three MRs. The highest values of conductivity (at 90% RH) were recorded for MR1, which presented also the highest mass concentration of aerosol (50th percentile: 0.106 mg cm−2), while the lowest conductivity was recorded for MR3, which showed the lowest mass concentration (50th percentile: 0.019 mg cm−2). MR2 showed a conductivity value between MR1 and MR3, related to the mass concentration, which also ranged between MR1 and MR3 (50th percentile: 0.033 mg cm−2). However, it is noteworthy that the different chemical composition determines a different mobility of ions for each macroregion (even with a similar mass of the deposit).

 ,
, 


