Article

Effects of Warming and Drought Stress on the Coupling of Photosynthesis and Transpiration in Winter Wheat (Triticum aestivum L.)

1
Institute of Farmland Irrigation, Chinese Academy of Agricultural Sciences, Xinxiang 453002, China
2
College of Water Resource and Architecture Engineering, Tarim University, Alar 843300, China
*
Authors to whom correspondence should be addressed.
Appl. Sci. 2023, 13(5), 2759; https://doi.org/10.3390/app13052759
Submission received: 13 January 2023 / Revised: 13 February 2023 / Accepted: 17 February 2023 / Published: 21 February 2023

Abstract

:
The coupling of photosynthesis and transpiration in plant leaves forms the basis of carbon–water coupling in terrestrial ecosystems. Previous studies have attributed the coupling of leaf photosynthesis and transpiration to joint stomata control, but they lack analyses of the coupling mechanism. In this study, winter wheat (Triticum aestivum L.) was selected as a plant material on the North China Plain. Under the conditions of warming and drought stress, the photosynthetic rate (An), transpiration rate (Tr), water pressure saturation (VPD), and leaf temperature (T1) of wheat were recorded on clear days at the jointing, flowering, and grain-filling stages from 9:00 to 12:00 a.m. Then, the measured values were fitted to the simulated values obtained using the Ball–Berry and Penman–Monteith models. The results showed that the stomatal size, stomatal conductance, An, and Tr of winter wheat leaves were decreased by warming, drought stress, and their synergistic effects. Based on the Ball–Berry model, different fitting effects were observed in the treatments of adequate water supply with warming (R-g), water deficit with warming (R-d), adequate water supply without warming (N-g), and water deficit without warming (N-d). The R2 values of the R-g, R-d, N-g, and N-d treatments were 0.962, 0.958, 0.964, and 0.943, respectively. The Tr values were fitted based on the Penman–Monteith model. In the R-g, R-d, N-g, and N-d treatments, the R2 values of the R-g, R-d, N-g, and N-d treatments were 0.923, 0.849, 0.934, and 0.919, respectively. In conclusion, both warming and water deficit reduce stomatal conductance, An, Tr, and the coupling effect of photosynthesis and transpiration.

1. Introduction

The frequency of droughts will significantly increase under climate change, especially in arid/semi-arid regions. Although there are several studies on the effects of water deficit on the water–carbon cycle at different levels of the ecosystem, systematic research on the water–carbon coupling process at different spatial and temporal scales is still scarce. Under water stress, the water conductivity ability of leaves decreased and caused stomatal closure in [1,2]. The stomatal conductance of leaves in crop plants is reduced under drought stress to reduce water loss and improve transpiration efficiency [3]. Deng et al. [4] found that the biomass of plant leaves varies with the degree of water deficit, and the biomass allocation of the farmland system has no obvious response to short-term drought [5]. In addition to the direct effects on plant growth [6], the most affected process is related to photosynthesis [7,8]. The direct effects of drought on photosynthesis are caused by stomatal closure [9] and occur earlier, while the indirect effects are caused by the downregulation of photosynthetic metabolism that occurs under long-term or more severe stress [10,11]. Pradhan et al. [12] suggested that drought, high temperature, and their synergistic stress could reduce the grain yield of spring wheat from seedling emergence to the flowering stage. Drought reduces plants’ morphological and physiological traits, photosynthesis, leaf water potential, and sap movement, mainly due to stomatal closure [13].
The coupling between the leaf An and Tr of plants forms the basis of the coupling between carbon and water in terrestrial ecosystems. Previous studies have attributed the coupling of An and Tr to joint stomata control, but they lack comprehensive analyses of the coupling mechanism. Plants’ stomatal behavior is a complex process regulated by multiple factors. It is influenced by environmental factors such as the temperature, radiation, wind speed, and hydraulic conductivity of plant organs. It has been found that in a short period, stomatal behavior is mainly driven by environmental factors, PAR, Ta, CO2 concentration, and VPD deficit [14,15,16]. It is generally expected that the joint control of stomata to regulate the entry and exit of CO2 and water vapor into and out of leaves is the reason for the formation of An–Tr coupling and the physiological and ecological basis for the coupling of the carbon–water cycle in terrestrial ecosystems [17,18,19]. However, stomata are only one of the biological factors regulating An and Tr. Environmental factors such as light, temperature, and saturated water vapor pressure also have significant effects on An and Tr [20]. Yang et al. [21] concluded that Tr and An have a positive linear correlation, ensuring an excellent linear coupling relationship between photosynthesis and transpiration in the process of diurnal variation. Temperature is another important environmental factor affecting Tr. An increase in temperature increases the diffusion rate of water molecules and promotes Tr. The regression relationship between An and Tr reflects the coupling characteristics of carbon and water in plants to a large extent [22]. Han et al. [23] stated that the main environmental factors (PAR, Ta, and VPD) have a strong driving effect on the An–Tr coupling relationship; when PAR, Ta, and VPD are at high levels, the relationship is destroyed, a certain decoupling phenomenon occurs, and the An–Tr slope becomes smaller.
Tr and An tend to be synchronized because they share common environmental constraints and drivers, and stomatal regulation regulates both processes [24,25]. For example, under conditions of high atmospheric drought, i.e., VPD, stomata nearly inhibit water loss. Under extremely high temperatures and VPD conditions, it was found that even when photosynthetic activity was reduced to near zero, plants continued to evaporate as long as soil water was sufficiently available [26,27]. This behavior can be described as decoupling between An and Tr under heat stress. It is assumed that this is a plant strategy to reduce the adverse effects of excessive temperature on plants by cooling the air temperature above the canopy through evaporation [28]. Low temperature reduces photochemical efficiency, and thus, limits the rate of CO2 assimilation. It can also lead to photoinhibition [29], which affects the quantum yield of photosystem II (PSII) by disrupting the photosynthetic mechanisms of plants [30]. High temperatures will inhibit An [31] and increase respiration [32], making plants vulnerable to heat stress [33]. Thus far, evidence for this uncoupling between An and Tr has come from experiments with individual trees, either through the investigation of inter-material conduction at the leaf scale [34,35] or whole-tree gas exchange [28]. These studies suggest decreased An under extreme temperatures, but a continually rising Tr. Most of these studies report decoupling phenomena involving decreased An and sustained increases in Tr due to drying soils and rising temperatures.
In the Ball–Berry model, leaf stomatal conductance has a linear relationship with An. When the ambient temperature and humidity remain unchanged, this indicates that the stomatal conductance of plant leaves is directly proportional to An and inversely proportional to the difference between the concentrations of CO2 inside and outside the leaf stomata. However, the An of plants has an unknown quantity. To reveal the relationship between leaf stomatal conductance and light intensity, the Ball–Berry model must be coupled with a light response model of plant leaves to obtain the relationship between the two. However, the relationship between stomatal conductance and light intensity varies depending on the coupled light response model [36,37,38,39]. With the continuous development of evapotranspiration research, domestic and foreign scholars have put forward different evapotranspiration estimation models, among which the Penman–Monteith equation is currently recognized as an evapotranspiration estimation model with high accuracy, strong applicability, and high reliability [40]. At present, there are few experiments on the synergistic effects of warming and drought on wheat growth and yield formation. In addition, there are many studies on the diurnal characteristics of An and Tr in the leaves of various crops. However, these studies have not focused on the coupling relationship between warming-induced water deficit and the An and Tr in winter wheat. Further exploration of the coupling mechanism of An and Tr in winter wheat under warming and drought stress conditions also has important implications for understanding the environmental adaptability and productivity of wheat under future climate change. In arid and semi-arid regions, such as the North China Great Plain, soil moisture status plays an important role in crop response to climate change. However, the effects of water supply on stomatal conductance, An, Tr, and the fitting effect of measured and simulated values of wheat under climate change are still unclear. Therefore, we hypothesized that climate warming and drought have effects on crop photosynthesis. To improve the ability of crops to cope with climate change, a winter wheat climate warming and drought stress experiment was conducted using a lysimeter under a rain shelter. Based on the Ball–Berry, Jarvis, and Penman–Monteith models, stomatal conductance, An, and Tr were calculated using three sets of mathematical model formulas, and then, the measured values were observed using an LI-COR 6400XT photosynthometer. The effects of increasing temperature and drought on the stomatal conductance, An, and Tr of winter wheat, and the fitting effect of measured and calculated values of winter wheat, were further studied.

2. Materials and Methods

2.1. Experimental Site

The experiment was conducted from October 2021 to May 2022 using lysimeters under a rain shelter at the Comprehensive Experimental Station of the Chinese Academy of Agricultural Sciences (N35°14′, E113°76′, altitude 74 m), located in Qiliying Town, Xinxiang, China. The site has a warm, temperate, continental climate with an annual average temperature of 14 °C and annual average precipitation of 582 mm. The lysimeter had an area of 3.33 m × 2.0 m, and a soil depth of 1.8 m. The soil was sandy loam with a bulk density of 1.45 g cm−3 and a field capacity (θFC) of 26% (mass basis).

2.2. Experimental Design

A randomized complete block experiment with two temperature levels and two irrigation rates was designed. In total, there were four treatments: R-g: warming of 1.5 °C with sufficient water supply, R-d: warming of 1.5 °C with water deficit, N-g: no warming with sufficient water supply, and N-d: no warming with water deficit. All treatments were replicated six times. The two temperature levels were set as warming at 1.5 °C and non-warming, and the two soil moisture levels as a full water supply (irrigation rate of 45 mm) and water deficit (irrigation rate of 33 mm). An electric infrared heater (model: MRM2420, Kalglo Electronics Co., Inc., Allentown, PA, USA) was adopted for air warming, and comprised an infrared heater and an electronic controller. The infrared heater had a far-infrared heating black-body tube (length of 1.8 m and diameter of 1.8 cm) with a power of 2000 W, an iron bracket, and a white stainless steel reflective cover (length of 2 m and width of 0.2 m). The bracket was fixed in the soil before sowing, and the far-infrared heating tube was suspended using an iron support. The height of the heating tube was adjusted to increase the temperature to around 1.5 °C. A 24-h continuous warming mode was adopted during the winter wheat growing season, and the effective warming area was 2 m2. A no-heating treatment was also provided, with a lampshade used to control and reduce the error of the test factors.
Winter wheat (Triticum aestivum L.) of Zhoumai-22 was sown on 25 October 2021, and harvested on 27 May 2022. For the adequate water treatment, the irrigation rate was 45 mm, and irrigation was performed when the average soil moisture in the 0–60 cm soil layer decreased to 70% of the field capacity (70% θFC); for the water deficit treatment, the irrigation rate was 33 mm, and irrigation was performed when the average soil moisture in the 0–60 cm soil layer decreased to 55% of the field capacity (55% θFC). Soil moisture was measured using the gravimetric method. Winter wheat was sown under the condition of sufficient soil moisture (about 75% θFC) and the row spacing was 0.2 m. There were four drip lines in each lysimeter. The drip line had a diameter of 16 mm, an emitter distance of 0.33 m, and a flow rate of 2.2 L h−1.

3. Measurements

3.1. Photosynthesis and Transpiration

A total of 7 days after irrigation (after 7 days, the water difference between the water deficit treatment and the full water supply was obvious), LI-COR 6400XT (LI-COR Bio-Sciences, Lincoln, NE, USA) photosynthetic apparatus was used to measure leaf An, Tr, and stomatal conductance (gs) at 9:00–11:00 (at this point, the stomata of the wheat leaves were completely open and stable), with a reference CO2 value of 400 umol CO2 mmol−1, and light intensity of 1200 μmol m−2 s−1. Fully developed wheat leaves were taken for measuring.

3.2. Stomatal Morphology of Leaves

After the photosynthesis measurements, leaves were selected for gas exchange measurements, and bright nail polish was applied to the positive and negative sides of the leaves (1 cm2). About 10 min later, part of the epidermis with painted nail polish was taken using tweezers, and then put on a slide and covered with a cover glass. It was then taken back to the laboratory for observation under a microscope (at 200 and 400 times magnification) of the stomatal openings and the number of stomata, respectively. Finally, ImageJ (https://imagej.nih.gov/ij/, accessed on 30 October 2022) was used to calculate the image area, the number of pores, and the density of the pores.

4. Model and Calculation Principle

4.1. Ball–Berry Model

In practice, foliar temperature and relative humidity are not always constant. Considering the influence of these two factors on stomatal conductance, a correction factor should be added. It is assumed that the correction factor is a function of the relative humidity and temperature of leaves, and it is denoted by f ( h s , T 1 ) :
g S = m A n C s f ( h s , T 1 ) + g 0
where h s and T 1 are the relative humidity (%) and temperature of the leaf surface (°C), respectively.
If the leaf surface temperature remains unchanged, only the relative humidity of the leaf surface is changed, and the correction factor is assumed to be:
f ( h s , T 1 ) = h s
By substituting Equation (2) into Equation (1), the mathematical expression of the Ball–Berry stomatal conductance model can be obtained:
g S = m h s A n C s + g 0
Leuning [41] replaced C s in Equation (3) with C s Γ , where C s is the CO2 concentration on the leaf surface and Γ is the CO2 compensation point, which fits better. So, Equation (3) can be rewritten as follows:
g s = m A n C s Γ h s + g 0
Recent experiments have revealed that stomata respond to evaporation requirements more directly than relative air humidity [42]. Combined with the improved Leuning [25]-modified Ball–Berry model, the following equation is proposed:
g s = m A n ( C i Γ ) ( 1 + VPD s VPD 0 ) h s + g 0
where VPD 0 = 1500 Pa, m = 20, and the residual stomatal conductance can simply be measured as the stomatal conductance of non-arid plants under low light during the day or the conductance of photosynthesis close to zero [43].
Among these:
VPD s = VPD a ( 1 g tw g bw )
where VPD a is the water vapor pressure difference (Pa) between cells and the atmosphere; g tw and g bw are the total stomatal conductance and the boundary layer conductance to water vapor (mol·m−2·s−1), respectively, and VPD s is the driving force of transpiration.

4.2. Jarvis Model

The Jarvis stomatal conductance model is based on the response of plant leaf stomatal conductance to a single environmental factor. Additionally, the comprehensive influence of multiple environmental factors on stomatal conductance when they change at the same time can be obtained via superposition. The specific form of the model is as follows:
g s = g s ( PAR ) f ( VPD ) f ( ψ ) f ( T ) f ( C a )
where g s is stomatal conductance (μmol·m−2·s−1); g s ( PAR ) is photosynthetically active radiation (μmol·m−2·s−1), and f ( VPD ) ,   f ( ψ ) ,   f ( T ) ,   and   f ( C a ) are the effects of saturated water vapor pressure difference (kPa), leaf water potential (kPa), temperature (°C), and CO2 concentration (µmol·mol−1) on stomatal conductance at leaf temperature, respectively.
The influence function in the Jarvis model is:
g s ( PAR ) = PAR a + PAR
f ( VPD ) = 1 b + VPD
f ( T ) = cT 2
f ( C a ) = 1 dC a
where f ( ψ ) can be neglected [44].
In Equations (8)–(11), a, b, c, and d are model parameters with values of 134.165, −0.461, 0.002, and 0.002, respectively (the simulation results are better under this parameter) [45]. By substituting Equations (8)–(11) into Equation (7), the expression of the Jarvis model can be obtained as follows:
g s = PAR   cT 2 ( 1 dC a ) ( a + PAR ) ( b + VPD )

4.3. Penman–Monteith Model

Penman’s model formula is:
λ E g = ε R n + ρ a ( C p r ) DG a ε + 1 + G a G c
where ε = s r ; s is the slope of the function of water vapor pressure deficit and temperature (kPa·K−1); r is the dry and wet table constant (kPa·K−1); Rn is the net radiation absorbed by the canopy (MJm−2h−1); ρ a is air density (kg·m−3); C p is the specific heat of dry air at constant pressure (Jkg−1k−1); D is water vapor pressure deficit (kPa); G a is aerodynamic conductance (ms−1); G c is canopy conductance (ms−1); λ is the latent heat of vaporization (2.45 MJ·kg−1), and E g is canopy transpiration (kg·m−2·s−1).
The final model of canopy stomatal conductance was deduced as [46]:
g s = E g 18 LAI e ρ w g v T + 273 ρ a VPD
where E g is the canopy transpiration rate (kg·m−2·s−1); g v is the gas constant of water (0.462 kPa·m3·kg−1·k−1) [46]; ρ w is the water density (998 kg/m3); ρ a is the air density (1.29 kg/m3), and VPD is the saturated vapor pressure difference (kPa). The unit of stomatal conductance is mmol·m−2·s−1.

4.4. Model Calibration and Validation

Firstly, stomatal conductance, photosynthetic rate, and transpiration rate were calculated using the above three models, and then, verified using the measured values. The statistical parameters used to evaluate the fitness of the model and the measured data are the root mean square error (RMSE) and the coefficient of determination (R2), calculated as follows:
R M S E = 1 n i = 1 n ( S i O i ) 2
R 2 = ( i = 1 n ( O i O ¯ ) ( S i S ¯ ) i = 1 n ( O i O ¯ ) 2 i = 1 n ( S i S ¯ ) 2 ) 2
where O i and S i are the observed and simulated values, O ¯ and S ¯ are the average observed and simulated values, and n is the number of observations. The model’s performance is considered satisfactory when the values of RMSE are close to 0 and those of R2 are close to 1.

4.5. Statistical Analysis

For the response curve data to go through the intake software, Microsoft Excel 2010 was used for data collation and mapping, the DPS V13.5 (http://www.dpsw.cn accessed on 1 August 2022) software data processing system was used for statistical analysis to determine the differences between different treatments, and Duncan’s multiple comparison test was used to determine significance (p < 0.05).

5. Results

5.1. Effects of Warming and Drought Stress on Stomatal Morphology of Winter Wheat Leaves

Figure 1 shows the stomatal structure of winter wheat leaves under different treatments. Under the same field of view, R-g has 15.6% more stomata than R-d, while N-g has 21.6% more stomata than the N-d treatment. The stomatal densities of R-g, R-d, N-g, and N-d are 72.6, 62.8, 69.9, and 57.5/mm2, respectively. The results show that the stomatal numbers and densities decreased under warming and drought stress.

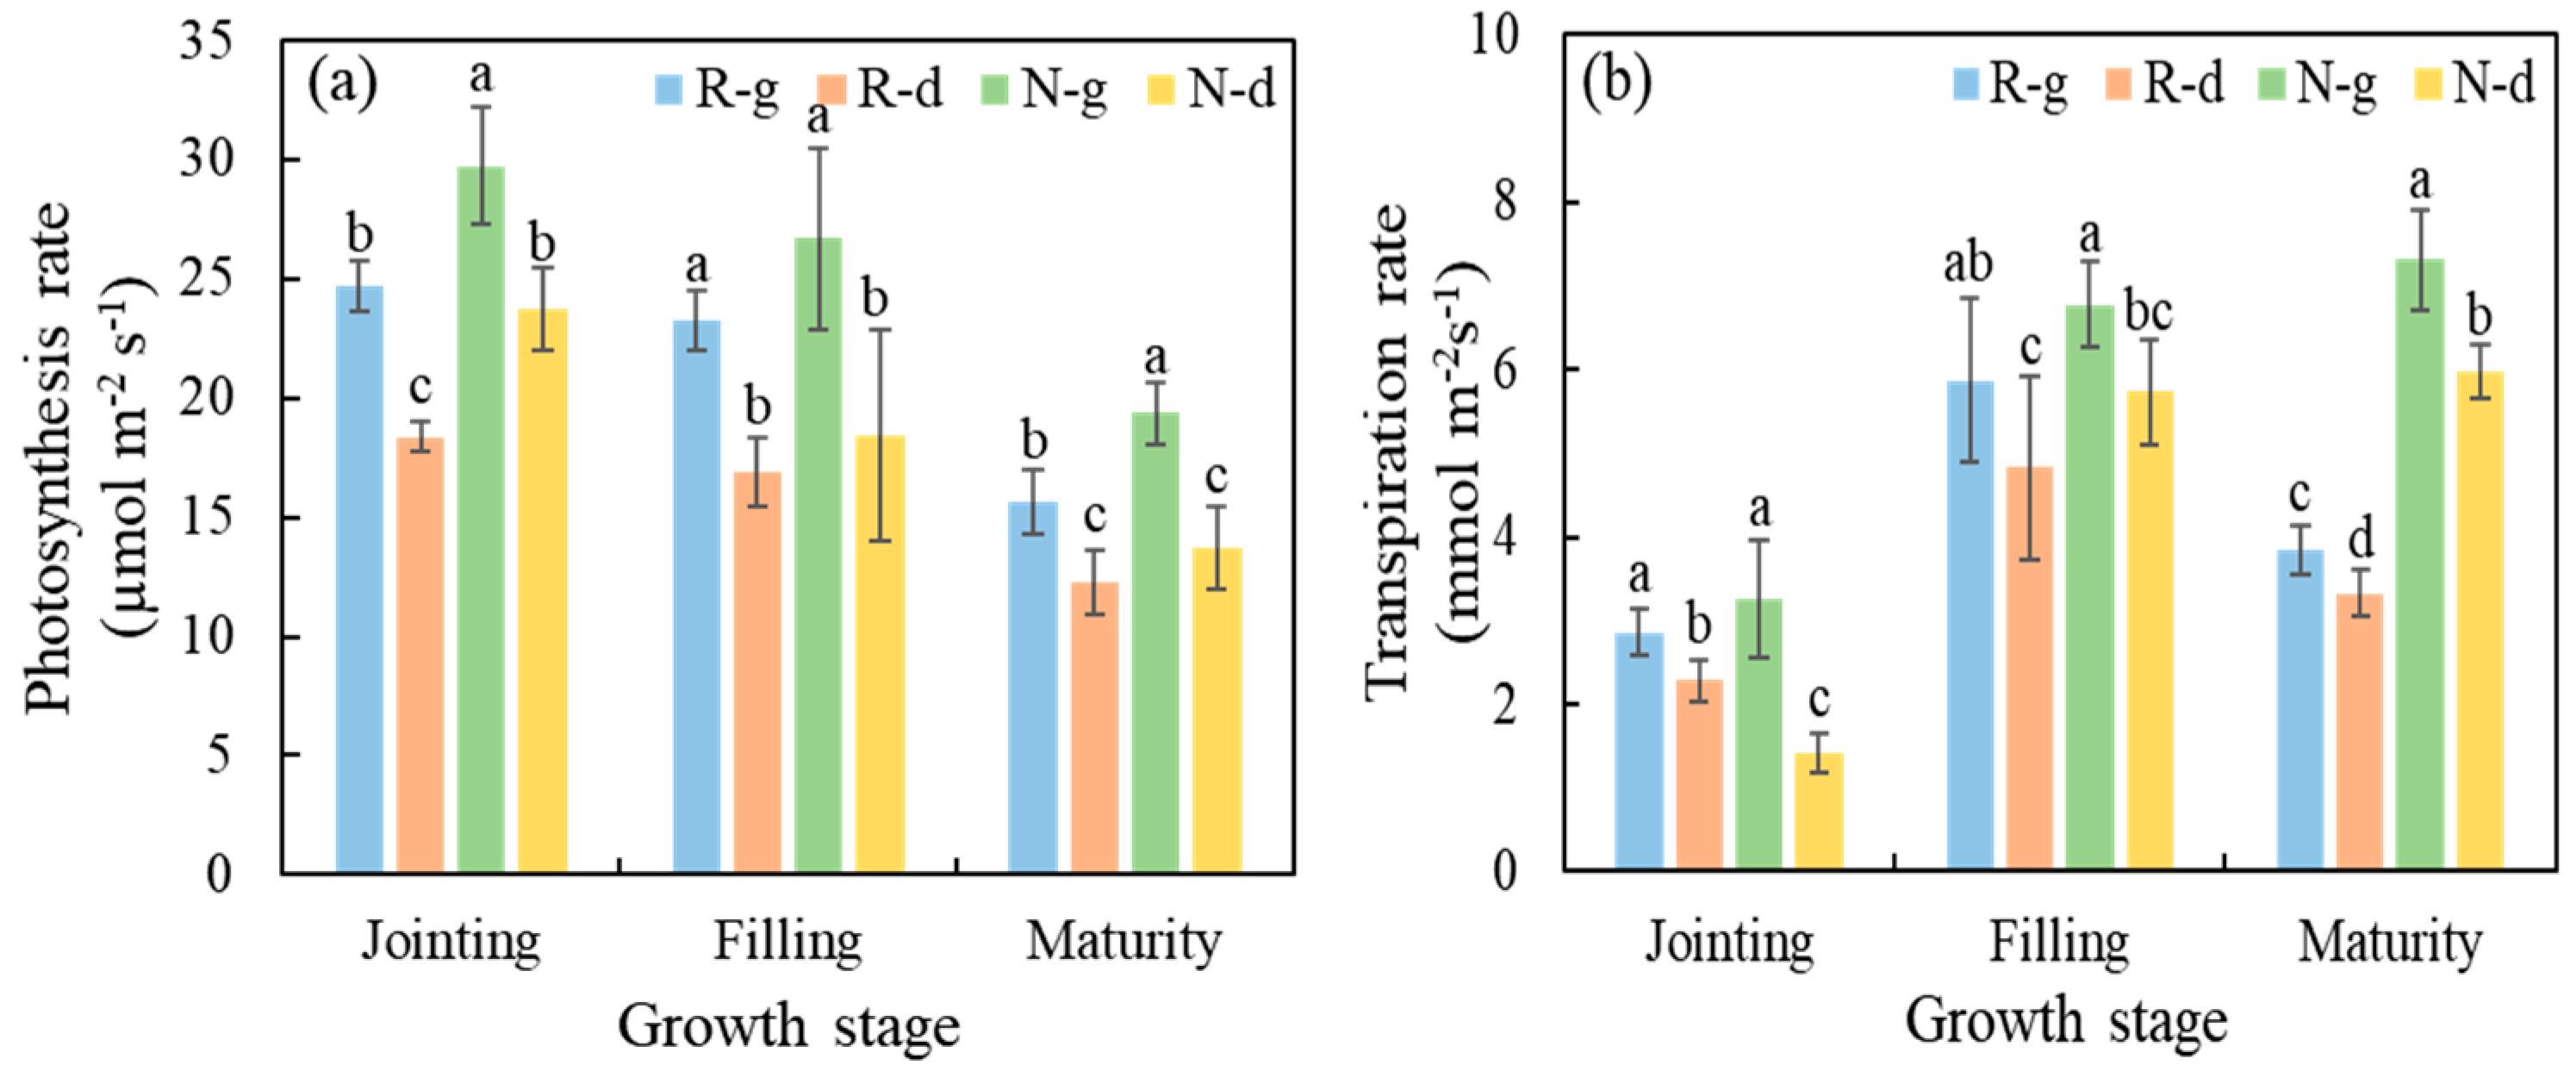
5.2. Effects of Warming and Drought Stress on Stomatal Conductance, Photosynthetic Rate, and Transpiration Rate of Winter Wheat

Figure 2 shows the differences in stomatal conductance among the four treatments of winter wheat at the jointing, grain-filling, and mature stages. Under the same temperature conditions, R-g is 29.2%, 3.4%, and 7.7% higher than R-d, while N-g is 54.9%, 11.9%, and 42.5% higher than N-d at the jointing, grain-filling, and mature stages, respectively. Under the same water conditions, R-g is 16.1%, 27.6%, and 4.9% lower than N-g.
Figure 3 shows the differences in photosynthetic and transpiration rates among the four treatments of winter wheat at the jointing, grain-filling, and maturity stages. For the net photosynthetic rate (Figure 3a), under the same temperature conditions, R-g is 25.6%, 27.3%, and 21.4% higher than R-d, while N-g is 20.2%, 31.0%, and 29.3% higher than N-d at the jointing, grain-filling, and maturity stages, respectively. Under the same water conditions, R-g is 20.4%, 14.8%, and 23.9% lower than N-g, and R-d is 29.1%, 9.0%, and 11.5% lower than N-d. For the transpiration rate (Figure 3b), at the same temperature, R-g is 20.2%, 17.8%, and 13.7% higher than R-d, and N-g is 54.9%, 11.9%, and 42.5% higher than N-d at the jointing, grain-filling, and maturity stages, respectively. Under the same water conditions, R-g is 13.9%, 15.3%, and 89.5% lower than N-g, and R-d is 0, 18.8%, and 79.8% lower than N-d at the jointing, grain-filling, and maturity stages, respectively.

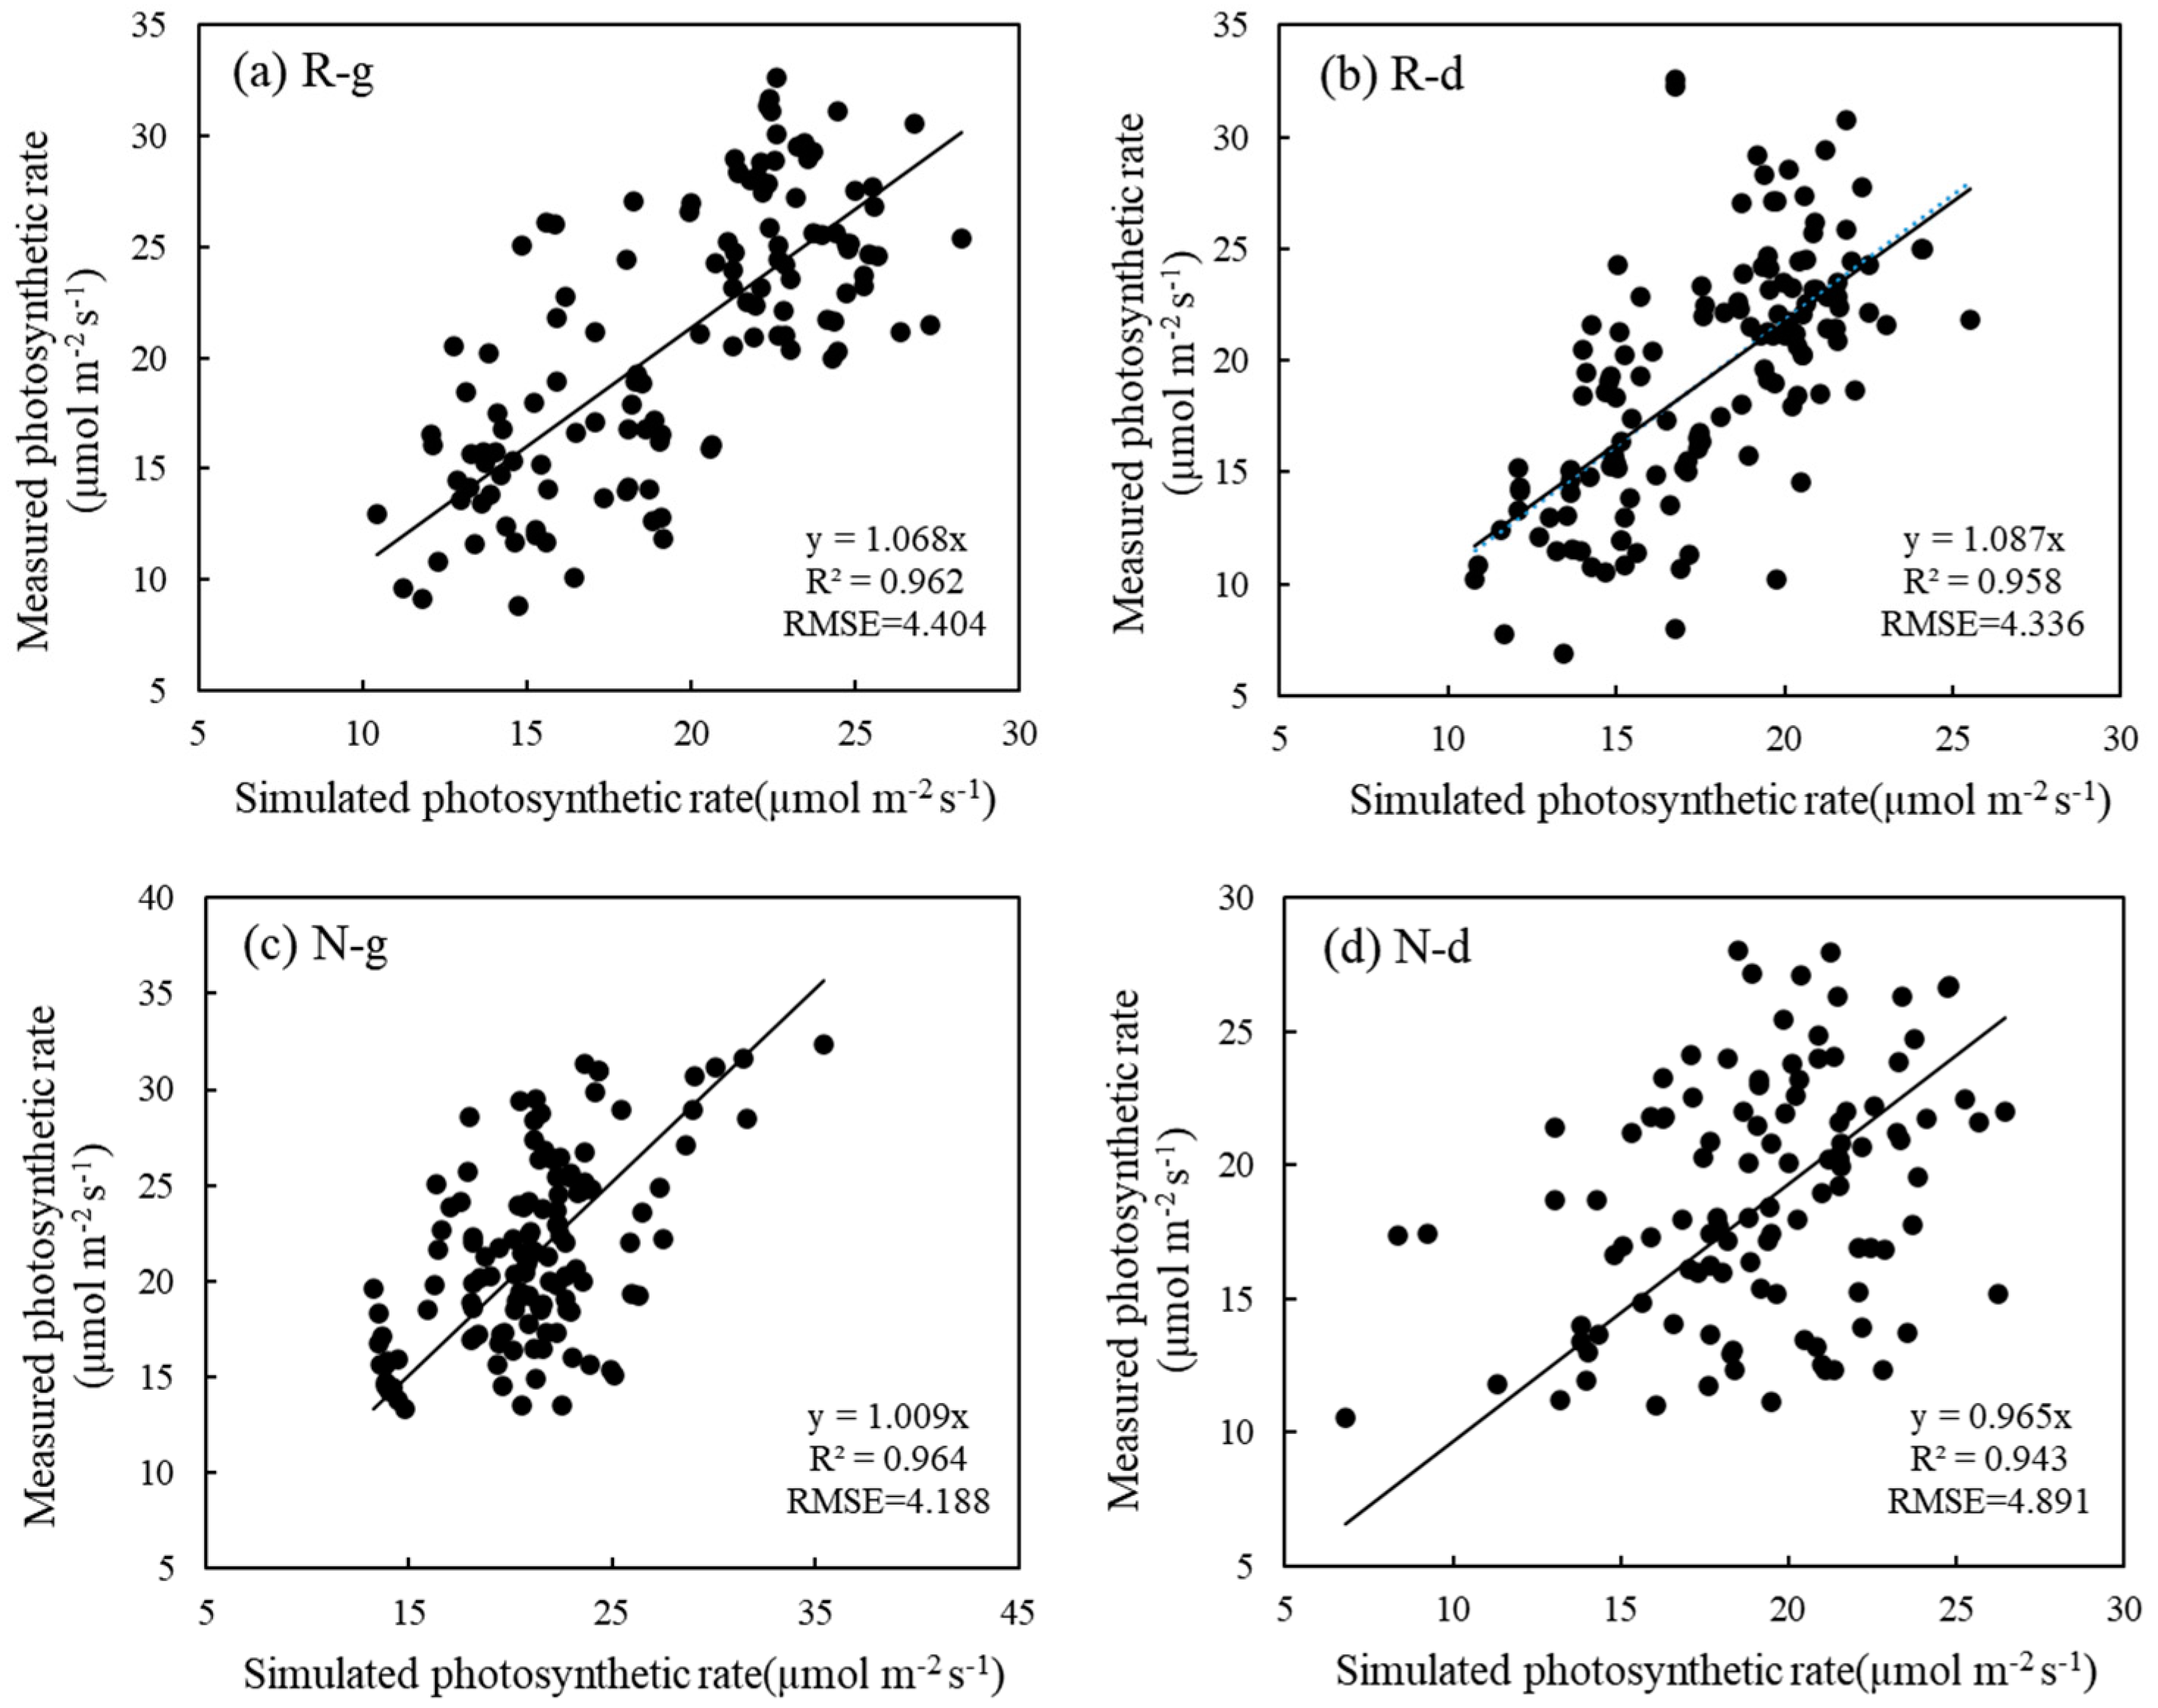
5.3. Effects of Warming and Drought Stress on Photosynthetic Rate Were Simulated Based on the Ball–Berry Model

Based on the Ball–Berry model, basic indicators were used to calculate the value of the photosynthetic rate, and the relevant data for the winter wheat season were substituted into Equation (5) to obtain a simulated value of the photosynthetic rate. Li-COR 6400XT photosynthetic apparatus was used to record the measured values. Then, the measured and simulated values were fitted. Figure 4 shows a comparison between the simulated and measured values. This is represented by the R2 value, which shows that the performance was good. In the R-g, R-d, N-g, and N-d treatments, the RMSE values of the R-g, R-d, N-g, and N-d treatments were 4.404, 4.336, 4.188, and 4.891, and the R2 values were 0.962, 0.958, 0.964, and 0.943, respectively (Figure 4). Under the conditions of no warming and water deficit, the fitting effect between the simulated and measured photosynthetic rates was the worst (N-d: R2 = 0.943, RMSE = 4.891).

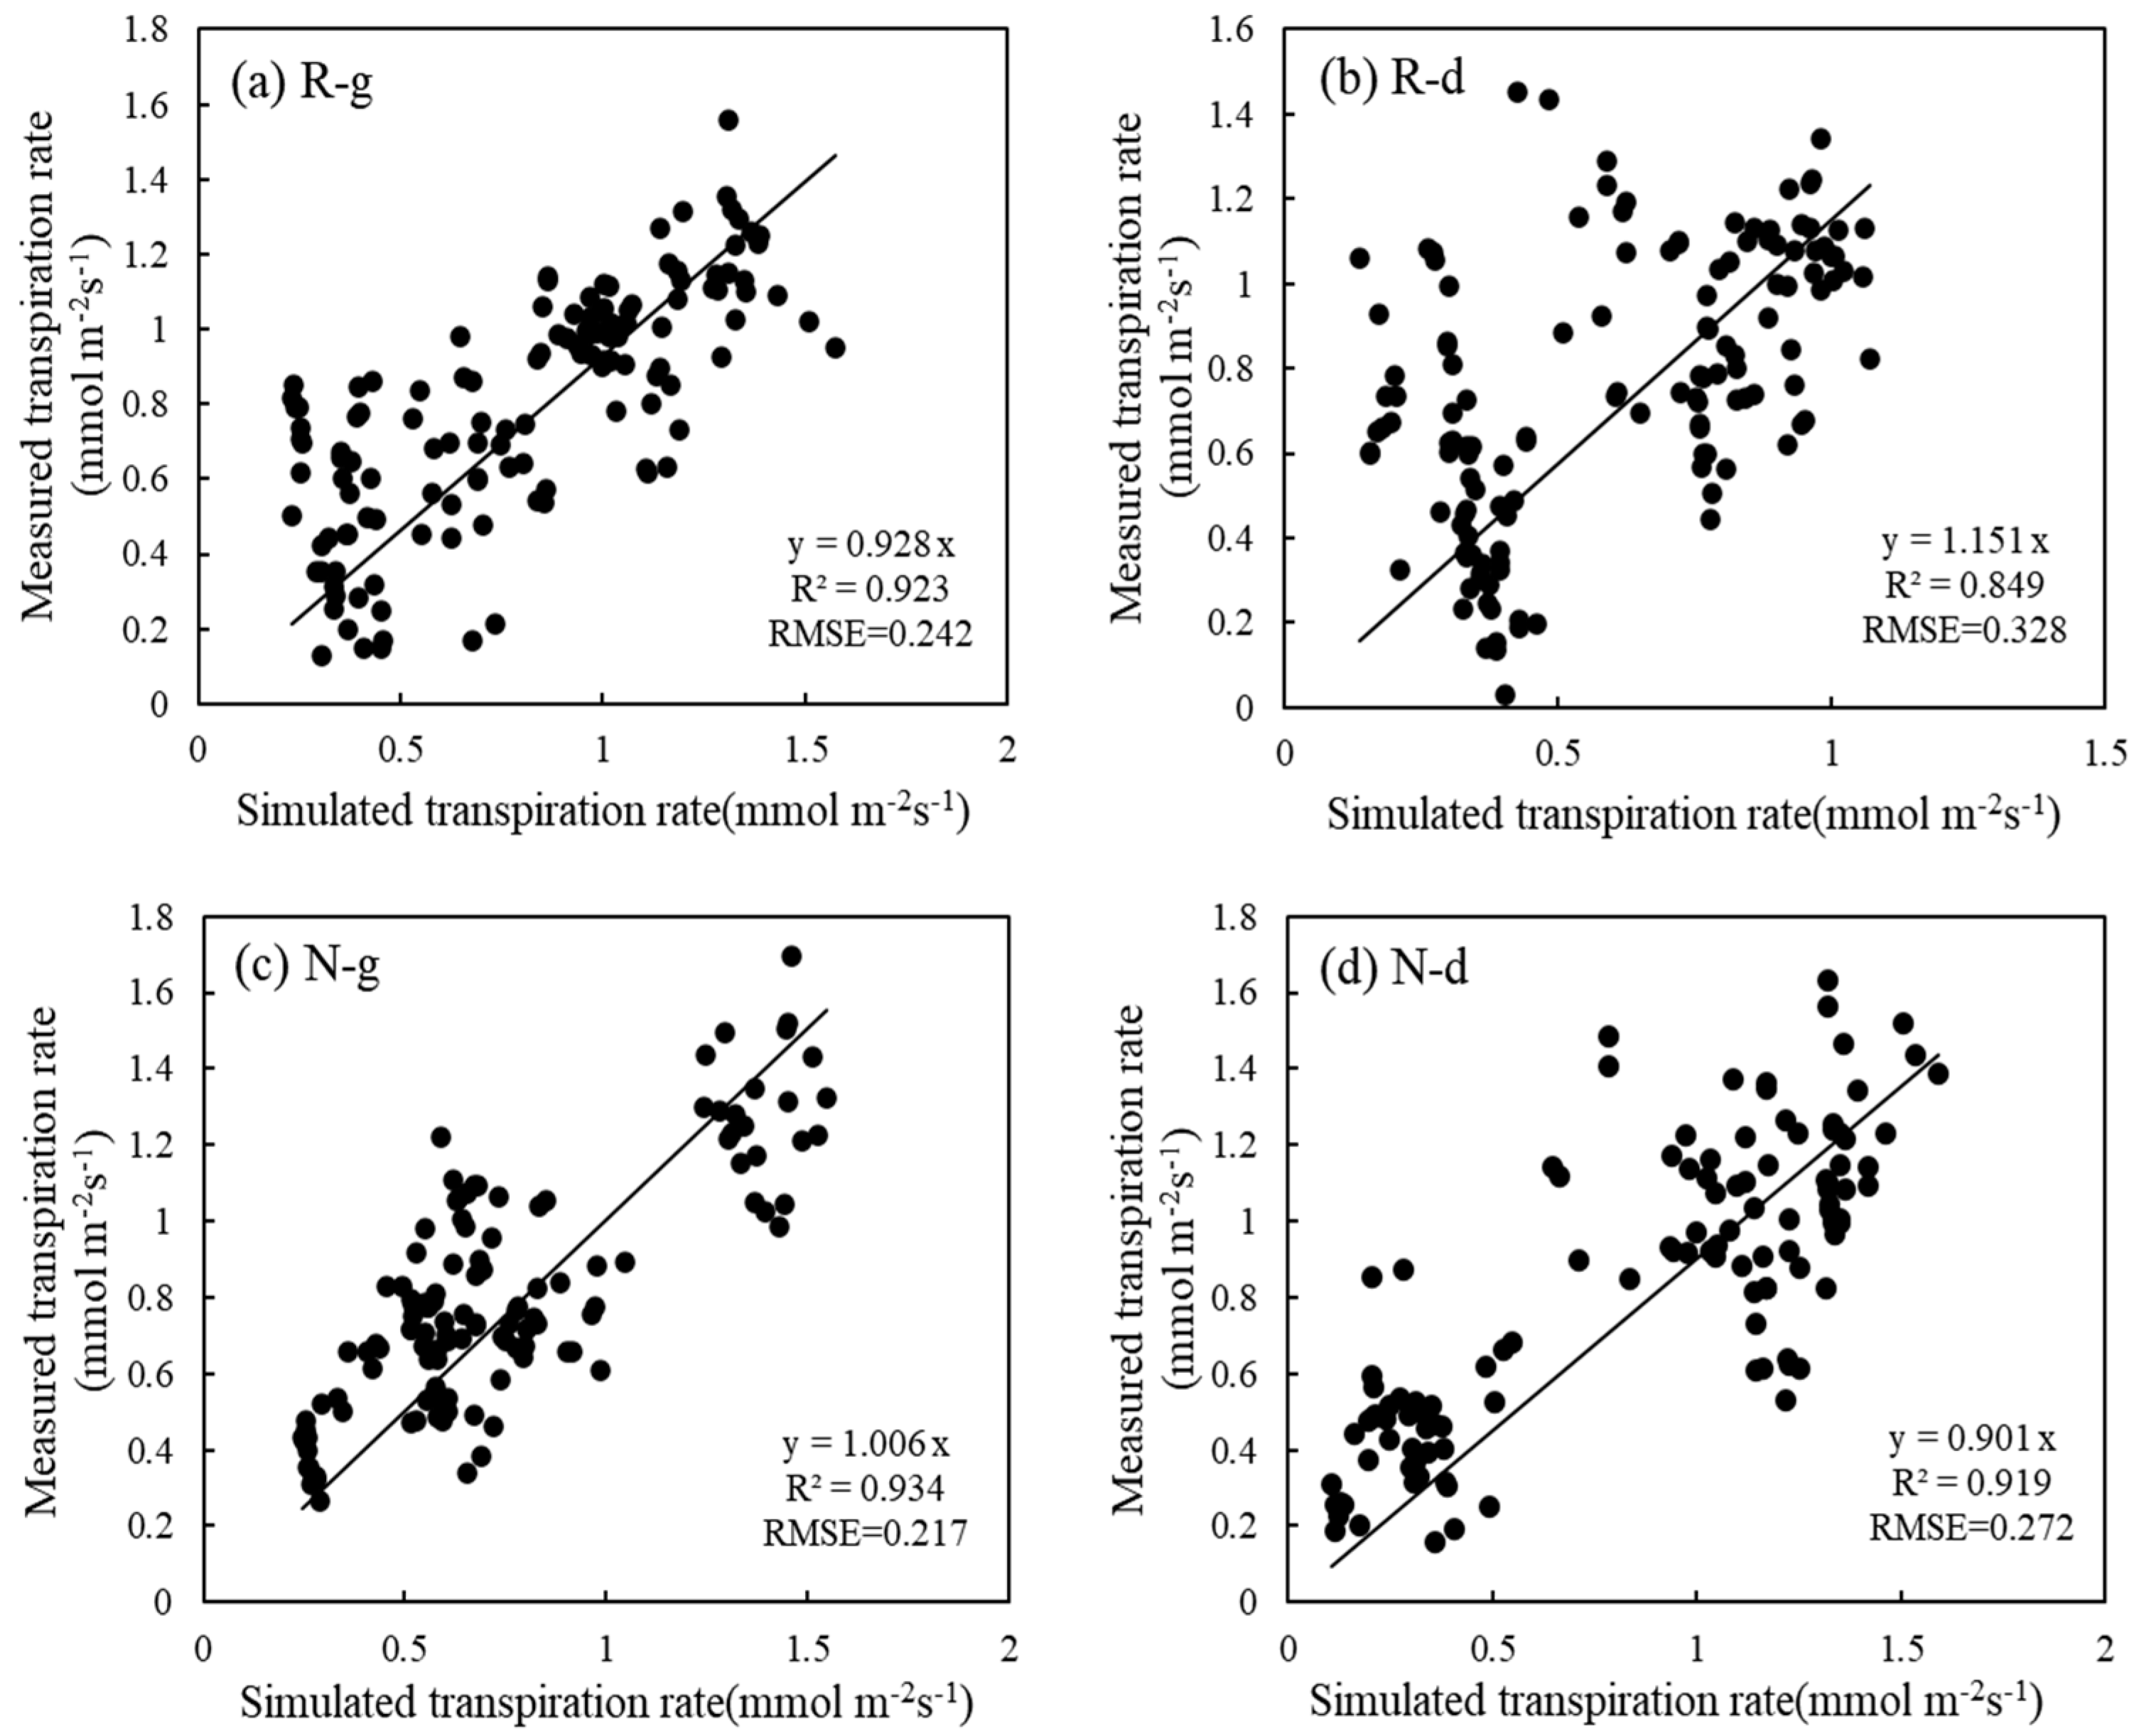
5.4. Effects of Warming and Drought Stress on Transpiration Rate Simulated by the Penman–Monteith Model

Based on the PM model, basic indicators were used to calculate the transpiration rate, and the relevant data for the winter wheat season were substituted into Equation (14) to obtain a simulated value of the transpiration rate. The measured values were recorded using Li-COR 6400XT photosynthetic apparatus. Then, the measured and simulated values were fitted. Figure 5 shows a comparison between the simulated and measured values. Different fitting effects were observed in the R-g, R-d, N-g, and N-d treatments. The RMSE values of the R-g, R-d, N-g, and N-d treatments were 0.242, 0.328, 0.217, and 0.272, and the R2 values were 0.923, 0.849, 0.934, and 0.919, respectively. Under the conditions of warming and water deficit, the simulated and measured transpiration rates had the worst fitting effect (R-d: R2 = 0.849, RMSE = 0.328).

6. Discussion

Warming and drought stress can affect winter wheat’s stomatal morphology and photosynthetic characteristics. Based on photosynthetic characteristics, the effects of warming and drought stress on the coupling effect of An and Tr were verified. Both warming and drought stress affected the stomatal structure of wheat leaves, as well as reducing the number and size of stomata in wheat leaves. This is consistent with the results of previous studies [1,2]. Under the conditions of temperature rise and water deficit, the higher the chlorophyll content of leaves, the higher their An [47,48]; this is because chlorophyll is conducive to better capturing light energy and converting it into chemical energy [49], thus increasing the possibility of An. In conclusion, leaf senescence was rapid under high temperature conditions during grain-filling and ripening, resulting in reduced An. Porter and Gawith [50] and Wheeler et al. [51] reported that genotypes with delayed senescence increased yield and transpiration efficiency under water limitation [52,53]. In addition, increasing temperature and drought stress brought forward and shortened the growth period of winter wheat, and there were significant differences in the An and Tr between increasing and not-increasing temperature. Gs is an important physiological factor regulating plant An under water deficit conditions [54,55], and drought stress reduced An and Tr [10,11]. Moreover, warming and hot, dry air accelerated leaf senescence during the grain-filling stage [56], resulting in reduced yield [57].
Based on Ball–Berry and Penman–Monteith models, the measured An and Tr of winter wheat were compared with simulated values under warming and drought stress conditions. It was concluded that warming and drought stress reduced the fitting effects of An and Tr. Yang et al. [21] stated that Tr and An have a positive linear correlation, ensuring good linear coupling between An and Tr during diurnal variation. However, under the conditions of a high atmosphere and drought, the proximity of stomata inhibits water loss, leading to a decrease in photosynthesis. However, crops still undergo transpiration [26,27]. This behavior can be described as decoupling between An and Tr under heat stress. High temperatures can inhibit photosynthesis [31] and increase respiration [32], making plants vulnerable to heat stress [33]. To date, studies on individual trees have shown that there is uncoupling between An and Tr under elevated temperatures [26,27,34,35]. These studies suggest that photosynthesis decreases at extreme temperatures, but transpiration remains high. Although most of these studies report the disappearance of decoupling due to decreased transpiration resulting from soil drying, these conclusions are similar to the results of this study. However, there are few studies on the coupling effects of warming and drought stress on An and Tr in winter wheat, and further similar experimental studies are needed.

7. Conclusions

The purpose of this study was to study the differences in gs changes, An and Tr in winter wheat under warming and water deficit conditions, and to simulate values using a calculation based on the Ball–Berry and Penman–Monteith models, and subsequently fit them. The purpose of this was to provide a clear understanding of photosynthesis in winter wheat under warming conditions (global warming). The results showed that temperature increase and water deficit decreased the gs, An and Tr of winter wheat, and also decreased the fitting effects of the measured values and simulated values. The fitting effect of the R-g treatment was 0.2% lower than that of N-g, and that of the R-d treatment was 1.5% higher than that of N-d. The fitting effect of the R-g treatment was 0.4% higher than that of R-d, and that of the N-g treatment was 2.2% higher than that of N-d. The simulated values of transpiration rate were obtained based on the Penman–Monteith model, and the fitting results with the measured values showed that warming and water deficit reduce the fitting effect of the two values. R-g was 1.2% lower than N-g, and R-d was 8.2% higher than N-d under increasing temperature. R-g was 8.0% higher than R-d, and N-g was 1.6% higher than N-d. It was found that the warming and water deficit conditions reduced the fitting effect of the simulated values. It is concluded that warming and drought stress will reduce the coupling effect of the photosynthetic rate and transpiration rate. This study’s results will support the further prediction of winter wheat yield based on photosynthetic capacity and transpiration rate under climate change (global warming).

Author Contributions

Conceptualization, Y.G. and X.W.; methodology, Y.G.; software, Q.L. and J.L.; formal analysis, Q.L. and Y.G.; investigation, Q.L. and Y.F.; data curation, Q.L. and J.L.; writing—original draft preparation, Q.L. and A.K.M.H.; writing—review and editing, H.W. and Y.G.; funding acquisition, Y.G. All authors have read and agreed to the published version of the manuscript.

Funding

This research was funded by the National Natural Science Foundation of China (No. 51879267), the Ministry of Finance and Ministry of Agriculture and Rural Affairs of the People’s Republic of China (CARS-03-19), and the Agricultural Science and Technology Innovation Program (ASTIP).

Institutional Review Board Statement

Not applicable.

Informed Consent Statement

Not applicable.

Data Availability Statement

Suggested Data Availability Statements are available in section “MDPI Research Data Policies” at https://www.mdpi.com/ethics (accessed on 18 February 2023).

Conflicts of Interest

The authors declare no conflict of interest.

References

  1. Xiong, D.L.; Nadal, M. Linking water relations and hydraulics with photosynthesis. Plant J. Cell Mol. Biol. 2020, 101, 800–815. [Google Scholar] [CrossRef]
  2. Wang, X.X.; Du, T.T.; Huang, J.L.; Peng, S.B.; Xiong, D.L. Leaf hydraulic vulnerability triggers the decline in stomatal and mesophyll conductance during drought in rice. J. Exp. Bot. 2018, 69, 4033–4045. [Google Scholar] [CrossRef]
  3. Edwards, C.E.; Ewers, B.E.; McClung, C.R.; Lou, P.; Weinig, C. Quantitative variation in water-use efficiency across water regimes and its relationship with circadian, vegetative, reproductive, and leaf gas-exchange traits. Mol. Plant 2012, 5, 653–668. [Google Scholar] [CrossRef] [Green Version]
  4. Deng, J.M.; Wang, G.X.; Morris, E.C.; Wei, X.P.; Li, D.X.; Chen, B.M.; Zhao, C.M.; Liu, J.; Wang, Y. Plant Mass: Density Relationship along a Moisture Gradient in North-West China. J. Ecol. 2006, 94, 953–958. [Google Scholar] [CrossRef]
  5. Poorter, H.; Niklas, K.J.; Reich, P.B.; Oleksyn, J.; Poot, P.; Mommer, L. Biomass allocation to leaves, stems and roots: Meta-analyses of interspecific variation and environmental control. New Phytol. 2012, 193, 30–50. [Google Scholar] [CrossRef]
  6. Skirycz, A.; Inzé, D. More from less: Plant growth under limited water. Curr. Opin. Biotechnol. 2010, 21, 197–203. [Google Scholar] [CrossRef]
  7. Chaves, M.M.; Flexas, J.; Pinheiro, C. Photosynthesis under drought and salt stress: Regulation mechanisms from whole plant to cell. Ann. Bot. 2009, 103, 551–560. [Google Scholar] [CrossRef] [Green Version]
  8. Sharkey, T.D. Effects of moderate heat stress on photosynthesis: Importance of thylakoid reactions, rubisco deactivation, reactive oxygen species, and thermotolerance provided by isoprene. Plant Cell Environ. 2005, 28, 269–277. [Google Scholar] [CrossRef]
  9. Flexas, J.; Diaz-Espejo, A.; Berry, J.A.; Cifre, J.; Galmés, J.; Kaldenhoff, R.; Medrano, H.; Ribas-Carbó, M. Analysis of leakage in IRGA’s leaf chambers of open gas exchange systems: Quantification and its effects in photosynthesis parameterization. J. Exp. Bot. 2007, 58, 1533–1543. [Google Scholar] [CrossRef] [Green Version]
  10. Lawler, D.W.; Cornic, G. Photosynthetic carbon assimilation and associated metabolism in relation to water deficits in higher plants. Plant Cell Environ. 2002, 25, 275–294. [Google Scholar] [CrossRef] [PubMed] [Green Version]
  11. Salvucci, M.E.; Crafts-Brandner, S.J. Inhibition of photosynthesis by heat stress: The activation state of Rubisco as a limiting factor in photosynthesis. Physiol. Plant. 2004, 120, 179–186. [Google Scholar] [CrossRef] [PubMed]
  12. Prasad, P.V.V.; Pisipati, S.R.; Ristic, Z.; Bukovnik, U.; Fritz, A.K. Impact of nighttime temperature on physiology and growth of spring wheat. Crop Sci. 2008, 48, 2372–2380. [Google Scholar] [CrossRef]
  13. Bhusal, N.; Lee, M.; Han, A.R.; Han, A.; Kim, H.S. Responses to drought stress in Prunus sargentii and Larix kaempferi seedlings using morphological and physiological parameters. For. Ecol. Manag. 2020, 465, 118099. [Google Scholar] [CrossRef]
  14. Casson, S.; Gray, J.E. Influence of environmental factors on stomatal development. New Phytol. 2008, 178, 9–23. [Google Scholar] [CrossRef] [PubMed]
  15. Igarashi, Y.; Kumagai, T.; Yoshifuji, N.; Sato, T.; Tanaka, N.; Tanaka, K.; Suzuki, M.; Tantasirin, C. Environmental control of canopy stomatal conductance in a tropical deciduous forest in northern Thailand. Agric. For. Meteorol. 2015, 202, 1–10. [Google Scholar] [CrossRef]
  16. Jiao, L.; Wang, L.H.; Zhou, Q.; Huang, X.H. Stomatal and non-stomatal factors regulated the photosynthesis of soybean seedlings in the present of exogenous bisphenol A. Ecotoxicol. Environ. Saf. 2017, 145, 150–160. [Google Scholar] [CrossRef]
  17. Berry, J.A.; Beerling, D.J.; Franks, P.J. Stomata: Key players in the earth system, past and present. Curr. Opin. Plant Biol. 2010, 13, 233–239. [Google Scholar] [CrossRef]
  18. Yu, G.R.; Song, X.; Wang, Q.; Liu, Y.; Guan, D.; Yan, J.; Sun, X. Water-use efficiency of forest ecosystems ineastern China and its relations to climatic variables. New Phytol. 2008, 177, 927–937. [Google Scholar] [CrossRef]
  19. Zhao, F.H.; Yu, G.R. A review on the coupled carbon and water cycles in the terrestrial ecosystems. Prog. Geogr. 2008, 27, 32–38. [Google Scholar]
  20. Wang, R.Y.; Yang, X.G.; Zhao, H.; Liu, H.Y. Eco-physiological characteristics of wheat leaf photosynthesis and their responses to environmental factors in semiarid rain-fed region. Chin. J. Ecol. 2006, 25, 1161–1166. [Google Scholar]
  21. Yang, C.; Lu, S.W.; Chen, B.; Gu, J.C.; Li, S.N.; Guo, B.L.; Chu, C.Y. Coupling analysis of diurnal changes of leaf photosynthesis and transpiration of different apricot varieties. J. Inn. Mong. Agric. Univ. (Nat. Sci. Ed.) 2015, 36, 40–47. (In Chinese) [Google Scholar]
  22. Law, B.E.; Falge, E.; Gu, L.; Baldocchi, D.D.; Bakwin, P.; Berbigier, P.; Davis, K.; Dolman, A.J.; Falk, M.; Fuentes, J.D. Environmental controls over carbon dioxide and water vapor exchange of terrestrial vegetation. Agric. For. Meteorol. 2002, 113, 97–120. [Google Scholar] [CrossRef] [Green Version]
  23. Han, T. Study on Coupling Mechanism of Carbon and Water in Typical Plants in Arid Oasis; Lanzhou University: Lanzhou, China, 2020. [Google Scholar]
  24. Ball, J.T.; Woodrow, I.E.; Berry, J. A model predicting stomatal conductance and its contribution to the control ofphotosynthesis under different environmental conditions. In Progress in Photosynthesis Research; Springer: Dordrecht, The Netherlands, 1987; Volume 4, pp. 221–224. [Google Scholar]
  25. Leuning, R. A critical appraisal of a combined stomatal-photosynthesis model for C3 plants. Plant Cell Environ. 1995, 18, 339–355. [Google Scholar] [CrossRef]
  26. Schulze, E.-D.; Lange, O.; Kappen, L.; Buschbom, U.; Evenari, M. Stomatal responses to changes in temperature at increasing water stress. Planta 1973, 110, 29–42. [Google Scholar] [CrossRef]
  27. Ameye, M.; Wertin, T.M.; Bauweraerts, I.; McGuire, M.A.; Teskey, R.O.; Steppe, K. The effect of induced heat waves on Pinus taeda and Quercus rubra seedlings in ambient and elevated CO2 atmospheres. New Phytol. 2012, 196, 448–461. [Google Scholar] [CrossRef]
  28. Drake, J.E.; Tjoelker, M.G.; Varhammar, A.; Medlyn, B.E.; Reich, P.B.; Leigh, A.; Pfautsch, S.; Blackman, C.J.; Lopez, R.; Aspinwall, M.J.; et al. Trees tolerate an extreme heatwave via sustained transpirational cooling and increased leaf thermal tolerance Glob. Change Biol. 2018, 24, 2390–2402. [Google Scholar] [CrossRef]
  29. Ray, D.; Dey, S.K.; Das, G. Significance of the leaf area ratio in Hevea brasiliensis under high irradiance and low temperature stress. Photosynthetica 2004, 42, 93–97. [Google Scholar] [CrossRef]
  30. Alam, B.; Nair, D.B.; Jacob, J. Low temperature stress modifies the photochemical efficiency of a tropical tree species Hevea brasiliensis: Effects of varying concentration of CO2 and photonflux density. Photosynthetica 2005, 43, 247–252. [Google Scholar] [CrossRef]
  31. Mathur, S.; Agrawal, D.; Jajoo, A. Photosynthesis: Response to high temperature stress. J. Photochem. Photobiol. B Biol. 2014, 137, 116–126. [Google Scholar] [CrossRef]
  32. Pinheiro, C.; Chaves, M.M. Photosynthesis and drought: Can we make metabolic connections from available data? J. Exp. Bot. 2011, 62, 869–882. [Google Scholar] [CrossRef] [Green Version]
  33. Shaheen, M.R.; Ayyub, C.M.; Amjad, M.; Waraich, E.A. Morpho-physiological evaluation of tomato genotypes under high temperature stress conditions. J. Sci. Food Agric. 2016, 96, 2698–2704. [Google Scholar] [CrossRef] [PubMed]
  34. Von Caemmerer, S.; Evans, J.R. Temperature responses of mesophyll conductance differ greatly between species. Plant Cell Environ. 2015, 38, 629–637. [Google Scholar] [CrossRef] [PubMed]
  35. Urban, J.; Ingwers, M.; McGuire, M.A.; Teskey, R. Increase in leaf temperature opens stomata and decouples net photosynthesis from stomatal conductance in Pinus taeda and Populus deltoides x nigra. J. Exp. Bot. 2017, 68, 1757–1767. [Google Scholar] [CrossRef] [PubMed] [Green Version]
  36. Tuzet, A.; Perrier, A.; Leuning, R. A coupled model of stomatal conductance, photosynthesis and transpiration. Plant Cell Environ. 2003, 26, 1097–1116. [Google Scholar] [CrossRef]
  37. Yu, Q.; Zhang, Y.Q.; Liu, Y.F.; Shi, P.L. Simulation of the stomatal conductance of winter wheat in response to light, temperature and CO2 changes. Ann. Bot. 2004, 93, 435–441. [Google Scholar] [CrossRef] [PubMed] [Green Version]
  38. Von Caemmerer, S.; Lawson, T.; Oxborough, K.; Baker, N.R.; Andrews, T.J.; Raines, C.A. Stomatal conductance does not correlate with photosynthetic capacity in transgenic tobacco with reduced amounts of Rubisco. J. Exp. Bot. 2004, 55, 1157–1166. [Google Scholar] [CrossRef]
  39. Wang, J.L.; Yu, G.R.; Wang, B.L.; Hua, Q.; Jin, X. Response of photosynthetic rate and stomatal conductance of rice to light intensity and CO2 concentration in Northern China. Acta Phytoecol. Sin. 2005, 29, 16–25. [Google Scholar]
  40. Hu, X.B.; Lu, X.J.; Yu, Y.; He, K.N. Simulation of canopy conductance of Picea crassifolia based on thermal diffusion method. J. For. Sci. 2018, 54, 8–18. [Google Scholar]
  41. Leuning, R. Modelling Stomatal Behaviour and and Photosynthesis of Eucalyptus grandis. Funct. Plant Biol. 1990, 17, 159–175. [Google Scholar] [CrossRef]
  42. Aphalo, P.J.; Jarvis, P.G. An analysis of Ball’s empirical model of stomatal conductance. Ann. Bot. 1993, 72, 321–327. [Google Scholar] [CrossRef]
  43. Qin, H.; Arteaga, C.; Chowdhury, F.I.; Granda, E.; Yao, Y.; Han, Y.; Resco de Dios, V. Radiation and Drought Impact Residual Leaf Conductance in Two Oak Species with Implications for Water Use Models. Front. Plant Sci. 2020, 11, 1910. [Google Scholar] [CrossRef] [PubMed]
  44. Jarvis, P.G. The Interpretation of the Variations in Leaf Water Potential and Stomatal Conductance Found in Canopies in the Field. Philos. Trans. R. Soc. Lond. B Biol. Sci. 1976, 273, 593–610. [Google Scholar]
  45. Li, Y.X.; Lou, Y.S.; Zhang, F.C. Comparison of stomatal conductance models in winter wheat. Chin. J. Agrometeorol. 2011, 32, 106–110. (In Chinese) [Google Scholar]
  46. Liu, W.N. Studies on Stomatal Conductance and Its Regulation on Canopy Transpiration in the Beijing Mountain Area; Beijing Forestry University: Beijing, China, 2019. [Google Scholar]
  47. Long, S.P.; Osborne, C.P.; Humphries, S.W. Photosynthesis, rising atmospheric CO2 concentration and climate change. In Scope 56: Global Change; Bremeyer, A., Hall, D.O., Melillo, J., Eds.; Wiley: Chichester, UK, 1997. [Google Scholar]
  48. Arcus, V.L.; Prentice, E.J.; Hobbs, J.K.; Mulholland, A.J.; Van der Kamp, M.W.; Pudney, C.R.; Parker, E.J.; Schipper, L.A. On the temperature dependence of enzyme catalyzed rates. Biochemistry 2016, 55, 1681–1688. [Google Scholar] [CrossRef] [PubMed] [Green Version]
  49. Bhusal, N.; Bhusal, S.J.; Yoon, T.-M. Comparisons of physiological and anatomical characteristics between two cultivars in bi-leader apple trees (Malus × domestica Borkh.). Sci. Hortic. 2018, 231, 73–81. [Google Scholar] [CrossRef]
  50. Porter, J.R.; Gawith, M. Temperatures and the growth and development of wheat: A review. Eur. J. Agron. 1999, 10, 23–36. [Google Scholar] [CrossRef]
  51. Wheeler, T.R.; Craufurd, P.Q.; Ellis, R.H.; Porter, J.R.; Vara Prasad, P.V. Temperature variability and the yield of annual crops. Agric. Ecosyst. Environ. 2000, 82, 159–167. [Google Scholar] [CrossRef]
  52. Verma, V.; Foulkes, M.J.; Worland, A.J.; Sylvester-Bradley, R.; Caligari, P.D.S.; Snape, J.W. Mapping quantitative trait loci for flag leaf senescence as a yield determinant in winter wheat under optimal and drought-stressed environments. Euphytica 2004, 135, 255–263. [Google Scholar] [CrossRef]
  53. Haussmann, B.; Mahalakshmi, V.; Reddy, B.; Seetharama, N.; Hash, C.; Geiger, H. QTL mapping of stay-green in two sorghum recombinant inbred populations. Theor. Appl. Genet. 2002, 106, 133–142. [Google Scholar] [CrossRef] [Green Version]
  54. Medrano, H.; Escalona, J.M.; Bota, J.; Gulías, J.; Flexas, J. Regulation of photo-synthesis of C 3 plants in response to progressive drought: Stomatal conductance as areference parameter. Ann. Bot. 2002, 89, 895–905. [Google Scholar] [CrossRef]
  55. Bhusal, N.; Bhusal, S.J.; Yoon, T.M. Impact of drought stress on photosynthetic response, leaf water potential, and stem sap flow in two cultivars of bi-leader apple trees (Malus × domestica Borkh.). Sci. Hortic. 2019, 246, 535–543. [Google Scholar] [CrossRef]
  56. Liu, B.; Liu, F.; Tian, L.; Cao, W.; Zhu, Y.; Asseng, S. Post-heading heat stress and yield impact in winter wheat of China. Glob. Chang. Biol. 2014, 20, 372–381. [Google Scholar] [CrossRef] [PubMed]
  57. Hunt, J.R.; Hayman, P.T.; Richards, R.A.; Passioura, J.B. Opportunities to reduce heat damage in rain-fed wheat crops based on plant breeding and agronomic management. Field Crops Res. 2018, 224, 126–138. [Google Scholar] [CrossRef]
Figure 1. Stomatal morphology of winter wheat leaves at the anthesis stage. Subgraphs (ad) show stomatal morphology of R-g, R-d, N-g, and N-d, respectively, treated under a microscope at 200 times magnification.
Applsci 13 02759 g001
Figure 2. Effects of warming and drought stress on stomatal conductance of winter wheat. Each data point indicates the average value of three replicates. The lowercase letters indicate significant differences (p < 0.05).
Applsci 13 02759 g002
Figure 3. Effects of warming and drought stress on photosynthetic and transpiration rates of winter wheat. Each data point indicates the average value of three replicates. The lowercase letters indicate significant differences (p < 0.05). (a) Photosynthetic rate at different growth stages; (b) Transpiration rate at different growth stages.
Applsci 13 02759 g003
Figure 4. Fitting of measured and simulated photosynthetic rates among different treatments. ((a) R-g = warming of 1.5 °C with sufficient water supply, (b) R-d = warming of 1.5 °C with water deficit, (c) N-g = non-warming with sufficient water supply, (d) N-d = non-warming with water deficit.).
Applsci 13 02759 g004
Figure 5. Fitting of measured and simulated transpiration rates among different treatments. ((a) R-g = warming of 1.5 °C with sufficient water supply, (b) R-d = warming of 1.5 °C with water deficit, (c) N-g = non-warming with sufficient water supply, (d) N-d = non-warming with water deficit.).
Applsci 13 02759 g005
Disclaimer/Publisher’s Note: The statements, opinions and data contained in all publications are solely those of the individual author(s) and contributor(s) and not of MDPI and/or the editor(s). MDPI and/or the editor(s) disclaim responsibility for any injury to people or property resulting from any ideas, methods, instructions or products referred to in the content.

