1. Introduction
Impaction of the third molar is the most common of all tooth impactions occurring in the oral cavity. Third molars appear on routine radiographs of patients from 5 to 16 years of age, whereas the time of eruption ranges from 18 to 24 years [
1,
2,
3]. This long duration for calcification and eruption may also play a role in the subsequent impaction of third molars [
4,
5]. A recent systematic review and meta-analysis revealed a mean prevalence of third molar impaction in 24.4% of the population worldwide [
6]. The odds of third molar (M3) impaction were found to be 57.7% higher in the mandible than in the maxilla, without any difference between men and women. In dental practice, the clinical decision of whether to extract third molars remains controversial [
7,
8].
Various factors have been analyzed in different studies to examine their role in determining third molar impaction: deficient mandibular growth, absence of interproximal attrition in modern humans, limited retromolar space, direction of condylar growth, etc. [
9]. The main predictors of third molar retention are lack of eruption space (limited retromolar space) and angulation of the third molar [
10,
11,
12,
13,
14].
Some studies show that these linear and angular measurements can be used to estimate the eruption potential and the risk of retention of mandibular third molars. Evaluating the eruption potential allows timely removal of third molars while avoiding other complicated pathologies (dental, osseous, or nervous) in relation to the tooth eruption process [
15].
Predicting third molar eruption is a key task in various clinical scenarios/settings: in orthodontic treatment, to estimate the indication for surgical removal, and in multidisciplinary treatment, to assess the need for orthodontic traction of a retained third molar to replace a deteriorated lower molar or prevent post-treatment complications due to lack of eruption. Third molar eruption is a complex, multifactorial process, and the excessively high rate of asymptomatic third molar extraction may be due to a lack of reliable and simple predictive tools [
7,
16]. A recent systematic review established that retained asymptomatic third molars rarely remain disease-free over time, with the likelihood of disease rising with increasing age. Thus, increased retention time seems to be associated with greater morbidity [
16]. Moreover, the presence of symptomatic indications for surgical third molar extraction also increases with age [
17].
The goal of the present study is to evaluate the reliability and validity of the Panoramic Dental Application (PDApp) tool among Caucasian adolescents and young adults.
In previous works, we developed software tools with a friendly graphical user interface (GUI) to perform quantitative analysis of medical and biological images using machine learning algorithms [
18,
19]. In this paper, we propose PDApp, which predicts the eruption/retention potential of third molars. This software is intended to perform the following functions:
- (1)
Provide a friendly GUI to interactively work with radiological images and draw lines and angles for analysis.
- (2)
Measure lines and angles in the images.
- (3)
Use machine learning algorithms to automatically classify third molars in the images.
- (4)
Allow data sharing among researchers to review the results at any time.
- (5)
Operate fast enough to analyze images in real time.
In a recent analysis, Santeiro and Gallas (2018) used linear measurements and the radiological retention coefficient (RRC) to determine the eruption status of third molars [
20]. This study was performed using diagnostic digital panoramic radiographs of 184 Caucasian patients of both sexes, aged 18 to 27, which were taken from the archive of the radiological dental center and anonymized. All subjects had full dental arches with radiographically confirmed lower third molars and were divided into two groups according to their eruption status (retained (R)/erupted (E)). We considered lower third molars to have erupted if they had reached the occlusal plane drawn on the panoramic radiographs; otherwise, they were considered retained.
The PDApp software proposed in this paper uses these characteristics to automatically predict the retention/eruption of third molars in a more rapid and accurate way than manual measurements.
2. Materials and Methods
The panoramic radiographs we analyzed were retrospectively selected from a private radiological center (Centro de Radiología Príncipe, Vigo, Spain). Patients with fully erupted mandibular dentition (18 teeth) or without wisdom teeth (16 teeth) were included. The participants were patients who regularly visited the dental clinic for treatment and previously had panoramic radiographs taken, and they consented to the use of their image data in the study. All image data were anonymized prior to analysis. In total, 383 panoramic radiographs were included: 94 for training and technical validation and 289 for posterior clinical validation. All radiographs were taken using a standard technique (70 Kvp, 15 mA, patient in analog position, and 10 seg). The study was approved by the Santiago-Lugo Research Ethics Committee with registration code 2017/121. Radiographs were acquired using a CS 8100 device (SN EBXG197; Carestream Health Inc., Noisy-le-Grand, France).
Panoramic Dental Application (PDApp) is a desktop tool that runs on a general-purpose computer under the Linux and Windows operating systems. It was written in the C++ programming language using the GIMP Tool Kit (GTK+) library (
https://www.gtk.org/ (accessed on 16 February 2023)) to develop the GUI.
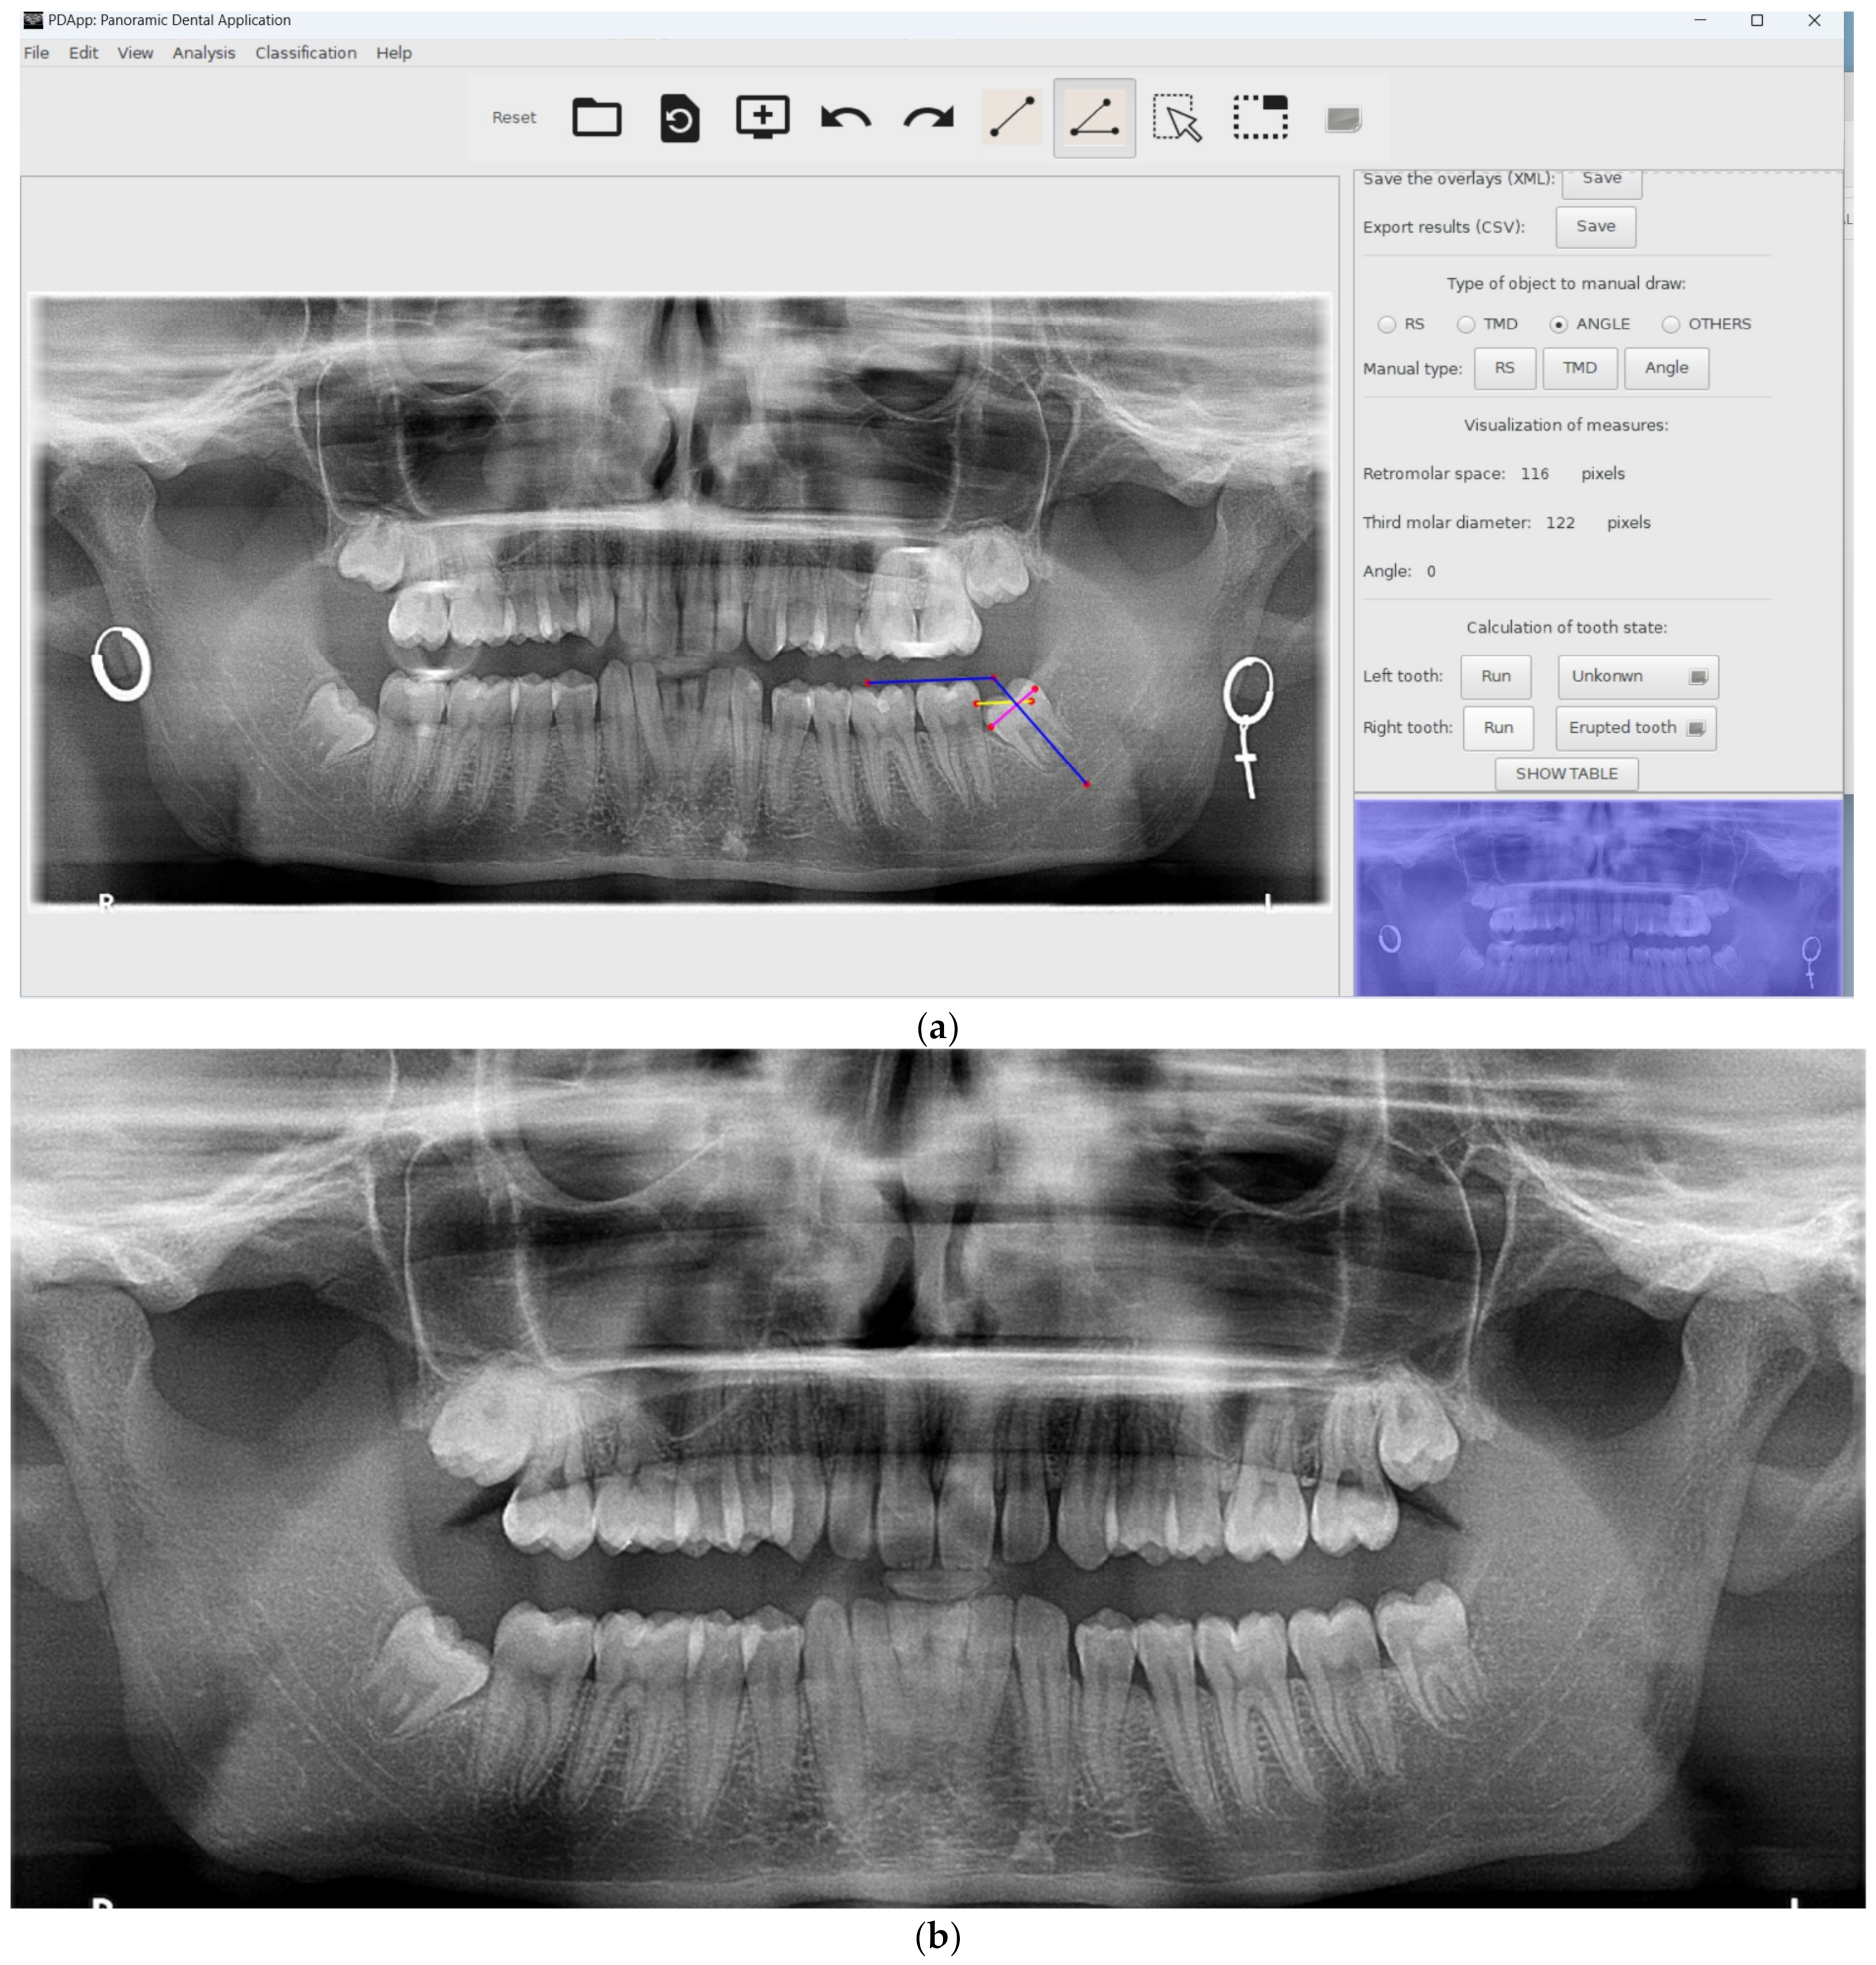
Figure 1 shows the GUI of PDApp with a typical radiological image loaded, processed, and reviewed by a dental expert and with the lateral panel displayed.
PDApp is a modular and extensible application composed of three layers:
- (1)
The GUI layer, which facilitates user interaction through editing tools, including modules to draw and manage objects, set preferences, or interact with the software.
- (2)
The logic application layer, which contains modules to measure distances and angles, predict the third molar potential, train the classifier, and calculate the statistical results.
- (3)
The persistence layer, which stores all the data needed and calculated by the software, including modules to save the image overlays and the statistical results.
The image overlays, which contain analyses supervised by experts, are stored in the popular Extensible Markup Language (XML) text format. The statistical results, calculated from the overlays, are stored in the comma-separated values (CSV) text format, which is portable and allows import from other spreadsheet software for further use.
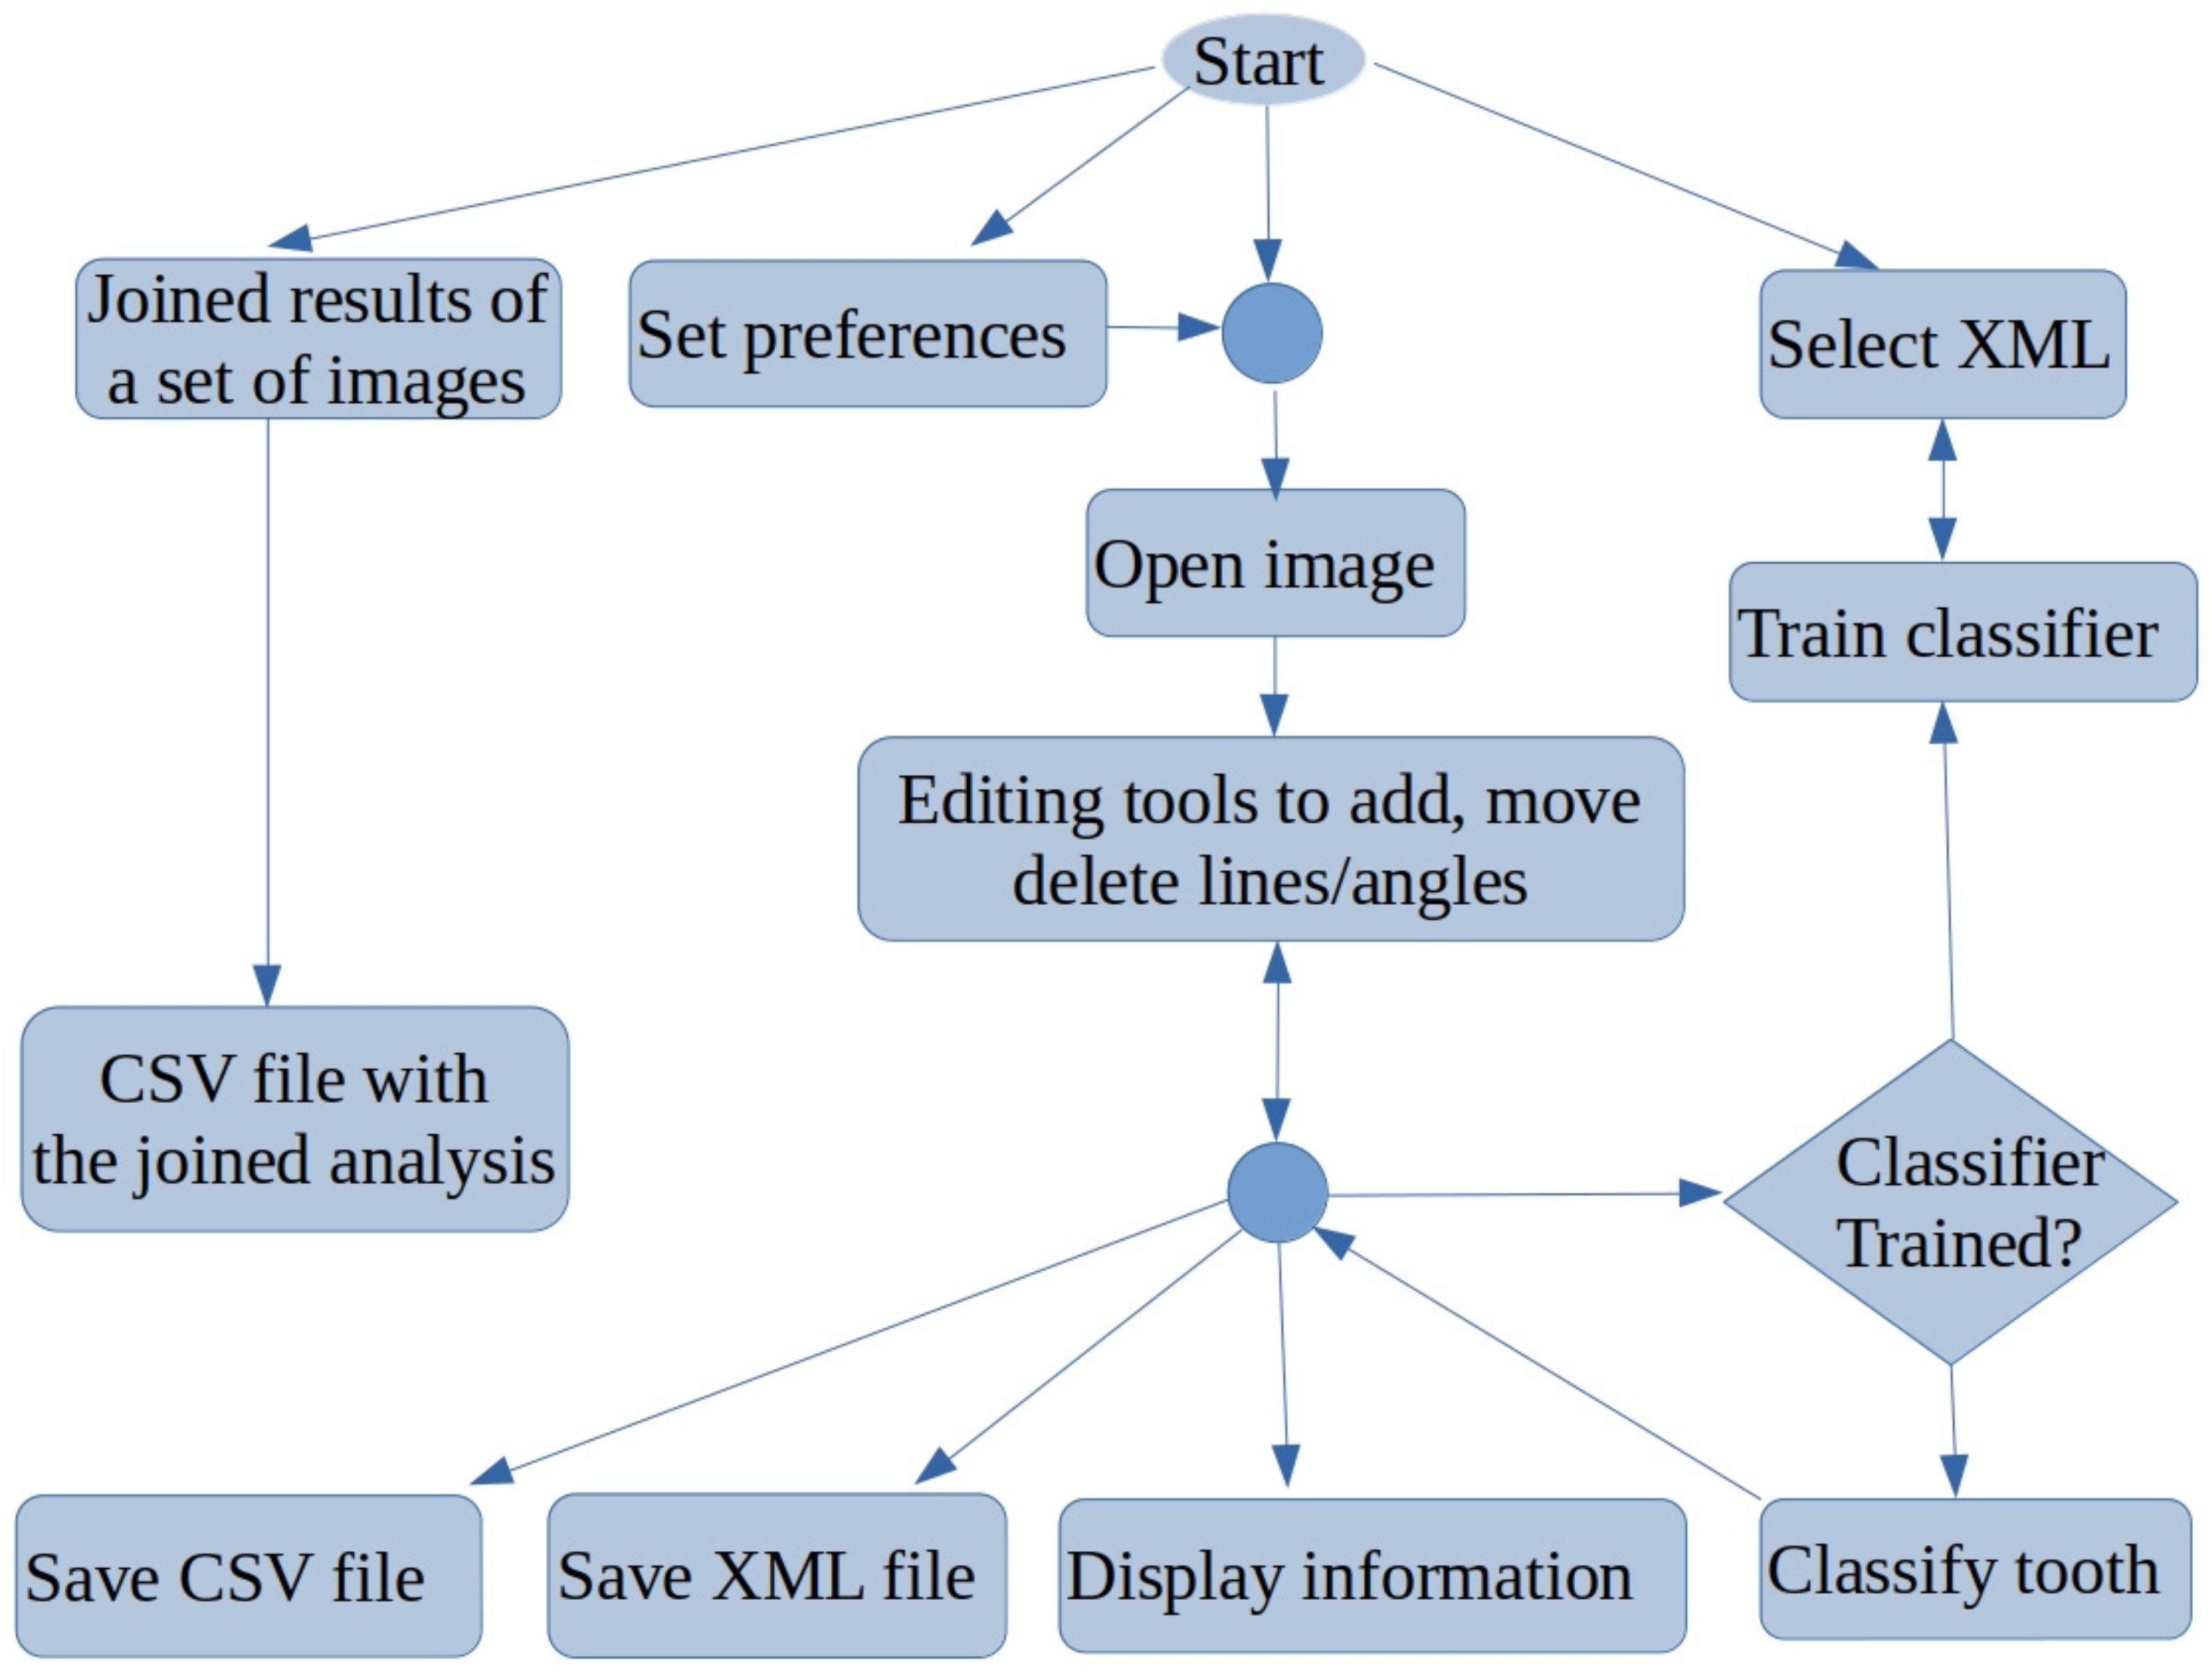
Figure 2 shows a flowchart with the main functionality of PDApp, which is accessible from its GUI. A typical working session for a user should include the following actions:
- (1)
Open a radiological image.
- (2)
Manually draw the retromolar space, the third molar diameter, and the angle for each third molar.
- (3)
Automatically measure the distances and angles.
- (4)
Automatically classify the third molars.
- (5)
Refer to expert’s supervision, as described below.
- (6)
Save the overlays drawn on the image into an XML file.
- (7)
Export the statistical measurements to a CSV file.
- (8)
At any time, the user can select an optional functionality: set preferences, save joined results of a set of patients, or train the classifier.
Figure 2.
Flowchart of main functionality of PDApp.
Figure 2.
Flowchart of main functionality of PDApp.
Once the image is loaded, the user must manually draw the retromolar space, the third molar diameter, and the angle using the editing tools. Next, the classifier can be run in order to label each third molar as erupted or non-erupted/retained. As mentioned in
Section 1, our previous studies [
20,
21], and other published research [
22], the retromolar space, third molar diameter, and third molar angulation are the key parameters in predicting third molar eruption/retention. Specifically, we used the angle and the radiological retention coefficient (RRC), defined as the ratio of the retromolar space and third molar diameter, because both measures are independent of the spatial resolution at which the radiological image is acquired [
20].
Machine Learning Model for Third Molar Classification
Once the third molars are measured on the image (retromolar space, third molar diameter and angle), a supervised machine learning model is used to predict their category as defined by their eruption potential: erupted or non-erupted (or retained). The model used by PDApp to predict the third molar category is support vector machine (SVM) with a radial basis function (RBF) kernel, one of the best-performing machine learning models for classification [
23] which is accessed through the C++ binding of the LibSVM library [
24]. In order to perform this prediction, the SVM is trained in such a way that values for its trainable parameters (coefficients of the support vectors and offset) are calculated in order to adjust the SVM category prediction according to a collection of examples. This collection, named the training set, is characterized by two features, extracted from the panoramic radiological image using PDApp, alongside the correspondent category label (erupted or retained) for each molar, up to a total of 188 molars distributed into 115 erupted (representing 61.2% of the data) and 73 retained (38.8%) molars. The two features are:
- (1)
Third molar angulation;
- (2)
RRC (Radiological Retention Coefficient).
Before SVM training and prediction, both values are standardized to have a mean value of 0 and a standard deviation of 1 over the training set. The objective of SVM training is to predict, using only these features, the right category label for the molars in the training set with high accuracy while being able to generalize and provide an acceptable prediction for new molars not included in the training set. This set includes molar data from persons of the Caucasian race, although PDApp allows the SVM to be retrained at any time in order to include such data as molars of people from other races. Prior to training all available data, it is necessary to select appropriate values for two SVM hyper-parameters, regularization (λ) and RBF kernel spread (σ), in a process known as hyper-parameter tuning. In the case of PDApp, this tuning is performed automatically using the well-known grid search method. First, a collection of values, λ = {2
2i−5}
i=09 and σ = {2
−(i+1)/2}
i=−110, is defined to perform value selection. Then 4-fold cross validation is performed to evaluate SVM training with each combination of values and select the best combination. The available data are divided into 4 parts (folds) of the same size, including molars erupted and retained in their natural populations (61–39%). Four trials are executed: in the first trial, the SVM is trained using a combination of values of λ and σ (e.g., λ = 2
−5, σ = 2
5) in folds 1–3, and the trained SVM is then used to predict the categories of molars in fold 4 with calculation of the Cohen kappa score [
25], denoted as
K, which is a measure of the classification performance using this combination. This score (in %) is calculated as:
where
C is the number of classes and
Cij is the
ijth value in the confusion matrix, i.e.,
Cii, the number of third molars of the
ith class (
i = 1 means retained,
i = 2 means erupted) for which the classifier predicts the
jth class.
In trial 2, folds 2, 3, and 4 are used for training and fold 1 is used for testing, similarly with trials 3 and 4. Once all trials are executed, the average kappa over the 4 folds is calculated for the current combination of values {λ, σ}. The process is repeated for all combinations of {λ, σ}, and the combination with the highest average K is selected. Then, the SVM is trained using the whole dataset with the selected combination of hyper-parameters {λ, σ}. This process of hyper-parameter tuning and final training using the whole dataset and the selected hyper-parameter values can be performed at any time by the user by selecting the Classification → Train classifier in the menu, such as to include new data for SVM training. The user must set the XML files (created previously by PDApp) used for training, which must contain angulation, retromolar space, and third molar space alongside its class label (erupted or retained). The collection of images must be sufficiently representative of possible situations containing both erupted and retained teeth. Since the SVM cannot be adequately trained using large files, a maximum number of 1000 molars, randomly selected from the XML files, is considered for training. A much smaller number of molars is sufficient for training the classifier. The current version of PDApp includes a pre-trained SVM classifier with our dataset of 188 molars.
3. Results
To evaluate PDApp based on operation in a real environment, the software was installed at the dental clinic of the Dentistry School of Medicine and Odontology of the University of Santiago de Compostela (Spain) in February 2021. Dental experts then used PDApp in their daily work to analyze images, which required that they manually draw the retromolar space and the third molar diameter and angle. PDApp then automatically classifies the third molars in radiological images as erupted or retained. Their operations using PDApp were logged into XML files for later statistical evaluation of the machine learning algorithm (SVM classifier) incorporated in the software. We used accuracy (rate of third molars correctly classified by the software) as a measure of the classifier performance. As mentioned, the classifier included in PDApp was initially trained using a dataset of 188 molars. Thereafter, PDApp was used to classify 539 third molars from 289 patients, and 97.96% of third molars were correctly classified.
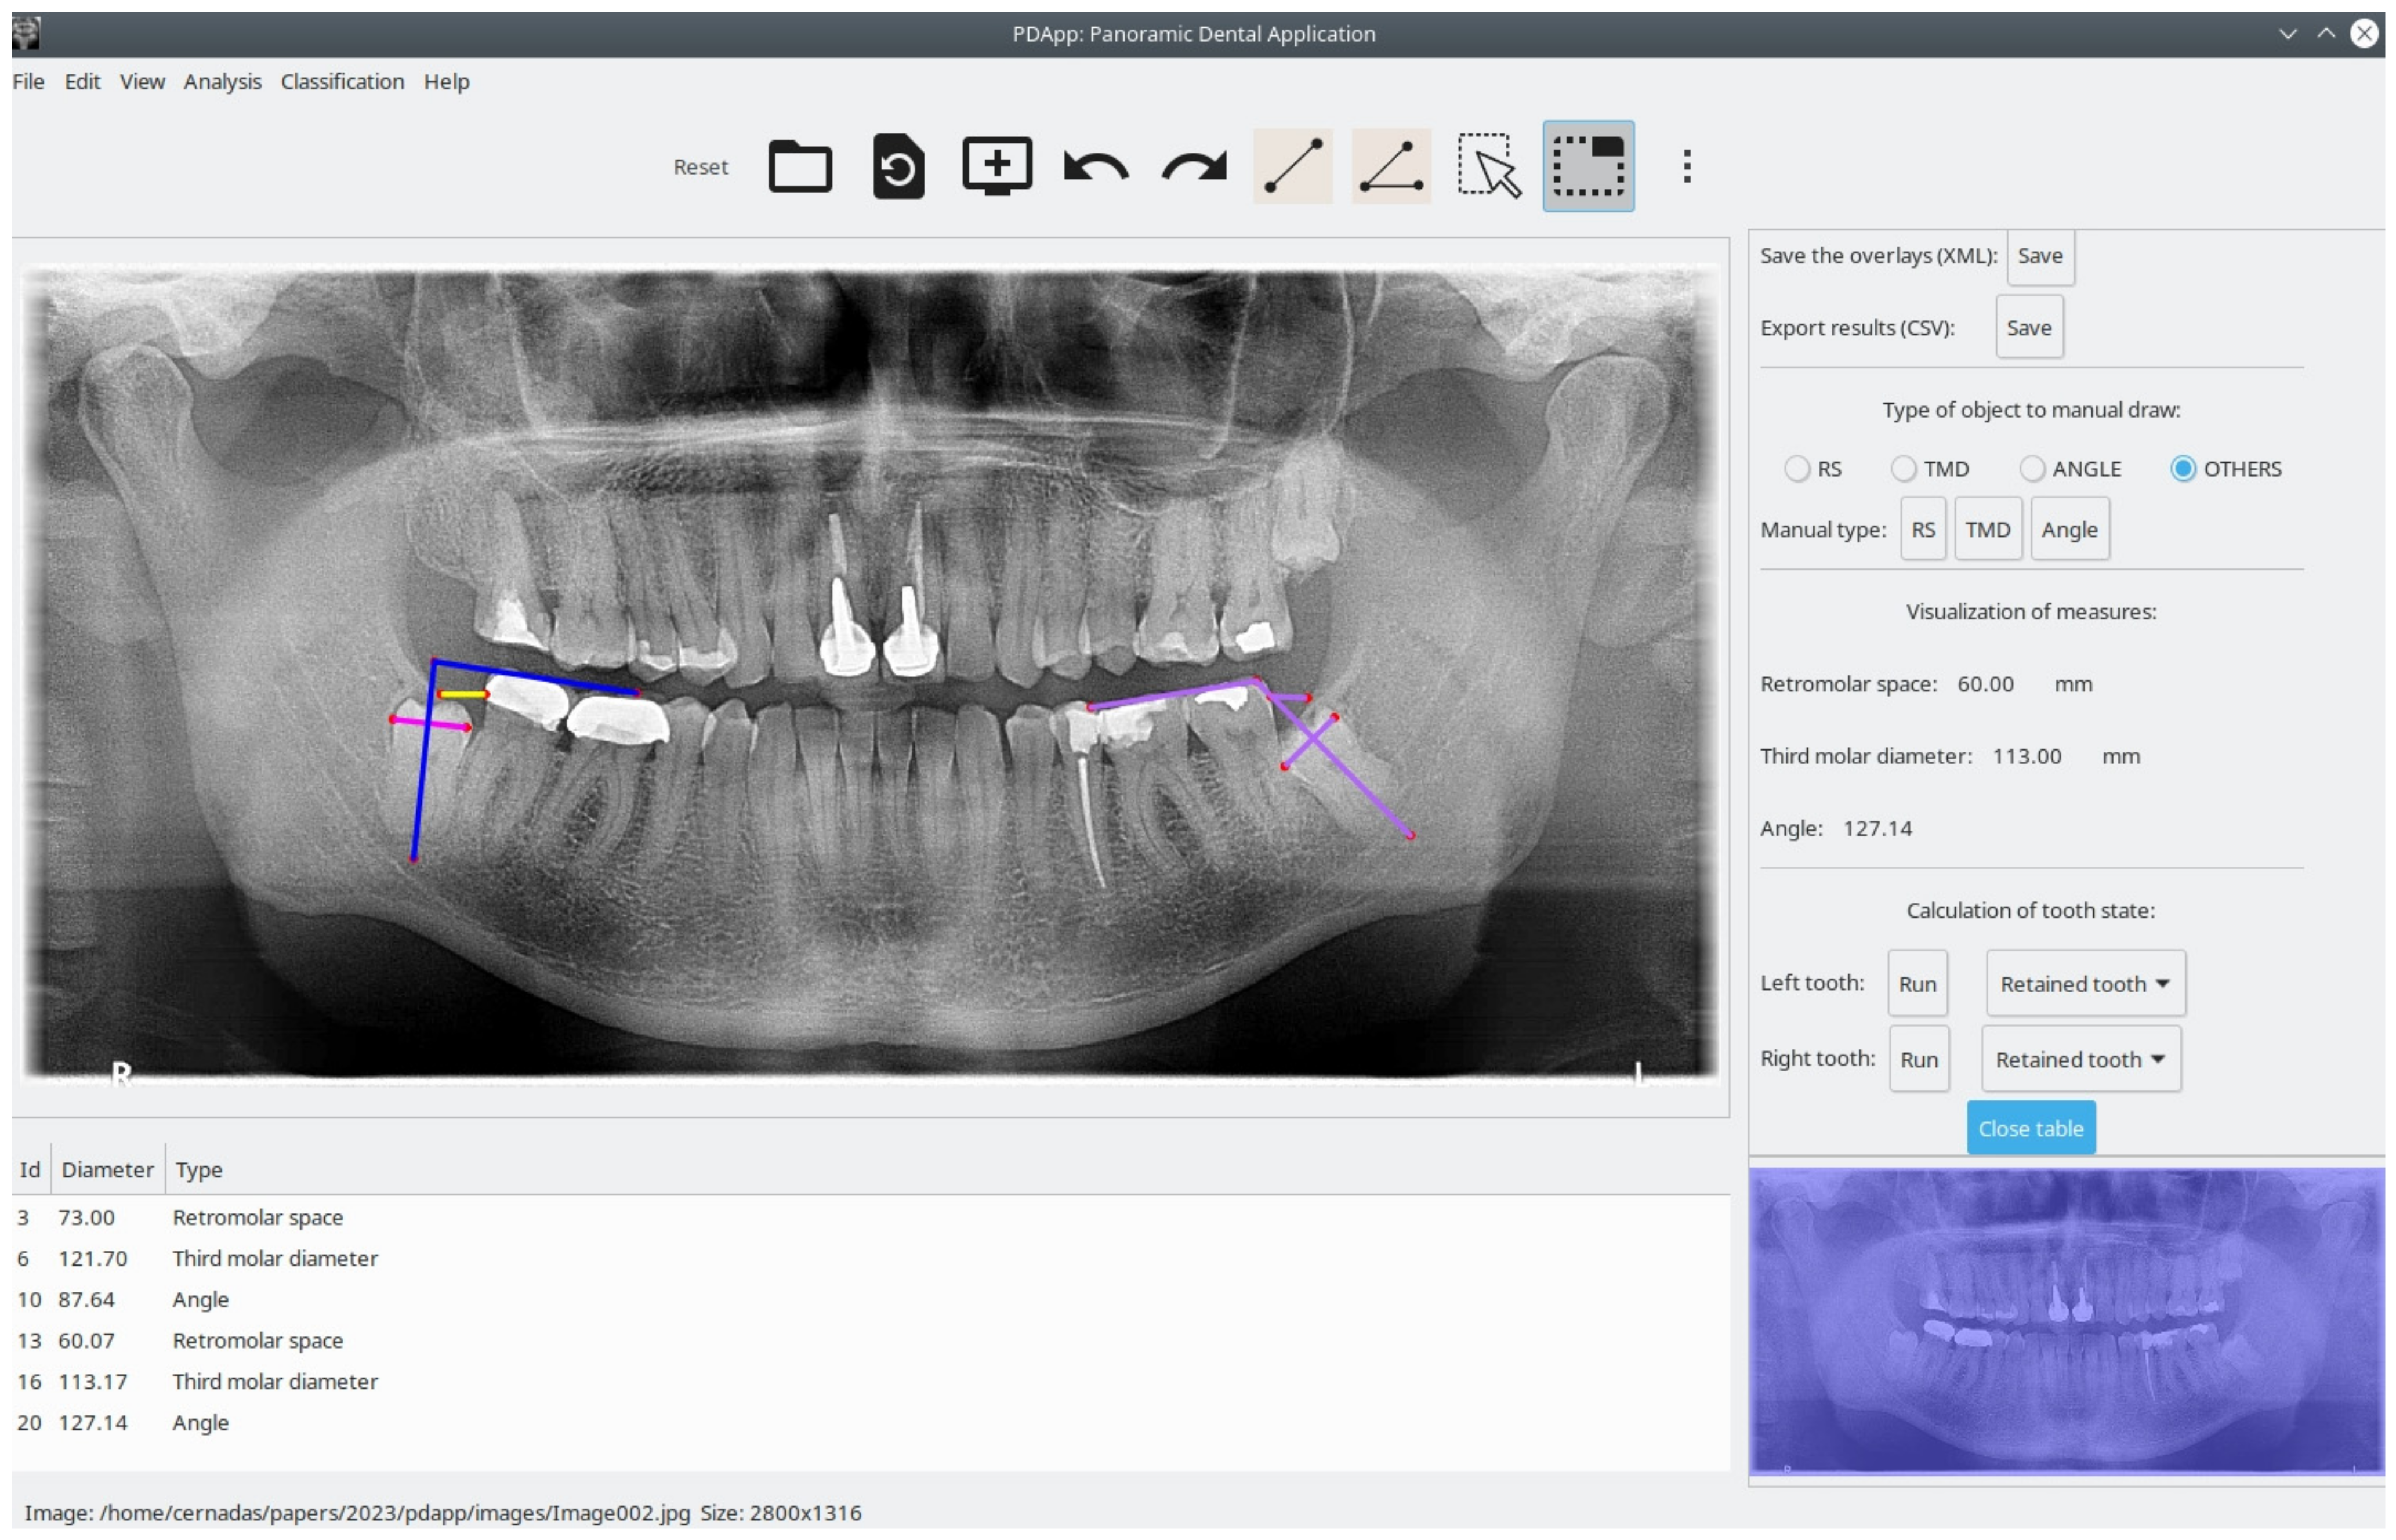
Figure 3 shows an example of correct classification of the third molar by PDApp as retained.
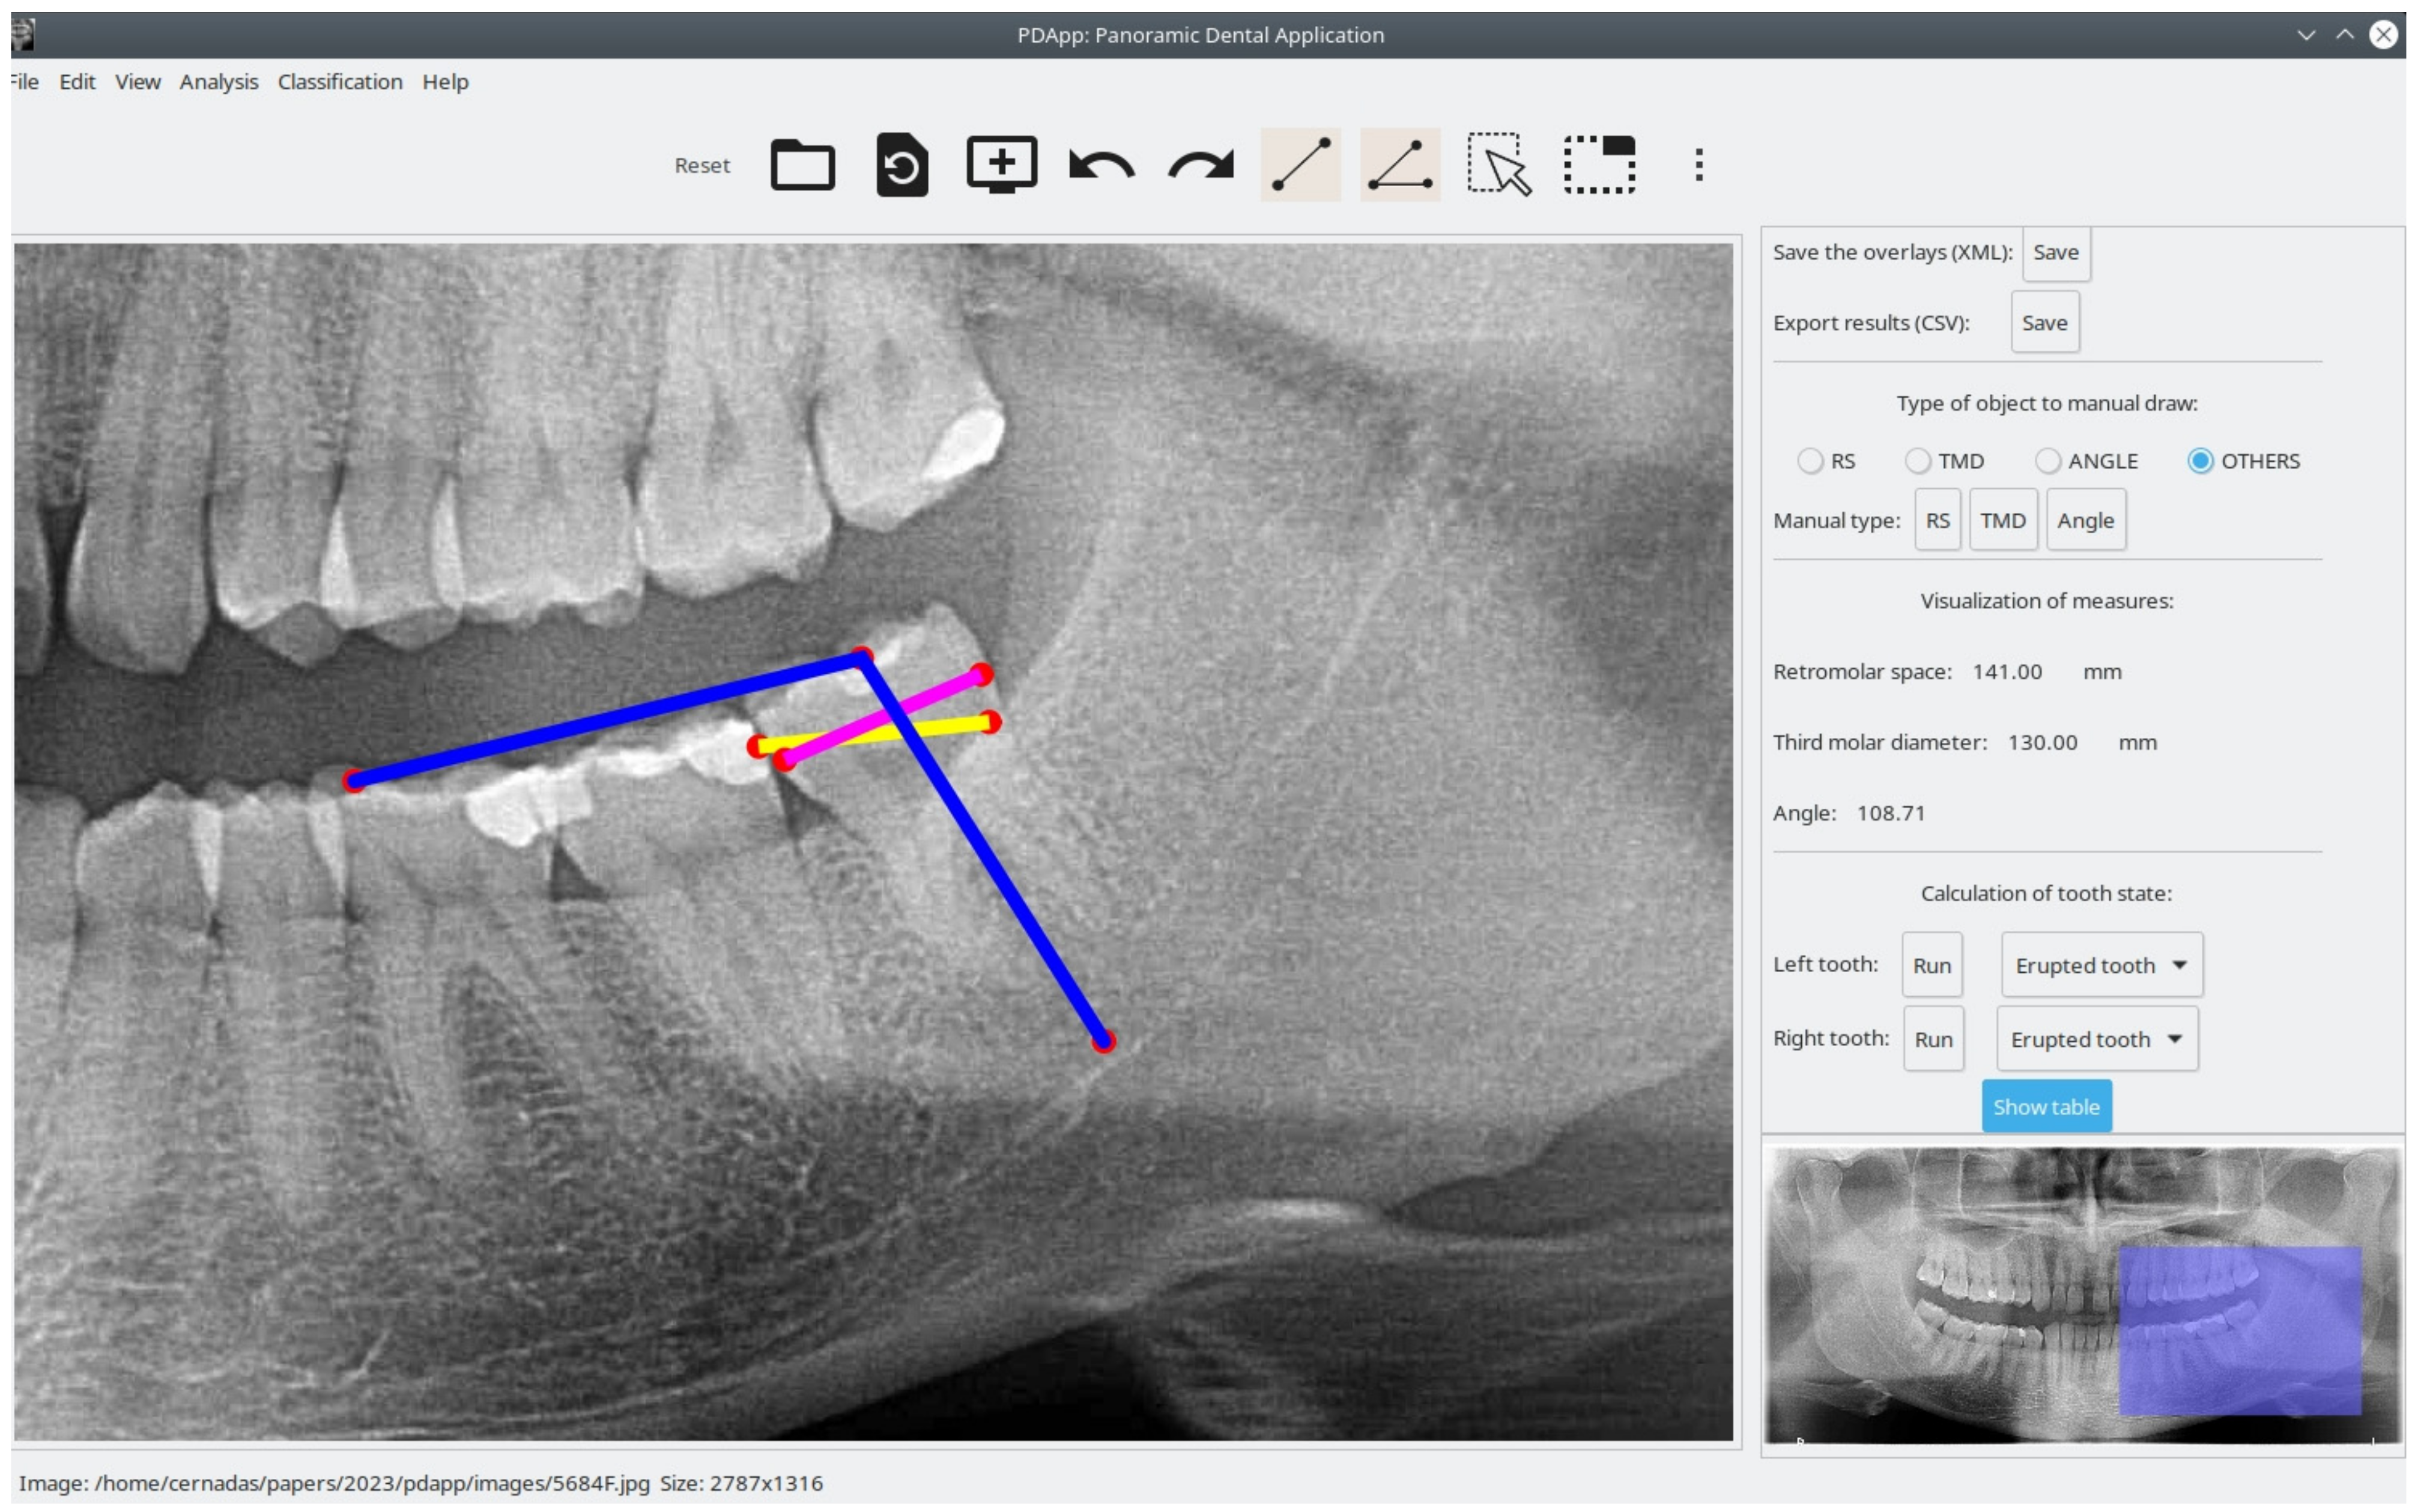
Figure 4 shows a case of a third molar that is classified as erupted by PDApp.
The software is reliable and precise because it allows reviewing the classification of mandibular third molars.
Figure 5, image (a) shows a case of a third molar that is classified as erupted by PDApp and image (b) a posterior panoramic radiograph images confirms the PDApp results. It is also easy to use and install. Another advantage that the program offers compared with manual quantification is the possibility of sharing the images and results among other experts to evaluate each case, reducing the variability among experts.
The perception of users regarding PDApp was evaluated using the system usability scale (SUS), a free questionnaire used to measure the learnability and subjective perceived usability of computer systems [
26,
27]. This is a questionnaire with the following 10 items:
- (1)
I think that I would like to use this product frequently.
- (2)
I found the product unnecessarily complex.
- (3)
I thought the product was easy to use.
- (4)
I think that I would need the support of a technical person to be able to use this product.
- (5)
I found the various functions in the product were well integrated.
- (6)
I thought there was too much inconsistency in the product.
- (7)
I imagine that most people would learn to use this product very quickly.
- (8)
I found this product very awkward to use.
- (9)
I felt very confident using the product.
- (10)
I needed to learn a lot of things before I could get going with this product.
The items are scored on a 5-point scale ranging from 1 (strongly disagree) to 5 (strongly agree), resulting in a final system score between 0 and 100. A comprehensive interpretation of SUS scores [
28] is as follows: <25 indicates the worst imaginable system; 25 to 39 indicates the worst imaginable to poor; 40 to 52 indicates poor to acceptable; 53 to 73 indicates acceptable to good; 74 to 85 indicates good to excellent; and above 85 indicates excellent to the best imaginable system. A small sample of 8 to 12 users is sufficient to give a robust assessment of how users perceive the software. The SUS questionnaire to evaluate users’ perception of PDApp was filled out by eight dental experts and achieved a mean score of 100, indicating that the system is the best imaginable.
4. Discussion
Interest in knowing whether the eruption of the third molar occurs over time or not, or if we can predict its evolution, has been ongoing, as reflected in the dental literature. Several methods to predict third molar eruption have been presented using lateral radiographs, bite-wings, anterior-posterior radiographs, periapical radiographs or panoramic radiographs [
6]. Of the radiographic techniques used to assess mandibular third molar space and mandibular linear dimensions and angles, panoramic radiography yielded one of the most accurate estimates [
29,
30,
31]. Besides panoramic radiography, it is the most popular radiological record for the dental clinician and a common research image for assessing mandibular third molars for extraction [
32]. Ventä et al. described a transparent device to overlay panoramic images that assesses the probability of third molar eruption or impaction [
33]. Later, Begtrup et al. developed a method for predicting eruption based on cephalometric and panoramic radiographic measurements [
34]. It has been demonstrated that the greater the angulation, the greater the probability of tooth impaction. Vranckx et al. identified that a critical third molar angle of 27.0° is unfavorable for functional eruption; the authors established this threshold because this angulation tends to enlarge over time [
35]. Basically, if the third molar has low initial angulation and an adequate retromolar space for eruption, then eruption without pathology is possible.
The exact prediction of third molar eruption is still a challenge in clinical dental practice. Prediction during growth of the patient could be of great interest and help in planning future dental treatments (surgical exodontia but not dental extraction, orthodontics, or prosthesis). Clinical assessment through the use of reliable and simple predictive tools is essential for evaluating the status of eruption of mandibular third molars. The relevant literature describes several approaches for predicting the probability of impaction on orthopantomogram (OPG) images, including methods by Olive, Ganss, and Ventä, although they were not found to be reliable or accurate [
36,
37]. Previously, Castella et al. (1998) concluded that third molar impaction is a predictable event that involves eight variables (long axes of second and third molars, functional occlusal plane, mandibular plane, gonial angle, mandibular canal reference, mandibular midline, orbital reference), but it is difficult to apply in clinical practice [
22]. In a previous study, we compared two predictive methods based on analyzing the retromolar space, space available for eruption (Olive and Brasford’s method), and the direction of tooth eruption (Olmos’s method), factors that were considered the most important in third molar eruption. Olmos’s method demonstrated more utility in assessing eruption prediction in clinical practice [
21].
Although these methods are widely used in clinical practice and scientific investigations/studies, they all rely on manual measurements which require much time and effort. There is also a high degree of subjectivity (both intra- and inter-observer) in the data analysis obtained from manual methods, and the inconvenience of applying them in routine clinical practice is also a major factor that hinders use. Recently, Vranckx et al. [
38] presented a tool to automatically measure the molar angulations on panoramic radiographs and predict whether or not a molar will erupt. The focus of the proposed PDApp software, on the other hand, is on predicting whether or not the molar will erupt in the future from information provided by experts and not limited to molar angulation. Our application combines the measurement of third molar angulation in relation to the occlusal plane with the radiological retention coefficient (RCC) calculated by performing linear measurements [
20]. Taken together, angular and linear measurements increase the precision of the tool. We consider the lack of retromolar space at least as important as the angulation of the third molar itself. Nonetheless, Hatabb el al. [
14] also found that 17% of third molars with adequate retromolar space still failed functional eruption.
We attempted to automate the prediction of third molar eruption with the aim of reducing the time required to obtain an analysis, improving the accuracy of identifying eruption status, and reducing errors due to clinician subjectivity. The results indicated that PDApp is an easy clinical tool for identifying the status of eruption or retention of the mandibular third molar based on panoramic radiograph images.
In order to overcome the limitations of the current work, we will conduct further studies on a larger number of panoramic radiographic images, with more types of third molars and not only those that are mesioangulated (i.e., vertical and distoangular), and images of non-Caucasian patients will be needed to allow generalizing the results. Third molar eruption is a complex multifactorial process and neither factors involved in the process are completely understood nor the worldwide rate of occurrence known. Third molar impaction is much more likely in the mandible than the maxilla, and mesioangular impaction is the most frequently orientation type of impaction [
29].
The PDApp was developed for a single center population and should be warranted to test its use in a larger population to assess the generalizability of the results obtained. Therefore, validation of this tool that could predict eruption status over time for patient populations would be widely used.
The most common treatment for third molars is exodontia, and information on the eruption or non-eruption status (retention) of these teeth is essential to estimate the potential need for treatment for the individual patient and also at future dental population-based studies for economic analysis. This information would be valuable when the results of population-based oral health surveys included radiographic examination and prediction of eruption status. Thus, according to Ventä et al. to ensure consistency between clinical and radiographic findings, dentists must check the panoramic on the same day and confirm the identification of teeth in clinical examination [
39].
The clinical relevance of our tool lies in individualized patient counselling. Before surgery, the patient is informed about the course of life of his third molars including future status of eruption. Clinicians treating young adults know if third molars have erupted or are not yet erupted years before the eruption. PDApp not only records the eruption status at the time of taking the panoramic images but also the potential final status of third mandibular molars.
5. Conclusions and Future Work
In this paper, we present PDApp, a new reliable and easy-to-use software tool that we developed for estimating third molar eruption potential based on panoramic radiological images of adolescent/teenage patients. This software provides a friendly GUI to manually draw the retromolar space, third molar diameter, and angle on the image. The probability of positive (eruption) and negative (non-eruption) potential is then automatically predicted. PDApp allows clinicians to review, share, and save the analysis at any time. The software was tested during daily practice at the odontology faculty at the University of Santiago de Compostela in 2021 and achieved an accuracy of 97.96% in predicting third molars as erupted or retained.
The PDApp software is simple to use and install and has the following advantages:
- (1)
It works with digital radiological images.
- (2)
It allows automatic monitoring, i.e., measuring distances and angles.
- (3)
It allows prediction of eruption potential.
For these reasons, it could be easily implemented in the daily practice of dental clinics. PDApp could facilitate and optimize routine oral radiological examinations and lead to ever-increasing diagnostic accuracy and optimization of treatment planning. PDApp represents a major advance beyond what is currently available for daily clinical practice. In fact, the mean score for experts’ perception of PDApp on the SUS questionnaire was 100, which means that they consider the software to be the best imaginable system. This tool allows prompt clinical decision-making on whether or not to extract an unerupted third molar and can help in minimizing the postoperative complications of surgery and the sequelae of follow-up over time. Hence, PDApp facilitates optimization of personalized oral health care.
In future work, the objective will be to provide automatic analysis of panoramic radiographs to recognize the retromolar space and third molar distance and angle (or other non-interpretable measures) in order to build a fully automated system for predicting third molar eruption potential.


 and
and 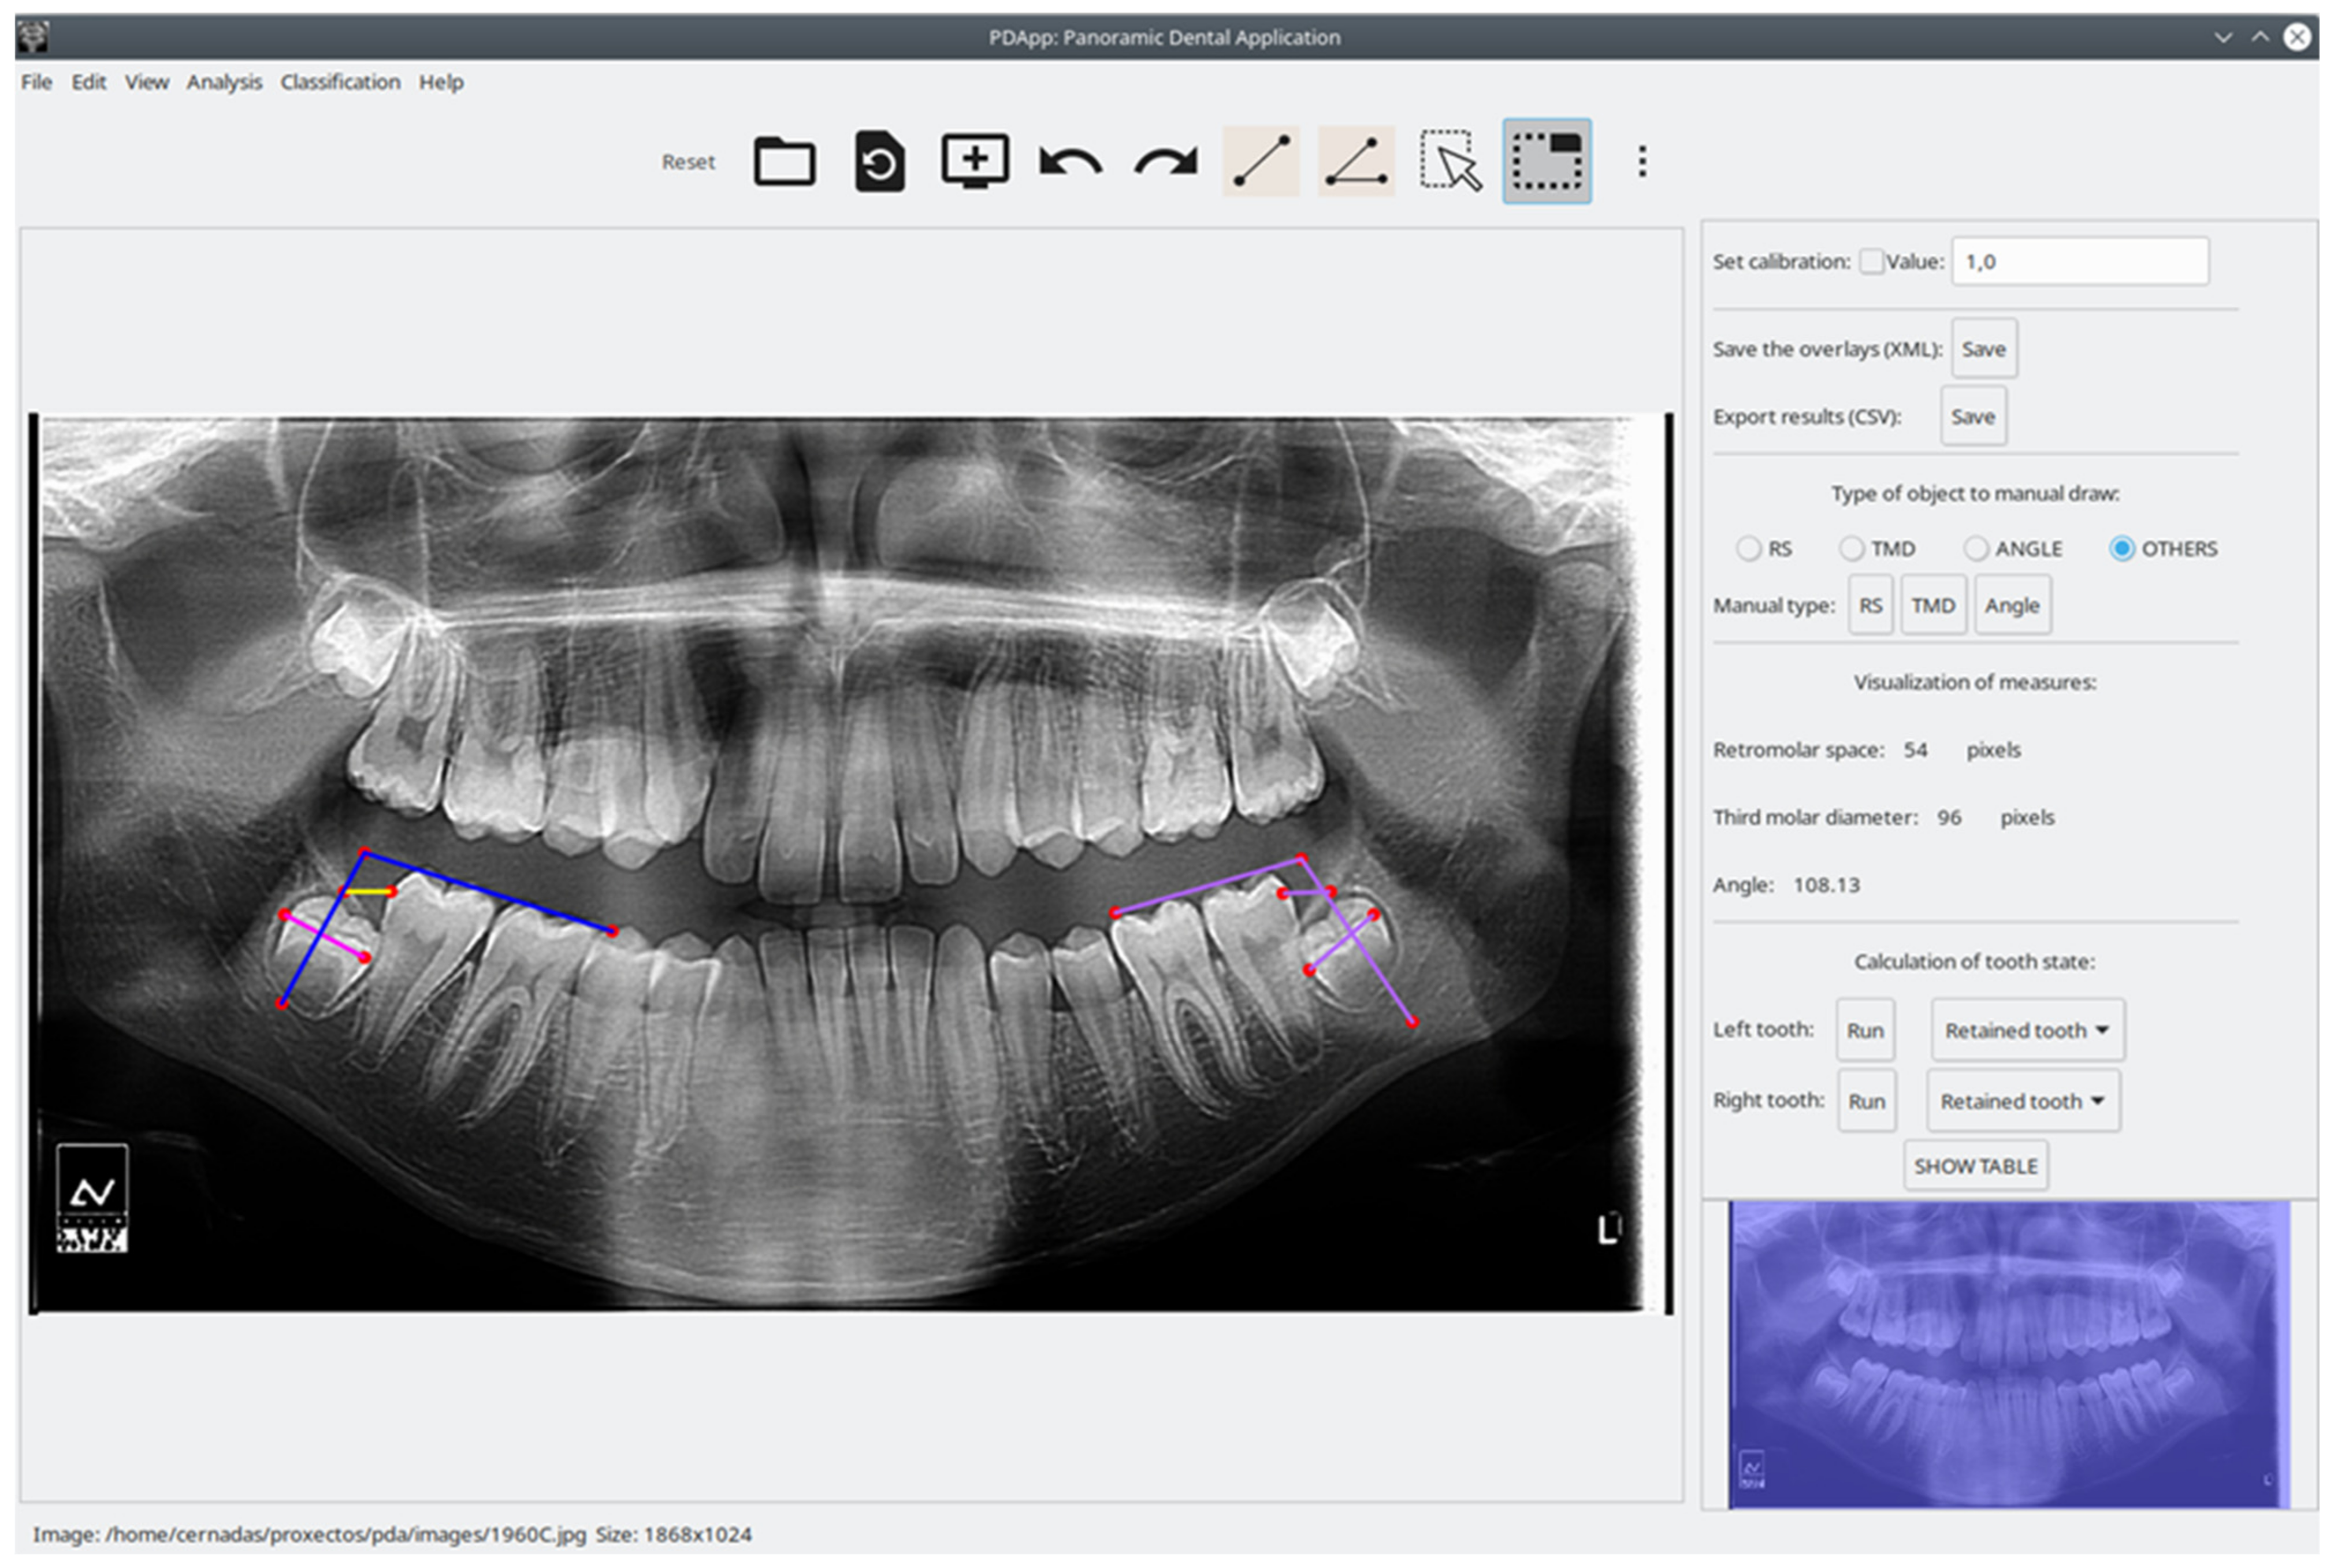


