Article

Research on the Dual-Objective Scheduling of the Pipeline Path of Liquid Terminal Resources Based on a Hybrid Algorithm

School of Transportation and Logistics Engineering, Wuhan University of Technology, Wuhan 430063, China
*
Author to whom correspondence should be addressed.
Appl. Sci. 2024, 14(14), 6195; https://doi.org/10.3390/app14146195
Submission received: 8 June 2024 / Revised: 8 July 2024 / Accepted: 8 July 2024 / Published: 16 July 2024

Abstract

:
With the daily use of liquid cargoes such as crude oil and their derivatives, the global transportation of liquid cargoes has developed rapidly. Liquid cargoes are mainly transported via tankers and pipelines. In the liquid terminal, the handling operations and internal transportation operations are conducted using oil transfer arms and pipelines, and the pipeline path of the cargo is selected using valves. The number of times a valve opens and closes and the length of pipeline paths are the main factors that affect handling time and cost. In addition, different types of valves have different operating costs and levels of operating energy consumption. At this stage, most of the valve selection work is still manually completed, which consumes a lot of time and generates high labor costs, and the actual operation efficiency is low. In this paper, the cargo unloading pipeline path is the main research object, the problem of oil transfer arms–valves–pipeline (PAVP) is proposed, and a dual-objective model is established, accounting for total time in port and the unloading cost of the vessel. An NSGA-II-Dijkstra hybrid algorithm is employed to solve the PAVP, and the improved algorithm (INIIDA) is designed to improve the solution speed via an adaptive dynamic probability based on the Pareto level and heaps in the shortest path. The results show that the INIIDA could better address the PAVP than the NSGA-II-Dijkstra hybrid algorithm. Innovative fusion algorithms are employed to improve the efficiency of port operations.

1. Introduction

Liquid bulk refers to goods with flowing and semi-flowing states. Such goods include crude oil, petroleum derivatives, and liquid chemical raw materials. A large amount of crude oil and refined oil products passing through ports consists of flammable liquids. The liquid chemical raw materials that are often transported by water mainly include acids (such as sulfuric acid, acetic acid, hydrochloric acid, etc.), alkalis (such as liquid alkali, etc.), alcohols (such as methanol, ethanol), and benzene (such as phenol, etc.). Most liquid chemical raw materials are corrosive but are generally weaker than petrochemical products in terms of flammability and explosion. Therefore, there is a significant difference between liquid bulk ports and other ports.
After World War II, with the beginning of large-scale industry, industrial and oil ports were built and developed in the second half of the 20th century. Large ports were constructed near industrial areas. The heavy industry and petroleum industry divisions required enormous load capacities, were directly connected to ports, and could not be limited by shape, length, and load units. The operations of the described second-generation ports were determined by the iron and steel industry, petrochemical industry, and other large industries, as defined by the United Nations Conference on Trade and Development [1]. The technical features of large industries are as follows: they have a large yard close to the port, as well as an oil terminal with a complex security system, serving as the starting point of oil pipelines or power grids. The transportation system of ships, harbors, and pipelines has become a key support for the oil trade [2]. The formation of cargo flow routes at liquid terminals mainly depends on the extraction of goods and the global supply chain demand of goods [3,4]. The worldwide maritime trade was analyzed from the perspective of direct and indirect impacts, as well as consistency in oil trade flows [5]. The International Energy Agency (IEA) forecasted that the global petroleum requirement will peak in 2028, reaching about 105.7 million barrels per day. The oil demand for combustible fossil fuels (excluding biofuels, fossil fuels, and other non-energy-related uses) will average 81.6 million barrels per day in 2028. The growth in oil demand is influencing transportation trends and the development of oil terminals. Detailed data on this topic are shown in Table 1.
The data in Table 1 come from the report Oil 2023 Analysis and Forecast to 2028 published by the IEA; the units used are mb/d (million barrels per day).
In the transportation of liquid cargo, the liquid terminal is a crucial transit point due to liquid cargo’s flammability, explosivity, and corrosivity, and most of the research on liquid terminals published at home and abroad focuses on safety issues regarding the storage process and environmental pollution around the terminal. Petroleum hydrocarbons are an important new type of persistent organic pollutants (POPs). Inevitably, liquid terminals have become primary risk factors for petroleum pollution at sea [6]. Pipelines (spanning long distances) are an important mode of transportation for liquid petroleum and gas and are vital to the economies of plenty of countries. Pipelines and the environment can affect each other, causing some hazards. As a result of the harsh utilization environment involved, a significant threat of corrosion surrounds liquid petroleum and gas pipelines. The safe operation of pipelines can be ensured by accounting for the reasonable predictability of corrosion. The corrosion of liquid oil and gas pipelines can be predicted by traditional electromagnetic drive and mechanistic drive models, but the application conditions of these models are complex, the calculations are large, and the models need to be further improved [7]. Long-distance pipelines buried in special climate areas will inevitably be affected by geological disasters, resulting in the displacement, bending, or deformation of pipelines [8]. Some pipelines are equipped with a cathodic protection system (CPS) that needs to be inspected regularly to prevent corrosion [9]. However, many types of pipelines are used, and it is difficult to measure pipeline data comprehensively and accurately with a single inspection approach [10]. Pipeline safety is a critical issue; Ref. [11] indicated that more than 96% of ground-level moving pipeline accidents are caused by slope hazards, which can result in serious loss of life and property. For safety and organization, Internet of Things and wireless sensing technology are used in the detection application of oil and gas pipeline transportation [12,13]. In addition, the sustainable transportation of oil and gas is an important research direction [14].
Various effective technologies have been exploited to study the industrial and liquid terminals, focusing on optimal scheduling [15,16,17] to enhance transportation safety in port environments and across long-distance liquid cargo pipelines. However, research on the optimal scheduling of internal pipelines within liquid terminals remains limited. In this study, the problem of pipeline path issues from vessels to storage tanks for liquid terminal unloading operations (PAVP) is focused. The objective is to develop an efficient dual-objective scheduling methodology for the PAVP. The principal research contributions of this study are generalized below:
(1)
PAVP is proposed, highlighting the scarcity of research on internal scheduling issues at liquid ports, which primarily focus on export and import operations.
(2)
A dual-objective model for the PAVP is formulated, aiming to minimize the total cost of handling within the port and the overall vessel time at the port, while ensuring operational safety.
(3)
An improved NSGA-II-Dijkstra (INIIDA) is proposed to address the PAVP. This hybrid algorithm integrates NSGA-II with Dijkstra’s algorithm to solve the PAVP. Then the hybrid algorithm is ameliorated by the adaptive dynamic probability based on the Pareto level and heaps in the shortest path, making the algorithm adaptable to the PAVP.
The construction of this article is as follows: in Section 2, a literature review of previous work is presented. In Section 3, a dual-objective mathematical model of the PAVP is formulated. In Section 4, the NSGA-II-Dijkstra is described and the proposed INIIDA is detailed, including specific enhancements. In Section 5, the experimental study and comparison results are conducted. In Section 6, the conclusions and future research directions are introduced.

2. Literature Review

In the context of port scheduling problem, research on container terminals and dry bulk terminals significantly outweighs that on liquid terminals. There is a notable scarcity of studies addressing the operation scheduling of liquid terminals. This section aims to review relevant research on pipelines scheduling and related algorithms to tackle the scheduling problem at port, thereby providing valuable references and guidance for this study.

2.1. Research on Pipelines

Pipeline transportation is the most prevalent mode for transporting petroleum. Due to the hazardous nature of petroleum cargo, pipeline transportation poses social, economic and environmental risks, particularly in the event of pipeline failure leading to the leakage of harmful components. Leakage risks can often be mitigated by installing sectional valves along the pipeline, which help to reduce losses and associated risks. A tricky issue is determining the reasonable amount and location of valves depend on the risks present in each component. Cano-Acosta et al. [18] tackled the valve location problem (VLP) by modeling it as a shortest path problem and applying the Bellman-Ford algorithm.
Resilience indicators and process descriptions were studied in [19] for natural gas pipeline network system (NGPNS), considering different types of interference, a comprehensive structure was proposed to evaluate the power supply elasticity of NGPNS, including topology and operating conditions. The study explored the features of certainty and uncertainty perturbation. The maximum flow method and the shortest route approach were combined with operational and configurable coefficients to calculate the gas that supply volumes and paths before and after the disturbances.
Because energy companies explore more remote resources, petroleum and gas production systems have become increasingly complex, with pipeline systems getting deeper and farther offshore. The complex pipeline networks need to adapt to topological complexities encountered and significantly reduce total investment costs across various areas. In Ref. [20] research, the A* algorithm was introduced to calculate shortest path for pipeline placement optimization. In addition, the design of subsea pipeline paths is critical in the offshore oil and gas industry due to the complex seabed topography. Environmentally friendly, economical and safe pipeline path designs are crucial. The use of 3D underwater terrain models with various obstacles facilitates the design of the subsea pipeline roadbed. Based on 3D technique, Kang et al. [21] proposed a method for offshore pipeline path design combines the Dijkstra’s LCP algorithm with Laplacian smoothing algorithm to the presence of obstacles.
Pipelines are the main way of oil and gas transportation. Researches on pipeline transportation primarily focuses on the safe laying of pipelines, shortest path calculation, obstacle avoidance and cost reduction. Most of researches have concentrated on long-distance, buried and submarine pipelines.

2.2. Related Algorithms

NSGA-II has been extensively employed for dual-objective problem studies in various operational scenarios within ports, predominantly focusing on container terminals. However, the methodologies developed can serve as valuable references for broader applications.
Nasiri et al. [22] designed and optimized a dual-objective model for a sustainable network of hierarchical multimodal transport hubs. This model incorporates sustainability considerations from the economic, social and environmental orientations of decision-making in a hierarchical network. A sample of Turkish freight transportation network was used to sustain the proposed model.
The container ship stowage planning problem (CSPP) is a sophisticated and challenging theme involving multiple benefits. Wang et al. [23] designed a multi-objective model for the CSPP, aiming to optimize vessel stability and reduce the number of departures across the path, while considering constraints such as the physical construction of the vessel and the programming of the container yard. To solve this problem, they designed an NSGA-III algorithm integrated with local search components.
Priority is given to ships entering and exiting restricted shipping lanes in multi-harbor channels, and the optimal traffic flowing plan is formulated for respective ship to guarantee the safety and efficiency of ship sailing. Li et al. [24] analyzed the features of restricted channel in ports, and designed a multi-objective optimization model for vessel flow planning in confined waterways of multi-hub basins. An improved heuristic algorithm combining the NSGA-II and Tabu Search (TS) was appropriated to settle the model.
Tugboat services are elementary for berthing and unberthing large vessels, requiring terminals to develop efficient tugboat scheduling plans considering various operating conditions. Zhong et al. [25] constructed a green tugboat scheduling model with dual-objective and mixed-integer linear programming to optimize overall operation time and entire bunker expense. The NSGA-II framework was proposed to tackle the solution by coordinating the features of tugboat scheduling.
Aiming at the delay problem, Shi et al. [26] proposed dual-objective 0–1 integer linear programming model based on the capabilities of frontier harbors and flexible freight transportation needs at the network criterion over large time scales. Then they designed a heuristic advanced NSGA-II (HANSGA-II) to solve the model.
Efficiency of operation is one of the KPIs to measure the service level of a port. Container port scheduling problems typically involve channels, berths, quay cranes and internal trucks. NSGA-II has frequently been chosen to solve these relevant allocation problems [27,28,29], with experimental results demonstrating its effectiveness.
A method for identifying and characterizing waterways was proposed using AIS prediction data broadcast by vessels and registered by maritime vessel traffic service centers [30]. The Dijkstra algorithm was used to recognize potentially secure routes, considered the most commonly used routes by vessels between two locations.
For two commonly used path planning algorithms, Ant Colony Optimization (ACO) and Dijkstra, Baeza et al. [31] presented a methodological comparison of diverse implementation methods for the least cost path of long-distance pipelines in Chile and other countries.

2.3. Research Overview

Pipeline research mainly focuses on long-distance pipelines, addressing issues such as the shortest path and cost-effective route selection, which can be referenced under certain constraints. The research of multi-objective optimization algorithms is mainly centered on container and dry bulk terminals, with the implementation methods of these algorithms serving as valuable reference. In the liquid terminal, most resources are fixed in location, however, the scheduling of resources such as oil transfer arms, valves, and tanks remains an area of research significance.
There is limited research on operational scheduling of PAVP at liquid terminals. To address this research gap, this paper focuses on the unloading operation at the liquid terminal and introduces the PAVP. A dual-objective model is constructed and an INIIDA is developed to effectively solve the model.

3. Problem Definition and Optimization Model

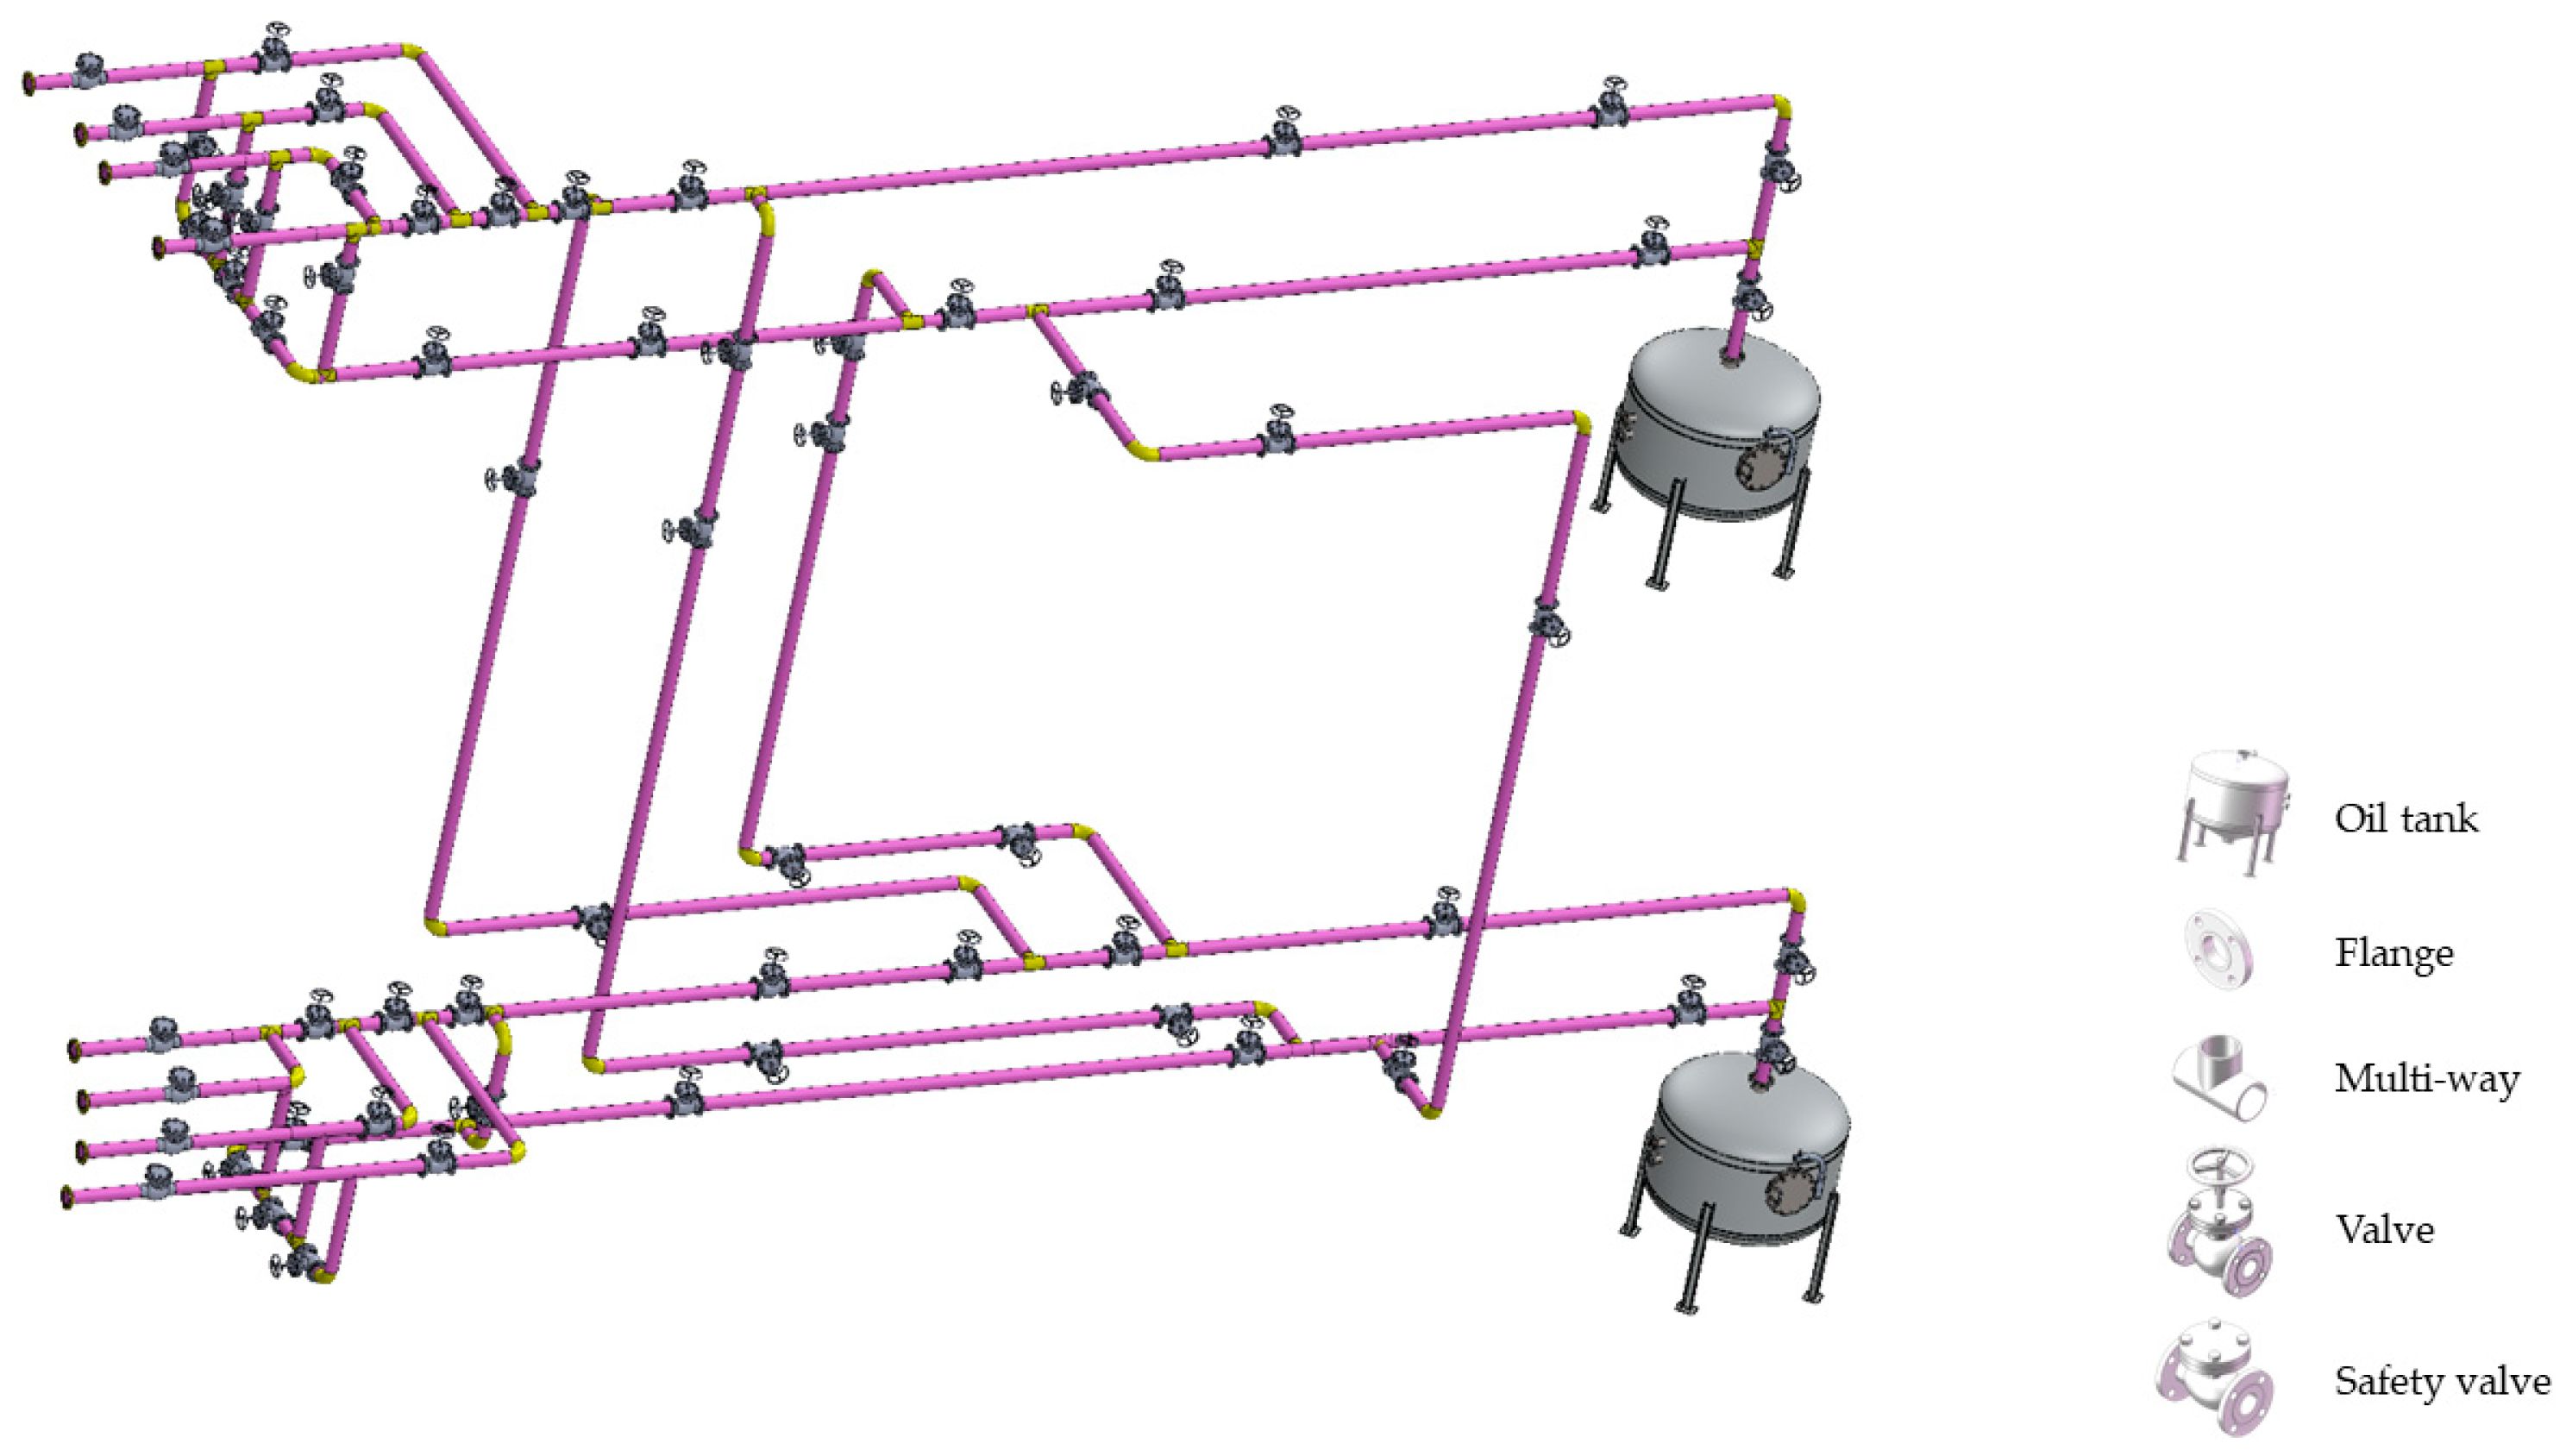
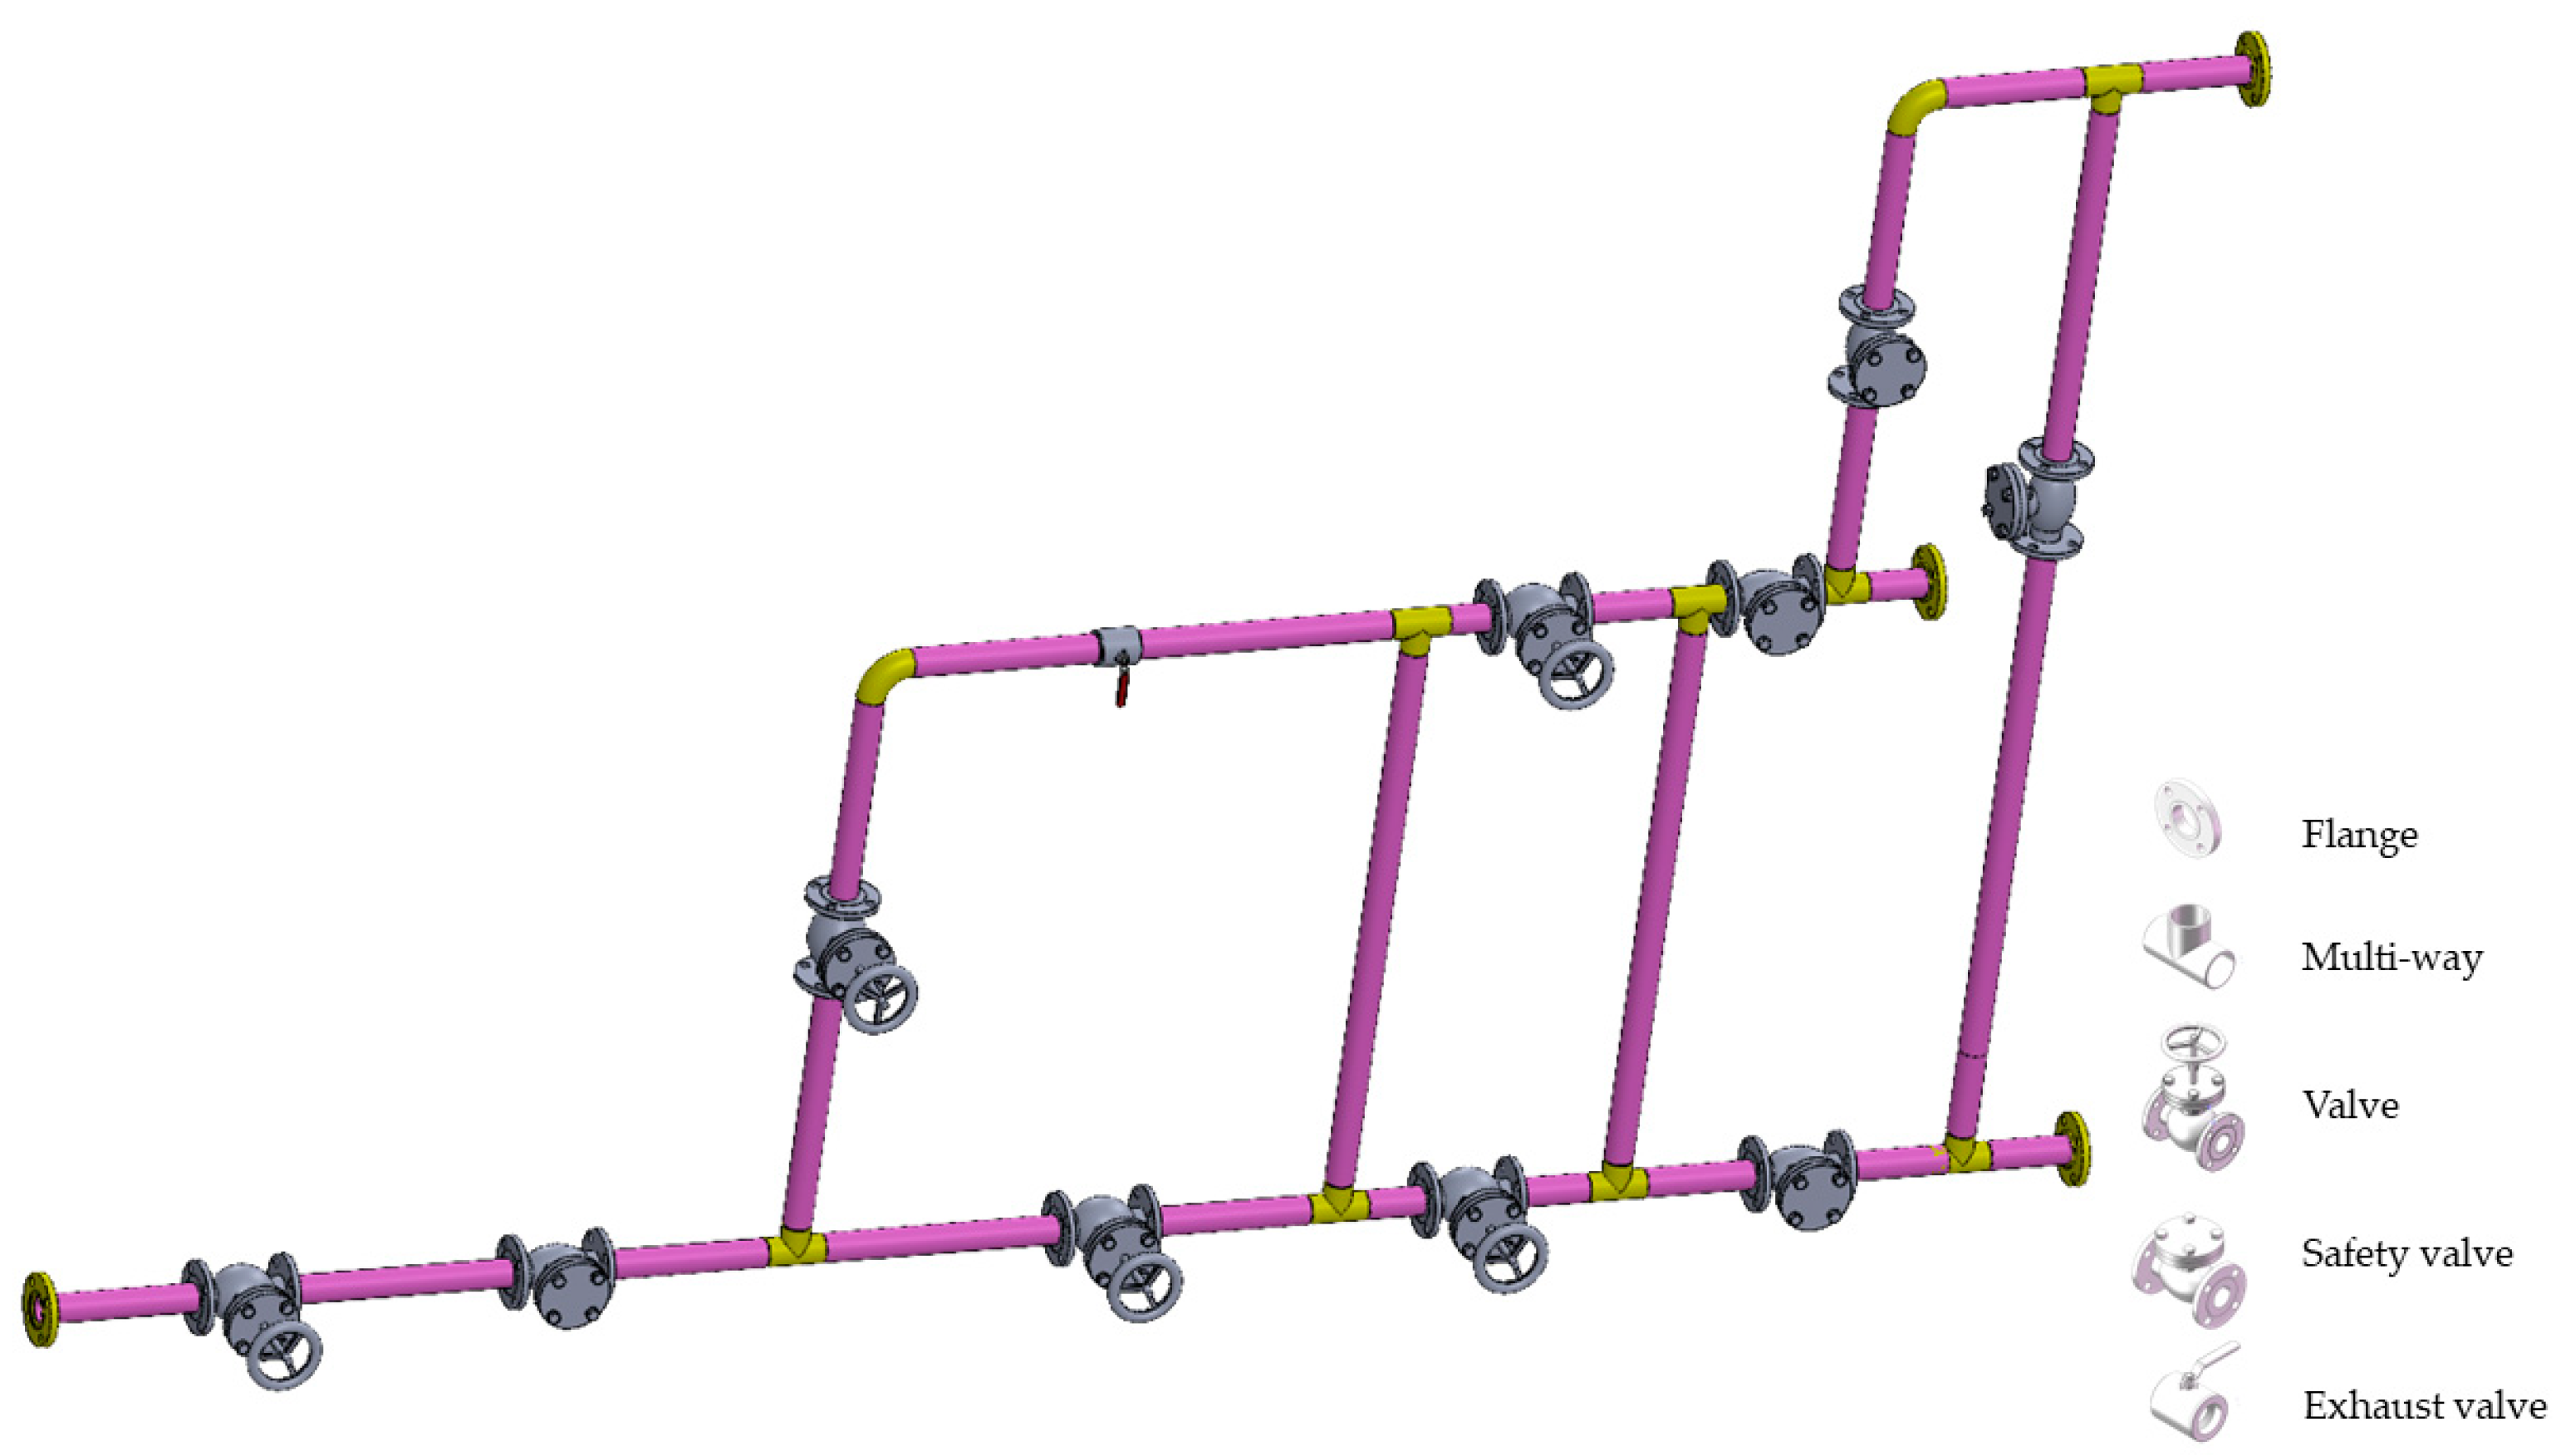
3.1. Problem Definition

Due to the particularity of liquid cargo, the handling process is different from the process of container and dry bulk cargoes. For instance, the oil transfer arm is fixed in a relative position. After the vessel’s arrival at the designated berth, the oil transfer arm is connected to the vessel in a fixed position for handling operations. According the type of cargo, appropriate oil transfer arms and pipelines are selected. Different pipelines can transport different types of goods, mainly including fuel oil, gasoline, jet fuel, naphtha and other refined oil, as well as benzene, ketones, acids, alcohols and other chemicals.
In this paper, the focus is on the resource allocation for the unloading operation of fuel oil. This process involves the selection of oil transfer arms from the designated berth, the allocation of valves and pipeline paths, and the transportation to oil storage tanks until the unloading operation is completed, culminating in the vessel’s departure. The PAVP problem focuses on the allocation of oil transfer arms, valves, pipelines, and tanks. Figure 1 illustrates the basic process layout for the PAVP at small-scale berths. A flange represents an oil transfer arm, and the valves include different types of valves.
Valves and pipelines are the key components in the unloading operation of liquid cargo. The choice of valves and pipelines affects the length of the path through which the liquid flows, the number of valve operations, and the measurement control of the pressure gauge and flowmeter. These factors result in different values for the unloading time and overall energy consumption.
Each valve is recorded as a node, and the pipeline is recorded as the connecting arc between nodes, all of which are directed arcs. A brief schematic diagram of the valve pipeline is shown in Figure 2. From a flange to another flange, there are different paths, different lengths, and different valves.
Moreover, liquid cargos are divided into owner-cargos and non-owner-cargos. Berths and oil storage tanks are classified as designated and non-designated. Owner cargo is unloaded to the designated oil storage tank at the designated berth, or to the designated oil tank at a non-designated berth. Non-owner cargo is unloaded to the public storage tanks of terminal considering the tank status at the vacant berth.

3.2. Model Formulation

3.2.1. Basic Assumptions

To facilitate the research of the PAVP and the establishment of the model, we assume the followings:
(1)
The type of liquid cargo, carrying capacity, handling process requirements and other information loaded of the arriving vessel in a planning cycle are known. The port production operation plan must collect this information before the vessel arrives at the port.
(2)
Only the unloading path of liquid cargo is considered, and the cargo of pipeline is flowed in a single direction.
(3)
When the vessel reaches at the designated berth, before the cargo is unloaded, the oil sampling and analysis should be carried out in the cargo hold to determine the quality of the cargo and the fuel quantity should be calculated. Unloading operations shall not be carried out until the oil quantity calculation and oil sample analysis are completed. The unloading time is calculated from the initiation of the oil transfer arm’s operation until it ceases. The early sampling time is included in the preparation and handling duration of the oil transfer arm.
(4)
A vessel may be carrying multiple types of cargo at the same time, and unloading one type of cargo counts as one operation. And each type of cargo on the same vessel is carried out only once per operation.
(5)
The flow velocity of liquid cargo in the pipeline is constant.
(6)
The inner diameter of all pipelines is constant, i.e., the cross-sectional area is uniform.
(7)
The time required for the valve to open or close is not considered, and the time for liquid cargo to wait for the valve to open is not considered. Only the number of valve operations is calculated. Valves are assumed to be initially fully closed.
(8)
Long-distance pipeline docking and transshipment are not considered; only the internal transportation from the berth to the oil storage tank within the terminal is included. The vessel’s onboard pump is assumed to provide sufficient pressure for unloading from the vessel to the tank.
(9)
Operations such as cargo oil sweeping, checking bilge oil levels, and crude oil washing are considered part of the pipeline oil circuit emptying time.

3.2.2. Symbol Description

To promote the foundation of the model of PAVP, the descriptions of the symbols used are listed in Table 2, Table 3 and Table 4:

3.2.3. PAVP Model

Based on the vessel arrival plan, the multiple optimization objectives for the PAVP were established: minimize the cost of using oil transfer arm; minimize the cost of pipelines transportation; minimize the cost of using valves; and minimize the operation time of a planning cycle.
Generally, increased use of oil transfer arms results in faster unloading of ships, but this also raises the cost associated with using the oil transfer arms. Pipeline transportation costs are generally lower but may require multiple valve opening and closing operations to increase valve usage costs and operating energy consumption. Minimizing the operating time of vessels in port can lead to an increased number of oil transfer arms, pipelines, and valves being used, which, in turn, raises the overall operational costs.
To sum up, the dual-objective functions proposed in this article are defined as Equation (1):
M I N C , T
Equation (2) represents all ship handling costs within the planning cycle, including the cost of using oil transfer arms, the cost of pipelines transportation and the cost associated with valve operations.
C = a A ( C 1 + C 2 + C 3 )
Equation (3) represents the total time of all vessel in port during the planning cycle, including the preparation time for the oil transfer arm, the time of unloading of cargo and the pipeline oil circuit emptying time.
T = a A ( T C + T c a + T p a )
To calculate the estimated time of departure of vessel a, including the oil transfer arm preparation and handling time, the oil unloading time and the pipeline oil circuit emptying time, the calculation formula is provided in Equation (4):
E T D a = A T A a + T C + T c a + T p a
Total time for the vessel liquid cargo to be unloaded into the pipeline is given by Equation (5):
T c a = W a N c a × V c a
The unloading flow rate of the oil transfer arm is determined by the efficiency of the pump equipped on the vessel. Setting the coefficient β, which is defined as the efficiency coefficient of the vessel’s pump, this coefficient β is related to the size of the vessel and the service life of the pump. Due to the fixed diameter of the pipeline, when multiple oil transfer arms are used simultaneously, their flow rates will affect each other. Setting the coefficient γ, which is defined as the mutual influence coefficient of multiple oil transfer arms, set γ = 1 for one oil transfer arm; γ = 0.95 for two oil transfer arms; γ = 0.9 for three oil transfer arms; γ = 0.85 for four oil transfer arms, and so on. Equation (6) calculates the unloading flow rate:
V c a = β × γ × V a
Among them Va is the standard flow rate of one oil transfer arm of vessel a, and the standard flow rate is equal for each oil transfer arm of vessel a.
Pipeline oil circuit emptying time is calculated by Equation (7):
T p a = ( D s × δ ) × L a × ρ v × D s × θ × ρ = δ × L a v × θ
In Equation (7), δ is the pipeline section occupation coefficient, θ is the actual speed coefficient, v is the maximum passable flow velocity of the pipeline, and ρ is the universal calculating density of liquid cargo. In practice, the density of each type of cargo is different, but a common value is used for calculation, set δ = 0.75, θ = 0.8, v = 4.5 m/s, ρ = 0.87 × 10³ kg/m3.
The cost is mainly divided into three parts, the cost of oil transfer arms, the cost of pipelines and the cost of valves.
The cost of oil transfer arms includes the fixed cost and the per-use cost. The fixed cost is the handling cost of the oil transfer arm, and the per-use cost is calculated based on the oil transfer arm’s using time, the calculation formula is given by Equation (8):
C 1 = ( C s + C t × T c a ) × N c a
The occupancy length is calculated by Equation (9):
L a = i , j F l i j × p j × q d i j × ω ( l i j ) × ω ( a l i j )
In Equation (9), if the valve j is open, pj = 1, otherwise pj = 0; if the pipeline is vacant, qdij = 1, otherwise qdij = 0; if the line status between valve i to valve j is connected, ω(lij) = 1, and otherwise ω(lij) = 0; for the unloading path of the vessel a, if the cargoes passed from valve i to valve j, ω(alij) = 1, otherwise ω(alij) = 0.
The cost of pipelines is calculated by the occupancy length, as shown in Equation (10):
C 2 = C l × L a
The cost of valve is credited as Equation (11):
C 3 = j F x n j F × C f j + μ × ( j F x n j F × E C f j )
Among them, the types of valves include electric gate valves (FDZ), electric ball valves (FDQ), manual gate valves (FSZ), manual ball valves (FSQ), ordinary valves (FPF), exhaust valves (FEP), safety valves (FSS) and multi-way valves (FST). Different valves require different energy consumption and different operation costs.
The constraints are as follows:
g d = g a = g e , g G
Constraint (12) ensures the types of liquids that can be transported by pipelines are the same as those transported by vessels and the type of liquid cargo stored in the oil tank, and the oil tank e can be fed only one type of liquid.
W a e E W e u
Constraint (13) ensures the total storage capacity of the oil storage tank that can be selected is more than the unloading capacity of the vessel.
t e ( max ) < t e ( o u t ) ,   t e ( min ) < t e ( i n )
Constraint (14) ensures when a tank is filled, the oil need to be drained after a period of time, when a tank is empty, the oil needs to be fed after a period of time.
A T A a ( b ) < E T D a ( b ) < A T A a + 1 ( b ) , a A , b B
Constraint (15) ensures the vessel a must to be handled when it enters into the berth b, and the vessel a has left before the vessel a + 1 can enter the berth b.
n j F P R 1 n j F T 1
Constraint (16) ensures at least one pressure gauge has been passed in the path of vessel a to measure the pressure inside the pipe. Meanwhile, at least one thermometer has been passed in the path of vessel a to measure the temperature inside the pipe.
N C b N C A
Constraint (17) ensures the quantity of oil transfer arms occupation cannot exceed the available quantity of berth b.

4. INIIDA

A hybrid genetic algorithm based on NSGA-II and Dijkstra is designed to solve the multi-objective problem of PAVP. The algorithm employs non-dominated sorting using the Pareto dominance concept to classify individuals within the population. Individuals with higher non-dominated states are assigned higher hierarchical positions, increasing their likelihood of advancing to the next iteration. Crowding distance calculation ensures a uniform distribution of solutions across the Pareto front. The Dijkstra algorithm, rooted in greedy, breadth-first search, and dynamic programming principles, is utilized to determine the shortest path from one point to others in a graph. In the hybrid algorithm, Dijkstra is employed for pathfinding while NSGA-II aids in determining Pareto levels and solving the multi-objective model.
Figure 3 illustrates the procedural flow of the proposed NSGA-II-Dijkstra algorithm.
The NSGA-II-Dijkstra algorithm can only perform general solutions for this model of PAVP, due to the large number of valves, its computational time is lengthy. Therefore, improvements have been introduced to expedite the algorithm. An adaptive dynamic probability mechanism based on the Pareto level is designed. The steps of improved algorithm (hereinafter referred to as INIIDA) are presented as follows:
Step 1:
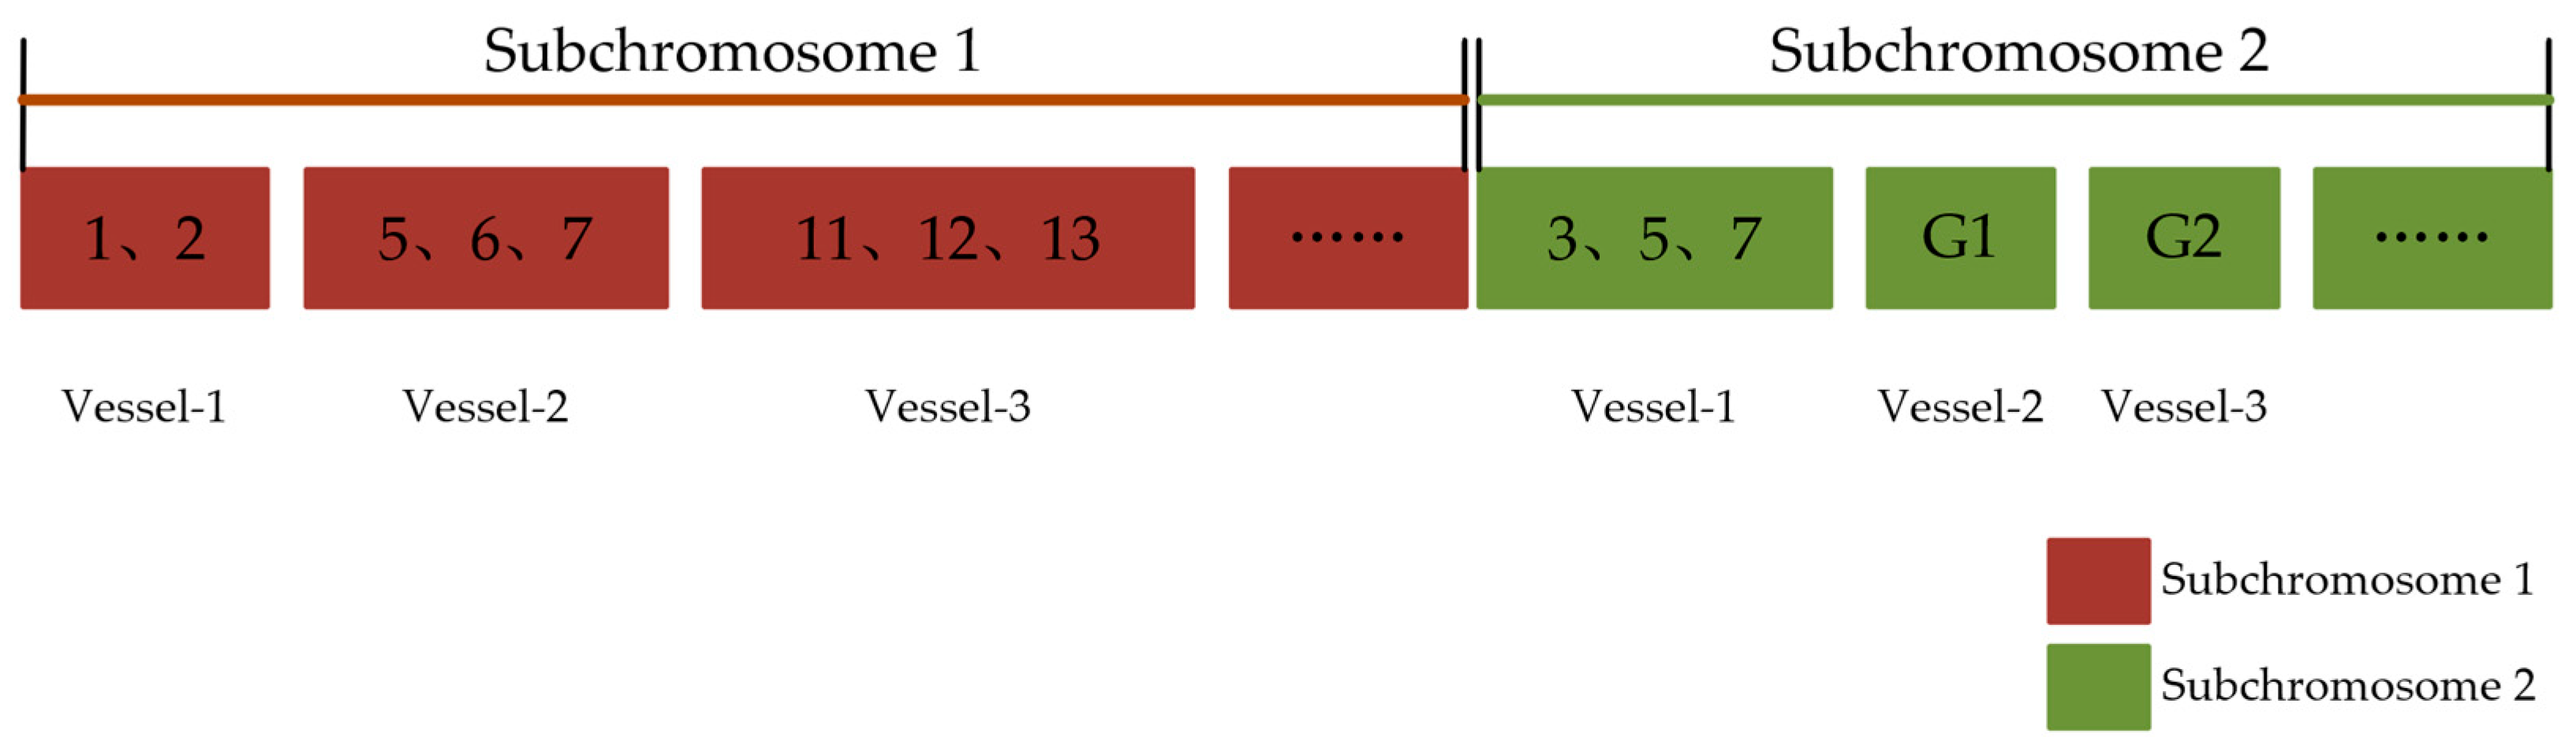
Encode the number of oil transfer arms and number of oil tanks into two subchromosomes. Generate an initial population of twenty distinct chromosomes randomly, specifying the quantities and specific assignments of oil transfer arms and tanks per vessel in an operational planning cycle for the genetic algorithm;
Step 2:
Perform non-dominated sorting of the initial population and determine dynamic crossover and mutation probabilities;
Step 3:
Select two chromosomes from a vessel for crossover. Randomly select two vessels in a plan for single-point crossover, creating two new chromosomes to complete a generational crossover;
Step 4:
Choose one chromosome from a vessel for mutation. Randomly select a chromosome in a plan to form a new chromosome for mutation;
Step 5:
Compute the shortest path for each chromosome based on chromosome characteristics and valve distances, utilizing the Dijkstra algorithm;
Step 6:
Evaluate fitness and ensure consistency between parents and offspring. Discrepancies between parents and offspring are managed to maintain solution validity while promoting genetic diversity within the population;
Step 7:
Parent and child confluence, Pareto level is calculated by nondominated ordering;
Step 8:
Dynamically adjust crossover probability of parents and mutation probability of offspring based on their Pareto levels within the population. This adjustment aims to enhance individual performance, favoring greater crossover probabilities;
Step 9:
Integrate Pareto levels into the next generation starting from the top level until the population size meets the required level, using crowding levels for selection;
Step 10:
Check termination conditions to determine if the algorithm should end. If conditions are met, terminate; otherwise, return to Step 3.

4.1. Population Initialization and Chromosome Encoding

Section 3.2.3 outlines the dual objectives of the PAVP: the cost and the time. Focusing on the scheduling of oil transfer arms and valves. The choice of oil transfer arms dictates the initial valve, marking the start of the pipeline path. Consequently, the encoding of oil transfer arms is crucial. The endpoint of this path is the tanks.
Chromosome coding adopts a two-segment coding rule based on natural numbers, with the chromosome length contingent upon the number of incoming vessels in the planning cycle. Under this coding rule, vessels are initially numbered based on their arrival times, and each chromosome corresponds to an incoming vessel. Subchromosome 1 represents the serial numbers of the selected oil transfer arms, with its length determined by the number of oil transfer arms chosen, which is dependent on the number of berths. Subchromosome 2 contains the serial numbers of the selected tanks, with its length determined by the number of tanks selected, as illustrated in Figure 4.
The initial population generation adheres to the specified constraints, consisting of twenty individuals.

4.2. Crossover and Mutation

In this article, the single-point crossover operation is applied, illustrated in Figure 5a. Two parent chromosomes are randomly selected, and a crossover point at the same position is determined to divide them into two segments. Subsequently, the corresponding segments are exchanged to obtain two offspring chromosomes.
Meanwhile, a single point mutation operation is performed, as illustrated in Figure 5b. A parent chromosome is randomly selected along with a mutation point, resulting in the creation of one offspring through mutation.

4.3. Adaptive Dynamic Probabilities Based on Pareto Level

In the NSGA-II-Dijkstra hybrid algorithm, fixed values are typically set for crossover and mutation probabilities. To enhance computational speed and efficiency, the INIIDA algorithm introduces adaptive dynamic probabilities based on the Pareto level.
Firstly, the linear decreasing law is established with the gradual decline of the pareto level, according to the Formula (18):
P c ( n ) = 1 × 0.95 n , n 0
To determine the pareto level of the parent in each iteration, the crossover probability of the offspring is set as the mean of the crossover probability of the two individuals of the parent, i.e., to be calculated by the Formula (19):
P C = ( P C ( P 1 ) + P C ( P 2 ) ) / 2
The mutation probability adjusts in relation to the crossover probability, as described by Formula (20):
P M = P C × μ
In this solution, μ is set to 0.2 to calculate the mutation probability.

4.4. Optimizing Dijkstra with Heaps

Due to the extensive network of pipelines and valves, the calculation time of d algorithm is long, impacting the overall efficiency of the algorithm. To mitigate this, an optimized heap data structure is introduced. Each ship’s oil unloading path from the port originates at the vessel’s oil transfer arm and terminates at various oil storage tanks. Initially, the fixed distances between each oil transfer arm and all oil storage tanks are computed and stored in a priority heap. This configuration prioritizes paths starting from the oil transfer arms and ending at the oil storage tanks. This initial heap setup ensures that paths are selected efficiently based on their proximity to the starting point and destination, thereby significantly enhancing calculation speed.

5. Experiments and Analysis

The berth situation of liquid terminal at the experimental site is designed based on the information of a domestic terminal, with pipeline lengths scaled proportionally to actual dimensions. The terminal features five berths. Berths 01, 02, 11, 12 and 13. Cargo at Berths 01 and 02 can only be directed into tanks G1 and G2. In contrast, cargo at Berths 11, 12, and 13 can be input into three reservoir areas, each comprising 20 tanks of 50,000 cubic meters of liquid cargo. Additionally, cargo at Berths 11, 12, and 13 can also be imported into tanks G1 and G2, which together can store 1,200,000 cubic meters of liquid cargo. Tanks G1 and G2 are designated for specific cargo owners. Furthermore, Berth 11 (120,000 DWT) is equipped with 3 oil transfer arms, Berth 12 (50,000 DWT) is equipped with 6 oil transfer arms, Berth 13 (5000 DWT) is equipped with 4 oil transfer arms, Berth 01 (200,000 DWT) and Berth 02 (300,000 DWT) are equipped with 4 oil transfer arms each.
Berths 01 and 02 can operate concurrently without interference due to their separate paths, while Berths 11, 12, and 13 share two main pipelines leading to tanks, allowing simultaneous operations of up to two berths without pipeline conflicts.
For purpose of prove the effectiveness and efficiency of the designed INIIDA in studying the PAVP, a suit of experiments was conducted and analyzed in this section. As mentioned in Section 2.3, the experiments primarily focused on comparing the NSGA-II-Dijkstra and INIIDA algorithms. The experiments distinguished between small berths (Berths 01 and 02, and tanks G1 and G2) and mixed berths (including all berths and tanks described in Figure 6). The study considered planning cycles involving 10 vessels, 27 vessels, and 42 vessels. Each instance was independently run multiple times to obtain Pareto optimal solutions.
The following experiments were conducted using MATLAB R2014a on a computer equipped with Intel Core i7 CPU of 2.4 GHz and 16.0 GB RAM.
The basic data were set in Table 5:

5.1. Small-Scale Berths

Small-scale berths are characterized by large vessels, long unloading times, and fixed path ends, all of which are transported to designated oil storage tanks. Due to the peculiarities of small berths, calculations were made for operation plans involving 10 vessels and 42 vessels.
Calculations of 20, 100 and 500 iterations are carried out using the NSGA-II-Dijkstra algorithm. The first level Pareto results of these different iterations are as illustrated in Figure 7:
When 10 vessels are planned in a cycle, increasing the number of iterations does not lead to a significant change in the results, indicating that the NSGA-II-Dijkstra algorithm can effectively solve the PAVP for this scenario. However, when the number of vessels increases to 42, the results vary significantly with the number of iterations. Specifically, the results of 500 iterations are markedly better than those of 20 and 100 iterations. This demonstrates that increasing the number of iterations has a substantial impact on the outcomes.
Subsequently, simulations were conducted for 10 vessels and 42 vessels in the small-scale berths, with 500 iterations performed using both the NSGA-II-Dijkstra and INIIDA algorithms. The comparative results are demonstrated in Figure 8:
It can be concluded that both algorithms can effectively solve the PAVP problem of small berths. The results of the INIIDA on small berths are slightly better than those of the NSGA-II-Dijkstra algorithm. However, INIIDA shows a significant advantage in computation time, taking approximately one quarter of the time required by the NSGA-II-Dijkstra algorithm. Additionally, the results for 42 vessels are superior to those for 10 vessels, indicating that the INIIDA algorithm performs better with larger data volumes. According to the actual conditions of terminal operations, a Gantt chart is used to represent one of optimal solutions for small-scale berths with 10 vessels, as shown in the figure below. In Figure 9, the number of oil transfer arms, the length of pipeline and the number of oil storage tanks are demonstrated.

5.2. Mixed Berths

The mixed berth was simulated using real liquid terminal data to experiment with 10, 27 and 42 vessels, with 1000 iterations performed using both the NSGA-II-Dijkstra and INIIDA algorithm, respectively. The results are illustrated in Figure 10:
When the operation plan for the mixed berth involves 10 vessels, both algorithms can find the first level Pareto set. However, as the number of vessels in the operation plan increases, the first level Pareto set obtained by the INIIDA is significantly better than that obtained by the NSGA-II-Dijkstra algorithm. This demonstrates the superior effectiveness of the INIIDA in the calculation results.
According to the actual conditions of terminal operation, a Gantt chart is used to represent the optimal solution for mixed berths with 10 vessels, as shown in the figure below. Figure 11 illustrates the number of berths, the number of oil transfer arms, the length of pipelines, and the number of oil storage tanks.

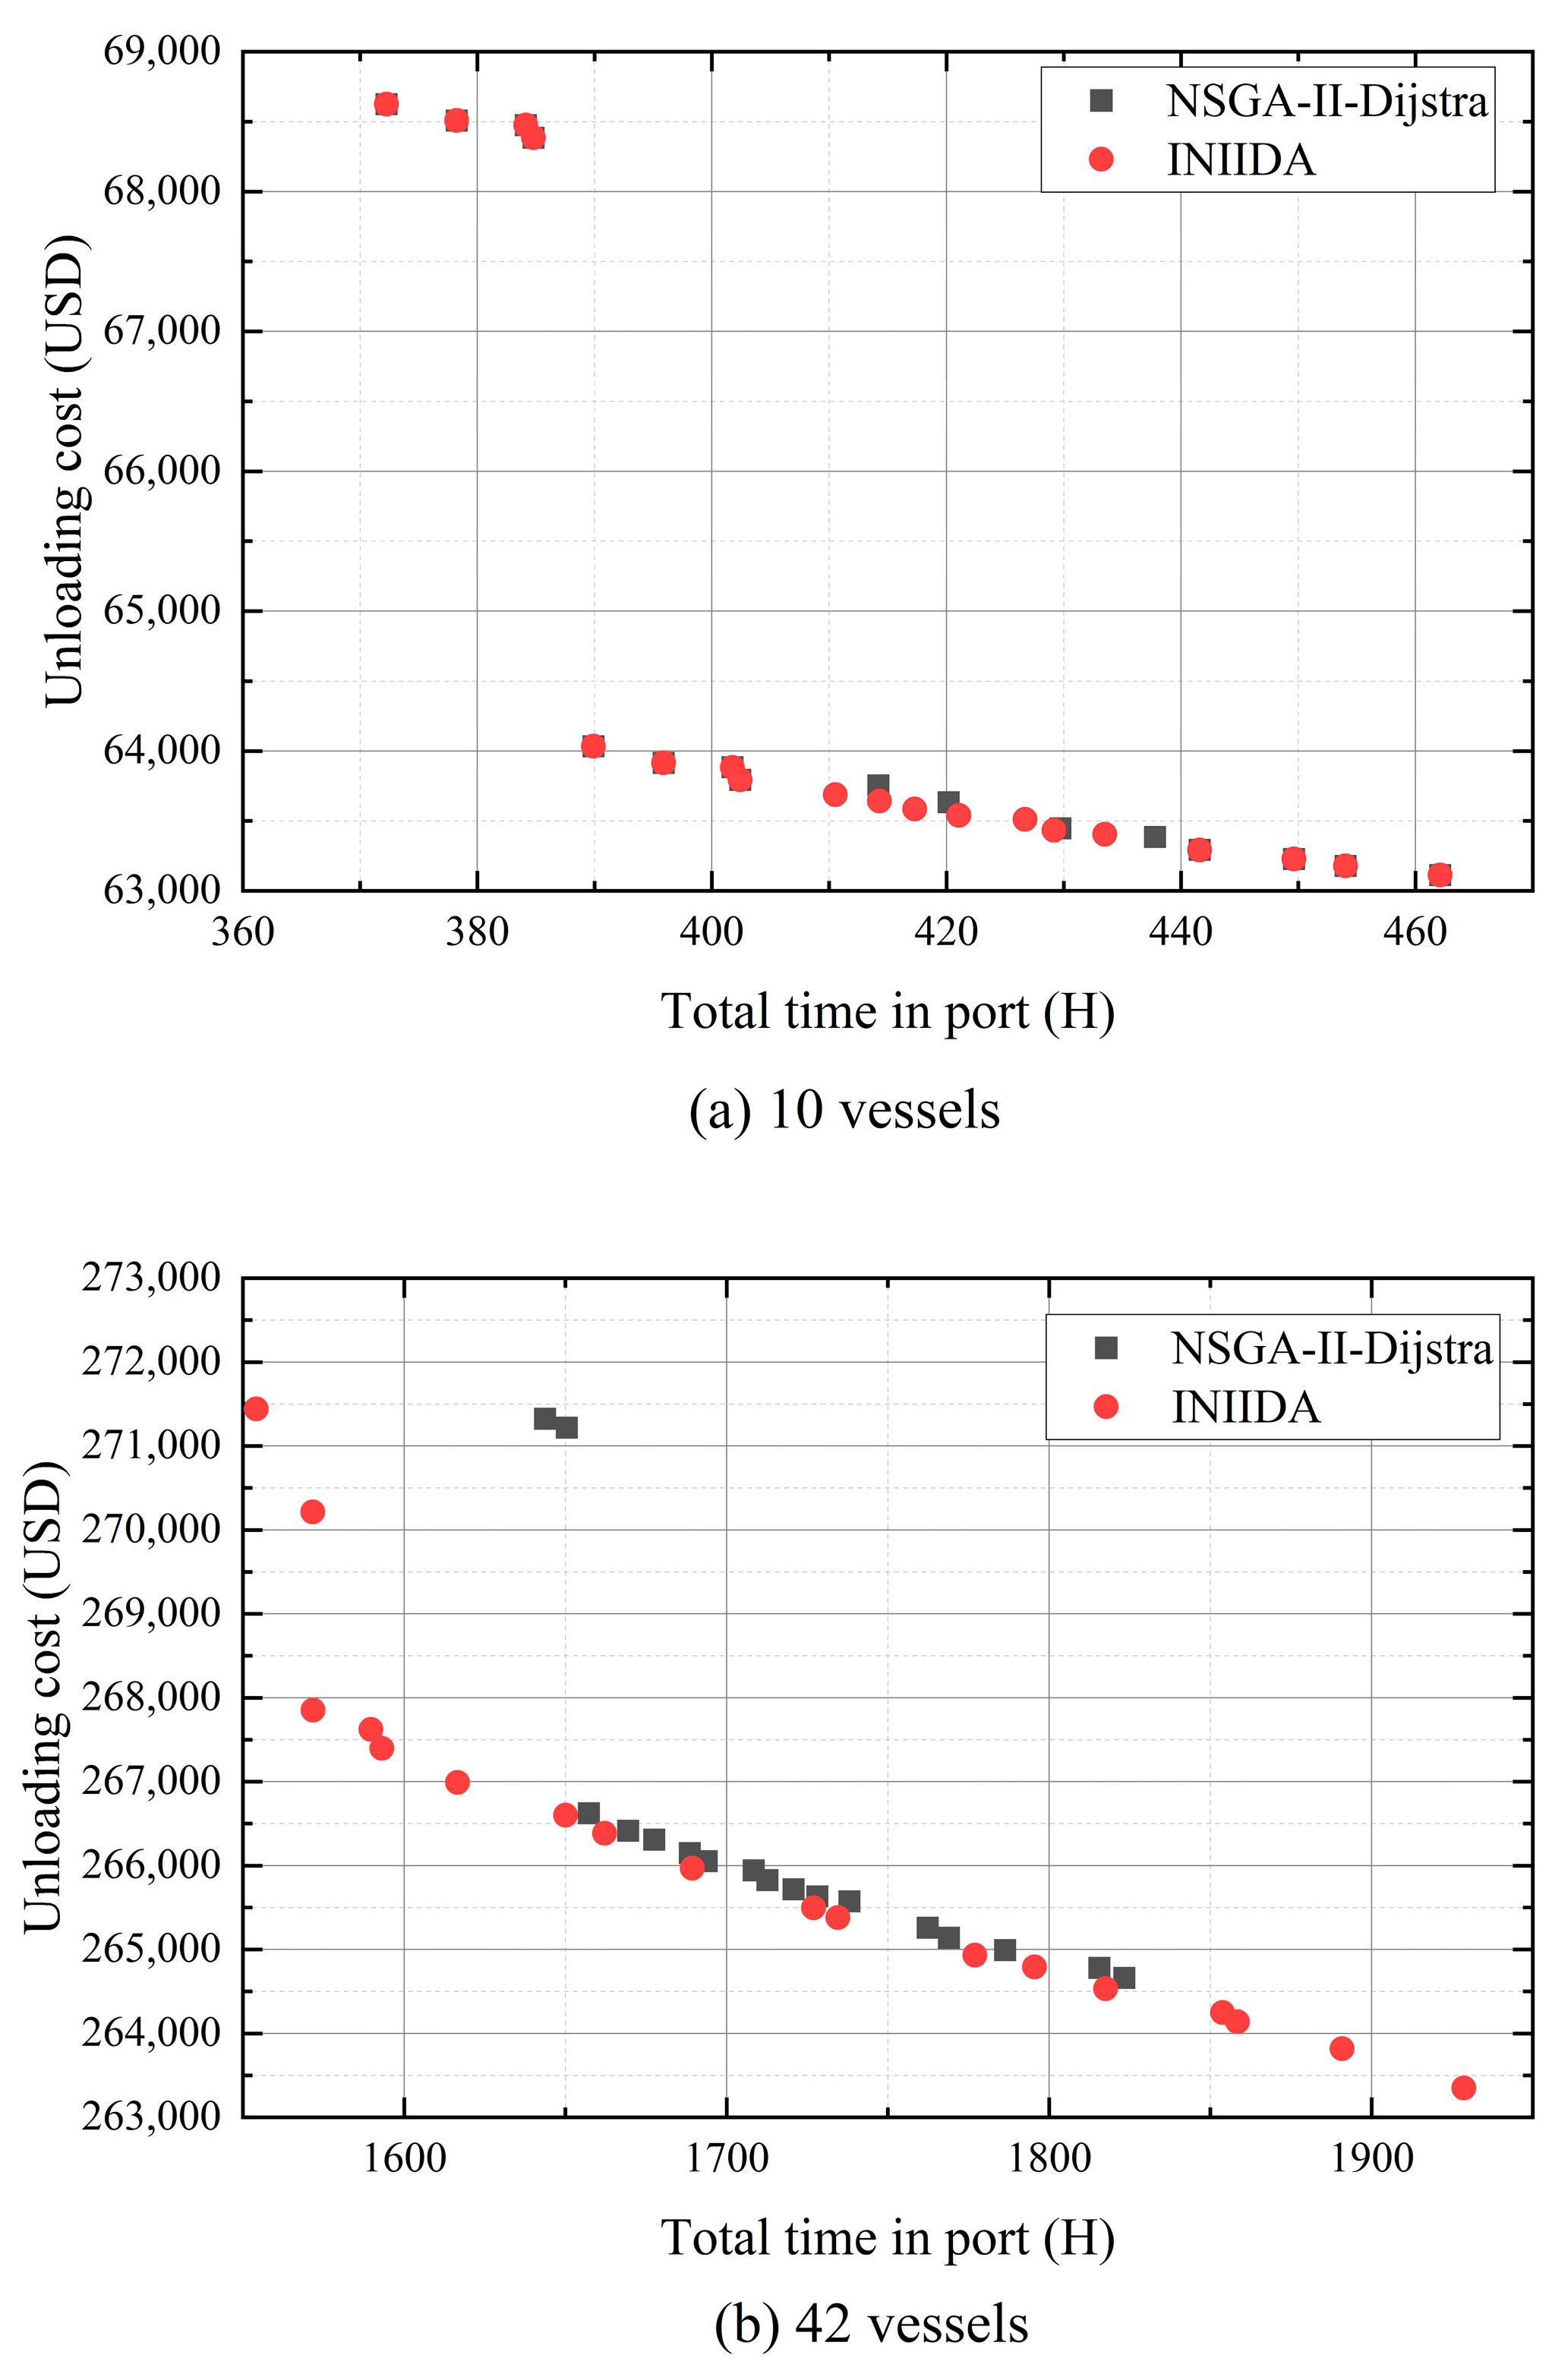
5.3. Algorithm Comparison

The two algorithms are compared in terms of computation time, and the results are presented in Table 6. The INIIDA shows a significant improvement in speed, which is basically approximately 30% of the NSGA-II-Dijkstra algorithm. This demonstrates the effectiveness of the INIIDA algorithm in reducing computational time.
For a practical case, some liquid terminal represents a type of small-scale berths. As an example, consider two berths and designated tanks with a relatively stable selected pipeline. The algorithm can quickly find the optimal path, allowing the PAVP to be solved efficiently using a simple algorithm. On the other hand, when dealing with mixed berths that include a significant number of valves and pipelines, and as the number of incoming vessels increases, the PAVP requires an improved algorithm for effective analysis. The superiority of the INIIDA algorithm is particularly evident in large-scale mixed berths.

6. Conclusions

The main research contributions of this article are as follows. From an academic perspective, the PAVP considering the selected number of oil transfer arms was studied, with the energy consumption of valves calculated. A dual-objective optimization model for the PAVP was constructed, intending to contemporaneously the minimal unloading cost and vessel total time in port, while also minimizing the frequency of valve operations. To better solve the PAVP, the NSGA-II-Dijkstra and INIIDA were proposed. An adaptive dynamic probability based on the pareto level and heaps in shortest path was designed to improve the NSGA-II-Dijkstra algorithm. Based on the above results, an effective joint operation strategy for oil transfer arms and valves was formulated.
From a practical viewpoint, the designed model is based on the pipelines of an actual port. Liquid terminal workers will profit from the results in their operational work, while it also aids the port in controlling costs.
Experiments verified the effectiveness of the model and algorithm. Through decoding, the specific operations of the oil transfer arms and valves during vessel unloading, as well as the pipeline distance through which the cargo flows, were elucidated. The results of the analysis demonstrated that the resources scheduling had significant impacts on the research objectives, particularly for large-scale terminal resource scheduling. The experimental results also confirmed that the INIIDA algorithm was capable of solving the PAVP effectively.
In this article, the scheduling problem of resources inside the liquid terminal, such as pipeline valve and oil transfer arm, was mainly considered. In actual scheduling of the wharf, there are also pipeline connections to long-distance transport pipelines, through which goods are unloaded onto the oil tanker or train. Future research could include the integration of train, oil tanker, long-distance transport pipelines, transshipment vessels, and pressurization pumps to make the problem closer to reality.
In addition, future work will focus on increasing research into vessel incoming scheduling, forming cooperative scheduling with oil transfer arms, pipelines, valves, and oil storage tanks. The unloading operation plan of oil storage tanks will also be incorporated to establish comprehensive cooperative scheduling research for liquid terminals.

Author Contributions

Conceptualization, L.K., H.X. and M.L.; Data curation, L.K.; Funding acquisition, H.X. and M.L.; Investigation, L.K., C.W. and X.Y.; Methodology, L.K. and M.L.; Project administration, H.X. and M.L.; Software, L.K. and C.W.; Supervision, L.K., H.X. and M.L.; Validation, L.K., H.X., C.W., X.Y. and M.L.; Visualization, L.K., C.W. and X.Y.; Writing—original draft, L.K., C.W. and X.Y.; Writing—review & editing, L.K., H.X., C.W., X.Y. and M.L. All authors have read and agreed to the published version of the manuscript.

Funding

This research was supported by the National Key Research and Development Program of China (Grant No. 2020YFB1710803).

Institutional Review Board Statement

Not applicable.

Informed Consent Statement

Not applicable.

Data Availability Statement

Data is contained within the article.

Conflicts of Interest

The authors declare no conflicts of interest.

References

  1. Russo, F.; Musolino, G. Industrial and oil ports: Case studies and theoretical approaches. Transp. Res. Pro. 2023, 69, 703–710. [Google Scholar] [CrossRef]
  2. Suffia, I.; Locatelli, A.M.; Romano, M. Oil transportation: Eni’s fleet, Italian ports and pipelines, 1950–1980. Int. J. Marit. Hist. 2021, 32, 900–927. [Google Scholar] [CrossRef]
  3. Elena, K. Analysis of the interconnected development potential of the oil, gas and transport industries in the Russian Arctic. Energies 2023, 16, 3124. [Google Scholar] [CrossRef]
  4. Foroni, C.; Stracca, L. The shale oil revolution and the global oil supply curve. J. Appl. Econ. 2023, 38, 370–387. [Google Scholar] [CrossRef]
  5. Peng, P.; Claramunt, C.; Cheng, S.F.; Lu, F. How Does a Port Build Influence? Diffusion Patterns in Global Oil Transportation. Sensors 2022, 22, 8595. [Google Scholar] [CrossRef]
  6. Zhou, Y.M.; Wang, Y.; Yang, L.K.; Kong, Q.; Zhang, H.X. Microbial degradation mechanisms of surface petroleum contaminated seawater in a typical oil trading port. Environ. Pollut. 2023, 324, 121420. [Google Scholar] [CrossRef] [PubMed]
  7. Wang, Q.Y.; Song, Y.H.; Zhang, X.S.; Dong, L.J.; Xi, Y.C.; Zeng, D.Z.; Liu, Q.L.; Zhang, H.L.; Zhang, Z.; Yan, R.; et al. Evolution of corrosion prediction models for oil and gas pipelines: From empirical-driven to data-driven. Eng. Fail. Anal. 2023, 146, 107097. [Google Scholar] [CrossRef]
  8. Chen, P.C.; Li, R.; Jia, G.M.; Lan, H.; Fu, K.; Liu, X.B. A Decade review of the art of inspection and monitoring technologies for long-distance oil and gas pipelines in permafrost areas. Energies 2023, 16, 1751. [Google Scholar] [CrossRef]
  9. Mgbemena, C.E.; Onuoha, D.O.; Godwin, H.C. Development of a novel virtual reality-enabled remote monitoring device for maintenance of cathodic protection systems on oil and gas pipelines. Sci. Rep. 2023, 13, 15874. [Google Scholar] [CrossRef] [PubMed]
  10. Zhao, J.H.; Liao, K.X.; Li, X.X.; He, G.X.; Xia, F.; Zeng, Q. Collaborative detection and on-line monitoring of pipeline stress in oil and gas stations. Meas. Sci. Technol. 2022, 33, 105001. [Google Scholar] [CrossRef]
  11. Yan, Y.; Xiong, G.L.; Zhou, J.J.; Wang, R.H.; Huang, W.Y.; Yang, M.; Wang, R.C.; Geng, D.X. A whole process risk management system for the monitoring and early warning of slope hazards affecting gas and oil pipelines. Front. Earth Sci. 2022, 9, 812527. [Google Scholar] [CrossRef]
  12. Xu, C.X.; Wu, J.; Feng, H.L.; Ibrom, A.; Zeng, Q.; Zhang, J.F.; Li, N.; Hu, Q. Operation of off-grid power supply system using IoT monitoring platform for oil and gas pipeline based on RESOC. CSEE J. Power Energy Syst. 2020, 6, 12–21. [Google Scholar]
  13. Salman, A.; Ashraf, A.; Qaisar, S.B.; Afridi, M.K.; Saeed, H.; Rashid, S.; Felemban, E.A.; Sheikh, A.A. SimpliMote: A wireless sensor network monitoring platform for oil and gas pipelines. IEEE Syst. J. 2018, 12, 778–789. [Google Scholar]
  14. Chen, X.L.; Wang, M.Q.; Wang, B.; Hao, H.D.; Shi, H.L.; Wu, Z.N.; Chen, J.X.; Gai, L.M.; Tao, H.C.; Zhu, B.K.; et al. Energy consumption reduction and sustainable development for oil & gas transport and storage engineering. Energies 2023, 16, 1775. [Google Scholar] [CrossRef]
  15. Zhang, H.R.; Liang, Y.T.; Liao, Q.; Gao, J.; Yan, X.H.; Zhang, W. Mixed-time mixed-integer linear programming for optimal detailed scheduling of a crude oil port depot. Chem. Eng. Res. Des. 2018, 137, 434–451. [Google Scholar] [CrossRef]
  16. Zhao, Y.M.; Wu, N.Q.; Li, Z.W.; Qu, T. A novel solution approach to a priority-slot-based continuous-time mixed integer nonlinear programming formulation for a crude-oil scheduling problem. Ind. Eng. Chem. Res. 2016, 55, 10955–10967. [Google Scholar] [CrossRef]
  17. Zhou, X.Y.; Zhang, H.R.; Qiu, R.; Liang, Y.T.; Wu, G.M.; Xiang, C.C.; Yan, X.H. A hybrid time MILP model for the pump scheduling of multi-product pipelines based on the rigorous description of the pipeline hydraulic loss changes. Comput. Chem. Eng. 2019, 121, 174–199. [Google Scholar] [CrossRef]
  18. Cano-Acosta, A.; Fontecha, J.; Velasco, N.; Muñoz-Giraldo, F. Shortest path algorithm for optimal sectioning of hydrocarbon transport pipeline. IFAC 2016, 49, 532–537. [Google Scholar] [CrossRef]
  19. Yang, Z.M.; Su, H.; Du, X.K.; Zio, E.; Xiang, Q.; Peng, S.L.; Fan, L.; Faber, M.H.; Zhang, J.J. Supply resilience assessment of natural gas pipeline network systems. J. Clean. Prod. 2023, 385, 135654. [Google Scholar] [CrossRef]
  20. Dbouk, H.M.; Hayek, H.; Ghorayeb, K. Modular approach for optimal pipeline layout. J. Pet. Sci. Eng. 2020, 197, 107934. [Google Scholar] [CrossRef]
  21. Kang, J.Y.; Lee, B.S. Optimisation of pipeline route in the presence of obstacles based on a least cost path algorithm and laplacian smoothing. Int. J. Nav. Archit. Ocean Eng. 2017, 9, 492–498. [Google Scholar] [CrossRef]
  22. Nasiri, M.M.; Khaleghi, A.; Govindan, K.; Bozorgi-Amiri, A. Sustainable hierarchical multi-modal hub network design problem: Bi-objective formulations and solution algorithms. Oper. Res. 2023, 23, 35. [Google Scholar] [CrossRef]
  23. Wang, Y.C.; Shi, G.Y.; Hirayama, K. Many-objective container stowage optimization based on improved NSGA-III. J. Mar. Sci. Eng. 2022, 10, 517. [Google Scholar] [CrossRef]
  24. Li, J.J.; Zhang, X.Y.; Yang, B.D.; Wang, N.N. Vessel traffic scheduling optimization for restricted channel in ports. Comput. Ind. Eng. 2021, 152, 107014. [Google Scholar] [CrossRef]
  25. Zhong, H.L.; Zhang, Y.G.; Gu, Y.M. A bi-objective green tugboat scheduling problem with the tidal port time windows. Transp. Res. D Transp Environ. 2022, 110, 103409. [Google Scholar] [CrossRef]
  26. Shi, J.T.; Li, H.D. Operational planning of international freight trains considering the dynamic demands and capacities of border ports. Comput. Ind. Eng. 2023, 185, 109658. [Google Scholar] [CrossRef]
  27. Duan, Y.; Ren, H.; Xu, F.; Yang, X.; Meng, Y. Bi-Objective Integrated Scheduling of Quay Cranes and Automated Guided Vehicles. J. Mar. Sci. Eng. 2023, 11, 1492. [Google Scholar] [CrossRef]
  28. Jiang, X.; Zhong, M.; Shi, J.; Li, W.; Sui, Y.; Dou, Y. Overall Scheduling Model for Vessels Scheduling and Berth Allocation for Ports with Restricted Channels That Considers Carbon Emissions. J. Mar. Sci. Eng. 2022, 10, 1757. [Google Scholar] [CrossRef]
  29. Ji, B.; Yuan, X.H.; Yuan, Y.B. Modified NSGA-II for solving continuous berth allocation problem: Using multiobjective constraint-handling strategy. J. IEEE Trans. Cybern. 2017, 47, 2885–2895. [Google Scholar] [CrossRef] [PubMed]
  30. Silveira, P.; Teixeira, Â.P.; Soares, C.G. AIS based shipping routes using the Dijkstra algorithm. TransNav Int. J. Mar. Nav. Saf. Sea Transp. 2019, 13, 565–571. [Google Scholar] [CrossRef]
  31. Baeza, D.; Ihle, C.F.; Ortiz, J.M. A comparison between ACO and Dijkstra algorithms for optimal ore concentrate pipeline routing. J. Clean. Prod. 2017, 144, 149–160. [Google Scholar] [CrossRef]
Figure 1. Layout for the PAVP.
Applsci 14 06195 g001
Figure 2. Schematic diagram of valves and pipelines.
Applsci 14 06195 g002
Figure 3. Flow of NSGA-II-Dijkstra.
Applsci 14 06195 g003
Figure 4. Chromosome encoding.
Applsci 14 06195 g004
Figure 5. Crossover and mutation operations.
Applsci 14 06195 g005
Figure 6. Schematic diagram of berths and tanks.
Applsci 14 06195 g006
Figure 7. Results of small-scale berths.
Applsci 14 06195 g007
Figure 8. Results of small-scale berths with 10 vessels.
Applsci 14 06195 g008
Figure 9. Optimal solution Gantt chart of small-scale berths.
Applsci 14 06195 g009
Figure 10. Results of mixed berths.
Applsci 14 06195 g010
Figure 11. Optimal solution Gantt chart of mixed berths.
Applsci 14 06195 g011
Table 1. Global oil demand for combustible fossil fuels from 2020 to 2028.
Region202020212022202320242025202620272028
North America22.123.924.624.724.524.324.023.823.5
S&C America5.86.46.66.76.86.97.07.17.2
Europe13.714.514.914.914.814.714.614.514.3
Africa3.84.04.24.34.44.54.64.74.8
Middle East8.18.59.09.29.39.49.69.79.8
Eurasia4.24.54.64.64.64.64.74.74.7
Asia Pacific34.035.735.837.838.839.740.340.941.3
World91.797.599.8102.3103.1104.1104.8105.3105.7
Table 2. Symbol descriptions of set.
SymbolDescriptions
ASet of vessels, A = {1, 2, 3, …, a},
BSet of berths, B = {1, 2, 3, …, b},
CbSet of oil transfer arms of berth b, Cb = {1, 2, 3, …, c},
DSet of pipelines, D = {1, 2, 3, …, d},
ESet of tanks, E = {1, 2, 3, …, e},
FSet of valves,
GSet of cargoes, G = {1, 2, 3, …, g}.
Table 3. Symbol descriptions of parameters.
SymbolDescriptions
ATAaActual time of arrival of vessel a
CTotal cost of vessels of a plan, unit: USD
C1Cost of oil transfer arms, unit: USD
C2Cost of pipelines, unit: USD
C3Cost of valves, unit: USD
CfjCost of operations of valve j, unit: USD/unit
ClFixed cost of pipelines occupation, unit: USD/m
CsFixed cost of oil transfer arms handling, unit: USD/unit
CtFixed cost of oil transfer arms occupation, unit: USD/h/unit
DsPipeline section, unit: m2
ECfjEnergy consumption of valve j
ETDaEstimated time of departure of vessel a
gaType of liquid cargo of vessel a
geType of liquid cargo of tank e
gdType of liquid cargo of pipeline d
LaTotal length of operation pipeline of vessel a, unit: m
lijPipeline length from valve i to valve j, unit: m
NcaQuantity of oil transfer arm occupation
NcbQuantity of oil transfer arm in berth b
njFOperation times of valve j, jF
TTotal time of vessels of a plan, unit: h
TcPreparation and handling time of oil transfer arm, unit: h
TcaUnloading time of cargo of vessel a, unit: h
Te(in)The moment when the oil tank e starts to feed oil
Te(max)The moment when the oil tank e reaches its maximum storage capacity
Te(min)The moment when the oil tank e reaches its minimum storage capacity
Te(out)The moment when the oil tank e starts to drain oil
TpaPipeline oil circuit emptying time, unit: h
vMaximum passable flow velocity of pipeline, unit: m/s
VaStandard flow rate of oil transfer arm of vessel a, unit: m3/h
VcaUnloading actual flow rate of oil transfer arm of vessel a, unit: m3/h
WaLiquid cargo unloading volume of vessel a, unit: m3
WeuVacant space of tank e, unit: m3
Table 4. Symbol descriptions of 0–1 variables.
SymbolDescriptions
pjStatus of valve j
qdijStatus of pipeline from valve i to valve j
ω(alij)Pipeline path from valve i to valve j of vessel a
ω(lij)Connection status of pipeline from valve i to valve j
Table 5. The basic data.
ParametersDesign Value
Cl30 USD/m
Cs50 USD/unit/h
Ct1000 USD/unit
Cost of electric ball valves5 USD/once
Cost of electric gate valve3 USD/once
Cost of exhaust valves2 USD/once
Cost of manual ball valves10 USD/once
Cost of manual gate valves8 USD/once
Cost of multi-way valves12 USD/once
Cost of ordinary valves2 USD/once
Cost of safety valves2 USD/once
Rated power of pump, level 14000 m3/h
Rated power of pump, level 22250 m3/h
Rated power of pump, level 31560 m3/h
V4.5 m/s
Table 6. Result of computational time between two algorithms.
Quantity of VesselsIterationsTime of NSGA-II-DijkstraTime of INIIDASpeed Increase %
101001:02:1900:18:4369.97%
105002:01:3100:45:2362.65%
10100011:47:1503:09:5773.14%
271001:01:3600:22:3563.33%
275005:00:5801:32:1869.33%
27100010:05:4103:27:5765.67%
421001:48:1200:38:2564.49%
425008:09:5802:51:2665.01%
42100017:02:5805:41:0766.65%
Disclaimer/Publisher’s Note: The statements, opinions and data contained in all publications are solely those of the individual author(s) and contributor(s) and not of MDPI and/or the editor(s). MDPI and/or the editor(s) disclaim responsibility for any injury to people or property resulting from any ideas, methods, instructions or products referred to in the content.

