Article

Experimental Analysis and Design of 3D-Printed Polymer Elliptical Tubes in Compression

by
Finian McCann
1,*,
Federico Rossi
2 and
Shahzada Danyal Sultan
2
1
School of Architecture, Building and Civil Engineering, Loughborough University, Loughborough LE11 3TU, UK
2
School of the Built Environment and Architecture, London South Bank University, London SE1 0AA, UK
*
Author to whom correspondence should be addressed.
Appl. Sci. 2024, 14(17), 7673; https://doi.org/10.3390/app14177673
Submission received: 16 July 2024 / Revised: 19 August 2024 / Accepted: 28 August 2024 / Published: 30 August 2024
(This article belongs to the Section Additive Manufacturing Technologies)

Abstract

:

Featured Application

Slender elliptical section tubes, with potential uses in aeronautical, aerospace or other mechanical contexts, have been printed in PLA and ABS. A safe-sided design method is presented, which was originally formulated for steel tubes and is now adapted and re-calibrated for use with 3D-printed polymer materials based on material properties determined from tensile and compressive testing.

Abstract

Local failure modes occurring in 3D-printed polymer elliptical section tubes in compression are investigated in the present study via a series of experiments, with the results compared to existing design proposals for slender steel analogues. Polylactic acid (PLA) and acrylonitrile butadiene styrene material specimens (ABS) have been printed in three orthogonal layering orientations, and tested in tension and compression to determine orthotropic material properties including strength, elastic modulus, failure strains and Poisson’s ratio. Next, twenty-four 3D-printed elliptical cross-section tubes are tested in compression, with the polymer material, cross-sectional aspect ratio and tube wall thickness varied across the set. Results including the load-deflection behaviour, longitudinal strains, failure modes and ultimate loads are discussed. A design method formulated previously for slender steel elliptical hollow sections in compression is adapted for use with the 3D-printed polymer specimens. Upon appropriate rescaling of the design parameters, safe-sided and accurate predictions are provided by the design method for the compressive resistance of the PLA and ABS elliptical specimens, thus validating its application to cross-sections in materials other than carbon steel.

1. Introduction

When considering applications of fused filament fabrication (FFF) additive manufacturing (AM) across the manufacturing, automotive and aerospace industries, the two most common thermoplastics employed are polylactic acid (PLA) and acrylonitrile butadiene styrene (ABS) [1]. Both PLA and ABS are reasonably strong and light, with the tensile strength of PLA typically 25–60 N/mm2 [2,3,4,5,6] and that of ABS 30–40 N/mm2 [1,4,7]. Considering that the densities of these materials tend to be 1020–1400 kg/m3 [4,6,7], in terms of the strength-to-weight ratios shown in Table 1, PLA and ABS can typically outperform a variety of conventional materials; however, the lower stiffness and ductility of these polymer materials must be noted when considering deflection and deformation limits. Nevertheless, these mechanical properties indicate useful applications across the automotive, aeronautical and aerospace industries where weight optimization is important.
Given the flexibility of form achievable through AM techniques, the present study examines the behaviour of elliptical cross-section tubes, the geometries of which have been recognized for centuries to possess unique analytical properties [8]. Hollow elliptical tubes formed from various materials have precedents in a variety of industrial applications including heat transfer ducts [9,10], fluid conduits [11], fluid dynamics [12] and structural load-bearing members [13]. The cross-sectional geometries of such tubes are characterized by their maximum cross-sectional radius a, their minimum cross-sectional radius b and their tube wall thickness t, as shown in Figure 1. In addition to their aesthetic properties, elliptical sections have a mechanical advantage over their circular counterparts owing to having a stronger major axis of bending (axis y-y in Figure 1).
Initial studies [14,15] into the stability of thin-walled steel oval-shaped sections in compression provided an experimental basis for the resistance of such sections to local buckling. More recent analytical studies into the local buckling of steel [16,17,18], stainless steel [19] and aluminium [20] elliptical tubes have characterized elastic buckling modes and postbucking behaviour, with the dependence of postbuckling behaviour on the cross-sectional aspect ratio a/b attested to. Studies into fibre-reinforced polymer elliptical sections have been conducted [21], but seemingly exclusively as a confining layer to an inner concrete core. It has been shown through numerical parametric studies that, with increasing aspect ratio, the postbuckling behaviour of slender steel elliptical tubes in compression [22] and bending [23] transitions from unstable imperfection-sensitive behaviour like that observed in cylindrical shells to stable imperfection-insensitive behaviour like that observed in flat plates. While design formulae have been proposed on the basis of numerical modelling, experimental validation of these models could only be conducted in the low slenderness range owing to commercially available metallic elliptical tubes satisfying width-to-thickness limits imposed by design standards. Such restrictions on the maximum slenderness of experimental specimens are circumvented in the present study by using PLA and ABS, which exhibit considerably larger elastic ranges than carbon steel, stainless steel and aluminum.
Research into additively manufactured PLA and ABS is extensive across several fields, such that a full review of related literature is outside the scope of the present study. When discussing material properties, the macroscale performance of any 3D-printed part is not only a function of the feedstock material but also the layering orientation, infill pattern, deposition speed and overall component geometry. The asymmetry of the responses of 3D-printed PLA and ABS specimens in either tension or compression has been well-attested to previously [3,4,5,24,25], with compressive strengths up to 30% higher than those in tension observed in some cases, while elastic moduli in tension and compression have also been shown to differ significantly [24,25]. It has been shown [26] that quicker deposition rates can lead to higher tensile strengths since the decrease in cooling times between passes allows for more effective interlayer bonding to develop, although the same study also found that a combination of lower printing speed and higher application temperature can lead to a reduction in geometric deviations. Investigations into the influence of printing layering orientation on mechanical behaviour [27,28] suggest noticeable anisotropy in the behaviour of 3D-printed PLA depending on the direction of load transfer relative to the layering orientation.
As is also confirmed in Section 2, greater ductility tends to be observed in ABS specimens when compared to those printed using PLA. The greater deformation capacity of ABS has proved useful in exploring large-deformation elastic buckling phenomena such as the buckling of lattice domes [29] and the manifestation of snap-through buckling in arches [30]. Studies of the mechanical behaviour of 3D-printed ABS have determined mechanical properties in tension [1,4,24,25,31] and compression [24,25,31]. Finer deposition layer thicknesses have been shown to lead to greater overall strength [31], while the effect of print layer orientation on mechanical properties has also been attested to previously [32].
In summary, the aims of the present study are to (i) determine material properties appropriate for calculating design compressive resistances of 3D-printed elliptical tubes, and (ii) assess the suitability of existing guidance for designing elliptical 3D-printed tubes in compression. The feedstock materials employed in the present study are Ultimaker PLA [6] and MCPP ABSX [7]. Mesoscale material specimens of these polymers are printed in three orthogonal layering orientations and then tested in either tension or compression to determine orthotropic material properties including elastic modulus, strength, failure strains and Poisson’s ratio. Next, elliptical tubes printed from the feedstock polymers of various cross-sectional aspect ratios and tube wall thicknesses are loaded in compression, with the results for the load–deflection behaviour, ultimate loads and failure modes discussed. The compressive resistances of the elliptical tubes determined from testing are then compared to the predictions of a design method proposed for slender steel elliptical tubes in compression [22], which has been appropriately rescaled based on the mechanical properties determined from mesoscale material testing. It is envisaged that the successful use of these slender steel analogues in the design of 3D-printed polymer elliptical sections provides a basis to extend the use of such approaches to other thin-walled 3D-printed polymer profiles.

2. Material Testing

In this section, tensile and compressive testing of 3D-printed PLA and ABS material specimens in the Strength of Materials Laboratory at London South Bank University (LSBU) is described, including discussions of specimen geometry, fabrication methods, imperfections and the apparatus employed in the experiments, with testing conducted in controlled conditions of 19–20 °C at LSBU. Results for the material properties of the 3D-printed PLA and ABS specimens are discussed, including strengths, elastic moduli and Poisson’s ratios. All specimens have been printed using an Ultimaker 3+ Extended FFF printer in the Digital Architecture and Robotics Laboratory (DARLAB) at LSBU. It should be noted that although the full elliptical tubes described in Section 3 are tested in compression, tensile material properties have also been determined in the present study to allow a comparative analysis of material properties in tension and compression.

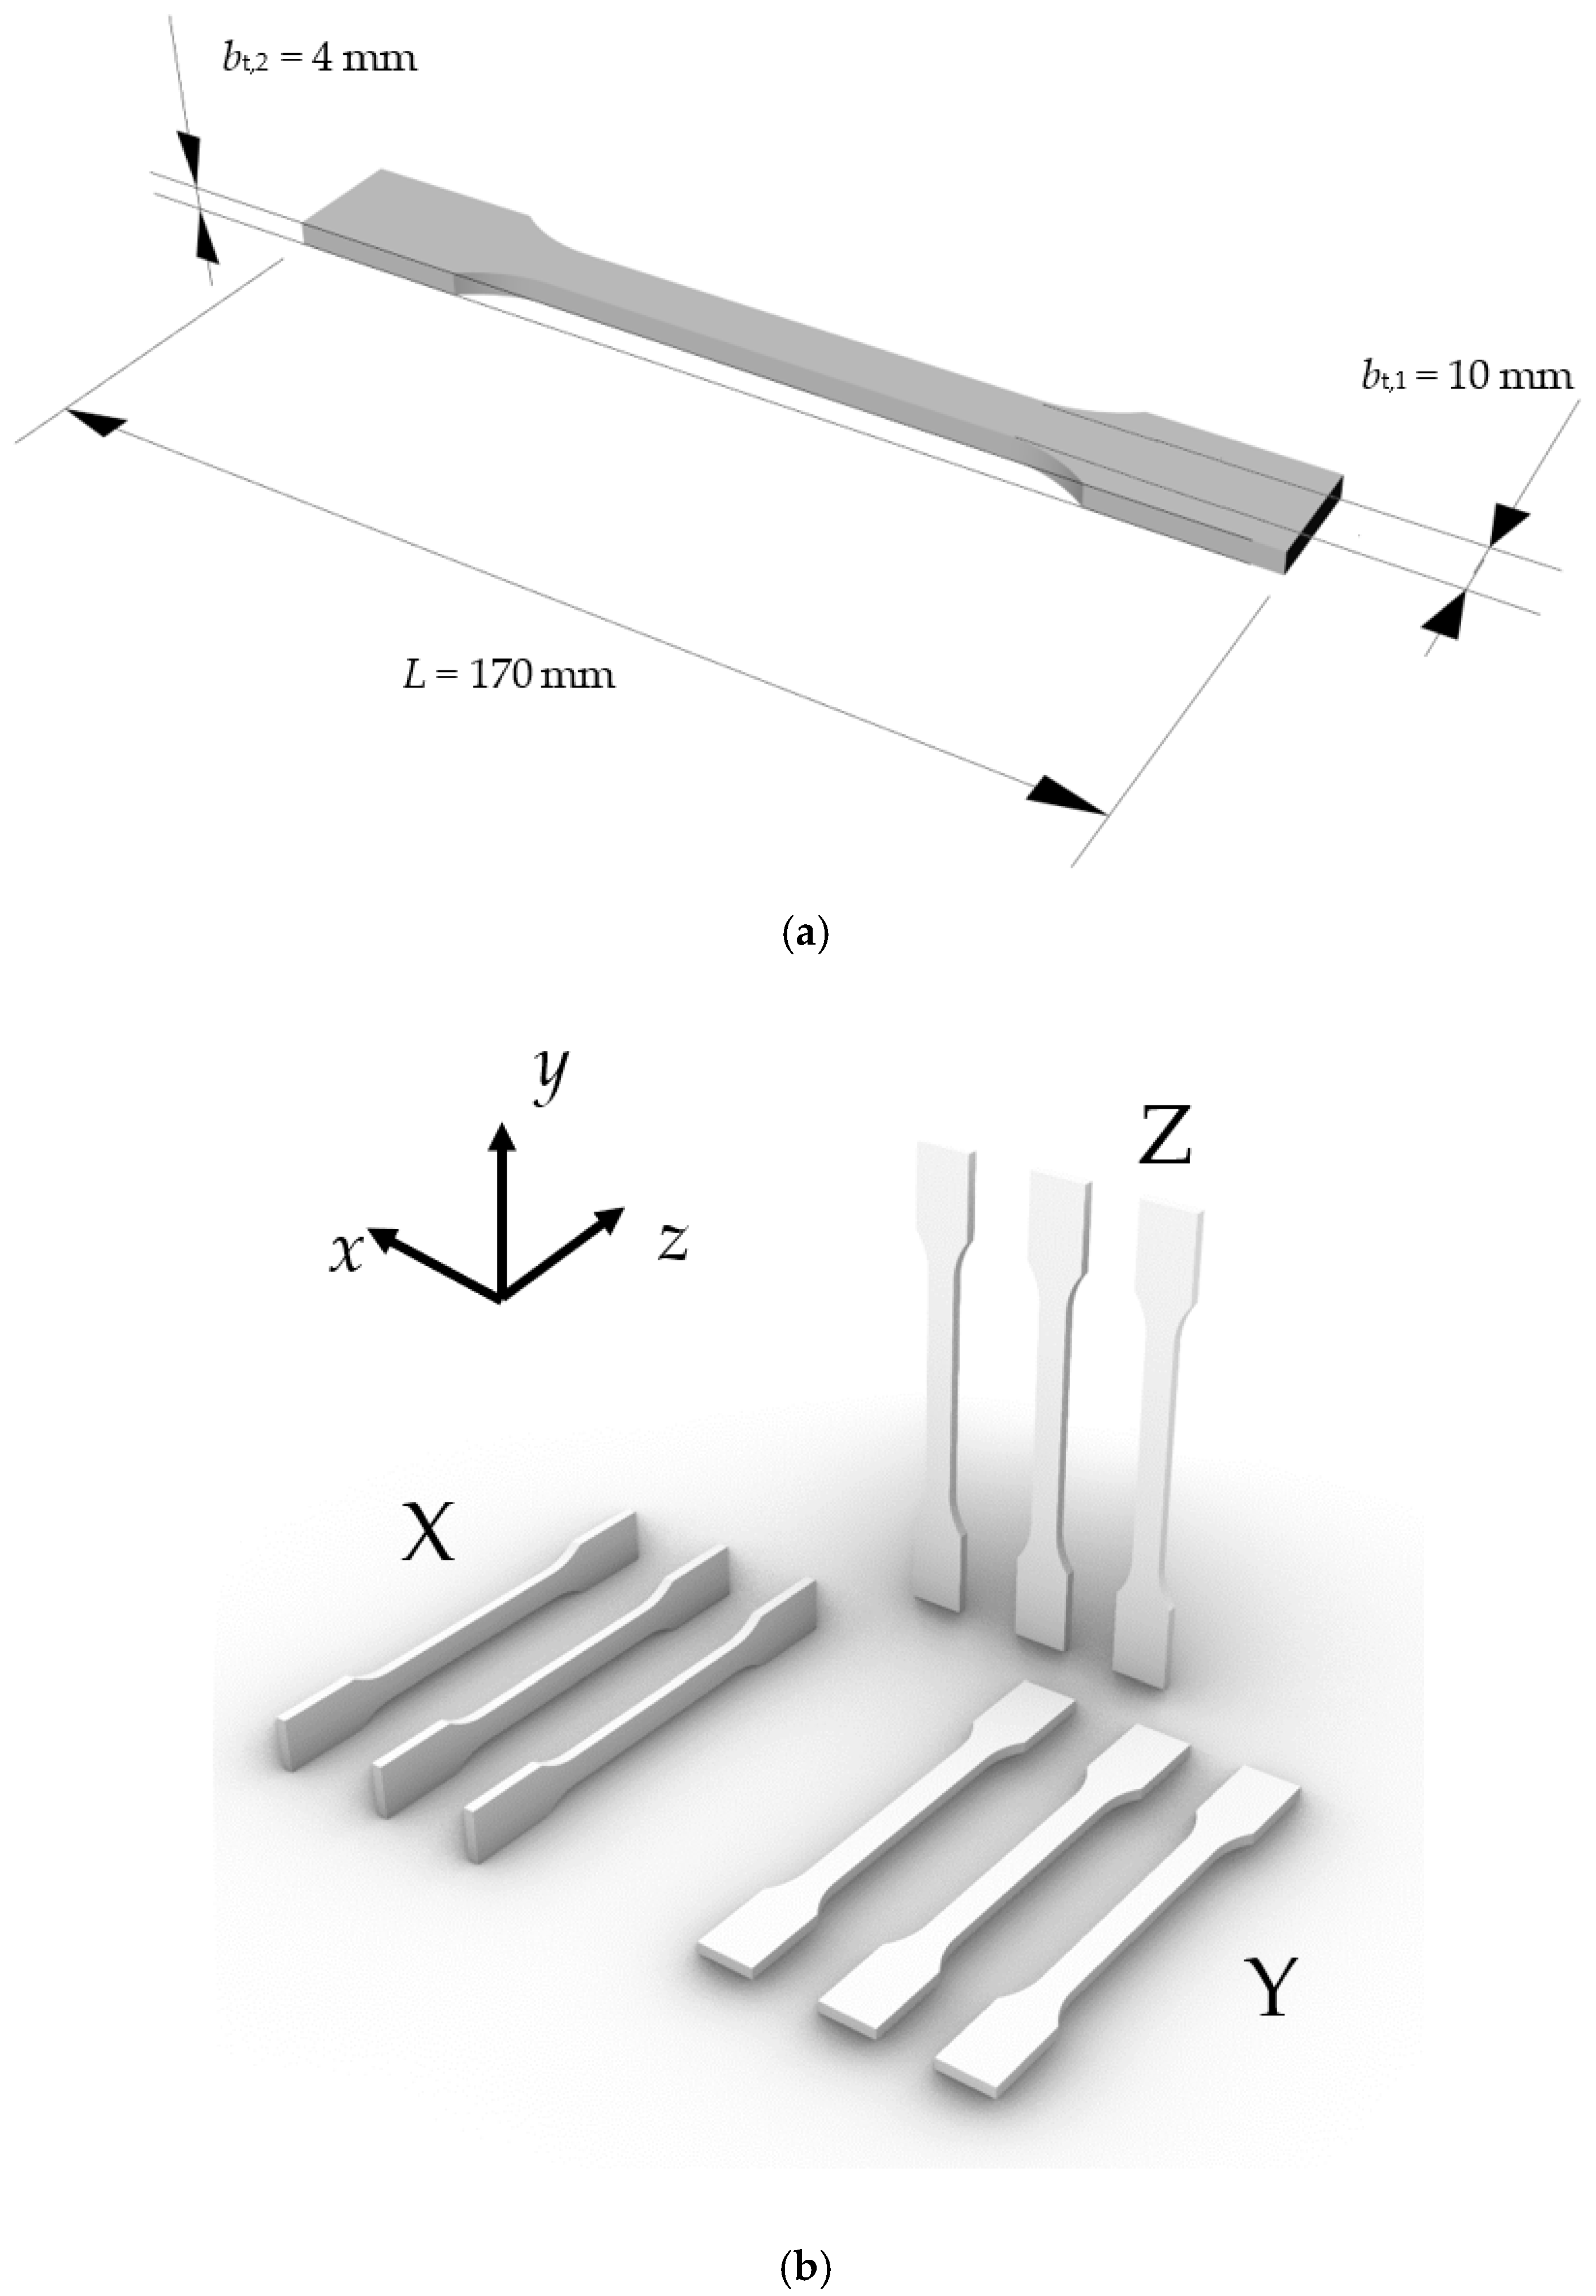
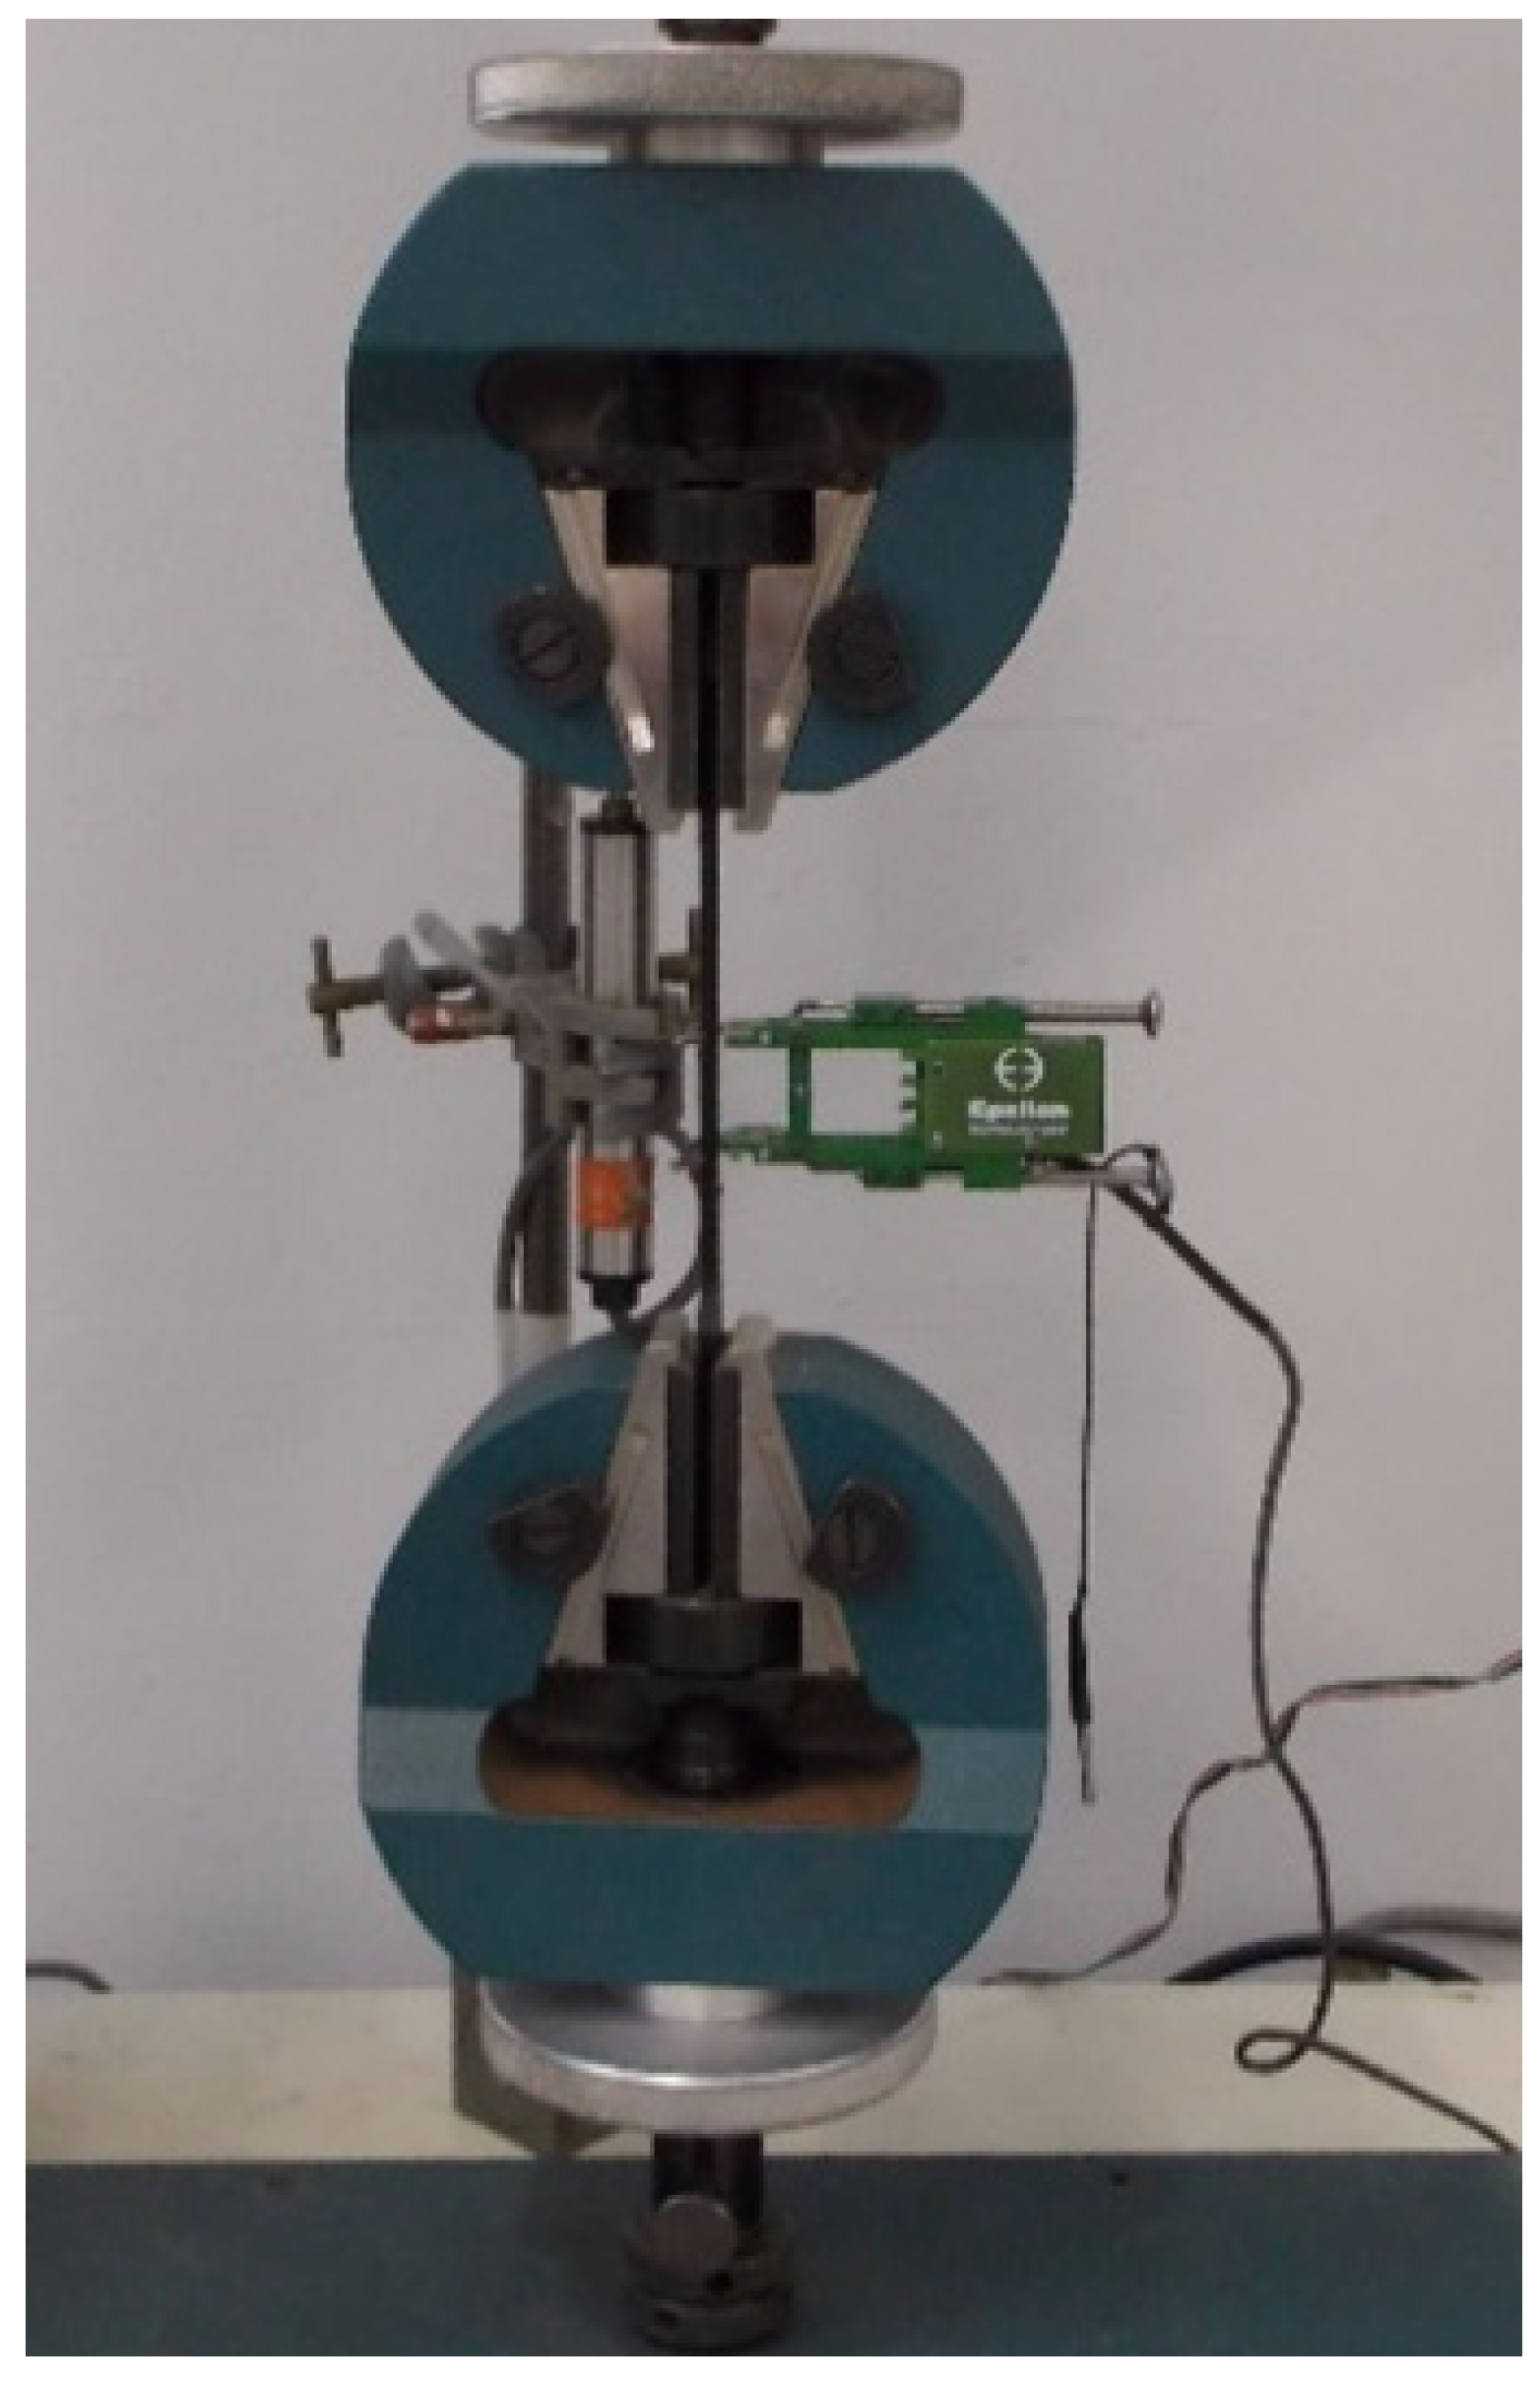
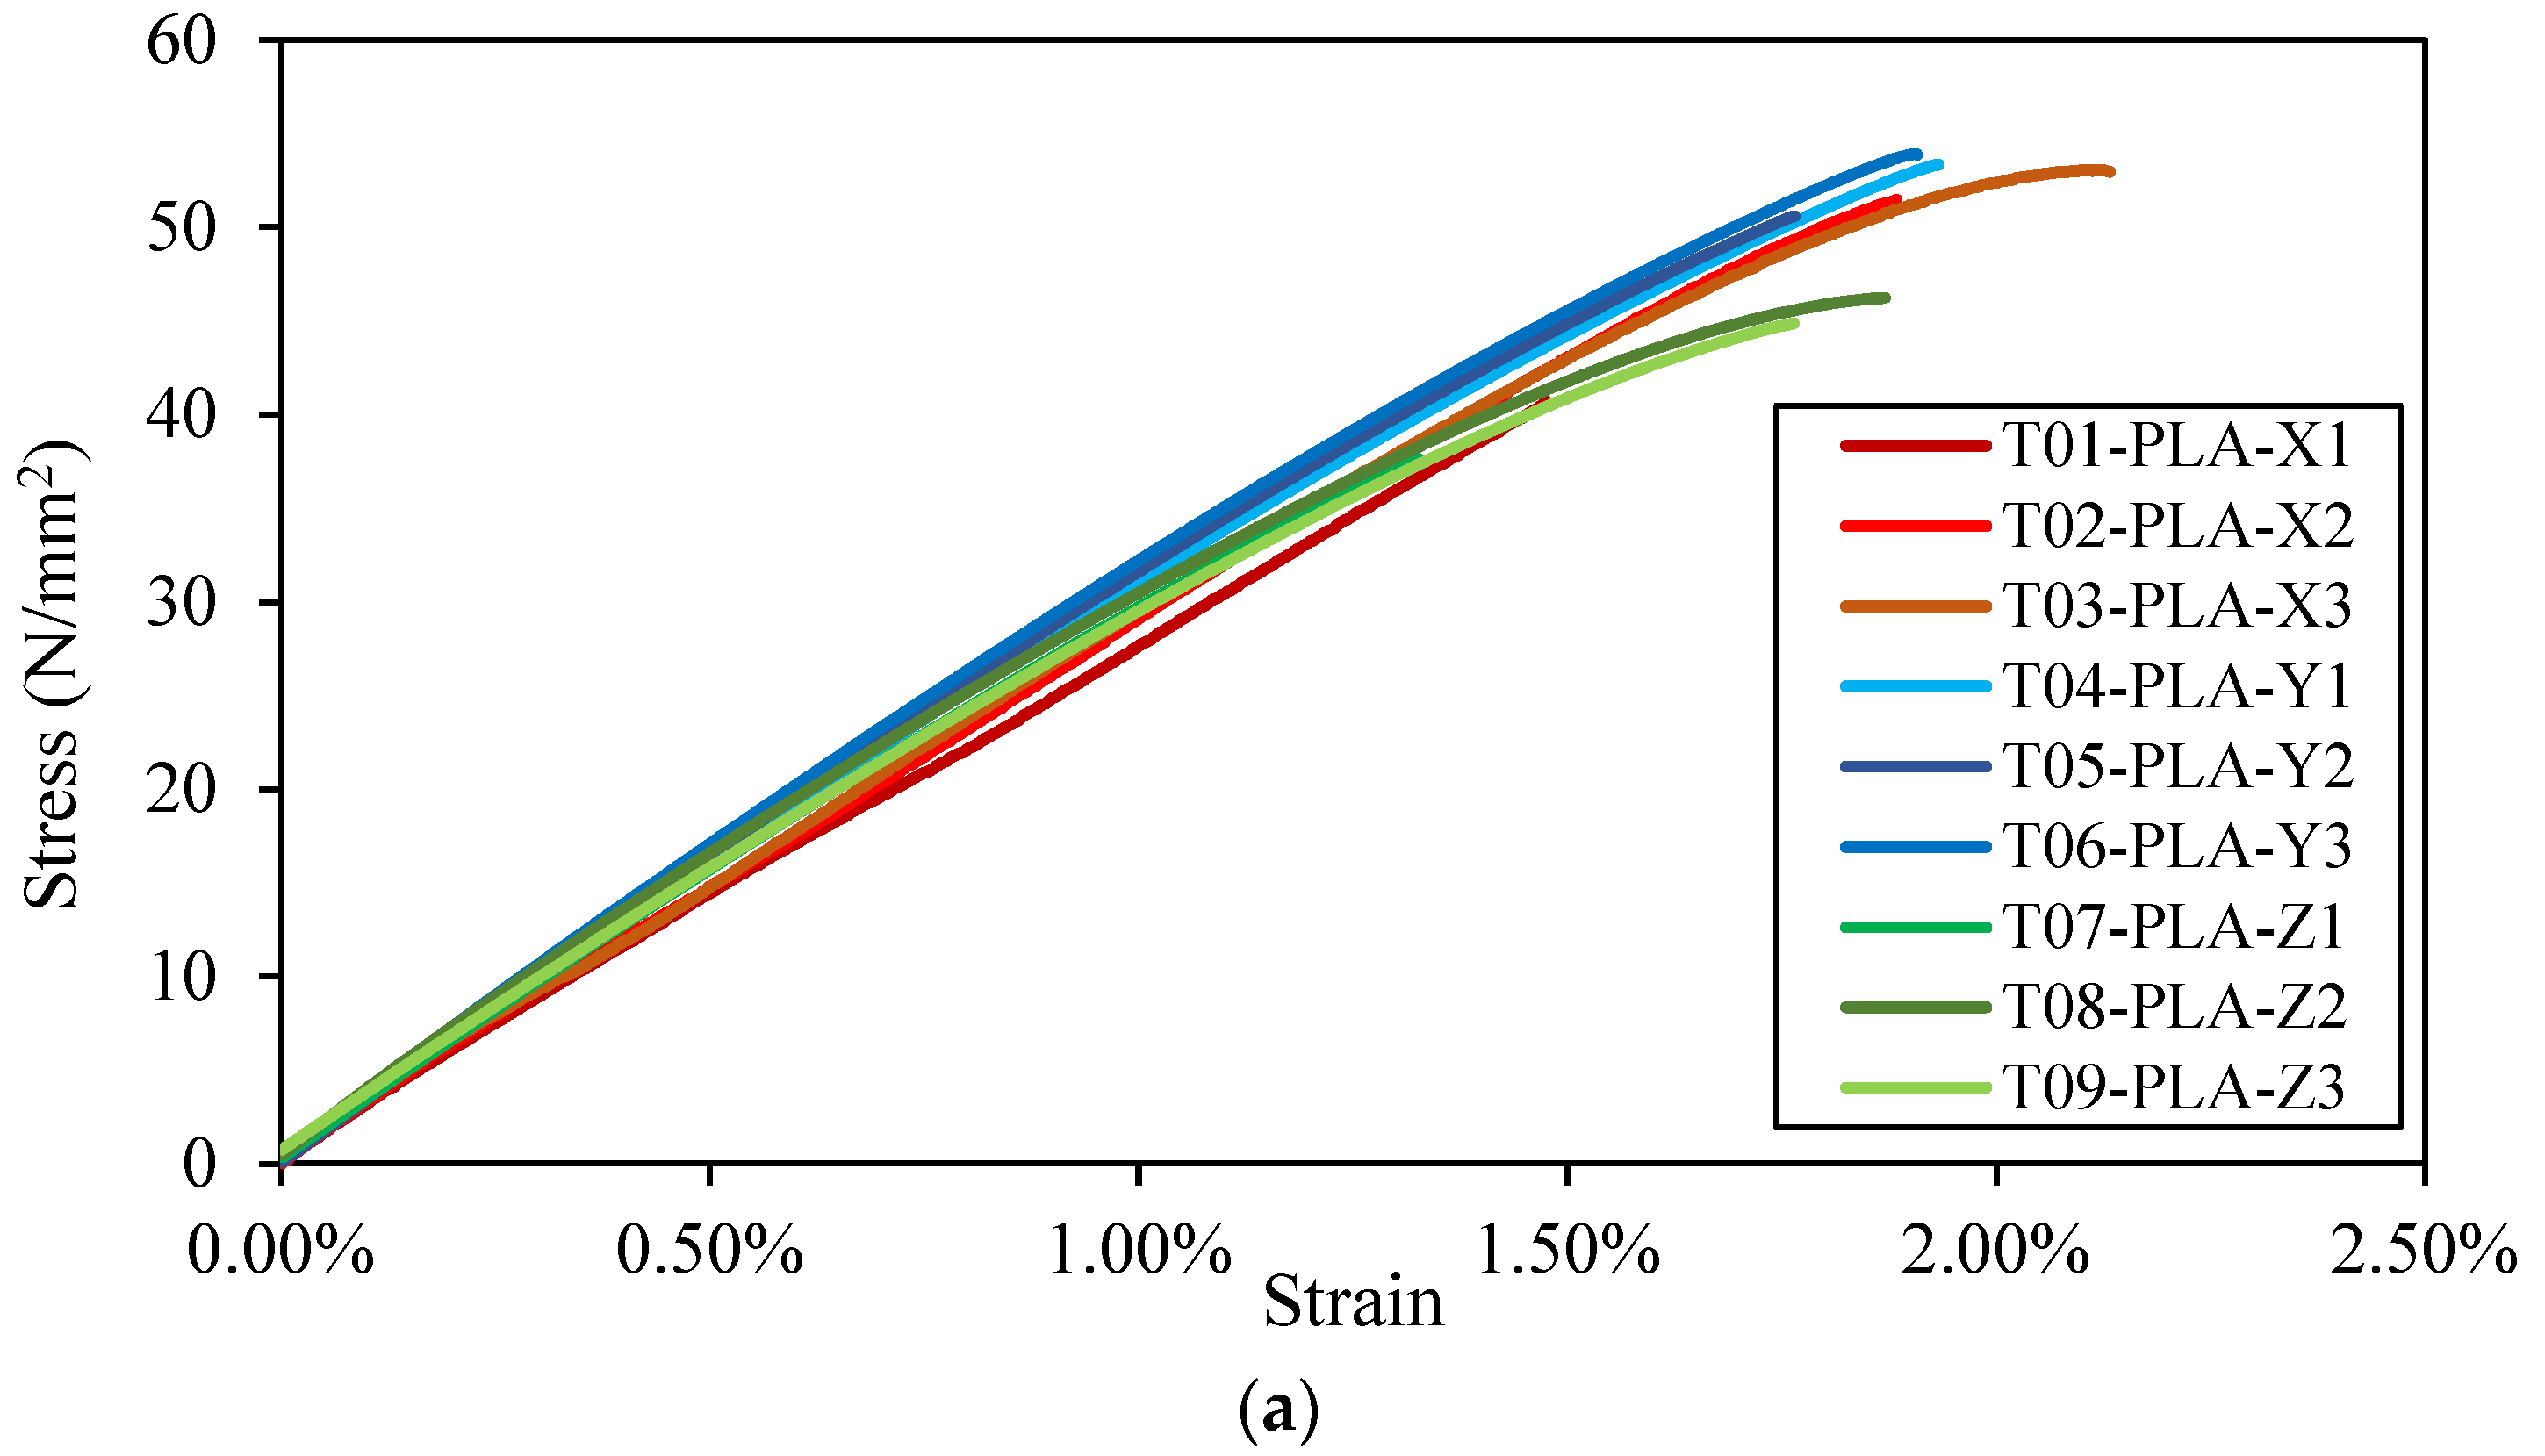
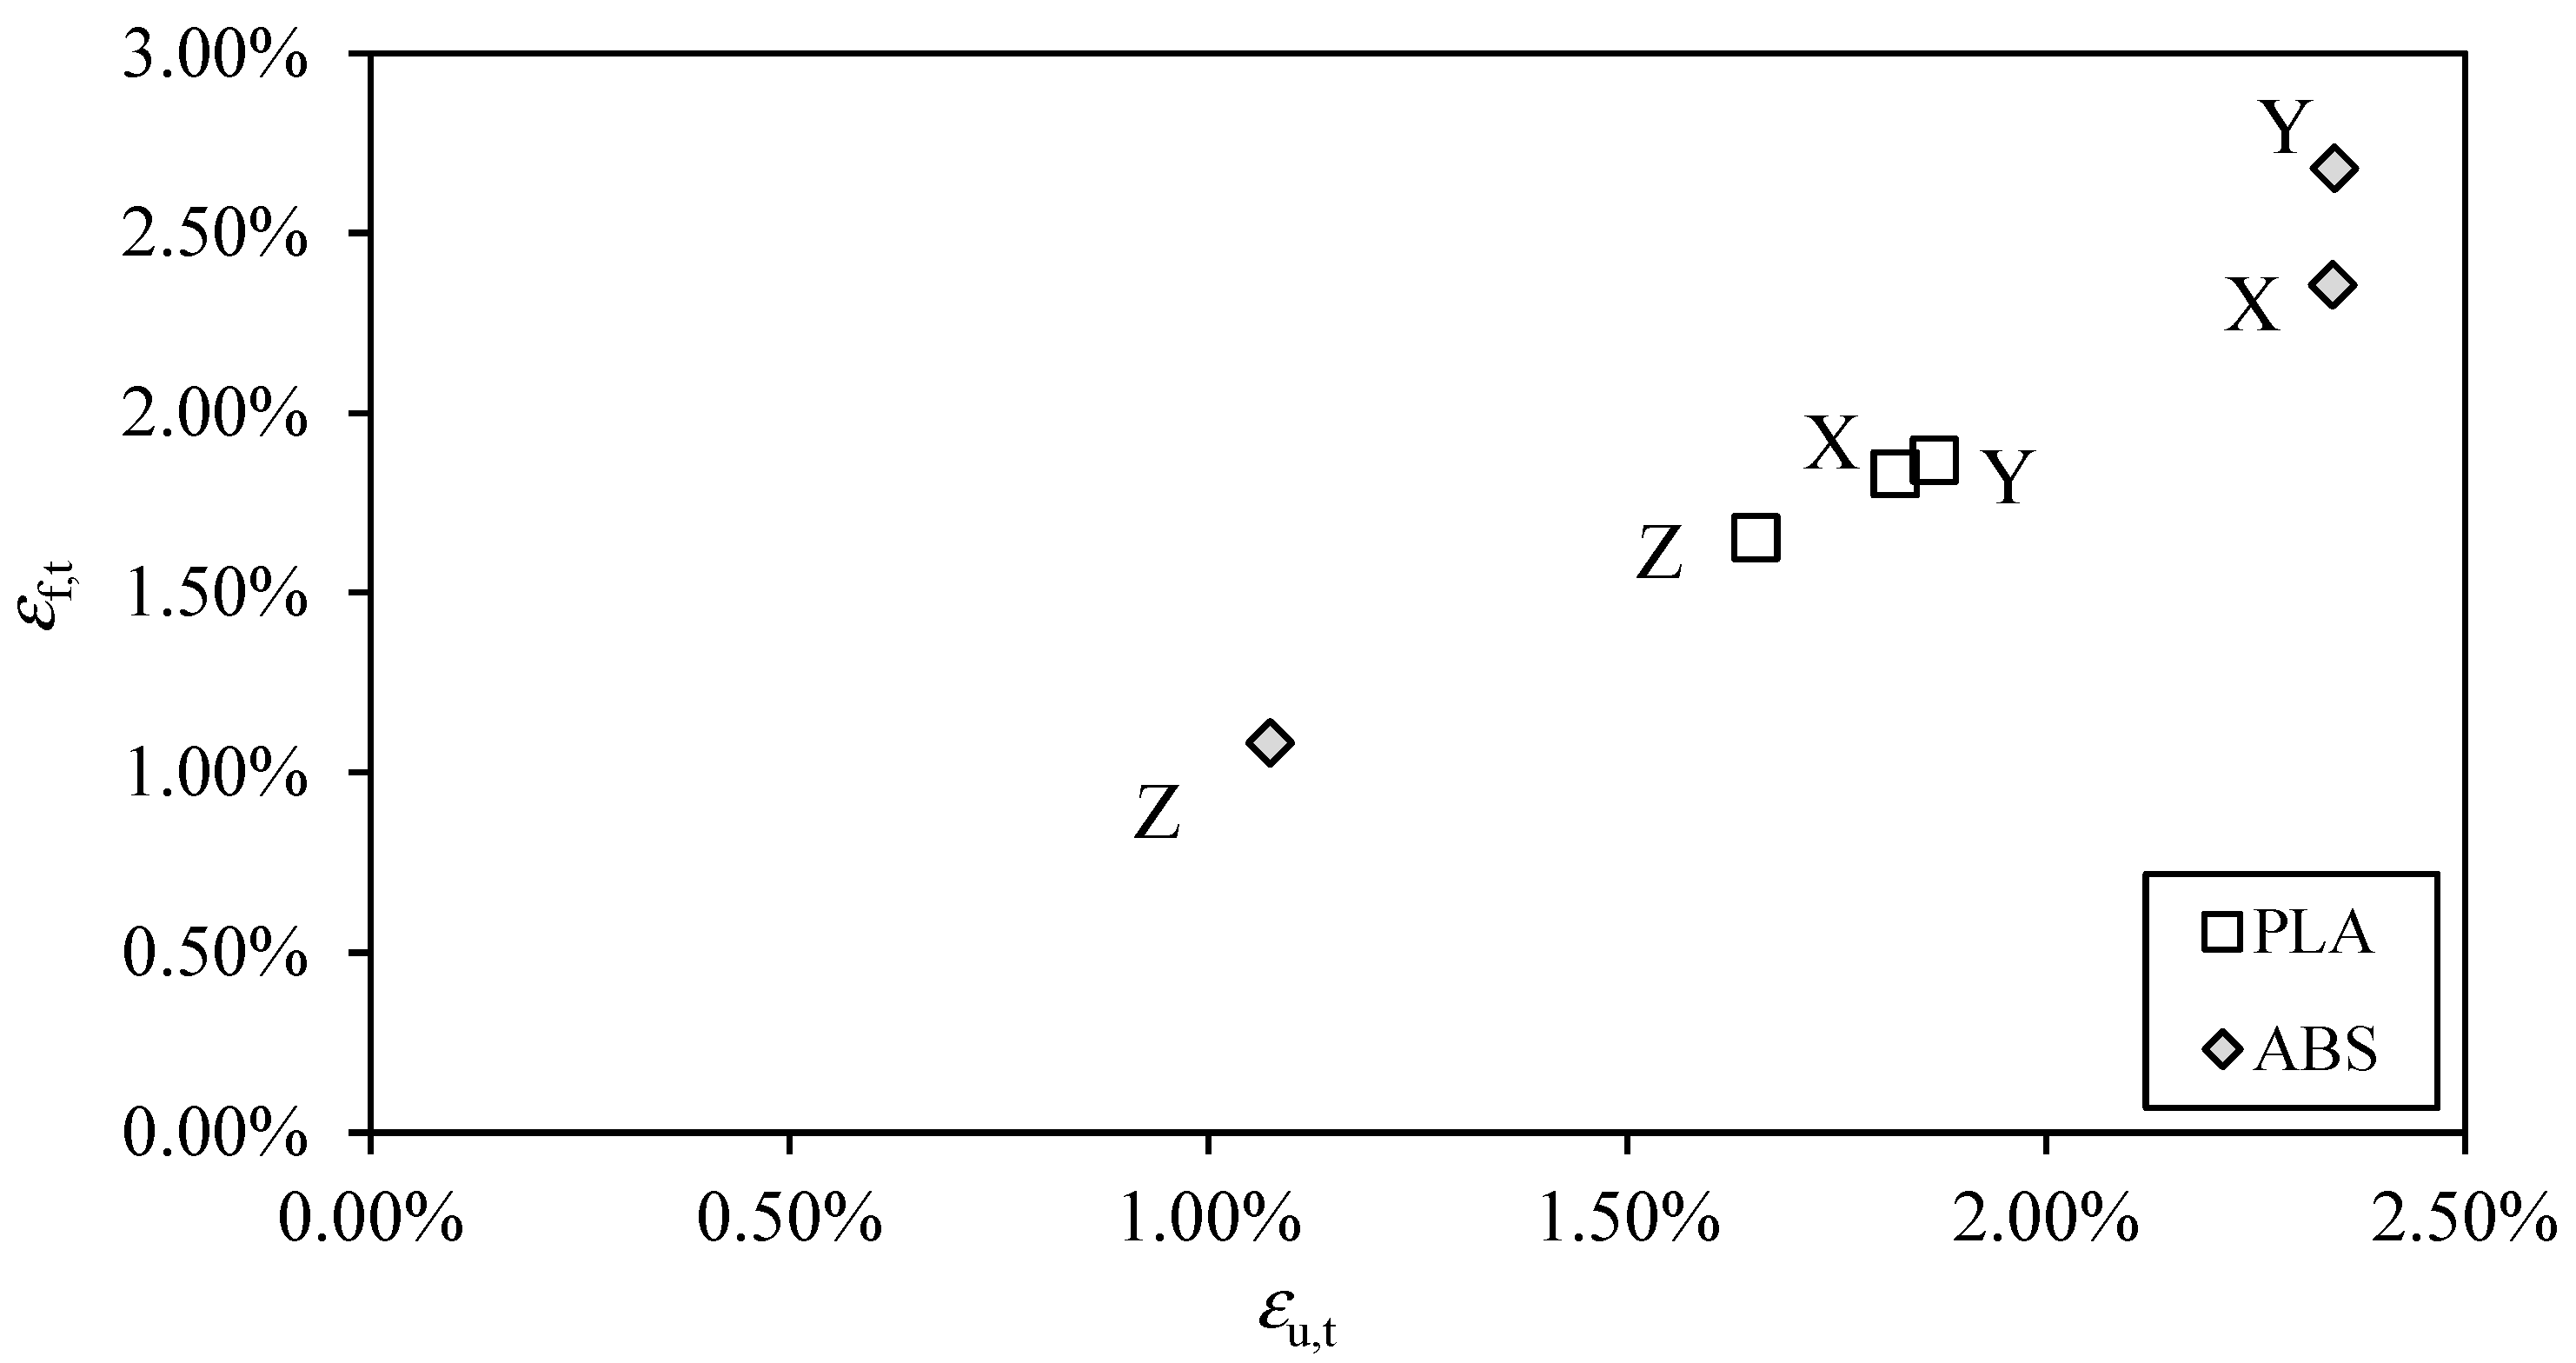
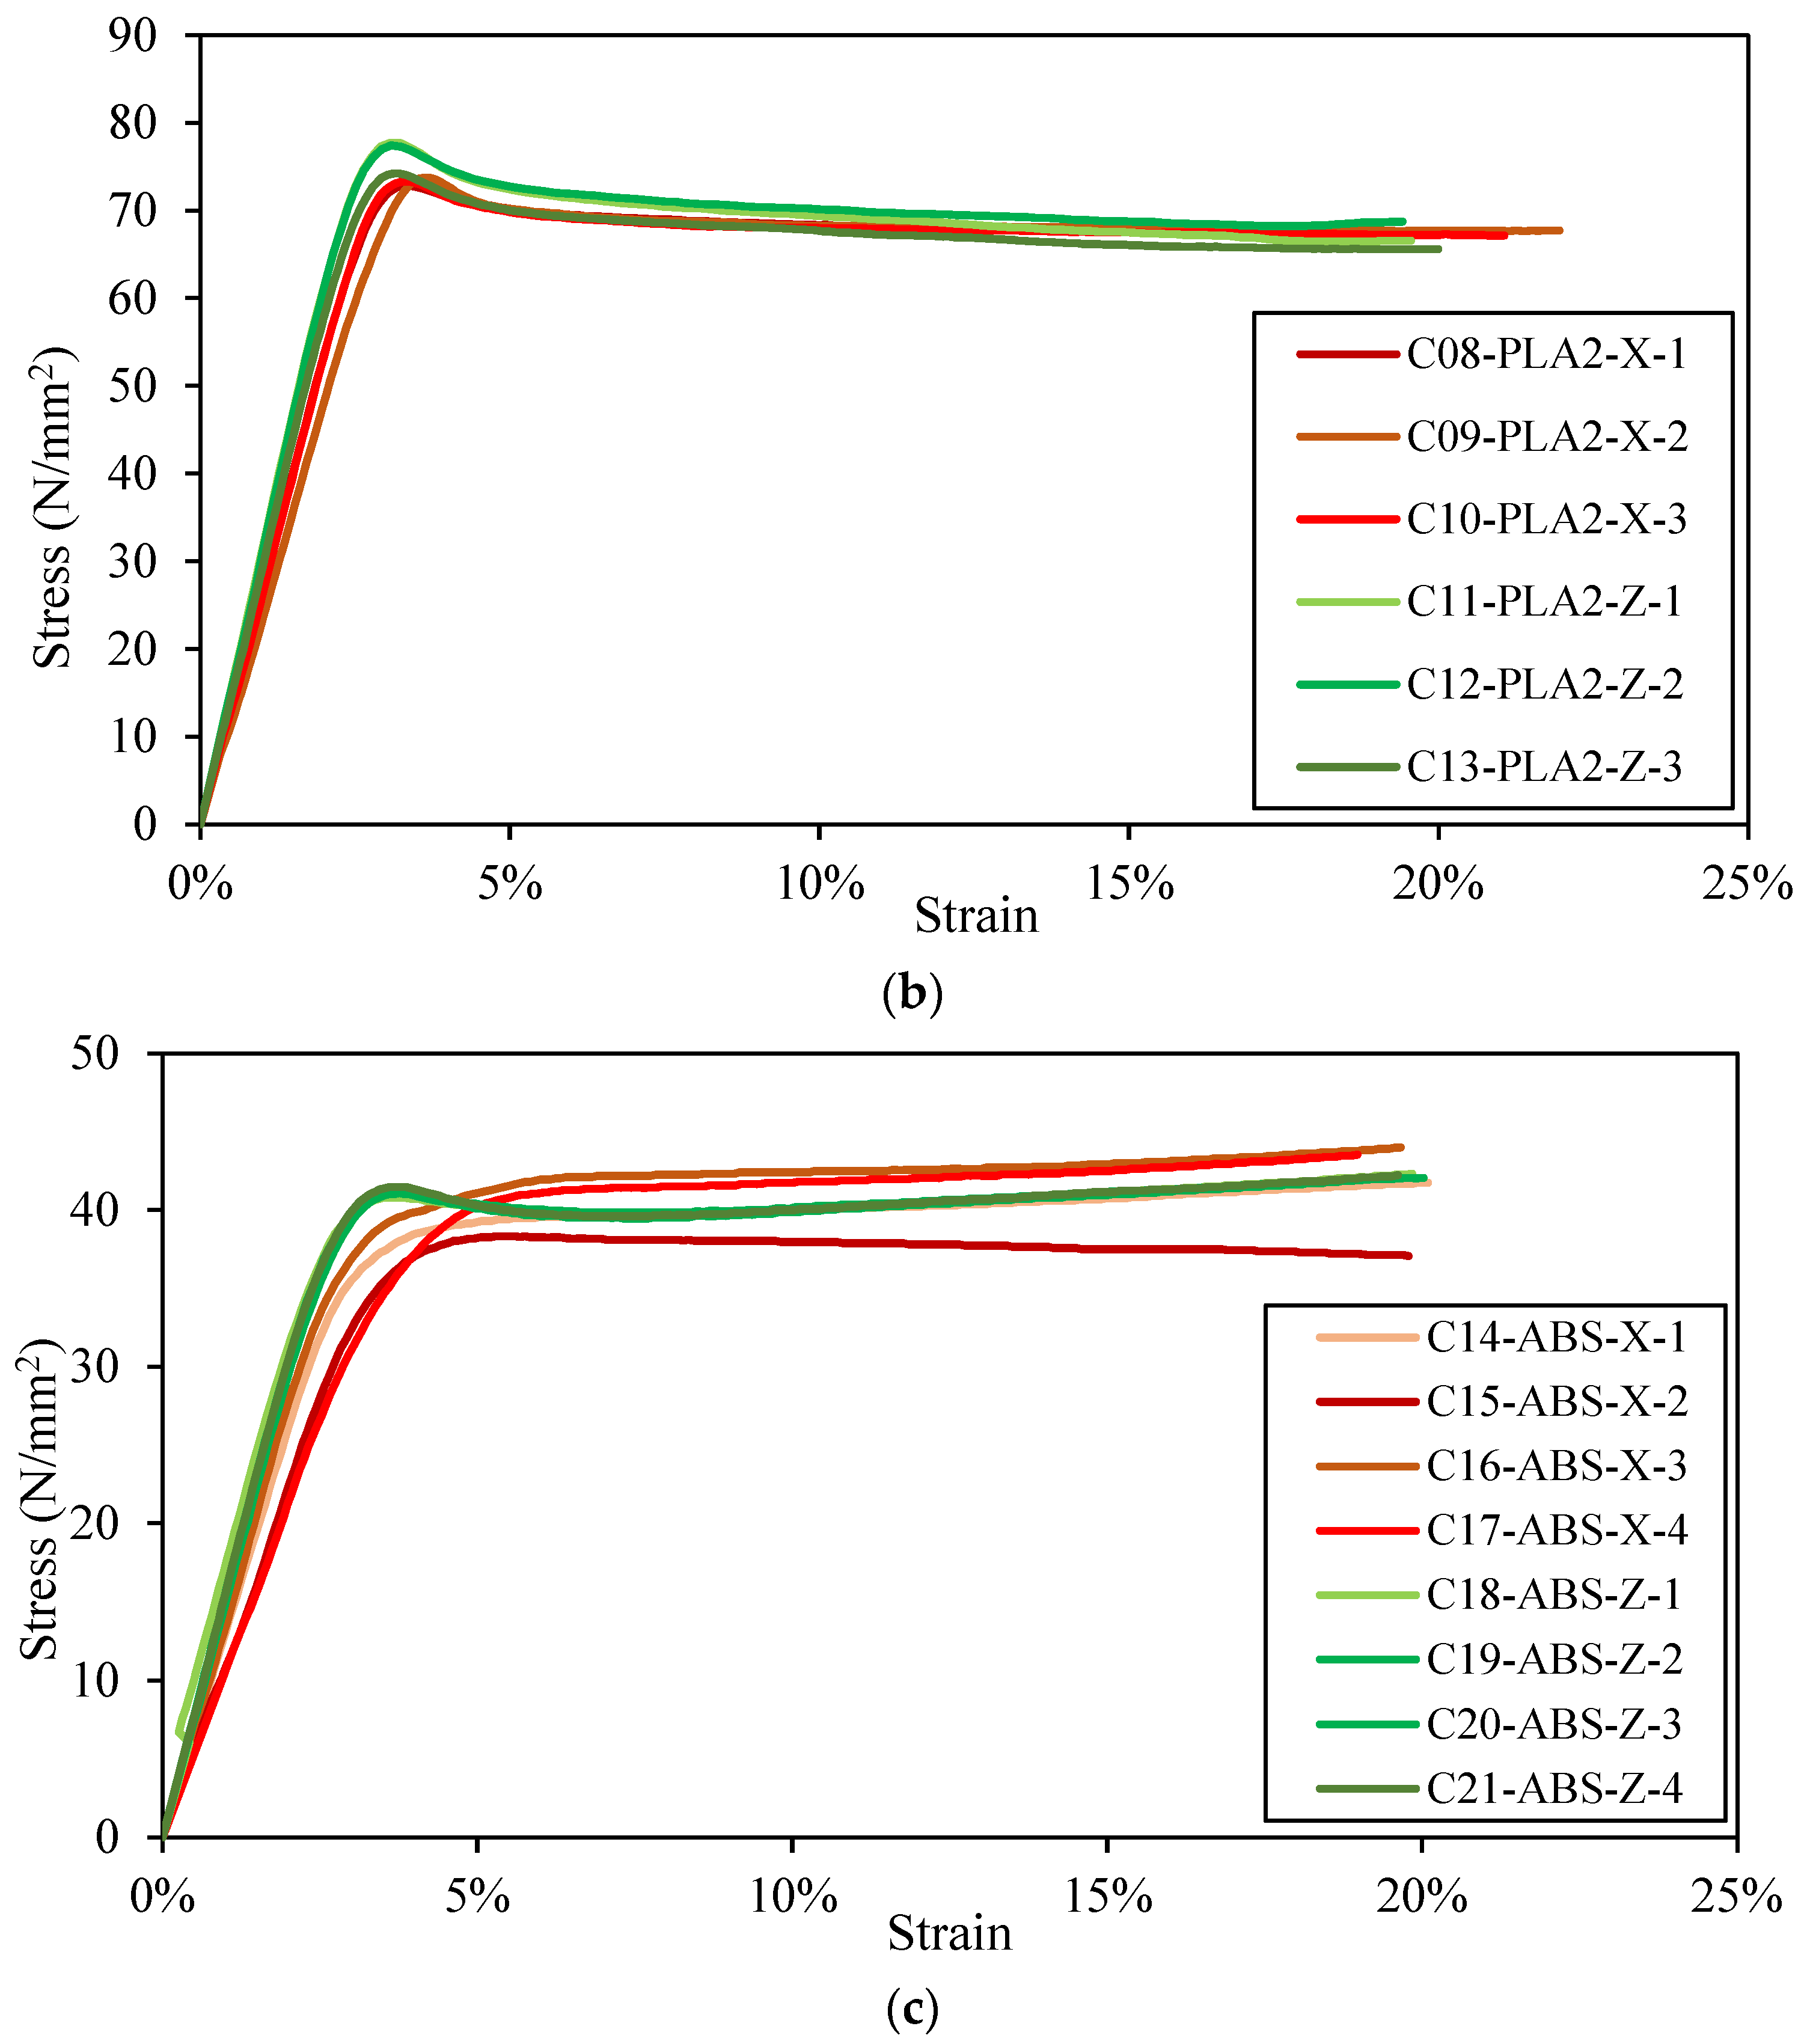
2.1. Tensile Testing

The nominal values of the minimum breadth bt,1, thickness bt,2 and overall length L of the tensile specimens are in accordance with EN ISO 527-2 [33] and are shown in Figure 2a. Geometric models designed in accordance with these standard specifications have been developed in standard technical modelling software and then transferred to PrusaSlicer 2.4.0 [34] software to prepare Gcode toolpathing instructions for the printer. To assess the orthotropic response of the printed polymers, the specimens have been printed in three different orthogonal layering orientations, with three specimens printed in each orientation for statistical confidence. The co-ordinate system shown in Figure 2b has been defined to facilitate reference to these orientations, with the global y-axis aligning with the layering direction during printing, and the x- and z-axes defining the plane of the printing bed. The printing orientations have been labelled to reflect the global axis that aligns with the major cross-sectional axis of the specimen during printing. Of particular interest is the behaviour of the specimens printed in the z-orientation where the axial stresses are applied across successive printed layers during testing. A total of 18 tensile specimens have been printed in the present study, with properties including dimensions b1 and b2 and the coefficient of variation (COV) of these dimensions shown in Table 2. The specimens have been printed with 100% infill in order to assess the material behaviour directly, as opposed to any metamaterial response arising from a geometric infill. The tensile specimens are labelled thus: T[test identification number]-[material]-[printing orientation according to Figure 2b]-[specimen index].
The operational parameters recommended by the printer manufacturers for PLA and ABS have been applied during printing, which are a filament deposition diameter of 0.2–0.4 mm, a deposition rate of 10 g/h, nozzle application temperatures of 210 °C and 240 °C for PLA and ABS, respectively, and a chamber temperature of 80 °C; heat treatment was not applied to the specimens post-printing. The measured lengths of the specimens are all within 170 ± 0.3 mm, equating to a maximum deviation of 0.17% from the nominal length. The values of the cross-sectional dimensions bt,1 and bt,2 shown in Table 2 are the average of three measurements taken along the narrow central segment of the tensile specimens; the coefficients of variation (COV) of the deviations of the three cross-sectional measurements with respect to the nominal dimensions are also shown in Table 2. Printing accuracy tends to be highest in the direction of layering (the y-axis), and so deviations are smallest for the dimension aligned with that axis, i.e., bt,1 for the X specimens and bt,2 for the Y specimens.
Prior to testing, a clip-gauge extensometer is attached across a 50 mm reference length to measure extension and thus longitudinal strains (see Figure 3). The test specimen is clamped into the jaws of a Tinius Olsen HK25 Universal Testing Machine and, in accordance with ISO 527-1 [35], is loaded in tension at a rate of 1% of the reference gauge length per minute, i.e., 0.5 mm/min, until failure, equating to an average strain rate of 1.67 × 10⁻⁴ s−1. The resulting stress–strain graphs are shown in Figure 4.
The ultimate tensile strength σu,t, tensile elastic modulus Et, strains at ultimate tensile stress εu,t and tensile fracture strains εf,t determined for each specimen are shown in Table 2, while average values for these properties for each layering orientation are shown in Table 3. It can be seen in Figure 5 that the printed PLA material is stiffer and stronger across all orientations than the printed ABS material, while in Figure 6, it can be seen that the ABS material is more ductile. These findings agree with previous test results for 3D-printed PLA and ABS [2,3,4,5,6,7,24,25,26,27,28,31,32] and confirm that, when loaded parallel to the printing toolpath, i.e., in the X and Y orientations, PLA and ABS can outperform conventional structural materials like timber, concrete and brick in terms of the tensile strength (approximately 50 N/mm2 and 30 N/mm2 for PLA and ABS, respectively), suggesting useful applications in resisting loads; however, the relatively low stiffness of these printed materials (PLA 2900 N/mm2; ABS 1700 N/mm2) requires careful consideration in terms of allowable deformations and serviceability, but applications in aerospace, automotive and other mechanical contexts, in addition to temporary applications in construction, are envisaged.
As shown in Figure 5, the results for Et for both materials are approximately equal across all printing orientations and thus can be assumed to be isotropic for the purposes of analysis and design. The results for σu,t and εu,t shown in Figure 5 and Figure 6 suggest some orthotropy, with the Z specimens being weaker than the X and Y specimens. This effect is particularly noticeable for the ABS specimens and results from the tensile load acting across the interfaces between successive printing layers, which are typically the weakest regions of the printed part.

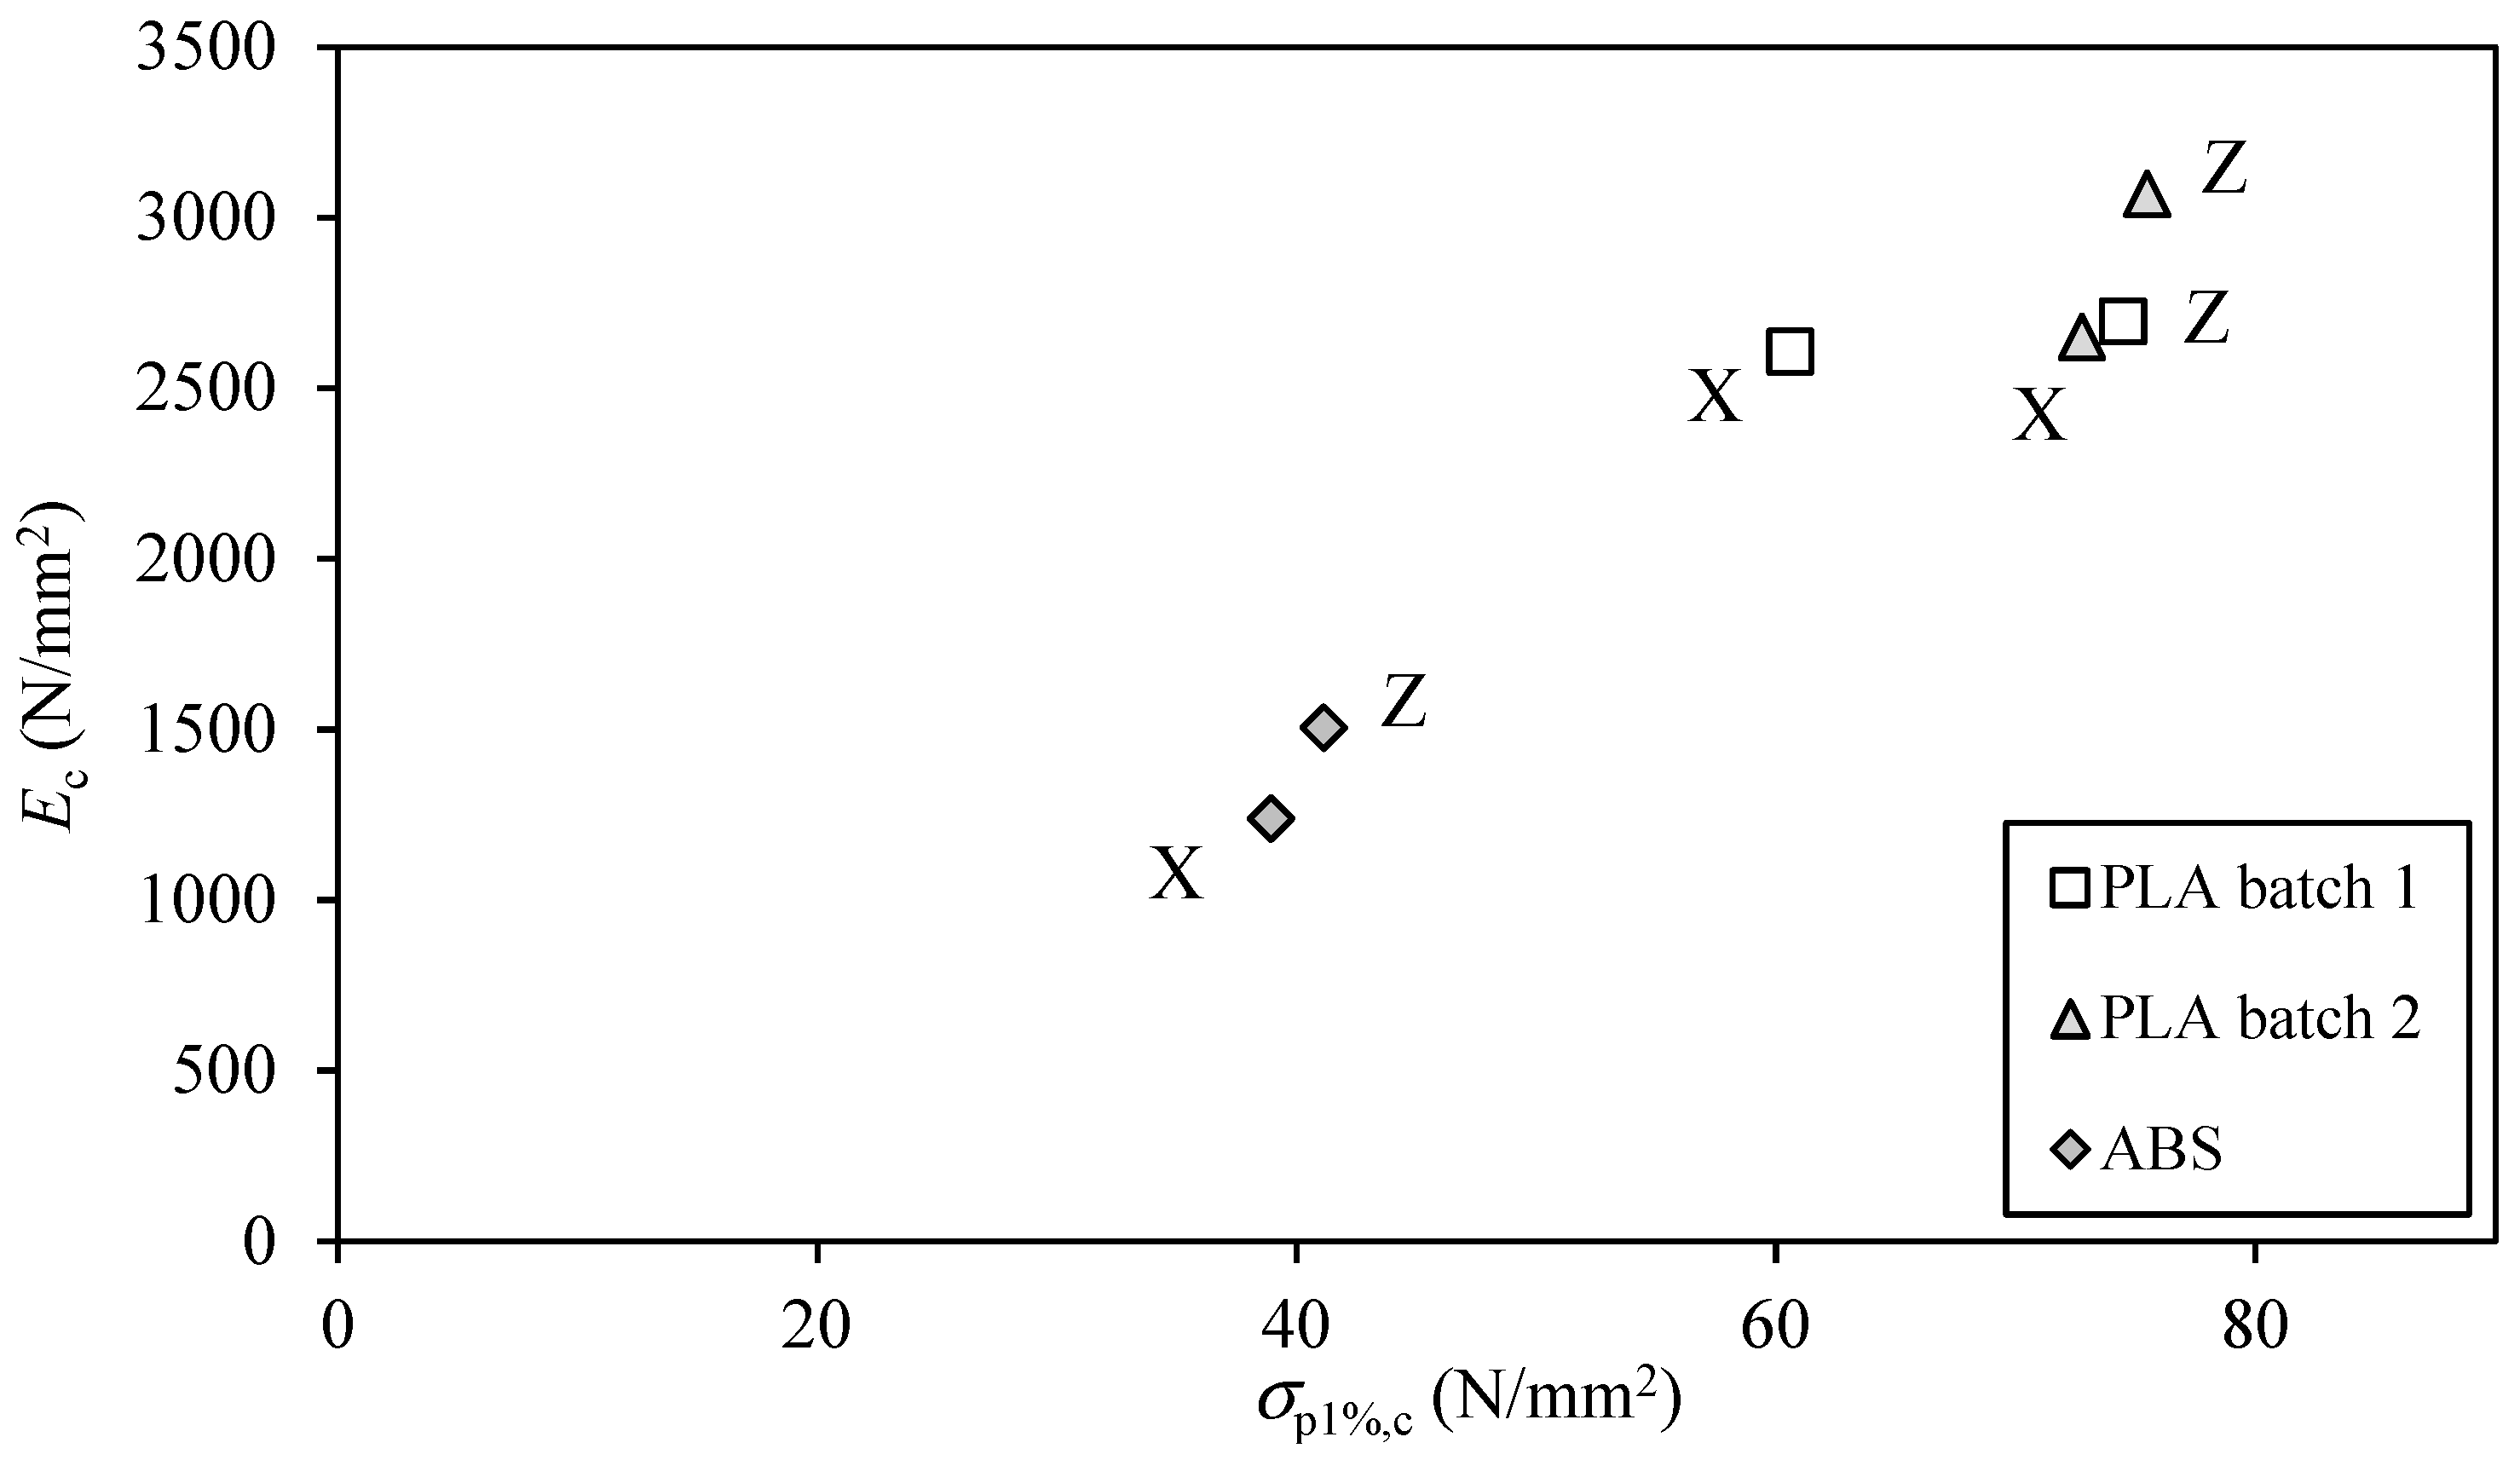
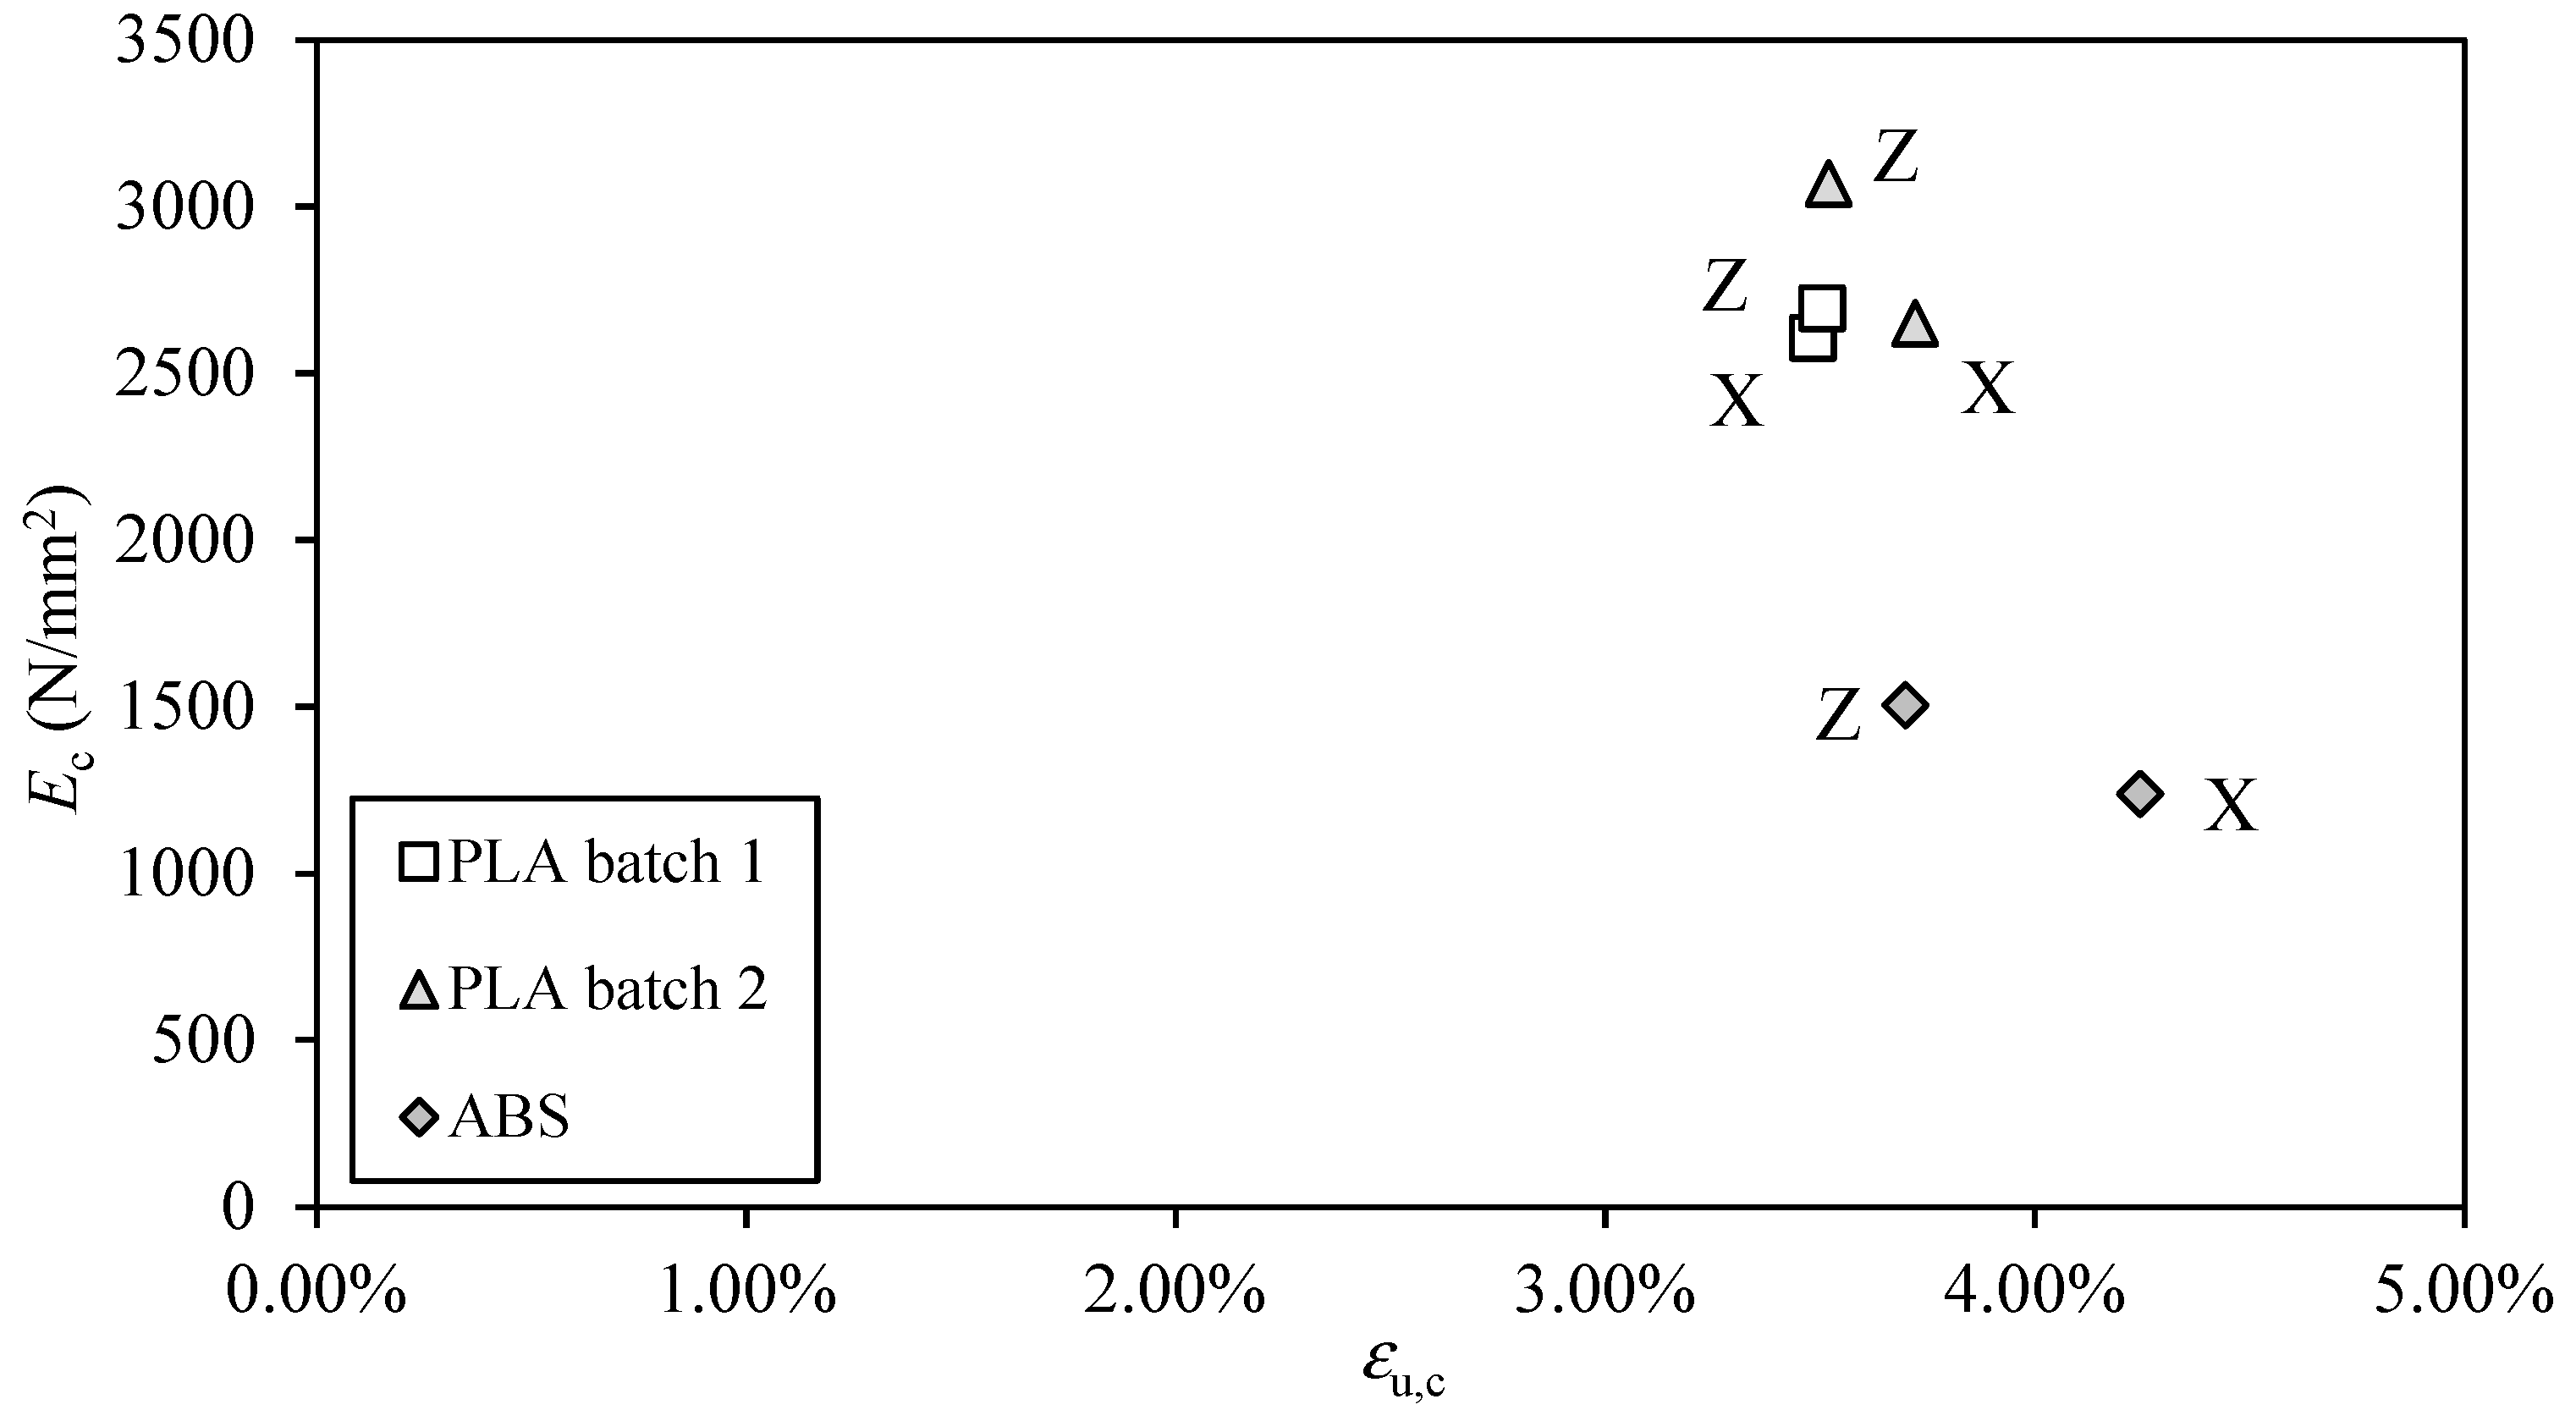
2.2. Compression Testing

A total of 21 compression specimens have been printed in the PLA and ABS materials, the nominal dimensions of which (cross-section width bc,1, cross-section breadth bc,2, height h) are in accordance with ASTM D695 [36] as shown in Figure 7. Two separate batches of Ultimaker PLA specimens have been printed at different temperatures, with PLA batch 1 printed at 190 °C and PLA batch 2 printed at 210 °C, with all other printing parameters being identical to those employed during the printing of the tensile specimens. The specimens have been printed in the layering orientations shown in Figure 7 to assess the orthotropy of the response in compression, with three to four specimens printed in each orientation for statistical confidence. The compression specimens have been labelled thus: C[test identification number]-[material]-[printing orientation according to Figure 7]-[series index], with measured geometric properties shown in Table 4 along with deviations from the nominal dimensions. The specimens are placed between the loading platens of a Tinius Olsen HK25 universal testing machine, with a displacement transducer set in contact with the loading platen to record vertical displacement.
During testing, a downwards displacement is applied monotonically at a rate of 0.25 mm/min until 5 mm of displacement is recorded by the transducer; note that this equates to an average strain rate of 1.64 × 10⁻⁴ s−1, which is almost identical to the strain rate applied during tensile testing.
Graphs of compressive stress against strain are shown in Figure 8 for the batches of PLA and ABS specimens, where the compressive strain is defined as the ratio between the recorded vertical displacement and the original specimen height h. Upon inspection of Figure 8, it can be seen that the post-yield behaviour varies between the different sets of specimens. After an initial regime of linear elastic deformation, the majority of specimens exhibit a clearly observable peak stress followed by a reduction in load-carrying capacity. For all PLA specimens across both batches, the post-peak behaviour is unstable with the load continuously decreasing, most noticeably so for the PLA1-Z specimens. Some mild restabilization is observed towards the end of the PLA2 tests with the curves flattening out.
In the case of the ABS specimens (see Figure 8c), there is a noticeable difference in behaviour observed between the X and Z specimen sets. After the initial regime of linear elastic behaviour, the Z specimens exhibit well-defined peak stress in keeping with the PLA specimens, albeit with a post-peak behaviour that in fact restabilizes strongly leading to a resumption of load-carrying capacity. This behaviour is analogous to the densification effect observable in cellular foams [37] whereby the voids at the microscale within the material are compacted, which manifests as an increase in stiffness at the macroscale. In the case of the ABS-X specimens, the compressive response exhibits a more gradual progression towards nonlinear behaviour similar to that observed in many ductile metallic materials [38], with no clearly defined peak stress observable.
When defining representative compressive strengths, the ultimate strength corresponds with the peak stress observed for the majority of specimens during testing. For the ABS-X specimens, since there is no well-defined maximum stress, it is more appropriate to employ a 1% proof stress approach to characterize the compressive strength of the material; this proof strength has been calculated for all specimens to facilitate comparison across the material batches. The values obtained from testing for compressive elastic modulus Ec, ultimate compressive strength σu,c, 1% proof stress in compression σp1%,c and strain at ultimate compressive stress εu,c are shown in Table 4.
As can also be seen in Figure 9, in contrast to the tensile specimens, the Z specimens are in fact the strongest and stiffest, albeit only marginally so for the majority of sets of specimens. In general, upon examination of Figure 9 and Figure 10, it is reasonable to consider the strength, stiffness and ductility of the 3D-printed materials in compression as isotropic; it should be noted, however, that the compressive strength of the PLA1 specimens, which were printed at a lower temperature than the PLA2 set, are on average 23% weaker in the X orientation than in the Z orientation. It has been shown previously [5] that printing temperature has a direct influence on strength; this effect is more pronounced in the X specimens since the load is acting to buckle individual layers of printed material, whereas the load acts to compress layers of material further together in the Z orientation specimens.
Comparing the results for average tensile and compressive material properties in Table 3 and Table 5, respectively, and noting that the strain rates applied are very similar, it is clear that the compressive strength of these 3D-printed materials is significantly higher than the tensile strength, particularly for the Z orientation specimens with σp1%,c/σu,t = 1.75 and 2.43 for the PLA and ABS materials, respectively; for the X orientation specimens, these ratios are 1.53 and 1.30, respectively. Similar increases in compressive strength over tensile strength have also been observed in previous studies of 3D-printed PLA and ABS [3,4,5,24,25,31], while it has also been reported previously [24,25] that the elastic moduli of PLA and ABS are both greater in tension than in compression, as has also been found in the present study.

2.3. Poisson’s Ratio in Compression

Compression tests have been conducted on an additional set of four specimens in order to determine the Poisson’s ratio ν, which have been printed in the X and Z orientations shown in Figure 7. The dimensions of these cuboid specimens are double the standard dimensions from ASTM D695 [36], i.e., 25.4 mm × 25.4 mm × 50.8 mm, in order to facilitate the application of a set of strain rosettes on either side of the specimen. The specimens are placed within the loading platens of a Tinius Olsen HK25 Universal Testing Machine and loaded within the elastic range as predicted by the compressive test results discussed in Section 2.2.
Based on the load–deflection behaviour observed during testing, the characteristic value of ν = −(average transverse strain/average longitudinal strain) for a given material is taken as the average value across a displacement interval of 0.4–1.0 mm where the specimens deform linearly; these values are summarised in Table 6, which agree with previous observations for PLA [39] and ABS [40].

3. Full-Scale Testing

In this section, uniaxial compression tests conducted on full-scale 3D-printed elliptical tubes are described. Results for ultimate load, failure mode, load–displacement relationships and longitudinal strains are discussed. The results for ultimate load are compared in Section 4 to previous design guidance [22] originally formulated for steel elliptical tubes. In keeping with the material tests described in Section 2, all specimens have been printed using the Ultimaker 3+ Extended FFF printer in DARLAB, with testing conducted in controlled conditions of 19–20 °C at LSBU.

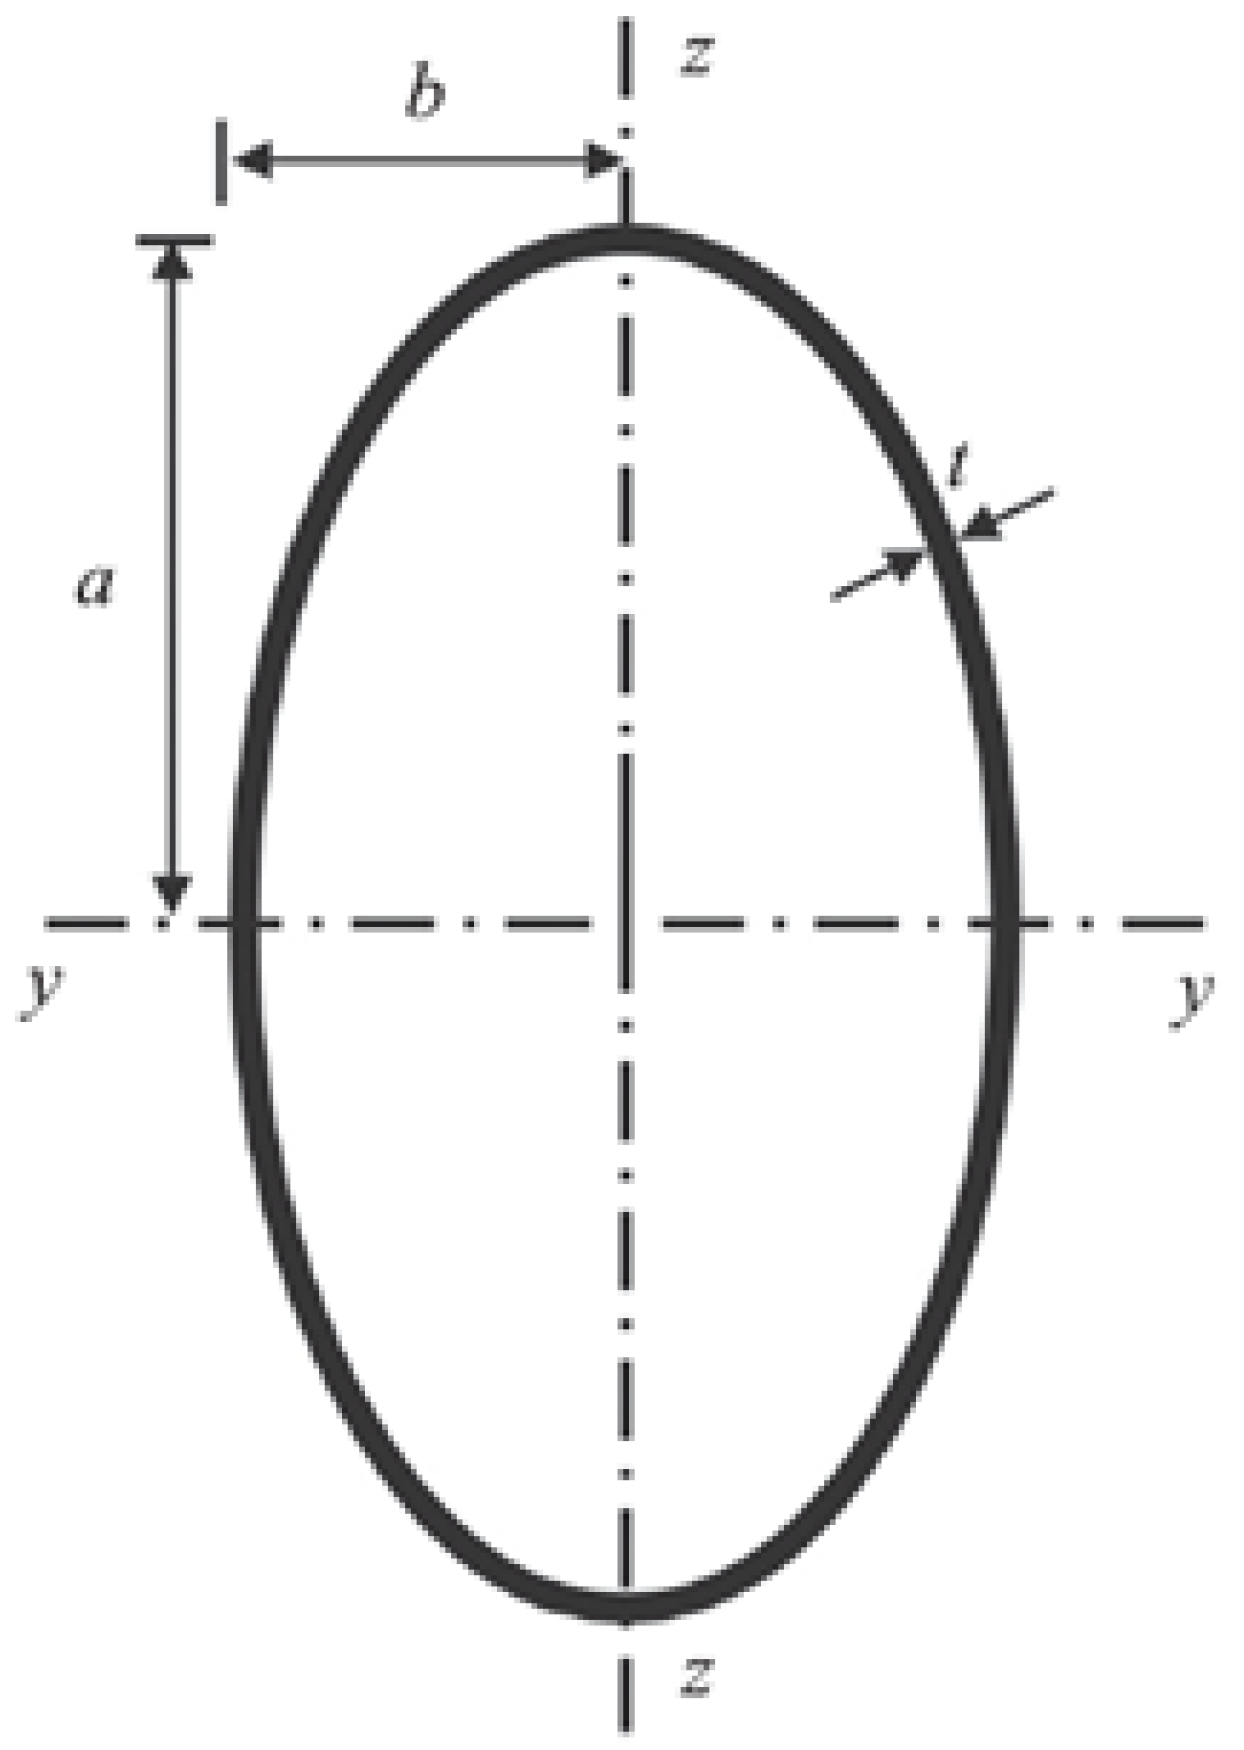
3.1. Elliptical Tube Geometry

A total of 24 elliptical tubes have been printed in either PLA or ABS with cross-sectional aspect ratios a/b = 1.5, 2.0 and 3.0, and nominal tube wall thickness t ranging between 1.0 mm and 3.0 mm; the full schedule of specimens and their cross-sectional properties are shown in Table 7. The specimens are labelled thus: EHS[specimen identification number]-[material batch]-[nominal maximum outer diameter 2a]-[nominal minimum outer diameter 2b]-[nominal t]. Specimens EHS01 to EHS08 [41] were printed in PLA at the lower printing temperature mentioned in Section 2.2; specimens EHS09 to EHS17 have been printed in PLA at the higher printing temperature. EHS18 to EHS24 have been printed in ABS. Specifically, the dimensions of these specimens have been chosen so that failure is encouraged to occur via local modes in the tube walls; the slenderness of the cross-sections is defined and discussed in Section 4.1.
The cross-sectional area of an elliptical tube A = Pm × t, where the mean tube wall perimeter Pm is given by the approximation of Ramanujan [8] thus:
P m = π a m + b m 1 + 3 h m 10 + 4 - 3 h m
where am = (at/2), bm = (bt/2) and hm = (ambm)2/(am + bm)2. The maximum and minimum outer diameters 2a and 2b of the sections have been chosen so that the mean perimeter Pm is approximately constant for all specimens; the values of Pm and A calculated using the measured properties of the specimens are shown in Table 7 (additional parameters are defined in Section 4). The nominal length L is 280 mm for all specimens, reflecting the maximum height achievable by the printer.

3.2. Fabrication and Precision

Geometric model files created using the nominal dimensions shown in Table 7 are used as input for PrusaSlicer 2.4.0 [34] to prepare Gcode directly for the printer. Referencing the global axes defined in Figure 2, the toolpath for the elliptical tubes consists of layers of material printed circumferentially in the xz-plane and then layered upwards along the longitudinal y-axis of the elliptical tube. Printing parameters and conditions are identical to those described in Section 2.
The outer diameters 2a and 2b, and the length L of all the specimens were found to be within 0.5% of the nominal values. Measurements of the wall thickness t were taken at four points around the cross-section at either end of the specimens; average values are shown in Table 7 along with the standard deviations from the nominal dimensions, and the resulting coefficient of variation of the tube wall thickness COV(t). As can be seen, COV(t) is between 1% and 6% for all specimens other than specimens EHS08 and EHS21 where the COV(t) values are 10.9% and 15.4%, respectively, indicating a lower level of precision during fabrication of these specimens.

3.3. Test Methodology

The printed specimens have been tested in the Strength of Materials laboratory at LSBU. After taking measurements of cross-sectional dimensions and length, the specimen is placed in a Zwick/Roell 100 kN universal testing machine as shown in Figure 11a. Care has been taken to position the specimens so that the load is applied as concentrically as possible in order to minimize any additional bending stresses arising from load eccentricity. A displacement transducer is placed in contact with the upper loading platen in order to record the vertical displacement of the platen, which corresponds with the end shortening of the elliptical tube specimen. Strain gauges have been affixed around the midspan cross-sections of PLA specimens EHS01, EHS10 and EHS16 at the positions indicated in Figure 11b to assess the influence of cross-sectional aspect ratio on longitudinal strain. The specimens are loaded under displacement control at a rate of 0.5 mm/min until failure, equating to an average strain rate of 3.0 × 10⁻⁴ s−1. Considering the viscoelastic response of polymers to strain rate, the Ree–Eyring [42] model adapted by [43] has been applied to assess for any significant changes to the mechanical properties of the 3D-printed PLA and ABS materials in compression. It is found that, when taking the difference in applied strain rates from the mesoscale material tests and full-scale stub column tests into account, there is little difference found in the mechanical properties.

3.4. Results

Results obtained for failure modes, load–end shortening relationships and longitudinal strains are discussed in this section; results for ultimate load are discussed in more detail in Section 4.

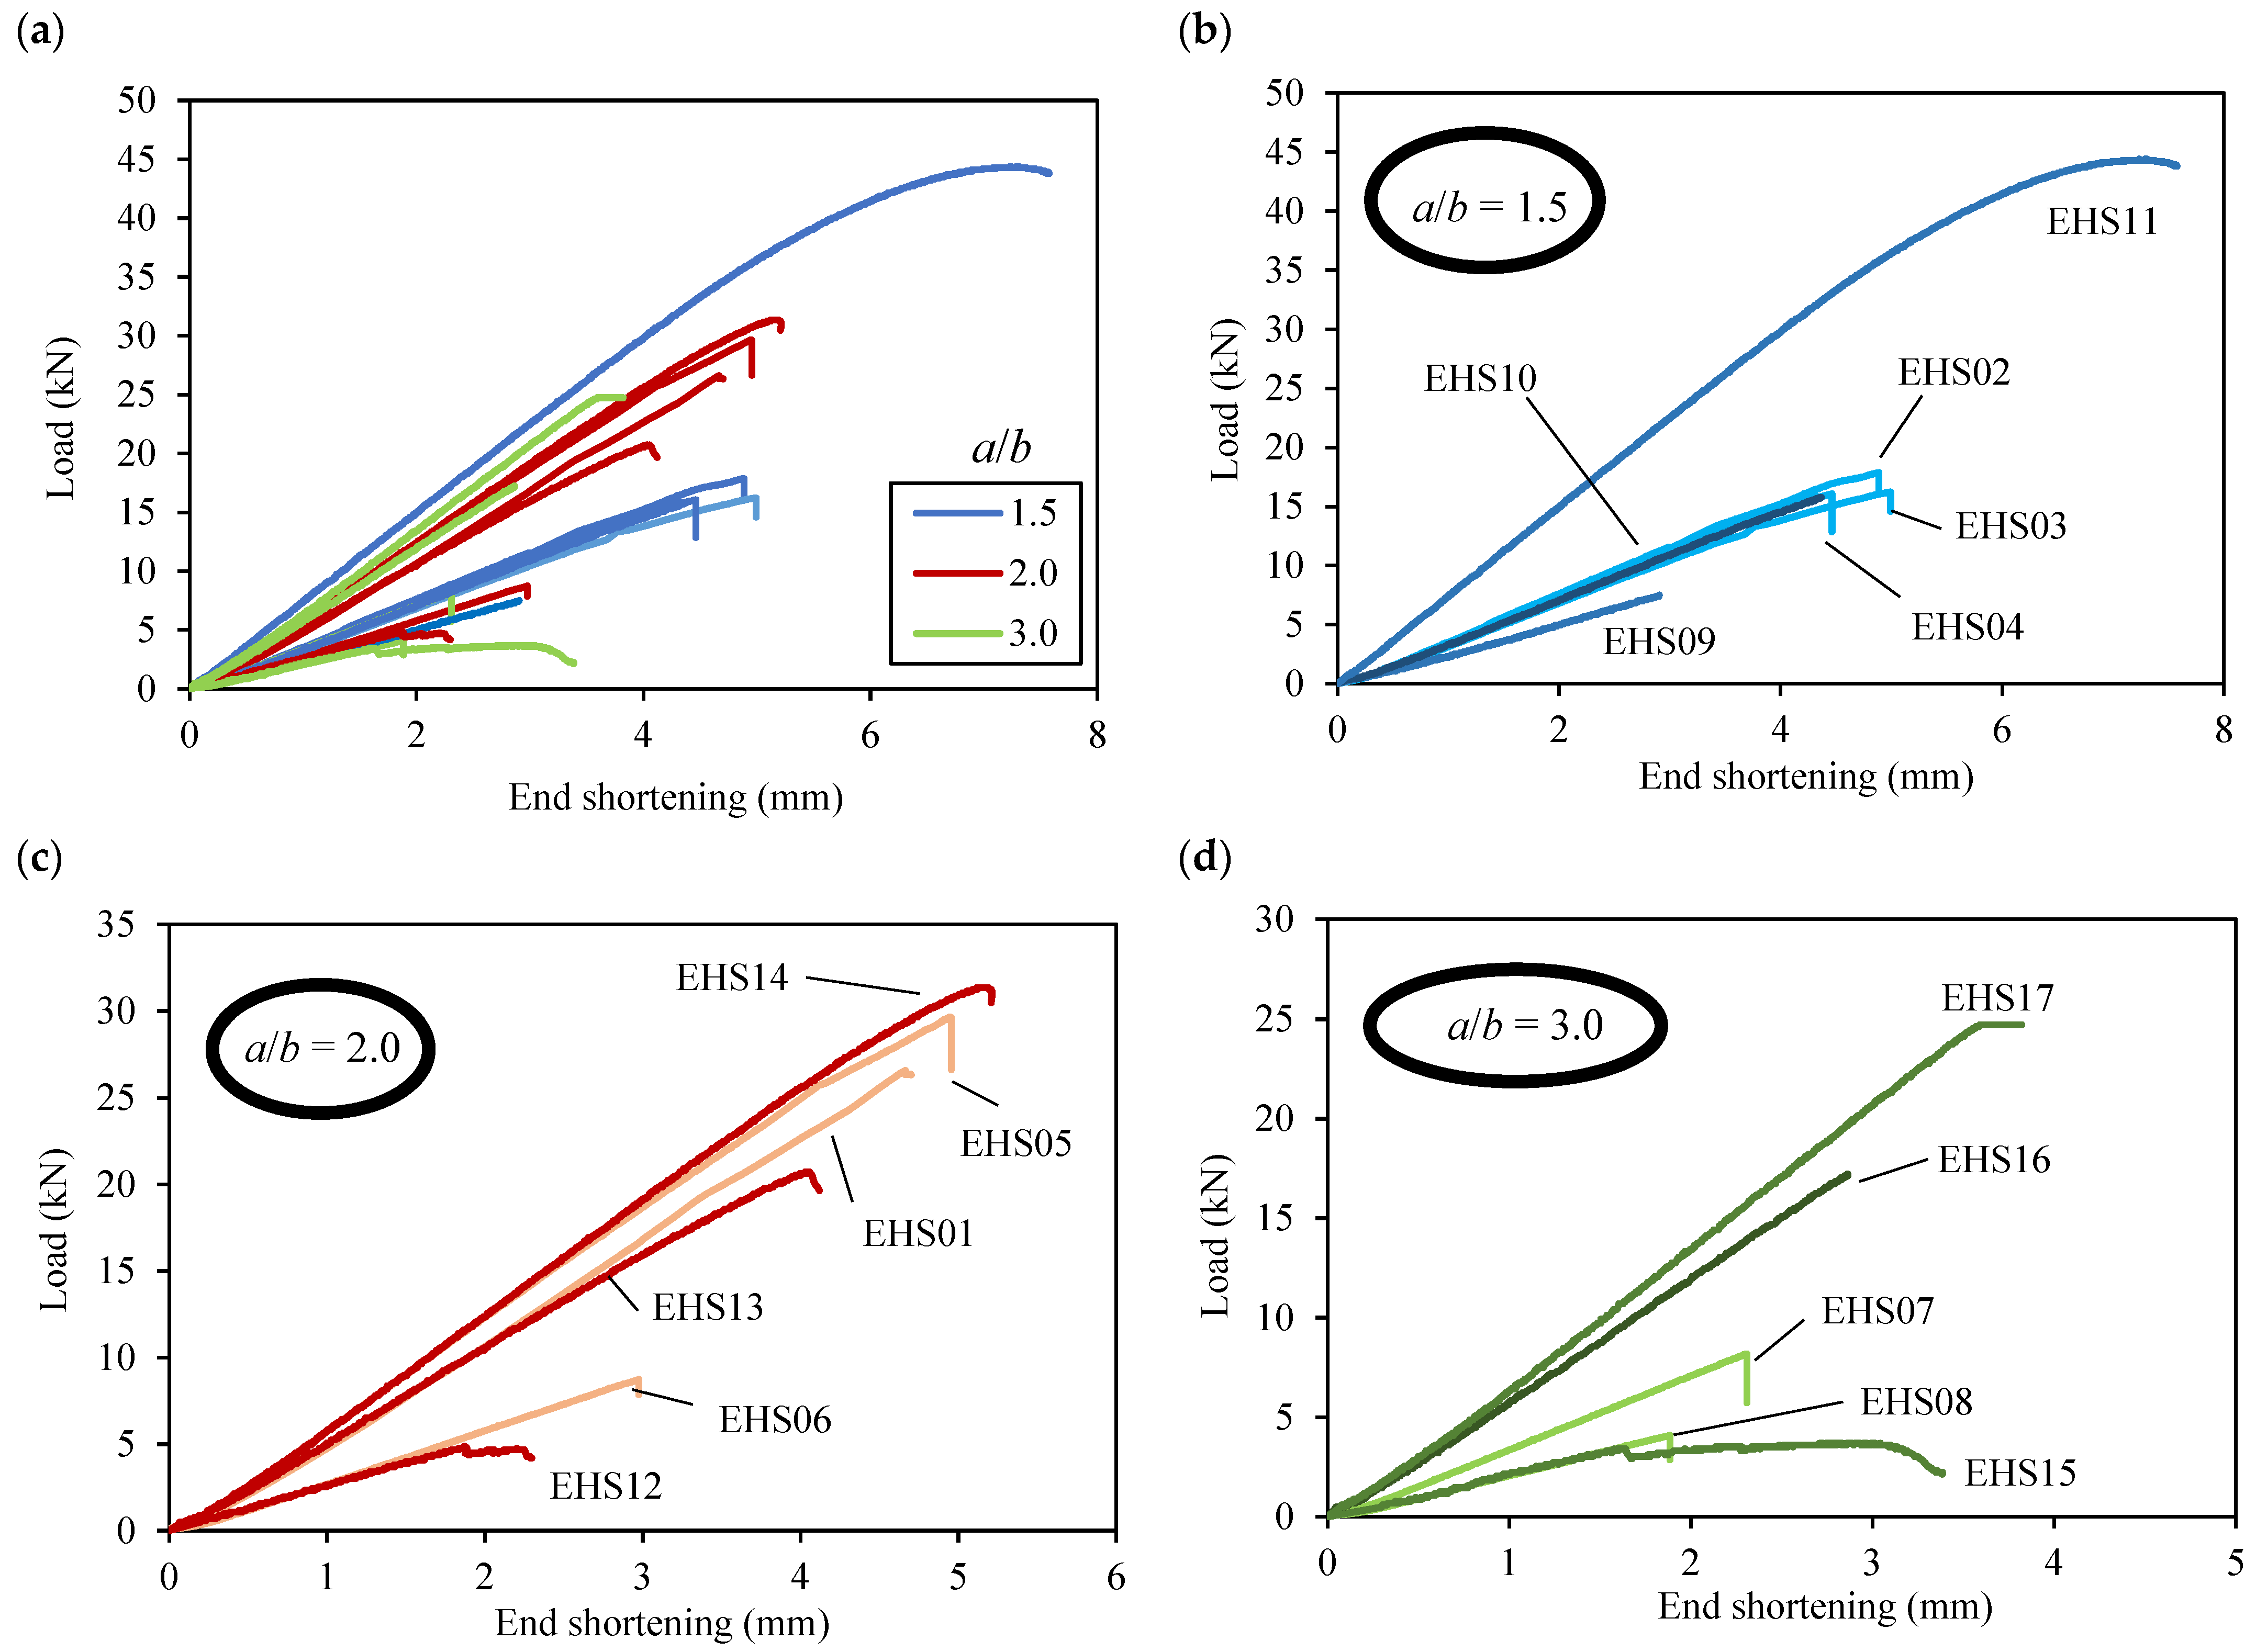
3.4.1. Load–End Shortening Relationships

Graphs of applied load against end shortening are shown in Figure 12 and Figure 13 for the PLA and ABS elliptical tube specimens, respectively; the results for experimental ultimate load Nu,exp are shown in Table 8. In Figure 12b–d, graphs for the PLA batch 1 specimens (EHS01 to EHS08) are plotted in lighter colours while those for PLA batch 2 (EHS09 to EHS17) are plotted in darker colours. It can be seen that almost all PLA specimens have undergone linear elastic deformation up to a sudden failure with a negligible amount of softening visible; EHS11-PLA2-90-60-3.0, which is the stockiest specimen, has shown a more gradual softening prior to achieving its ultimate load, indicating that yielding has occurred prior to rupture of the material.
As shown in Figure 13, there is a considerable amount of post-peak deformation recorded for the more ductile ABS specimens. The load–end shortening curve for EHS21 suggests a loss of the initial linear stiffness after only a small amount of end shortening. It should be noted that COV(t) for EHS21 is over 15%, suggesting a higher level of imperfection during the fabrication process, which can manifest as a lower relative stiffness of the material during compression testing.

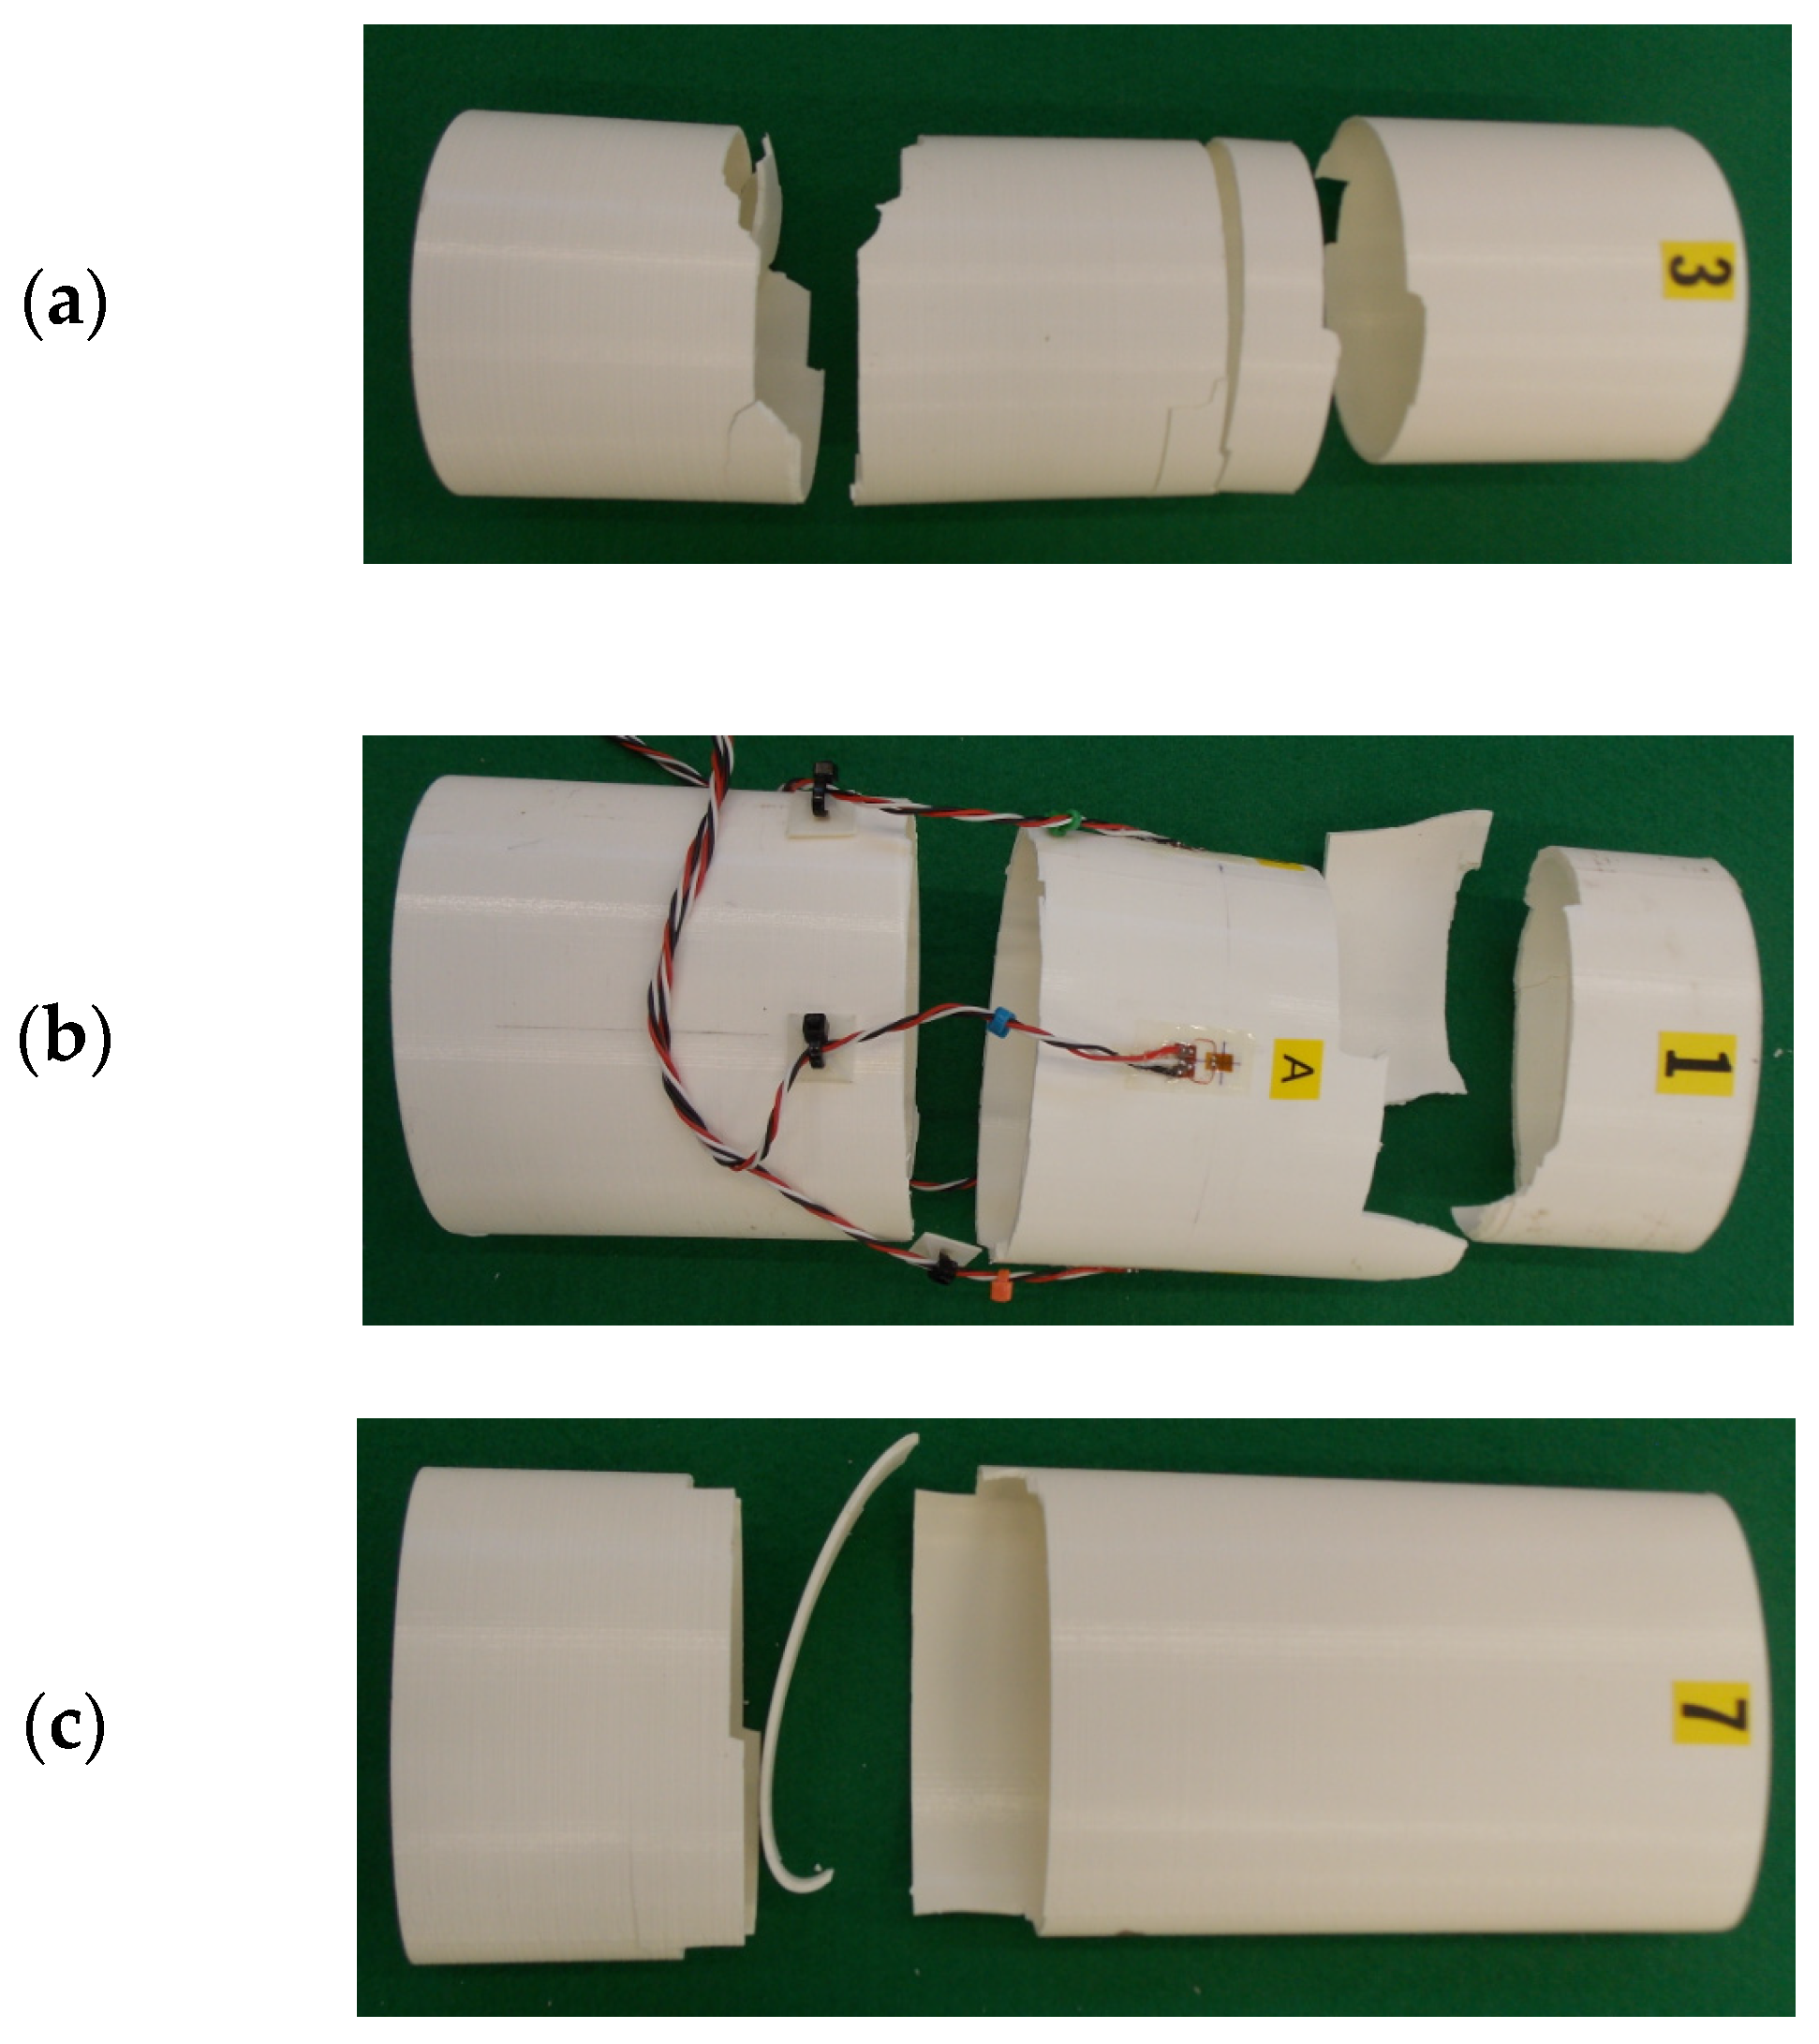
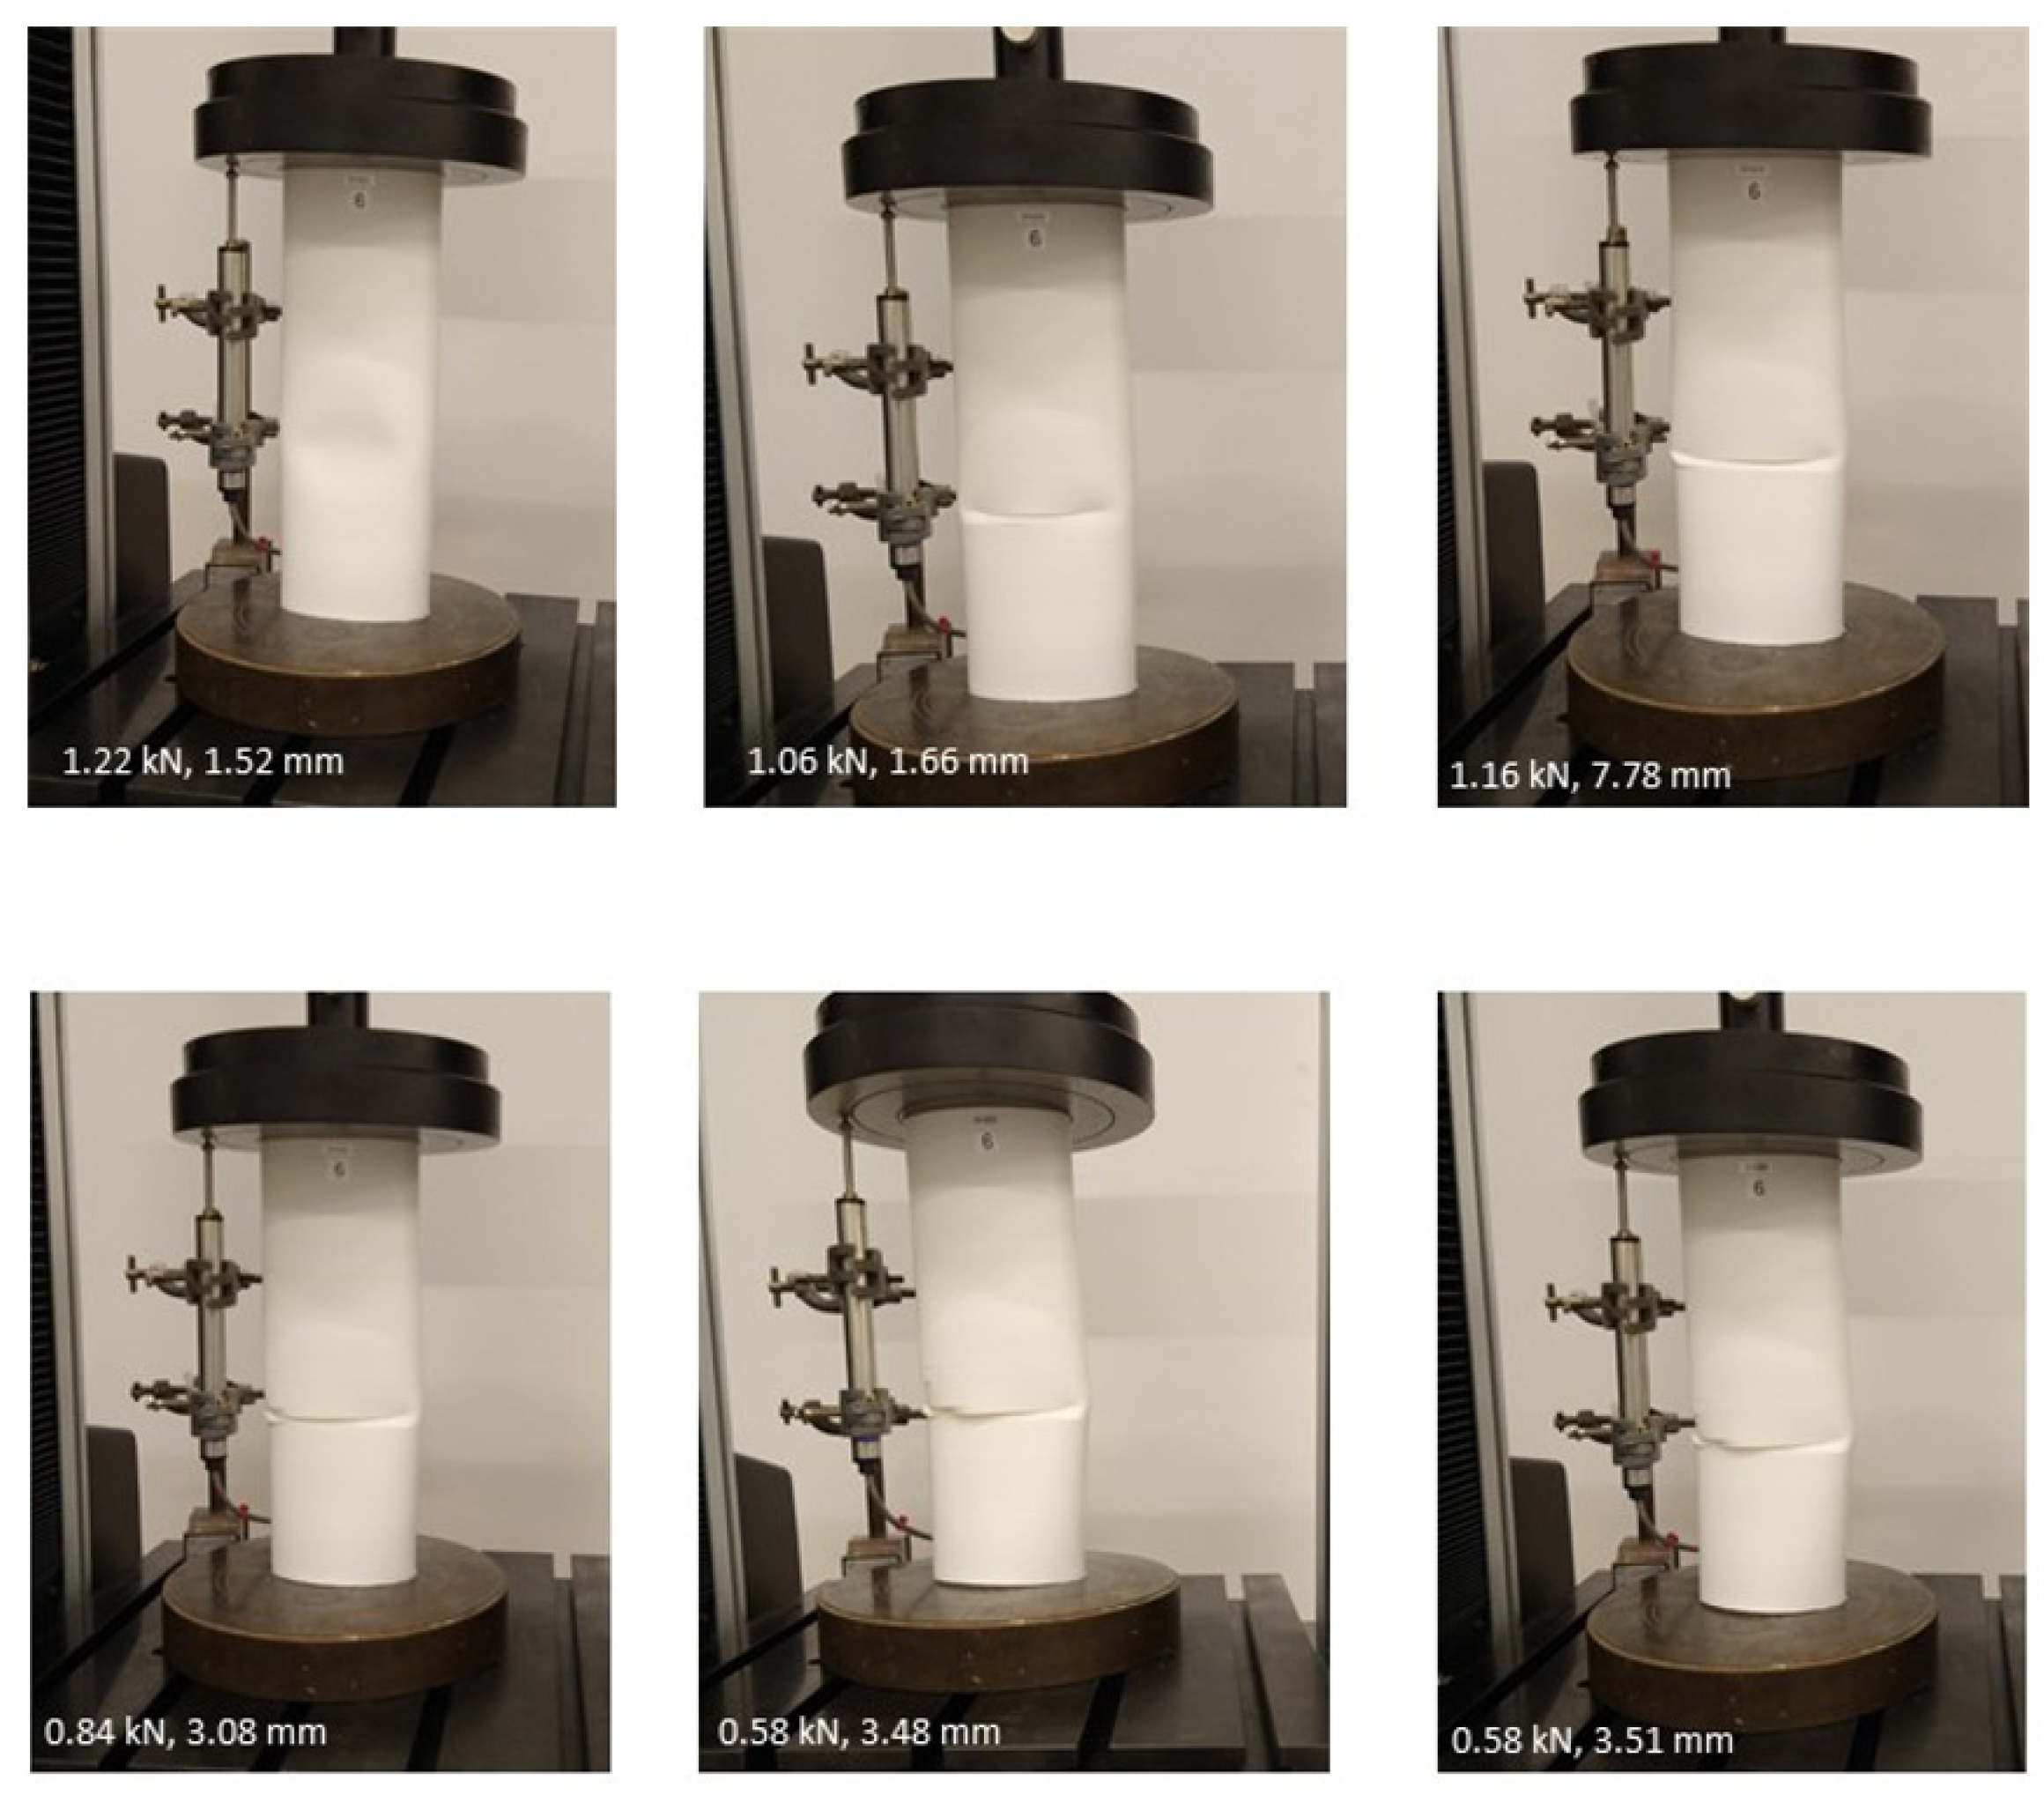
3.4.2. Failure and Deformation Modes

The failure mode observed in all specimens eventually involved ruptures initiating at the extremes of the minimum diameter, i.e., either points A or C in Figure 11b. As shown in Figure 14 for the PLA specimens, the point of failure was not necessarily at mid-height. In Figure 15, the deformations observed in the more ductile ABS specimens indicate the evolution of local buckling of the tube walls before a more catastrophic rupture of the material; these losses of stiffness are also evident in the load–end shortening curves shown in Figure 13. This behaviour is commensurate with the stable post-yield response shown in Figure 8c from compression testing of the ABS material specimens.

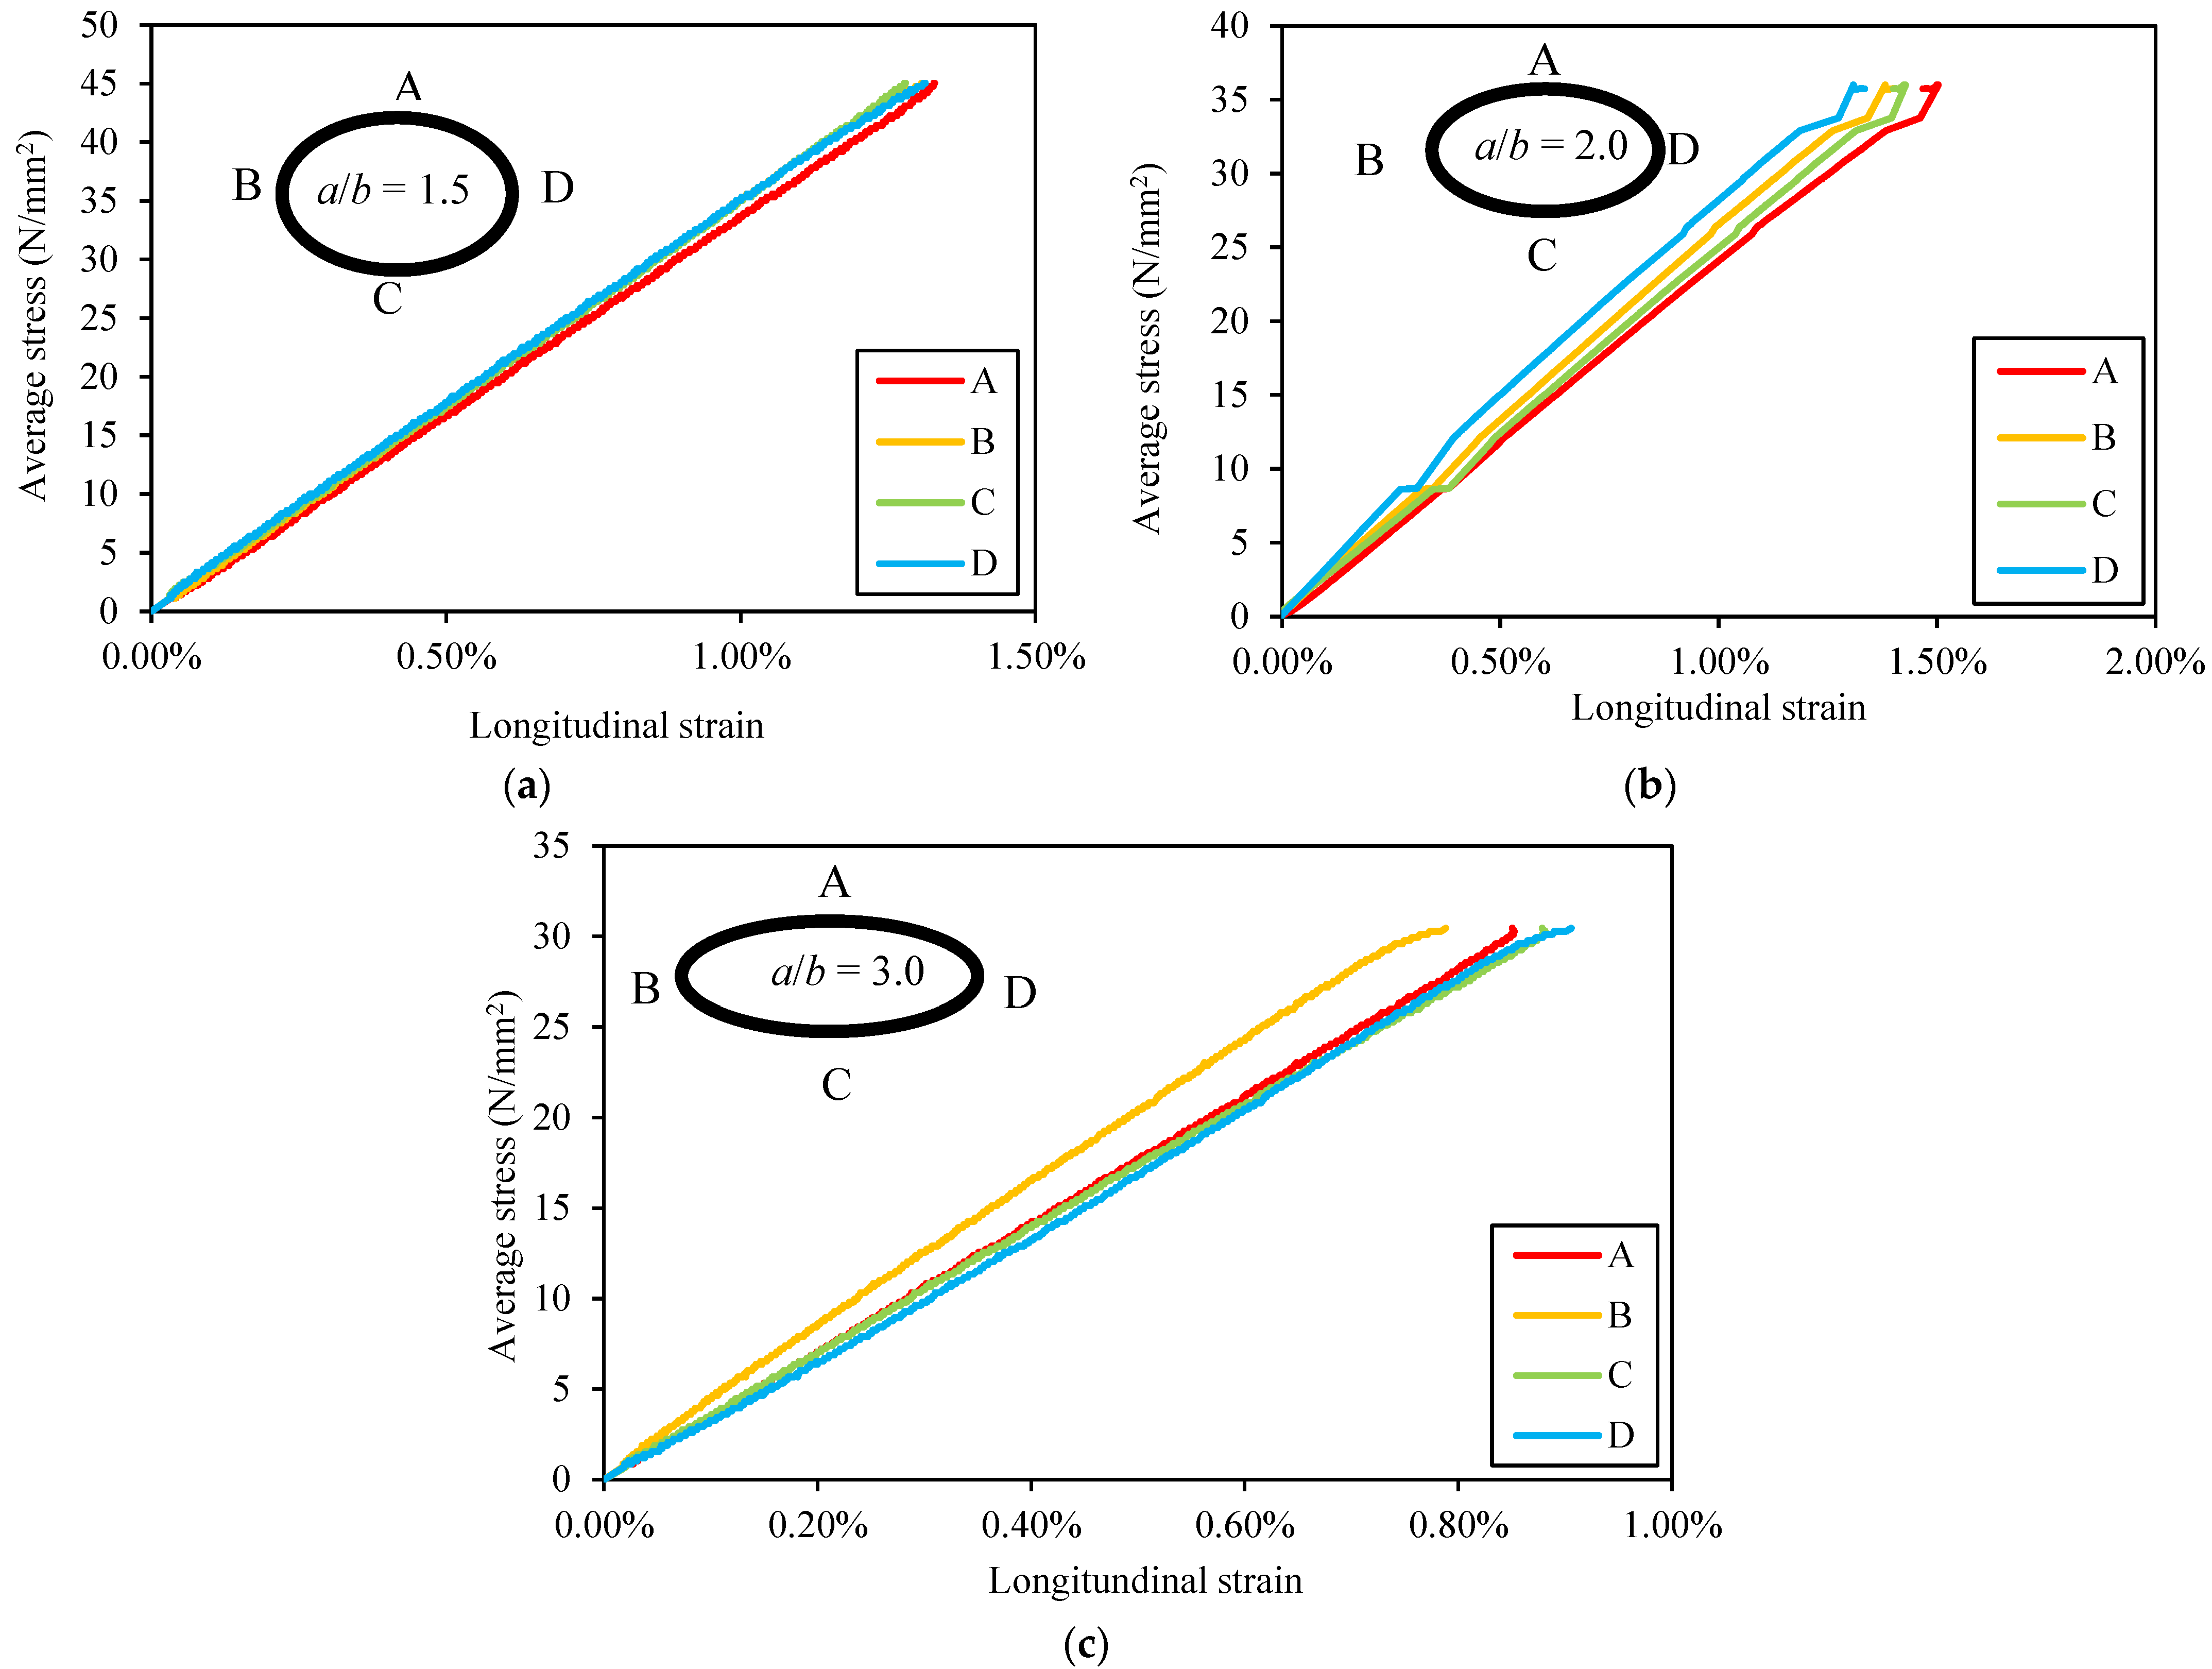
3.4.3. Longitudinal Strains

In Figure 16a–c, the strains recorded at mid-height during testing of PLA specimens EHS10 (a/b = 1.5), EHS01 (a/b = 2.0) and EHS16 (a/b = 3.0), respectively, are plotted against the average compressive stress. It can be seen for each specimen that the highest strains are recorded at either point A or point C. These points are the extremes of the minimum diameter where the local curvature and hence stiffness are lowest, and thus failure initiates; this is in agreement with the failure and deformation modes shown in Figure 14 and Figure 15. In Figure 16a, it can be seen that the strain readings are almost identical at each strain-gauged location for EHS10, which has an aspect ratio a/b = 1.5. With increasing aspect ratio, the discrepancy between the strains at the extremes of the minimum and maximum diameters increases, which is particularly apparent in Figure 16c for EHS16 with a/b = 3.0 when comparing strains at points C and D. This effect can be contributed to the increasing difference in curvature at points A/C and B/D with increasing aspect ratio.

4. Design Method

In this section, a procedure is described for adapting existing design rules for slender steel elliptical section tubes for use with those printed in PLA and ABS, with the compressive material properties determined from testing used to calculate relevant design parameters. With the design procedure adapted, the experimental results for ultimate load resistance are compared with a previous design proposal for slender steel elliptical tubes in compression [22].

4.1. Local Buckling of Elliptical Sections

The elastic critical local buckling stress σcr of an elliptical section can be found via an equivalent diameter concept [44,45] whereby the elliptical section is represented by a circular section with a radius equal to the radius of curvature at the point of initiation of buckling. Note that, although PLA and ABS are certainly less ductile than structural steel in terms of ultimate fracture, the elastic ranges of these polymer materials are considerably greater, and thus local elastic failure modes are much more likely to occur in these materials, in contrast to steel specimens where associated plasticity is encountered in practice. The elastic nature of these failure modes thus lends well to the use of critical buckling formulae derived from elastic theory.
As indicated in Figure 11b, in the case of an elliptical tube in pure compression, the point of initiation of buckling is at the extreme of the minimum diameter where the equivalent diameter Deq = 2(a2/b) [44,45]. Adapting the equivalent expression for a circular section, the critical buckling stress σcr for an elliptical tube in compression is given by:
σ c r = E c 3 ( 1 ν 2 ) 2 t D e q
For slender elliptical tubes, i.e., those that are susceptible to local failure of their tube walls ahead of yielding the full cross-section or global member buckling, the compressive resistance of the member is largely a function of its slenderness. In the present study, the local slenderness parameter λ ¯ l is defined as:
λ ¯ l = σ c σ c r
where σc is the reference compressive strength of the material. When designing structural steel elliptical tubes, sections can be considered fully effective in compression, i.e., non-slender, if the following criterion is satisfied [46]:
D e q t ε 2 90
where the strength modification factor ε is adapted for use with materials other than carbon steel as follows [47]:
ε = 235 σ c E c 210000
As shown by the values of Deq/2 in Table 8, the relative slenderness of the specimens examined in the present study far exceeds the limit of Equation (4), indicating that these are highly slender sections.
When considering the value of compressive strength to adopt in the design method, the results from Section 2.2 suggest that although the strength can, overall, be considered isotropic, there is noticeable orthotropy observed in the results for compressive strength within PLA batch 1. Thus, failure of the tube wall material is based on a Tsai-Hill criterion [48] that accounts for anisotropic strength.
It is assumed the walls of the elliptical tube are in a biaxial plane stress state imposed by the applied longitudinal axial compressive stress σlong and circumferential stresses arising from the associated Poisson’s effect. Given the relative thickness of the tube walls compared to the outer diameters, it is assumed that a thin-walled condition prevails and that radial stresses are negligible. Since the compressive testing discussed in Section 2.2 indicates that the elastic moduli of the printed materials are isotropic, these circumferential stresses can be assumed equal to −νσlong directly. Considering then the interaction of Poisson’s effects between adjacent elements around a closed section, these stresses can be taken as reduced to σlong/(1 + ν2) and −νσlong/(1 + ν2), respectively. Note that these expressions do not account for the change in curvature around the elliptical wall, which in reality creates a varying stress distribution around the circumference.
In the absence of experimental results required to define a generalized Hill’s exponent, quadratic approximations for the off-diagonal elements of the fourth-rank strength tensor are assumed [48]. Thus, the failure criterion can be expressed as:
( 1 + υ ) σ l o n g 2 1 + υ 2 2 σ Z 2 + υ 2 σ l o n g 2 1 + υ 2 σ X 2 = 1
where the orthotropic compressive strengths σX and σZ relate to the printing orientations in Figure 7, which are commensurate with the circumferential and longitudinal printing direction of the elliptical tubes, respectively. Using the results from Table 5, equivalent limiting values of σlong can be found through the manipulation of Equation (6). These limiting values are taken as the effective compressive strength σc,eff of the elliptical tubes in the present study and are shown in Table 9.
The values of Deq, Deq/2, σcr and λ ¯ l calculated from Equations (2)–(5) using these properties and the measured geometry of the specimens are shown in Table 8. It is notable that previous testing of slender steel elliptical tubes in compression [44,45] examined sections with a maximum value of λ ¯ l = 0.42, while the maximum slenderness observed amongst the 3D-printed specimens in the present study is 2.42 (EHS21-ABS-105-35-1.0); this represents a considerable extension of the experimentally validated range of the design method proposed by [22]

4.2. Design Method for Slender Elliptical Tubes in Compression

The compressive load resistance NR of a slender section can be expressed in terms of a reduced effective cross-sectional area Aeff such that:
N R = A e f f σ c
The design method proposed by [22] is not reproduced in full here but suffice to say it is a function of slenderness, aspect ratio and tube wall imperfections, and is used to determine a resistance reduction factor ρ where Aeff = ρA. Based on the variations in wall thickness shown in Table 7, the magnitude of ∆w is assumed to be 0.05t for all specimens when applying the design method.
In Figure 17, the design reduction factor ρd is compared with the experimental values ρexp = Nu,exp/c for all elliptical tube specimens, with the reduction factors also shown in Table 8. It can be seen that the elastic buckling curve ρ = λ l ¯ 2 provides a general upper bound to the experimental results, indicating that the material properties used to scale the design parameters are appropriate. The value of ρexp for ABS specimen EHS21 falls noticeably below the design curve, which can be attributed to the influence of imperfections during manufacturing. Such high levels of imperfection are particularly deleterious to the load resistance of an elliptical section as slender as EHS21, given that imperfection sensitivity increases with slenderness [22,23].
In Figure 18, values of Nu,exp/NR are plotted for all specimens in order to assess the safety and accuracy of the design method. For the PLA specimens, it can be seen that the design method provides safe-sided results without being overly conservative, with accuracy increasing with slenderness. It is noted that the level of accuracy is relatively similar for all aspect ratios. For the ABS specimens, the design predictions are reasonably accurate and safe-sided. As shown in the case of EHS21, reductions in strength due to imperfections can lead to design predictions being overestimated and thus it is imperative that manufacturers pay heed to quality control during fabrication. Overall, the results confirm that, with appropriate rescaling of parameters, the design method proposed by [22] is suitable for use with slender 3D-printed PLA and ABS elliptical tube members in compression. It is envisaged that exercises conducted using design rules for other slender steel cross-sectional geometries could find similar use for a variety of potential 3D-printed profiles.

5. Conclusions

Testing has been conducted on specimens fabricated from polylactic acid and acrylonitrile butadiene styrene thermoplastic polymers using the fused filament fabrication additive manufacturing technique. Tensile and compressive material testing specimens have been printed in one of three orthogonal layering orientations and tested in order to determine orthotropic material properties. It has been found that the elastic moduli of the PLA and ABS specimens can be considered isotropic in both tension and compression. Noticeable anisotropy is observed in the results for tensile strength, with the materials exhibiting their weakest response in tension when the loading direction is across successive layers (printing orientation Z). Conversely, this loading mode is in fact the strongest in compression. Overall, the PLA material is stronger and stiffer than the ABS material, although the ABS material is noticeably more ductile. The results of the present study confirm that 3D-printed PLA can achieve compressive strengths in excess of 70 N/mm2, while 3D-printed ABS can achieve compressive strengths in excess of 35 N/mm2.
A series of 24 elliptical hollow section specimens have been printed in PLA and ABS. The specimens have been tested in compression whereupon it is seen that the brittle failure mode of the PLA specimens initiates at the point of minimum curvature in the elliptical cross-section; this effect is more readily observable in the more ductile ABS specimens. Comparison has been made between the experimental results and an existing method for the design of slender steel elliptical hollow sections. The study has provided experimental validation of the design rule in the high slenderness range, which was previously only conducted via numerical simulations. This has been made possible by the increased elastic range of PLA and ABS when compared to metallic materials. Moreover, it is shown that the design method generally provides safe-sided results for PLA and ABS elliptical tubes upon appropriate rescaling of the design parameters, thus demonstrating the suitability of applying design methods originally calibrated for slender steel cross-sections to 3D-printed polymer profiles.

Author Contributions

Conceptualization, F.M.; methodology, all authors; software, F.R.; validation, F.M.; formal analysis, F.M.; investigation, F.M. and S.D.S.; resources, F.M. and F.R.; data curation, F.M. and S.D.S.; writing—original draft preparation, F.M.; visualization, F.M. and F.R.; supervision, F.M. and F.R.; project administration, F.R.; funding acquisition, F.M. and F.R. All authors have read and agreed to the published version of the manuscript.

Funding

This work has been supported by the UK Manufacturing Symbiosis Network Plus (UKMSN+) which is funded by the UK Engineering and Physical Sciences Research Council (EPSRC), grant EP/S036091/1. Additional financial support was provided by the Digital Architecture and Robotics Laboratory and the Division of Civil and Building Services Engineering within the School of the Built Environment and Architecture at London South Bank University. The APC has been supported by Loughborough University.

Data Availability Statement

The raw data supporting the conclusions of this article will be made available by the authors on request.

Acknowledgments

The authors wish to extend their thanks in particular to Paul Elsdon of the Strengths of Materials laboratory at London South Bank University for conducting the experiments and to Botian (Chris) Ding of the Digital Architecture and Robotics Laboratory for his assistance in printing the test specimens. The authors are also grateful to students Hanoob John and Ryan Lafferty for their assistance in developing geometric models, printing the specimens, and preparing experiments.

Conflicts of Interest

The authors declare no conflicts of interest.

References

  1. Rodríguez-Panes, A.; Claver, J.; Camacho, A.M. The Influence of Manufacturing Parameters on the Mechanical Behaviour of PLA and ABS Pieces Manufactured by FDM: A Comparative Analysis. Materials 2018, 11, 1333. [Google Scholar] [CrossRef] [PubMed]
  2. Farah, S.; Anderson, D.; Langer, R. Physical and mechanical properties of PLA, and their functions in widespread applications—A comprehensive review. Adv. Drug Deliv. Rev. 2016, 107, 367–392. [Google Scholar] [CrossRef]
  3. Torre, R.; Brischetto, S.; Dipietro, I.R. Buckling developed in 3D printed PLA cuboidal samples under compression: Analytical, numerical and experimental investigations. Addit. Manuf. 2021, 38, 101790. [Google Scholar] [CrossRef]
  4. Roy, R.; Mukhopadhyay, A. Tribological studies of 3D printed ABS and PLA plastic parts. Mater. Today Proc. 2021, 41, 856–862. [Google Scholar] [CrossRef]
  5. Hsueh, M.H.; Lai, C.J.; Wang, S.H.; Zeng, Y.S.; Hsieh, C.H.; Pan, C.Y.; Huang, W.C. Effect of printing parameters on the thermal and mechanical properties of 3D-Printed PLA and PETG using Fused Deposition Modeling. Polymers 2021, 3, 1758. [Google Scholar] [CrossRef] [PubMed]
  6. UM180821 TDS PLA RB V11 Technical Data Sheet PLA; Ultimaker: Zaltbommel, The Netherlands, 2018.
  7. Technical Data Sheet—ABSX; MCPP: Amsterdam, The Netherlands, 2018.
  8. Almkvist, G.; Berndt, B. Gauss, Landen, Ramanujan, the Arithmetic-geometric Mean, Ellipses, π, and the Ladies Diary. Amer. Math. Mon. 1988, 95, 585–608. [Google Scholar]
  9. Zhou, C.; Hu, Y.; Zhang, L.; Fang, J.; Xi, Y.; Hu, J.; Li, Y.; Liu, L.; Zhao, Y.; Yang, L.; et al. Investigation of heat transfer characteristics of deflected elliptical-tube heat exchanger in closed-circuit cooling towers. Appl. Therm. Eng. 2024, 236, 121860. [Google Scholar] [CrossRef]
  10. Khuda, M.A.; Sarunac, N. A comparative study of latent heat thermal energy storage (LTES) system using cylindrical and elliptical tubes in a staggered tube arrangement. J. Energy Storage 2024, 87, 111333. [Google Scholar] [CrossRef]
  11. Boiko, A.V.; Demyanko, K.V. On numerical stability analysis of fluid flows in compliant pipes of elliptic cross-section. J. Fluids Struct. 2022, 108, 103414. [Google Scholar] [CrossRef]
  12. Shi, X.; Alam, M.M.; Zhu, H.; Ji, C.; Bai, H.; Sharifpur, M. Flow three-dimensionality of wavy elliptic cylinder: Vortex shedding bifurcation. Ocean. Eng. 2024, 301, 117527. [Google Scholar] [CrossRef]
  13. Ruiz-Teran, A.M.; Gardner, L. Elastic buckling of elliptical tubes. Thin-Walled Struct. 2008, 46, 1304–1318. [Google Scholar] [CrossRef]
  14. Kempner, J.; Chen, Y.N. Large deflections of an axially compressed oval cylindrical shell. In Proceedings of the 11th International Congress of Applied Mechanics, Munich, Germany, 30 August–5 September 1964. [Google Scholar]
  15. Feinstein, G.; Erickson, B.; Kempner, J. Stability of oval cylindrical shells. Exp. Mech. 1971, 11, 514–520. [Google Scholar] [CrossRef]
  16. Silvestre, N.; Gardner, L. Elastic local postbuckling of elliptical tubes. J. Const. Steel Res. 2011, 67, 281–292. [Google Scholar] [CrossRef]
  17. Insausti, A.; Gardner, L. Analytical modelling of plastic collapse in compressed elliptical hollow sections. J. Const. Steel Res. 2011, 67, 678–689. [Google Scholar] [CrossRef]
  18. Abela, J.M.; Gardner, L. Elastic buckling of elliptical tubes subjected to generalised linearly varying stress distributions. Thin-Walled Struct. 2012, 58, 40–50. [Google Scholar] [CrossRef]
  19. Yao, Y.; Quach, W.-M.; Young, B. Strength enhancement and stub-column behavior of cold-formed stainless steel elliptical hollow sections. Thin-Walled Struct. 2023, 189, 110939. [Google Scholar] [CrossRef]
  20. Ge, C.; Gao, Q.; Wang, L.; Hong, Z. Theoretical prediction and numerical analysis for axial crushing behaviour of elliptical aluminium foam-filled tube. Thin-Walled Struct. 2020, 149, 106523. [Google Scholar] [CrossRef]
  21. Al-saadi, A.U.; Thiru Aravinthan, T.; Lokuge, W. Structural applications of fibre reinforced polymer (FRP)composite tubes: A review of columns members. Compos. Struct. 2018, 204, 513–524. [Google Scholar] [CrossRef]
  22. McCann, F.; Fang, C.; Gardner, L.; Silvestre, N. Local buckling and ultimate strength of slender elliptical hollow sections in compression. Eng. Struct. 2016, 111, 104–118. [Google Scholar] [CrossRef]
  23. McCann, F.; Gardner, L. Numerical analysis and design of slender elliptical hollow sections in bending. Thin-Walled Struct. 2019, 139, 196–208. [Google Scholar] [CrossRef]
  24. Vukasovic, T.; Vivanco, J.F.; Celentano, D.; García-Herrera, C. Characterization of the mechanical response of thermoplastic parts fabricated with 3D printing. Int. J. Adv. Manuf. Technol. 2019, 104, 4207–4218. [Google Scholar] [CrossRef]
  25. Dundar, M.A.; Dhaliwal, G.S.; Ayorinde, E.; Al-Zubi, M. Tensile, compression, and flexural characteristics of acrylonitrile–butadiene–styrene at low strain rates: Experimental and numerical investigation. Polym. Polym. Compos. 2021, 29, 331–342. [Google Scholar] [CrossRef]
  26. Ansari, A.A.; Kamil, M. Effect of print speed and extrusion temperature on properties of 3D printed PLA used fused deposition modeling process. Mater. Today Proc. 2021, 45, 5462–5468. [Google Scholar] [CrossRef]
  27. Ayatollahi, M.R.; Nabavi-Kivi, A.; Bahrami, B.; Yahya, M.Y.; Khosravani, M.R. The influence of in-plane raster angle on tensile and fracture strengths of 3D-printed PLA specimens. Eng. Fract. Mech. 2020, 237, 107225. [Google Scholar] [CrossRef]
  28. Kiendl, J.; Gao, C. Controlling toughness and strength of FDM 3D-printed PLA components through the raster layup. Compos. Part B Eng. 2020, 180, 107562. [Google Scholar] [CrossRef]
  29. Guan, Y.; Virgin, L.N.; Helm, D. Structural behavior of shallow geodesic lattice domes. Int. J. Solids Struct. 2018, 155, 225–239. [Google Scholar] [CrossRef]
  30. Virgin, L.N.; Guan, Y.; Plaut, R.H. On the geometric conditions for multiple stable equilibria in clamped arches. Int. J. Non-Linear Mech. 2017, 92, 8–14. [Google Scholar] [CrossRef]
  31. Nomani, J.; Wilson, D.; Paulino, M.; Mohammed, M.I. Effect of layer thickness and cross-section geometry on the tensile and compression properties of 3D printed ABS. Mater. Today Commun. 2020, 22, 100626. [Google Scholar] [CrossRef]
  32. Grant, A.; Regez, B.; Kocak, S.; Huber, J.D.; Mooers, A. Anisotropic properties of 3-D printed Poly Lactic Acid (PLA) and Acrylonitrile Butadiene Styrene (ABS) plastics. Results Mater. 2021, 12, 100227. [Google Scholar] [CrossRef]
  33. EN ISO 527-2; Plastics—Determination of Tensile Properties—Part 2: Test Conditions for Moulding and Extrusion Plastics. CEN: Meyrin, Switzerland, 1996.
  34. Prusa. PrusaSlicer 2.4.0 Manual. 2021. Available online: https://help.prusa3d.com/en/article/general-info_1910 (accessed on 13 December 2021).
  35. EN ISO 527-1; Plastics—Determination of Tensile Properties—Part 1: General Principles. CEN: Meyrin, Switzerland, 1993.
  36. ASTM D695; Standard Test Method for Compressive Properties of Rigid Plastics. ASTM: West Conshohocken, PA, USA, 2016.
  37. Ashby, M.F. The mechanical properties of cellular solids. Metall. Trans. A 1983, 14, 1755–1769. [Google Scholar] [CrossRef]
  38. Ramberg, W.; Osgood, W.R. Description of Stress–Strain Curves by Three Parameters. Technical Note No. 902; National Advisory Committee for Aeronautics: Washington, DC, USA, 1943. [Google Scholar]
  39. Ferreira, R.T.L.; Cardoso Amatte, I.; Dutra, T.A.; Bürger, D. Experimental characterization and micrography of 3D printed PLA and PLA reinforced with short carbon fibers. Compos. Part B Eng. 2017, 124, 88–100. [Google Scholar] [CrossRef]
  40. Zou, R.; Xia, Y.; Liu, S.; Hu, P.; Hou, W.; Hu, Q.; Shan, C. Isotropic and anisotropic elasticity and yielding of 3D printed material. Compos. Part B Eng. 2016, 99, 506–513. [Google Scholar] [CrossRef]
  41. McCann, F.; Rossi, F. Investigating local buckling in highly slender elliptical hollow sections through analysis of 3D-printed analogues. In Proceedings of the 8th International Conference on Coupled Instabilities in Metal Structures, Łodz, Poland, 12–14 July 2021. [Google Scholar]
  42. Ree, T.; Eyring, H. Theory of Non-Newtonian Flow. I. Solid Plastic System. J. Appl. Phys. 1955, 26, 793–800. [Google Scholar]
  43. Verbeeten, W.M.H.; Lorenzo-Bañuelos, M.; Arribas-Subiñas, P.J. Anisotropic rate-dependent mechanical behavior of Poly (Lactic Acid) processed by Material Extrusion Additive Manufacturing. Addit. Manuf. 2020, 31, 100968. [Google Scholar] [CrossRef]
  44. Gardner, L.; Chan, T.M. Cross-section classification of elliptical hollow sections. Steel Comp. Struct. 2007, 7, 185–200. [Google Scholar] [CrossRef]
  45. Chan, T.M.; Gardner, L. Compressive resistance of hot-rolled elliptical hollow sections. Eng. Struct. 2008, 30, 522–532. [Google Scholar] [CrossRef]
  46. EN 1993-1-1; Eurocode 3: Design of Steel Structure—Part 1–1: General Rules for Buildings. British Standards Institute. CEN: Meyrin, Switzerland, 2024.
  47. EN 1993-1-4; Eurocode 3: Design of Steel Structures—Part 1–4: General Rules—Supplementary Rules for Stainless Steels. British Standards Institute. CEN: Meyrin, Switzerland, 2006.
  48. Tsai, S.W.; Wu, E.M. A general theory of strength for anisotropic materials. In Technical Report AFML-TR-71-12, August 1972; Air Force Materials Laboratory: Dayton, OH, USA, 1972. [Google Scholar]
Figure 1. Cross-sectional geometry of EHS showing dimensions and axes.
Applsci 14 07673 g001
Figure 2. (a) Nominal dimensions of tensile specimens in accordance with EN ISO 527-2 [33]; (b) printing orientations of tensile specimens.
Applsci 14 07673 g002
Figure 3. Tensile specimen positioned in Tinius Olsen HK25 universal testing machine.
Applsci 14 07673 g003
Figure 4. Stress–strain curves obtained from tensile testing of (a) PLA; (b) ABS.
Applsci 14 07673 g004aApplsci 14 07673 g004b
Figure 5. Average values of tensile elastic modulus and ultimate tensile strength from testing.
Applsci 14 07673 g005
Figure 6. Average values of strain at ultimate tensile strength and failure strain from testing.
Applsci 14 07673 g006
Figure 7. Nominal dimensions and printing layering orientations of compression test specimens.
Applsci 14 07673 g007
Figure 8. Stress–strain curves from compressive testing of batches: (a) PLA1; (b) PLA2; (c) ABS.
Applsci 14 07673 g008aApplsci 14 07673 g008b
Figure 9. Average values of compressive elastic modulus and 1% proof strength in compression for all materials and orientations.
Applsci 14 07673 g009
Figure 10. Average values of strain at compressive strength against compressive elastic modulus for all materials and orientations.
Applsci 14 07673 g010
Figure 11. (a) Specimen EHS01 positioned for testing in Zwick/Roell 100 kN universal testing machine; (b) locations of strain gauges A–D, with point of initiation of buckling noted.
Applsci 14 07673 g011
Figure 12. Load–end shortening graphs for PLA EHS specimens in compression; (a) all specimens, (b) a/b = 1.5, (c) a/b = 2.0, (d) a/b = 3.0. Light colours: PLA batch 1; dark colours: PLA batch 2.
Applsci 14 07673 g012
Figure 13. Load–end shortening graphs for ABS EHS specimens in compression.
Applsci 14 07673 g013
Figure 14. PLA specimens post-failure with typical brittle circumferential fractures visible; (a) EHS03 (a/b = 1.5); (b) EHS01 (a/b = 2.0); (c) EHS07 (a/b = 3.0).
Applsci 14 07673 g014
Figure 15. Loading history of ABS specimen EHS23 with the evolution of local buckling visible.
Applsci 14 07673 g015
Figure 16. Longitudinal strains measured at the mid-height cross-section, with location of strain gauges indicated, for specimens (a) EHS10-PLA2-90-60-1.5, (b) EHS01-PLA1-100-50-3.0, (c) EHS16-PLA2-105-35-2.5.
Applsci 14 07673 g016
Figure 17. Comparison of experimental results and design curve [22] for resistance reduction factor ρ for all EHS specimens.
Applsci 14 07673 g017
Figure 18. Ratios of experimental ultimate load to design load resistances for all EHS specimens.
Applsci 14 07673 g018
Table 1. Material properties of PLA and ABS materials examined in the present study compared to other materials.
MaterialStrength
(N/mm2)
Elastic Modulus
(N/mm2)
Density
(kg/m3)
Normalised Strength-to-Weight Ratio
(km)
Ultimaker PLA [6]50235012484.08
MCPP ABSX [7]39198010303.86
S275 steel275210,00078503.57
S355 steel355210,00078504.61
C40 concrete4032,10024001.70
C24 timber2410,8005504.45
Table 2. Geometric and mechanical properties determined from tensile testing.
Specimenbt,1bt,2COV(bt,1)COV(bt,2)Etσu,tεu,tεf,t
(mm)(mm)(%)(%)(N/mm2)(N/mm2)(%)(%)
PLA
  T01-PLA-X-19.924.200.946.03277440.71.481.48
  T02-PLA-X-29.954.200.596.23279551.51.881.88
  T03-PLA-X-39.914.181.075.53283453.12.102.13
  T04-PLA-Y-110.913.9811.111.30308953.41.931.93
  T05-PLA-Y-210.873.9810.621.17321350.61.761.76
  T06-PLA-Y-310.903.9811.031.16323153.91.901.91
  T07-PLA-Z-110.354.354.3310.84306937.61.331.33
  T08-PLA-Z-210.384.404.6212.15310646.21.871.87
  T09-PLA-Z-310.334.364.0811.03296844.91.761.76
ABS
  T10-ABS-X-110.134.191.695.96169231.12.382.90
  T11-ABS-X-29.854.161.884.85177232.12.322.49
  T12-ABS-X-39.864.171.765.23177031.92.332.66
  T13-ABS-Y-110.543.966.571.25173934.02.382.40
  T14-ABS-Y-210.533.986.490.79173733.62.342.35
  T15-ABS-Y-310.594.017.270.43173433.02.302.32
  T16-ABS-Z-110.094.081.422.88186615.40.920.92
  T17-ABS-Z-210.094.071.222.59159917.41.131.16
  T18-ABS-Z-39.934.161.214.86168418.01.171.17
Table 3. Average mechanical properties obtained from tensile testing.
Material OrientationCOV(bt,1)COV(bt,2)EtCOV(Et)σu,tCOV(σt)εu,tεf,t
(%)(%)(N/mm2)(%)(N/mm2)(%)(%)(%)
PLA
 X orientation0.775.1428010.9848.413.91.821.83
 Y orientation9.461.0531782.4352.63.381.871.87
 Z orientation3.779.8330482.3442.910.811.651.65
ABS
 X orientation1.544.6517452.6131.71.672.342.68
 Y orientation5.880.7717370.1433.51.502.342.36
 Z orientation1.123.1117167.9517.08.041.071.08
Table 4. Geometric and mechanical properties determined from compressive testing.
Specimenbc,1bc,2COV(bc,1)COV(bc,2)Ecσp1%,cσu,cεu,c
(mm)(mm)(%)(%)(N/mm2)(N/mm2)(N/mm2)(%)
PLA batch 1
  C01-PLA1-X-112.8412.561.321.32251658.358.43.53
  C02-PLA1-X-212.8512.641.450.63267562.062.13.76
  C03-PLA1-X-312.8412.581.321.19278262.963.63.25
  C04-PLA1-X-412.9312.602.460.93245459.059.03.39
  C05-PLA1-Z-113.0112.982.712.99240172.073.73.57
  C06-PLA1-Z-212.7612.780.940.68269975.175.13.57
  C07-PLA1-Z-312.7212.730.330.30298776.476.93.37
PLA batch 2
  C08-PLA2-X-112.5112.721.800.24271572.572.93.61
  C09-PLA2-X-212.5012.751.900.53249073.373.73.87
  C10-PLA2-X-312.4812.742.160.45274772.573.33.68
  C11-PLA2-Z-112.5312.851.641.42313576.577.73.55
  C12-PLA2-Z-212.5212.791.740.91310876.177.43.59
  C13-PLA2-Z-312.5612.841.391.42296873.874.33.42
ABS
  C14-ABS-X-112.9212.572.131.26130138.5-4.01
  C15-ABS-X-212.8912.702.040.06117437.5-4.23
  C16-ABS-X-312.7412.480.532.18142039.6-3.83
  C17-ABS-X-412.9412.672.540.29106040.1-4.90
  C18-ABS-Z-112.6112.680.920.73141140.740.83.80
  C19-ABS-Z-212.6212.690.800.25149241.141.13.77
  C20-ABS-Z-312.6212.590.871.12156041.241.23.61
  C21-ABS-Z-412.5912.681.120.41155941.541.53.62
Table 5. Average orthotropic mechanical properties obtained from compression tests.
SpecimenCOV(bc,1)COV(bc,2)EcCOV(Ec)σp1%,cCOV(σtp1%c)σu,cεu,c
(%)(%)(N/mm2)(%)(N/mm2)(%)(N/mm2)(%)
PLA batch 1
 X orientation 1.450.9026075.7360.63.7060.83.48
 Z orientation1.441.54269610.8774.53.0375.23.51
PLA batch 2
 X orientation 1.700.3726515.2872.80.6373.33.72
 Z orientation0.821.1230702.9275.51.9376.53.52
ABS
 X orientation 1.681.08123912.5838.92.98-4.25
 Z orientation0.800.6115064.6941.10.8041.13.70
Table 6. Average values of Poisson’s ratio obtained from compression testing.
Materialν
PLA
 X orientation 0.322
 Z orientation0.325
ABS
 X orientation 0.341
 Z orientation0.332
Table 7. Measured cross-sectional properties of EHS stub column specimens.
Specimen2a2ba/bWall Thickness tPmA
NominalAverageSt. DevCOV
(mm)(mm)(mm)(mm)(mm)(%)(mm)(mm2)
EHS01-PLA1-100-50-3.0100.1450.012.03.003.170.113.48233737
EHS02-PLA1-90-60-2.090.1760.091.52.002.070.083.96232478
EHS03-PLA1-90-60-2.090.0260.111.52.002.080.062.73232481
EHS04-PLA1-90-60-2.090.0660.081.52.002.040.094.35232473
EHS05-PLA1-100-50-3.0100.0450.052.03.003.100.123.93233721
EHS06-PLA1-100-50-1.5100.0650.082.01.501.450.075.02238344
EHS07-PLA1-105-35-2.0105.1335.073.02.002.020.104.73228459
EHS08-PLA1-105-35-1.5105.0835.013.01.501.390.1510.91230344
EHS09-PLA2-90-60-1.090.1559.711.51.001.130.032.65234235
EHS10-PLA2-90-60-1.590.0260.091.51.501.600.053.21233350
EHS11-PLA2-90-60-3.090.0360.011.53.003.030.051.63228686
EHS12-PLA2-100-50-1.0100.0850.032.01.001.130.054.07238239
EHS13-PLA2-100-50-2.0100.0650.012.02.002.260.073.16235472
EHS14-PLA2-100-50-2.5100.0350.042.02.502.730.062.19233586
EHS15-PLA2-105-35-1.0105.0535.033.01.001.260.043.45230231
EHS16-PLA2-105-35-2.5105.0735.013.02.502.720.051.94225566
EHS17-PLA2-105-35-3.0105.0235.013.03.003.200.072.03224675
EHS18-ABS-100-50-1.099.7050.652.01.001.210.053.71239239
EHS19-ABS-90-60-1.090.1659.981.51.501.160.075.67235235
EHS20-ABS-90-60-1.590.0760.141.51.001.790.052.87233464
EHS21-ABS-105-35-1.0105.4235.613.02.001.320.2015.42231231
EHS22-ABS-105-35-2.5105.2335.123.01.002.750.072.43226566
EHS23-ABS-100-50-1.099.6050.152.02.501.110.043.36238239
EHS24-ABS-100-50-2.099.8650.312.02.002.190.083.57236472
Table 8. Experimental results and design parameters for EHS in compression.
Specimena/bDeqDeq/2σcrσu,exp λ ¯ l ρexpρdNu,expNRdNu,exp/NRd
(mm) (N/mm2)(N/mm2) (kN)(kN)
EHS01-PLA1-100-50-3.02.0201141951.836.01.140.530.4426.5921.841.22
EHS02-PLA1-90-60-2.01.5135147050.037.31.160.550.4217.8813.751.30
EHS03-PLA1-90-60-2.01.5135145650.533.71.160.500.4316.2313.941.16
EHS04-PLA1-90-60-2.01.5135148349.534.01.170.500.4216.0813.501.19
EHS05-PLA1-100-50-3.02.0200144750.841.11.150.610.4329.6821.001.41
EHS06-PLA1-100-50-1.52.0200309623.725.41.690.380.238.765.341.64
EHS07-PLA1-105-35-2.03.0315350920.917.91.800.260.218.226.441.28
EHS08-PLA1-105-35-1.53.0315510014.412.92.170.190.154.103.331.23
EHS09-PLA2-90-60-1.01.5136244031.028.31.500.410.287.505.121.46
EHS10-PLA2-90-60-1.51.5135171044.242.31.260.610.3715.779.681.63
EHS11-PLA2-90-60-3.01.513590483.664.20.910.920.5944.3928.351.57
EHS12-PLA2-100-50-1.02.0200359721.018.11.820.260.204.873.811.28
EHS13-PLA2-100-50-2.02.0200179742.039.01.290.560.3620.7313.251.57
EHS14-PLA2-100-50-2.52.0200148450.949.11.170.710.4231.3418.691.68
EHS15-PLA2-105-35-1.03.0315507514.912.82.160.180.153.703.121.19
EHS16-PLA2-105-35-2.53.0315235232.128.11.470.400.2917.2312.231.41
EHS17-PLA2-105-35-3.03.0315199237.934.41.350.490.3324.7216.441.50
EHS18-ABS-100-50-1.02.019644139.445.282.000.140.171.531.890.80
EHS19-ABS-90-60-1.01.5136320213.0112.181.710.320.233.302.291.43
EHS20-ABS-90-60-1.51.5135205220.3117.131.360.450.327.155.061.39
EHS21-ABS-105-35-1.03.031264346.482.132.420.060.130.651.490.43
EHS22-ABS-105-35-2.53.0315312613.338.741.680.230.235.445.351.00
EHS23-ABS-100-50-1.02.019848468.606.792.100.180.161.801.611.11
EHS24-ABS-100-50-2.02.0198247516.8411.001.500.290.285.665.351.05
Table 9. Effective compressive strengths for EHS specimens.
Material Batchσc,eff
(N/mm2)
 PLA batch 167.7
 PLA batch 269.6
 ABS37.8
Disclaimer/Publisher’s Note: The statements, opinions and data contained in all publications are solely those of the individual author(s) and contributor(s) and not of MDPI and/or the editor(s). MDPI and/or the editor(s) disclaim responsibility for any injury to people or property resulting from any ideas, methods, instructions or products referred to in the content.

