
Cyclic Behavior of Long Concrete Interfaces Crossed by Steel Screws


Abstract
:1. Introduction
2. Literature Survey
3. The Experimental Campaign
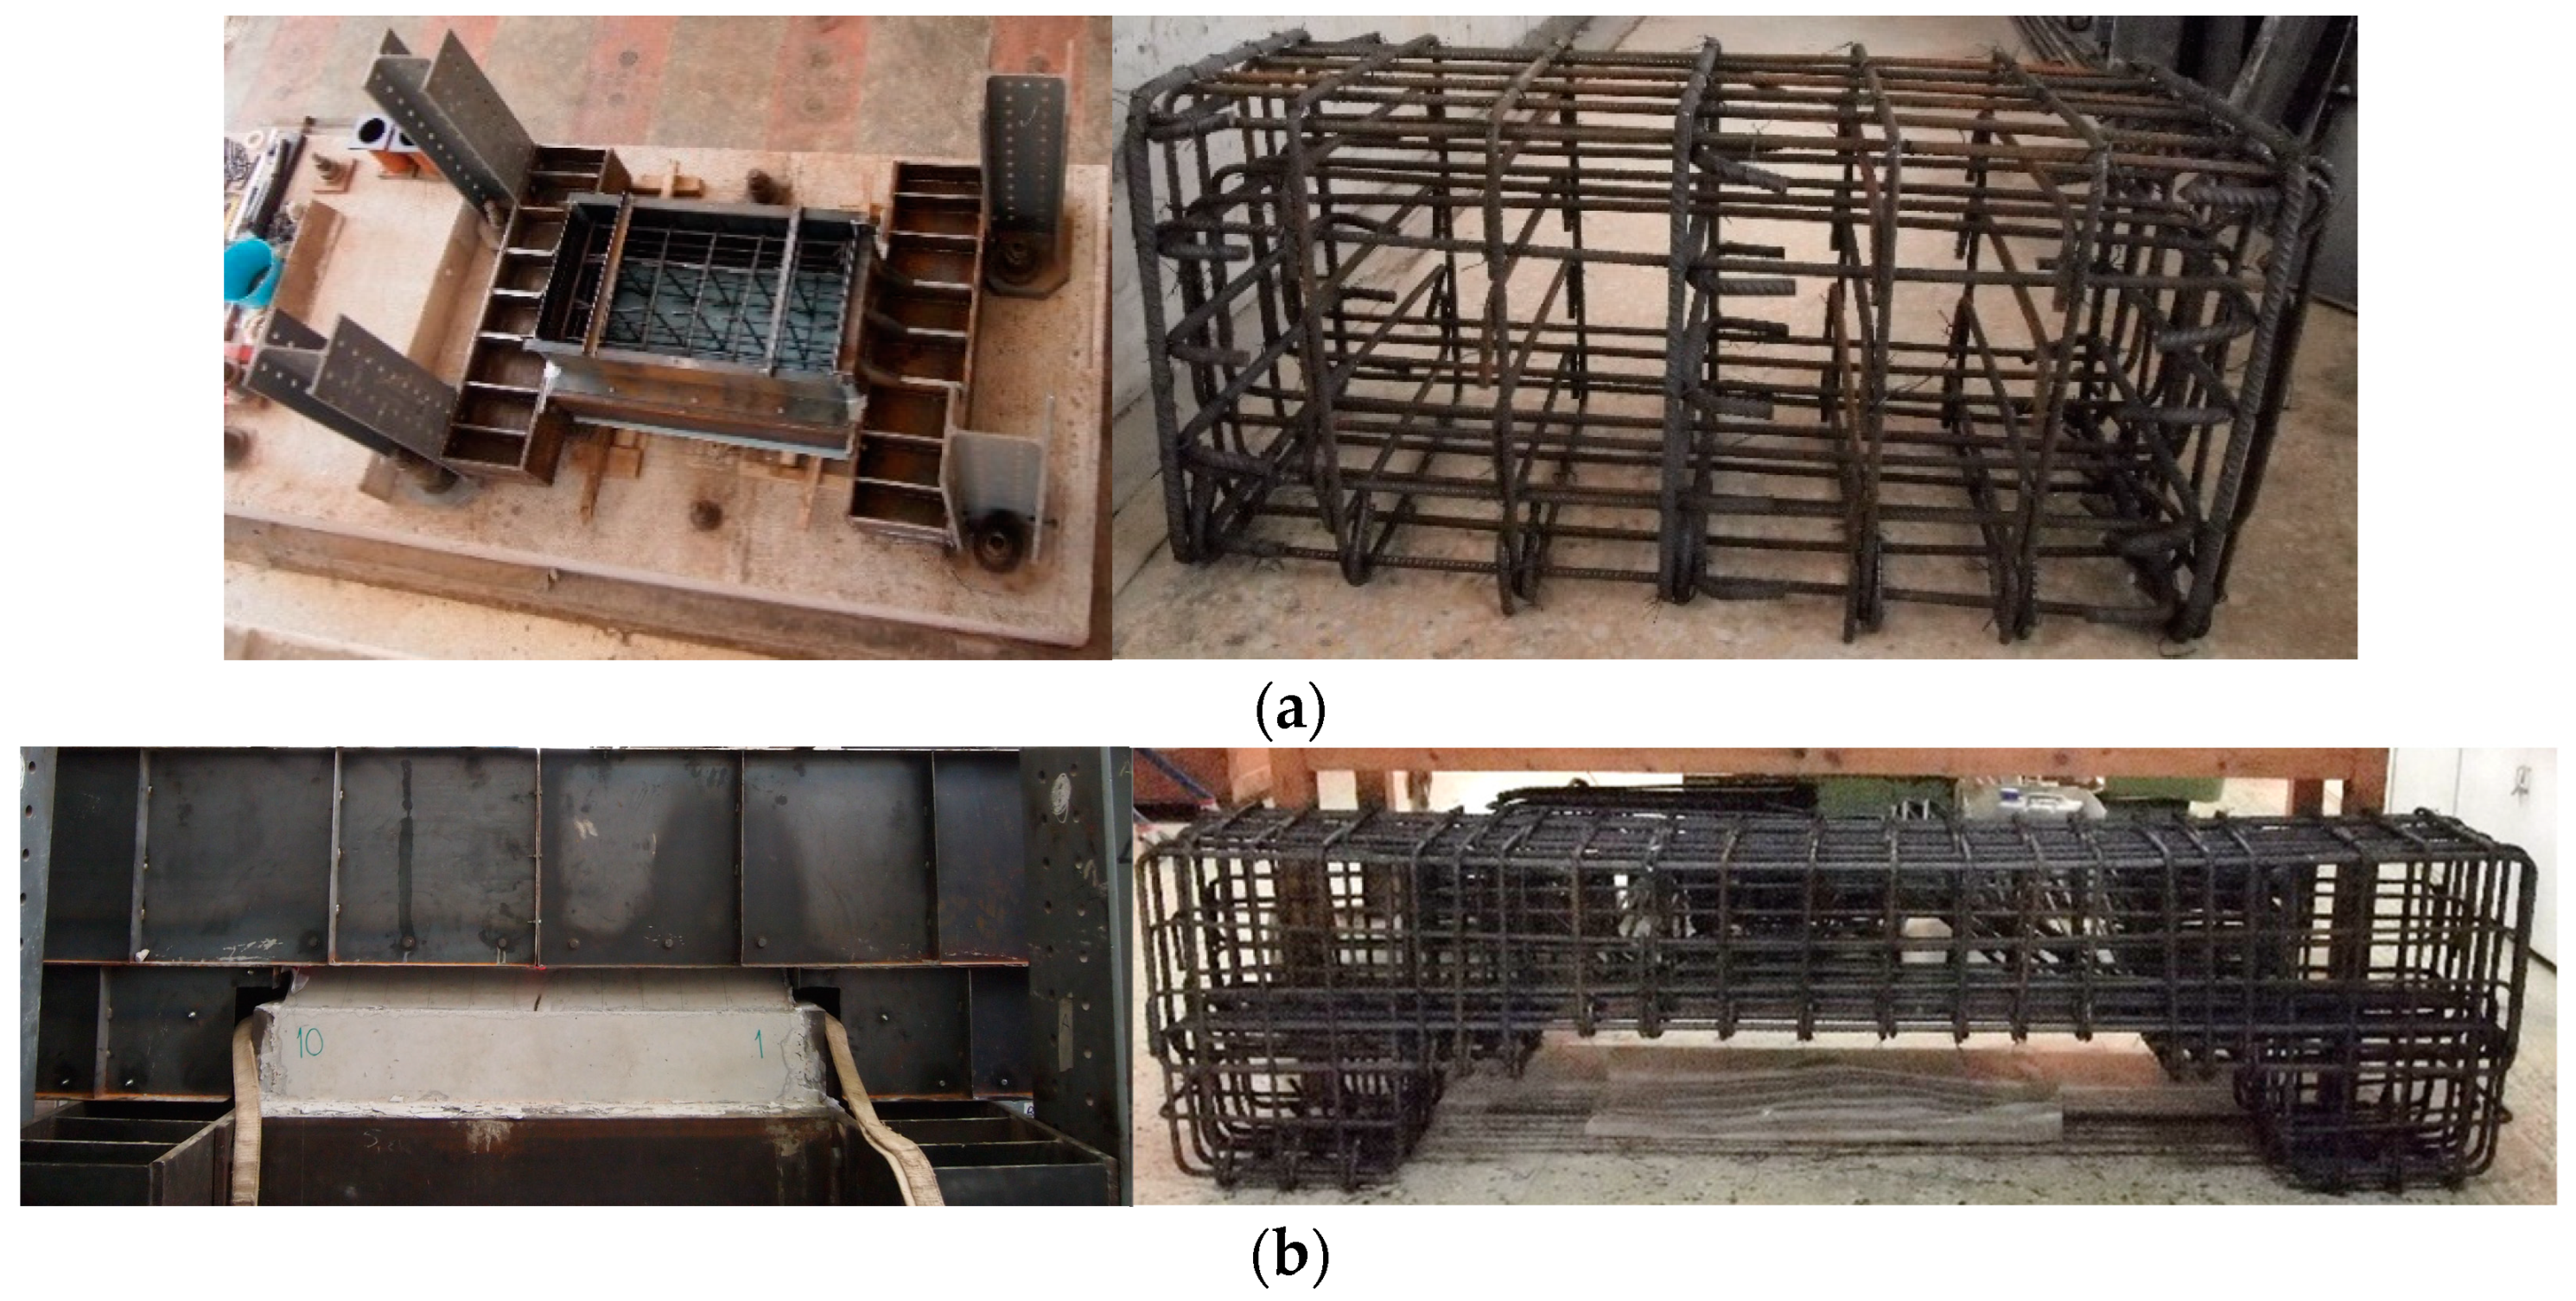
3.1. Geometry of Specimens
3.2. Post-Installed Interface Reinforcement, Roughness, and Concrete Strength
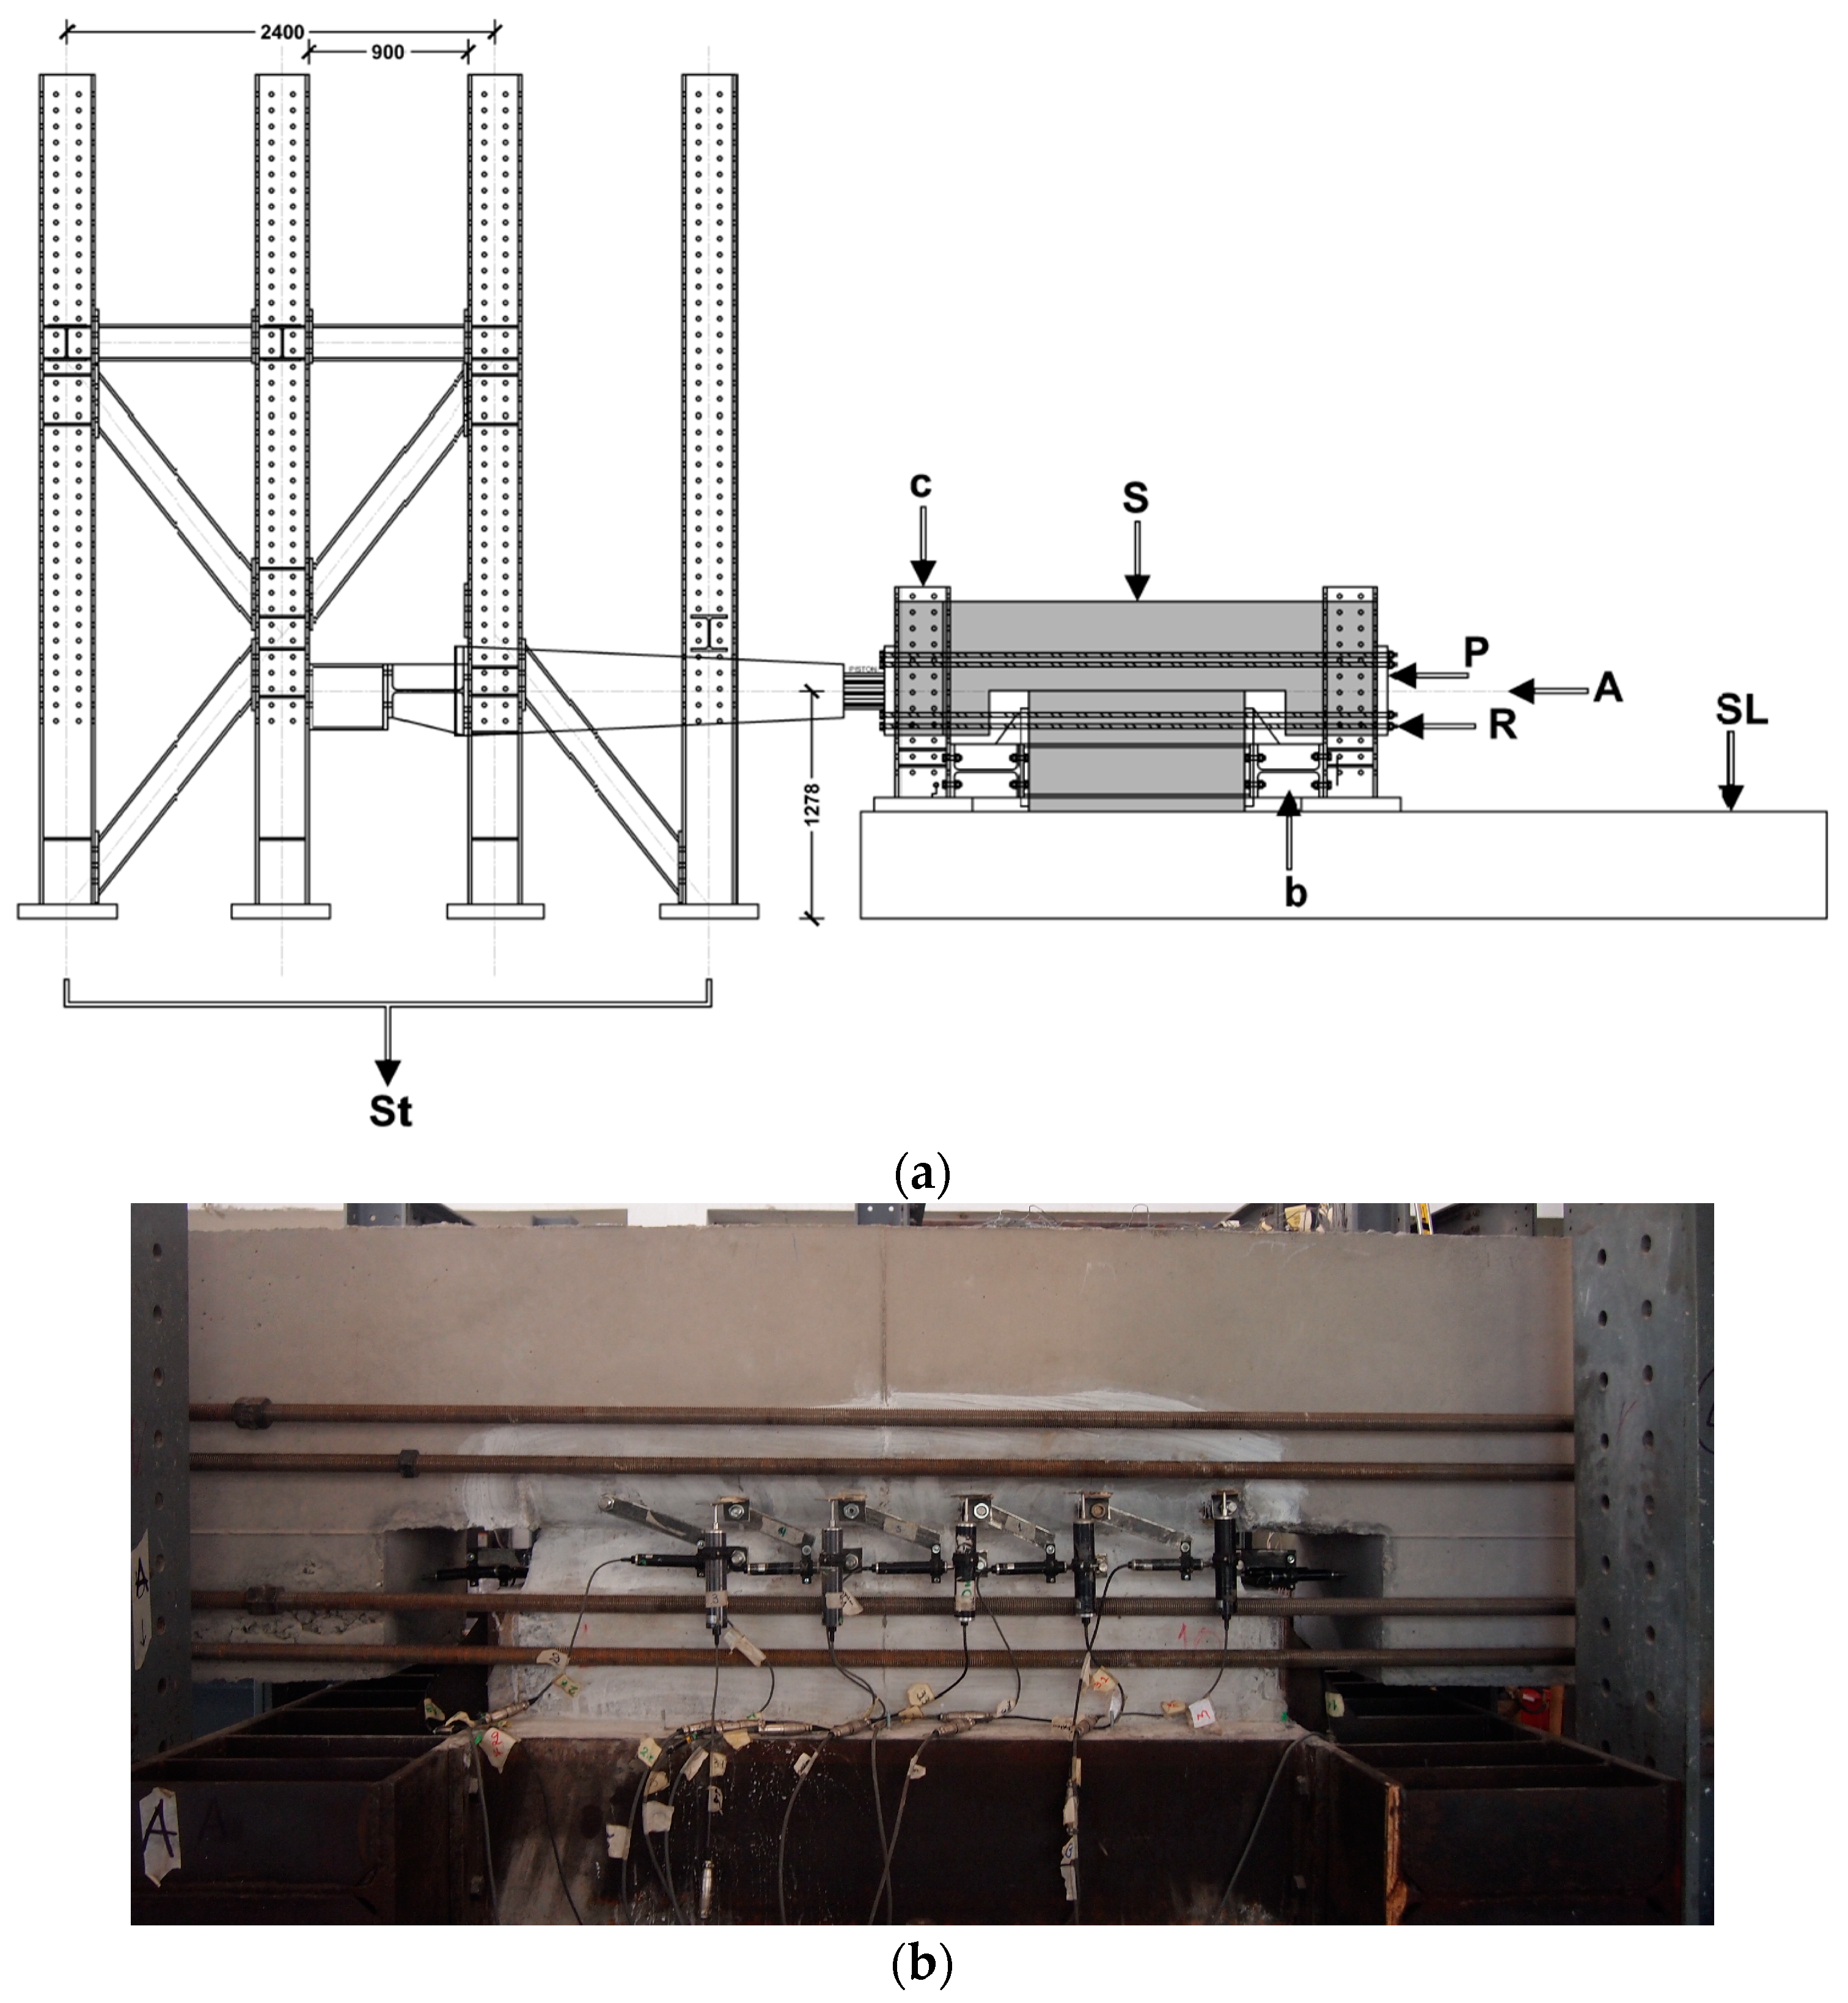
4. Test Setup, Instrumentation, and Loading History
4.1. Test Setup
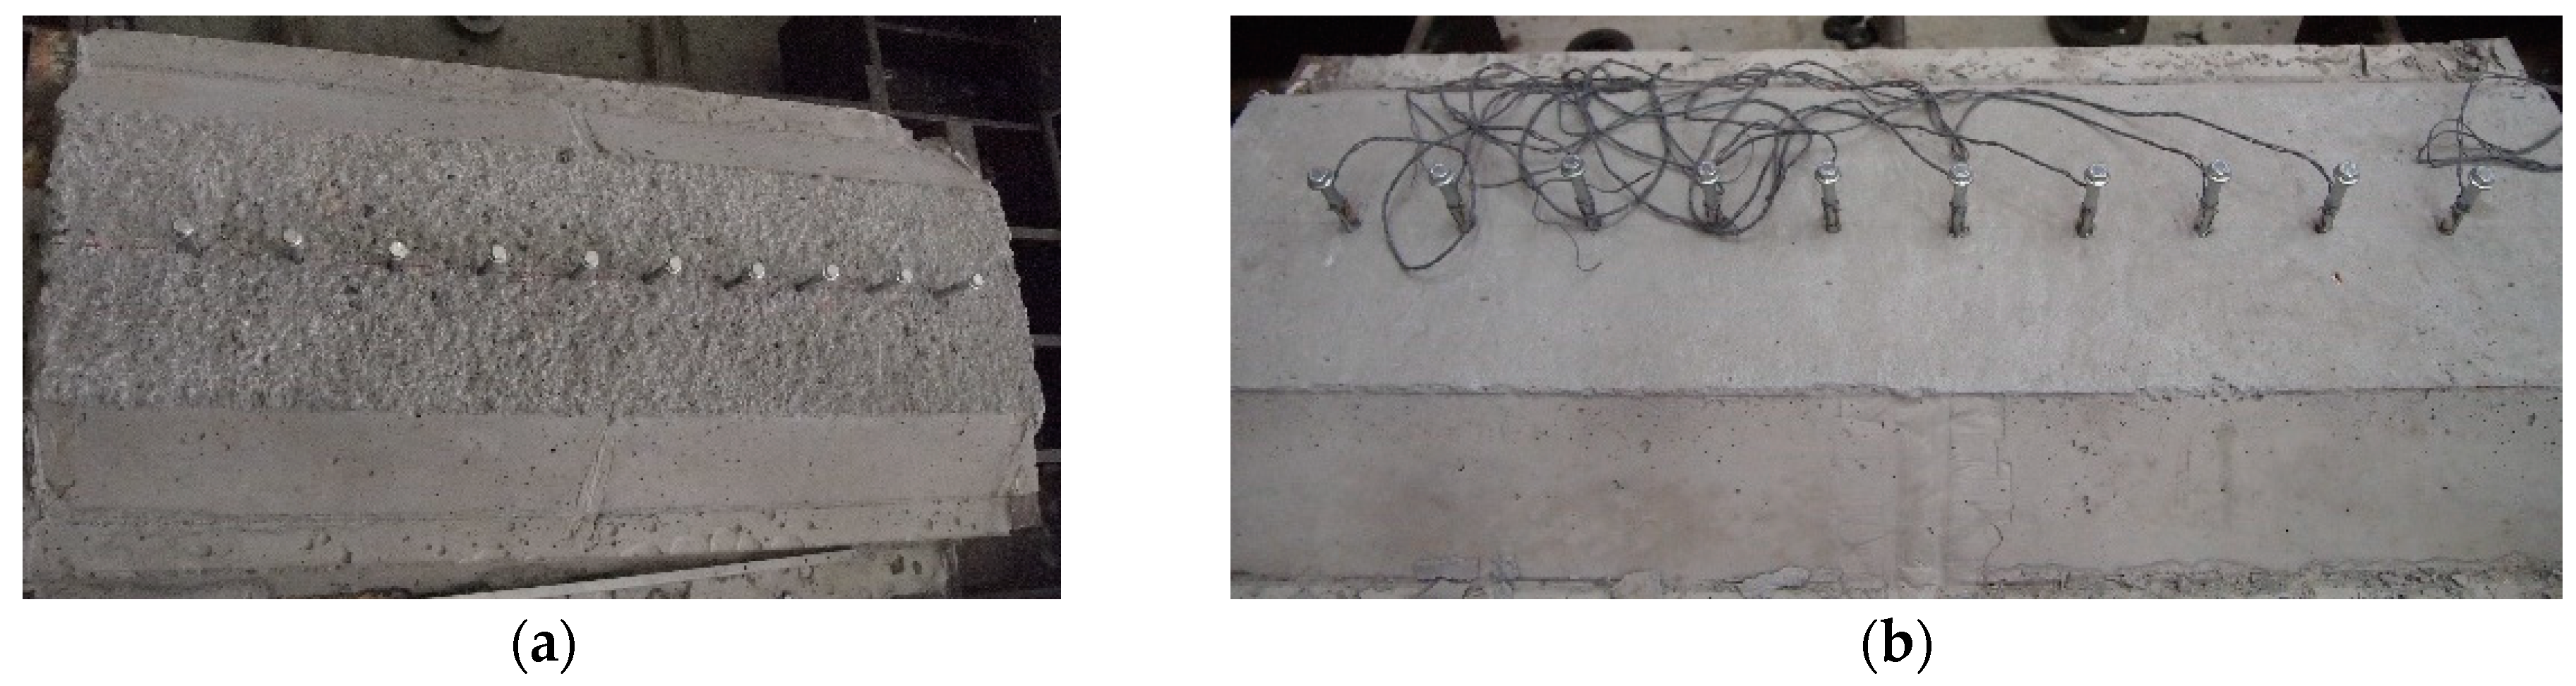
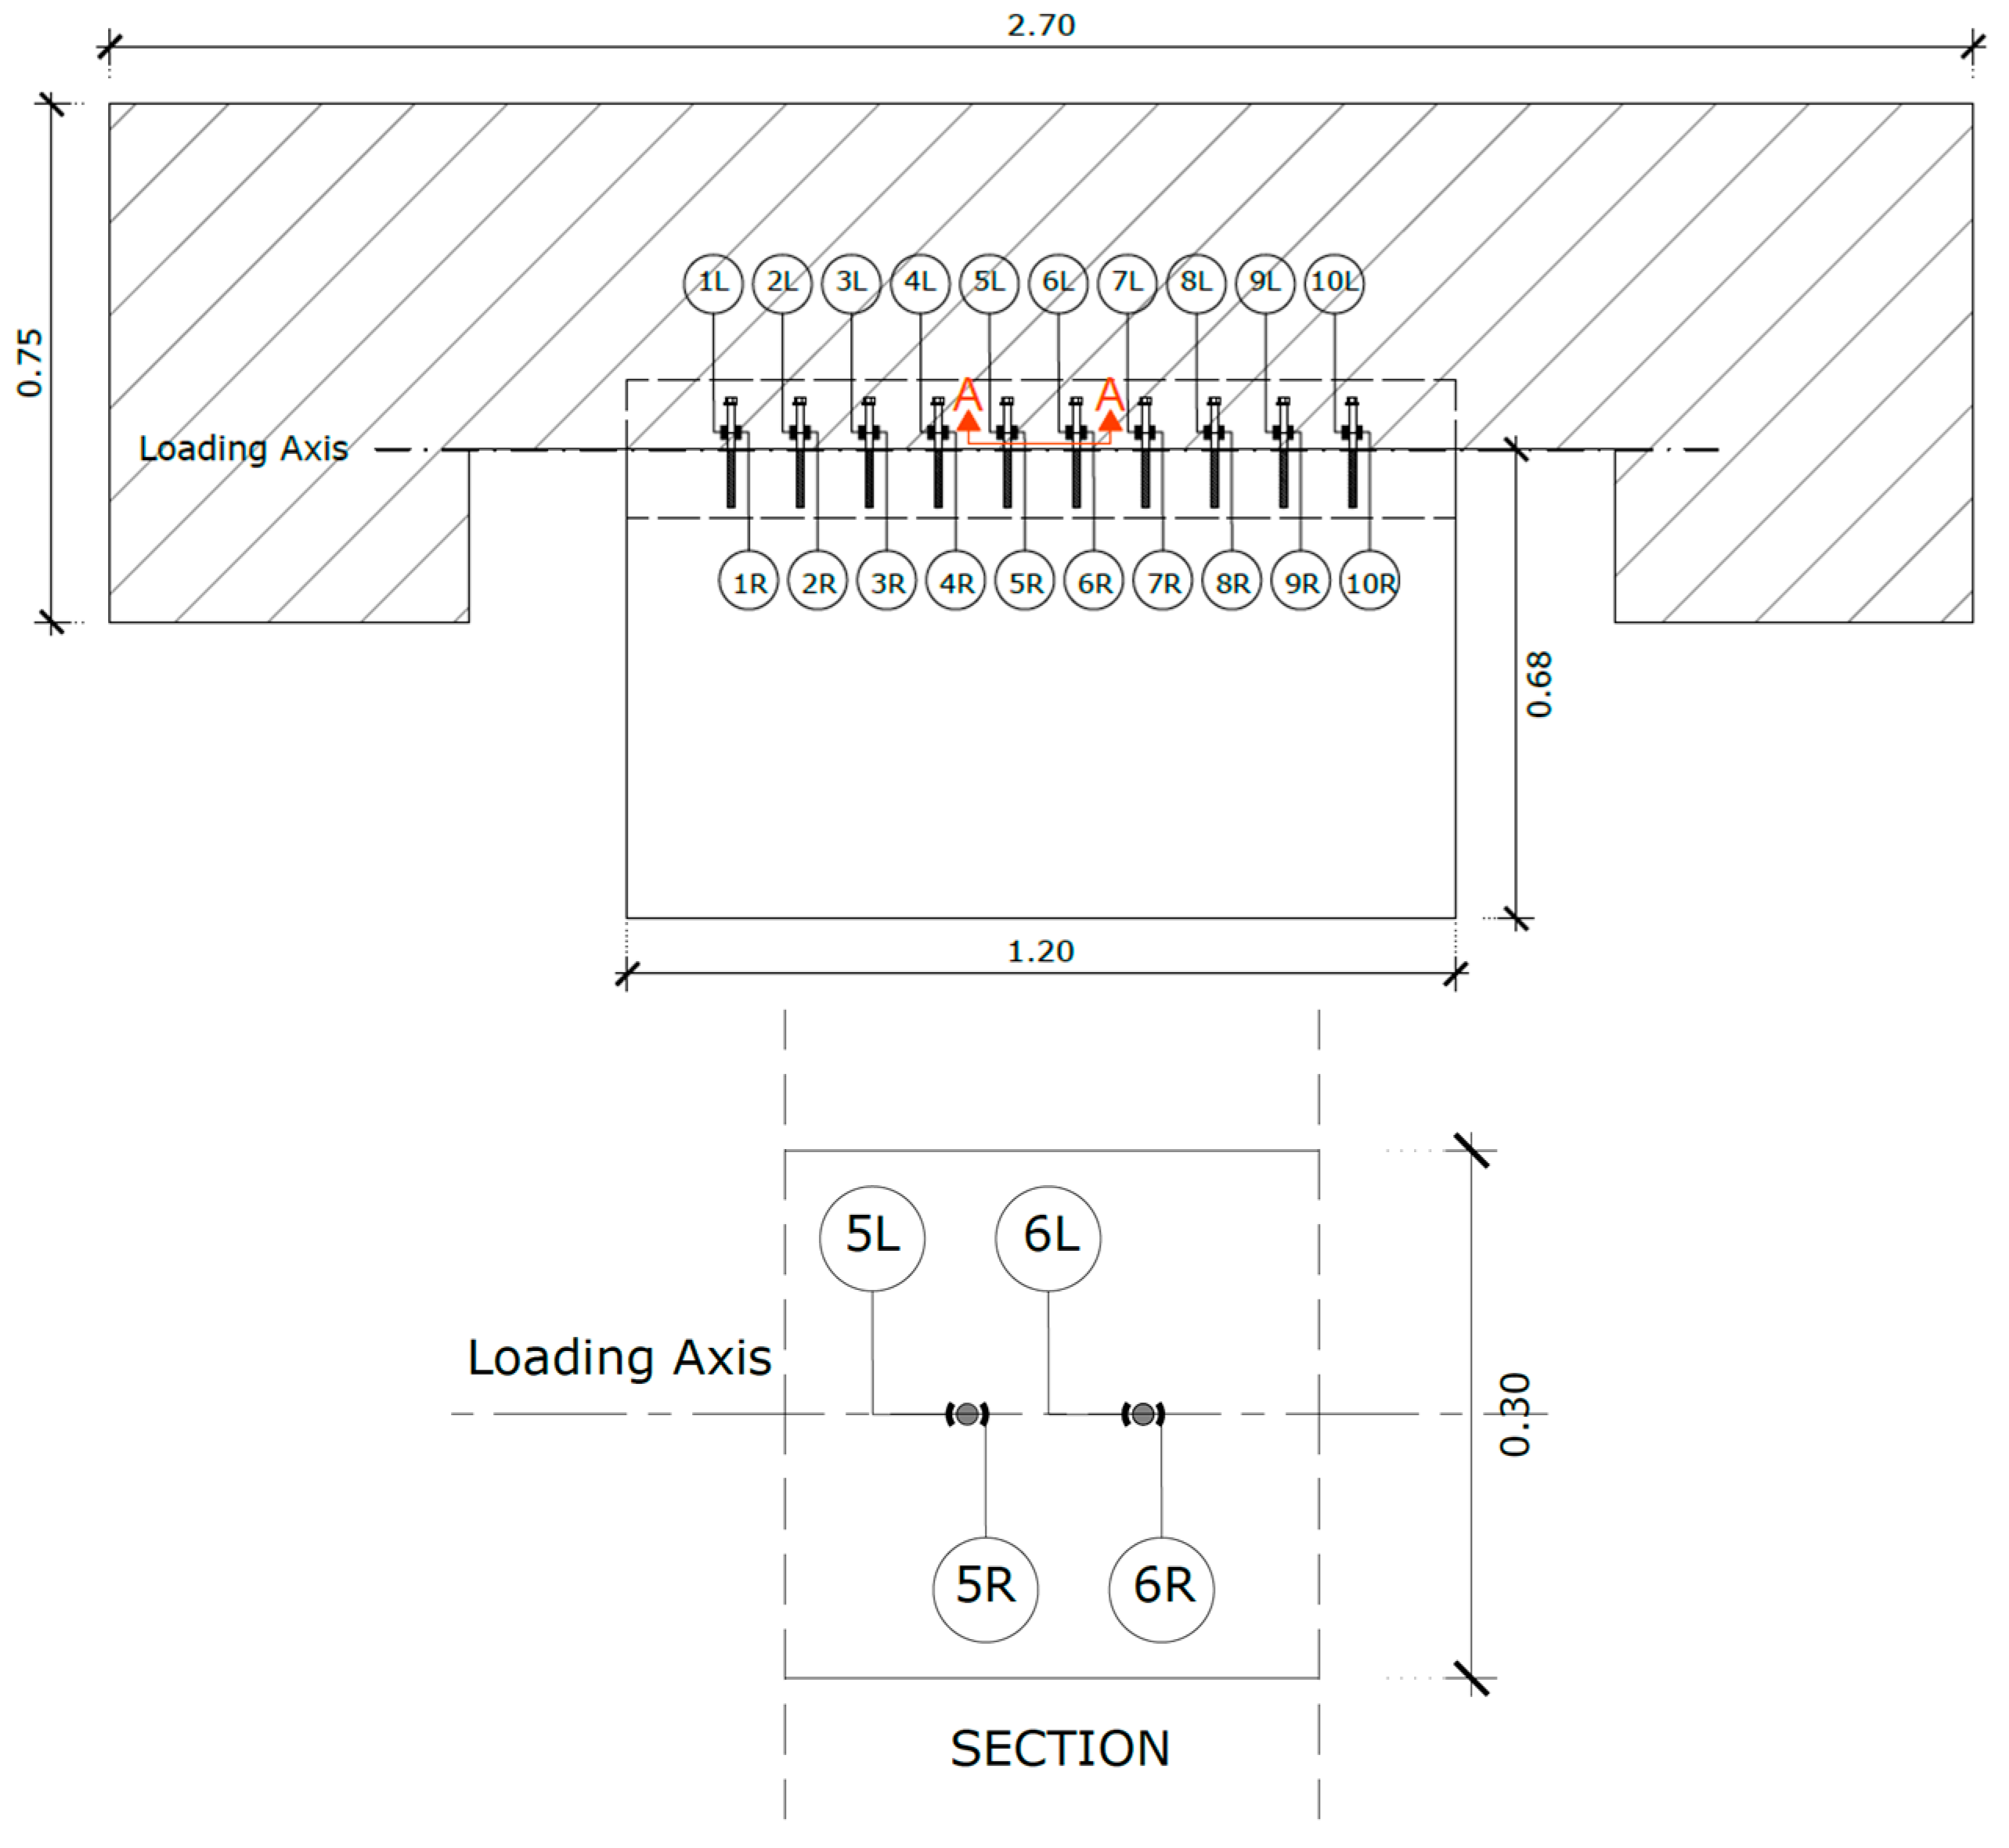
4.2. Displacement Transducers
4.3. Strain Gauges
4.4. Loading History
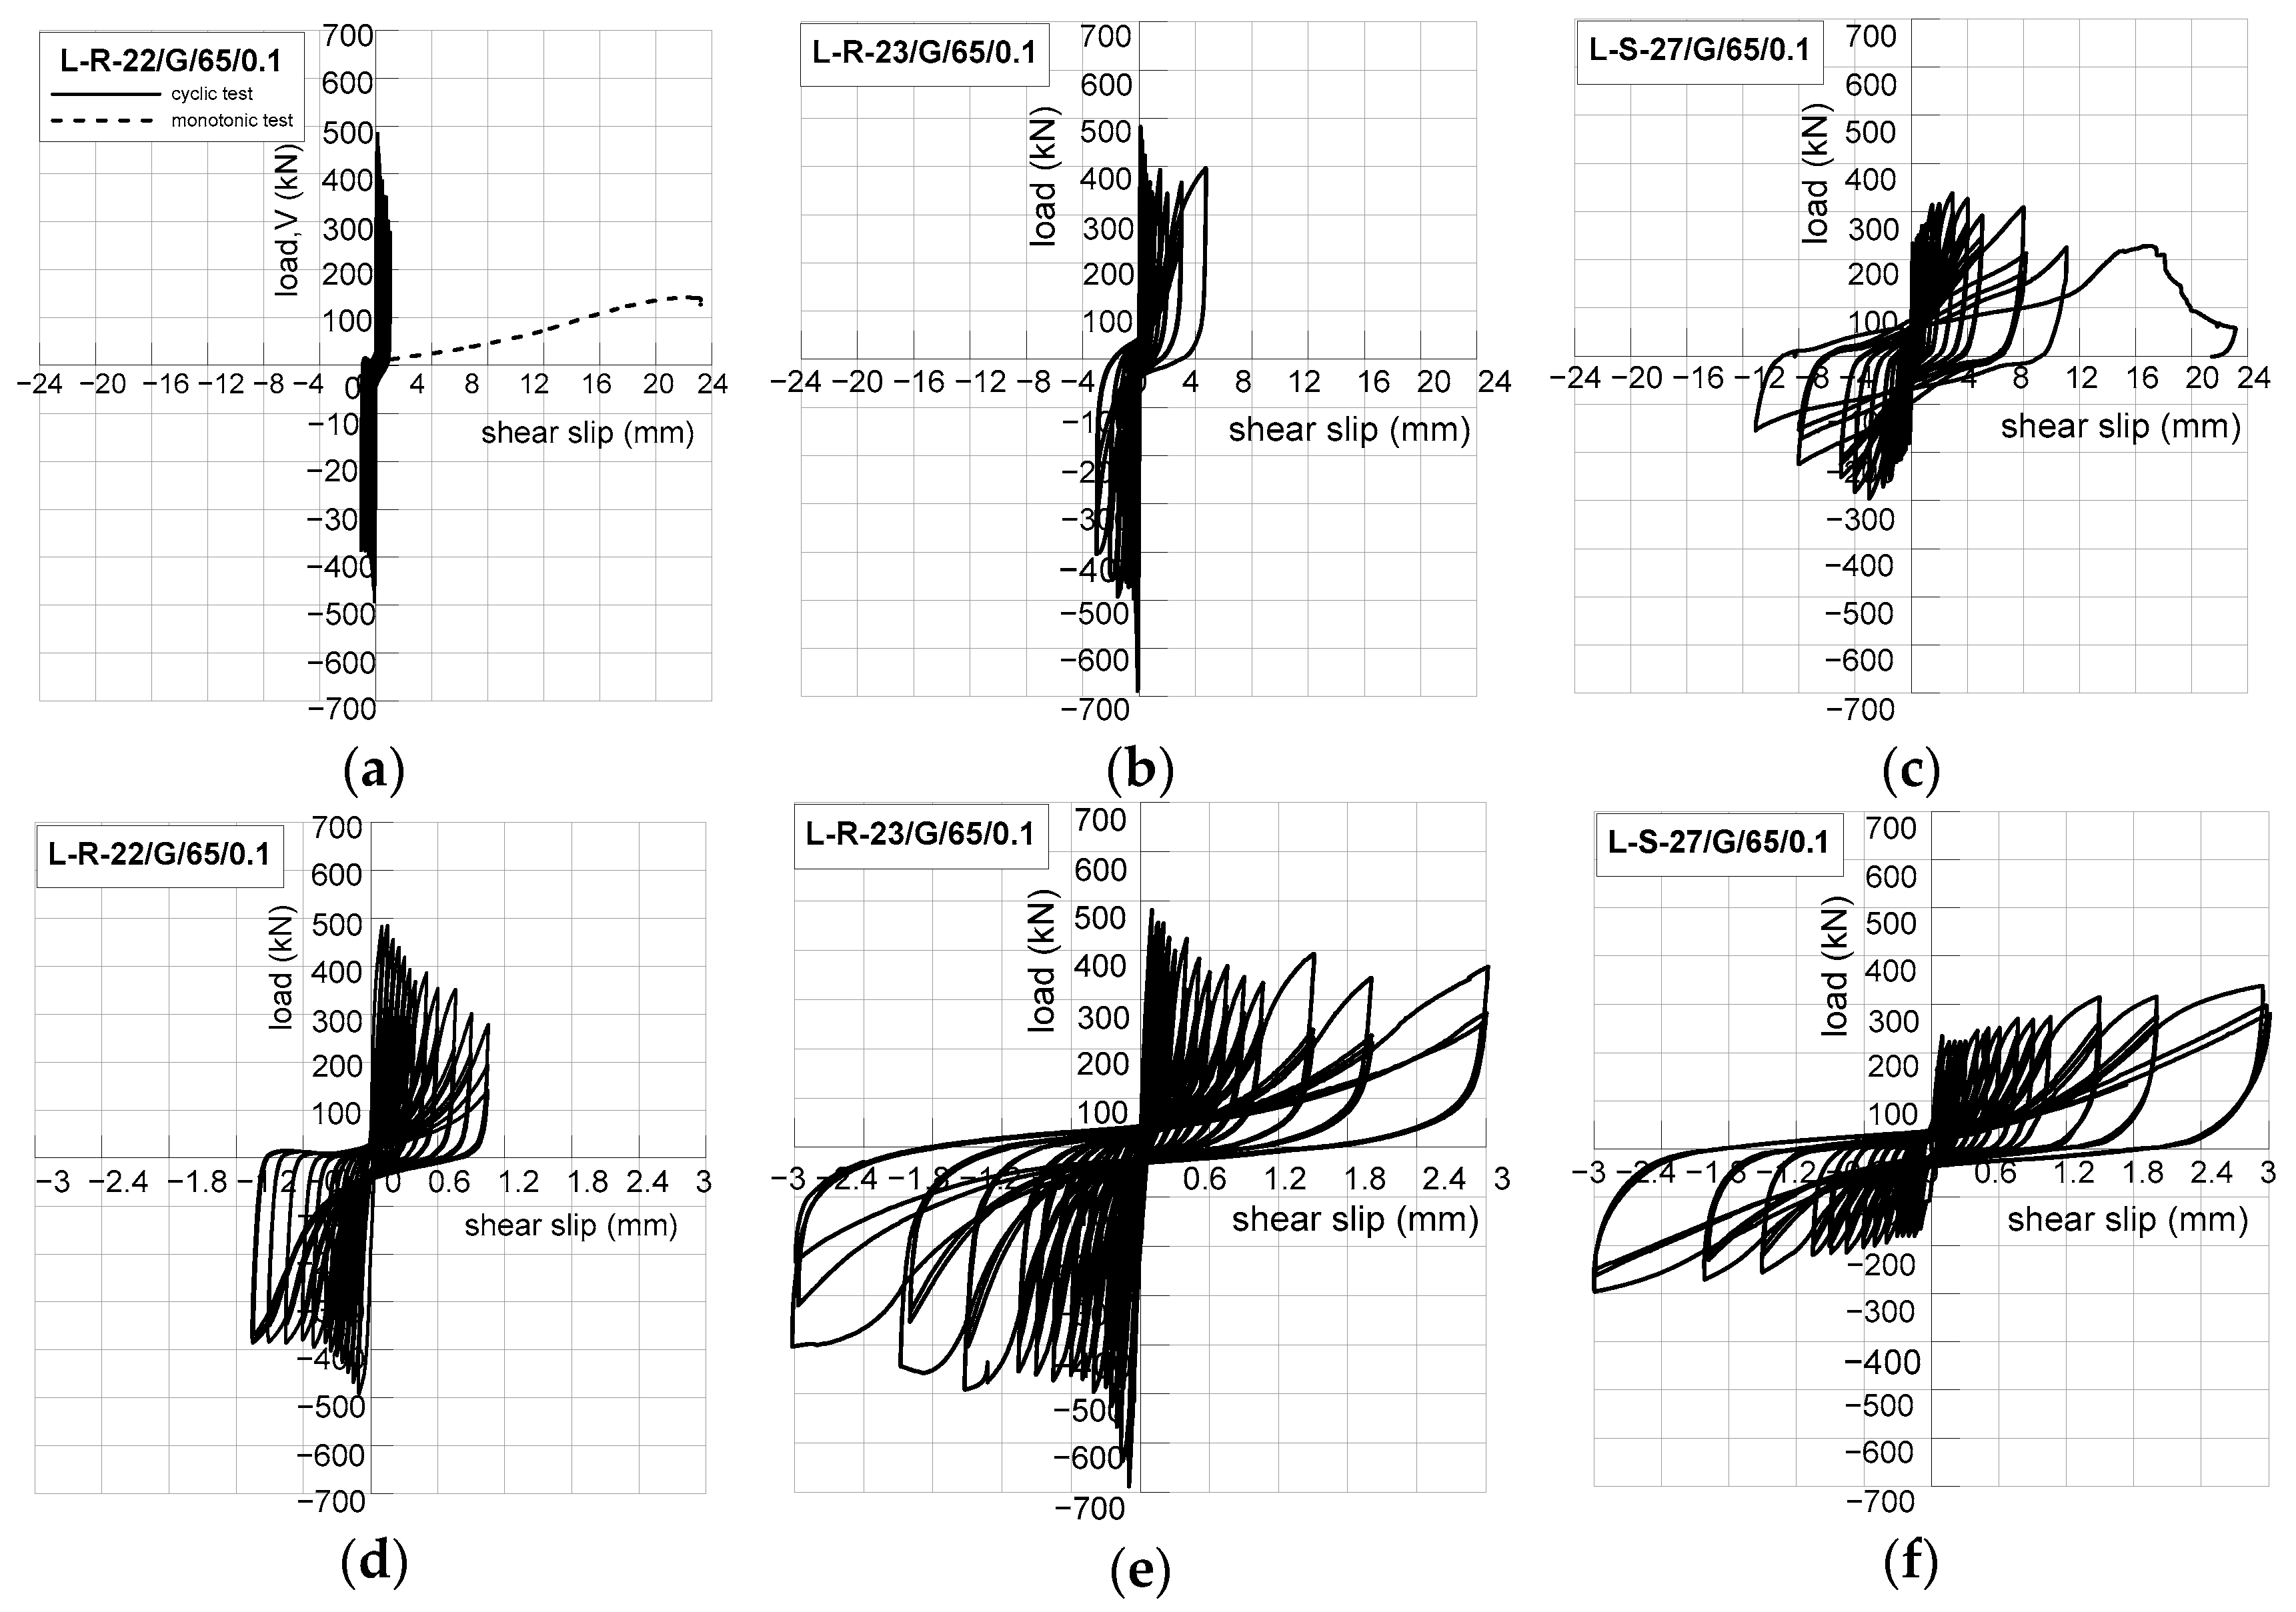
5. Test Results
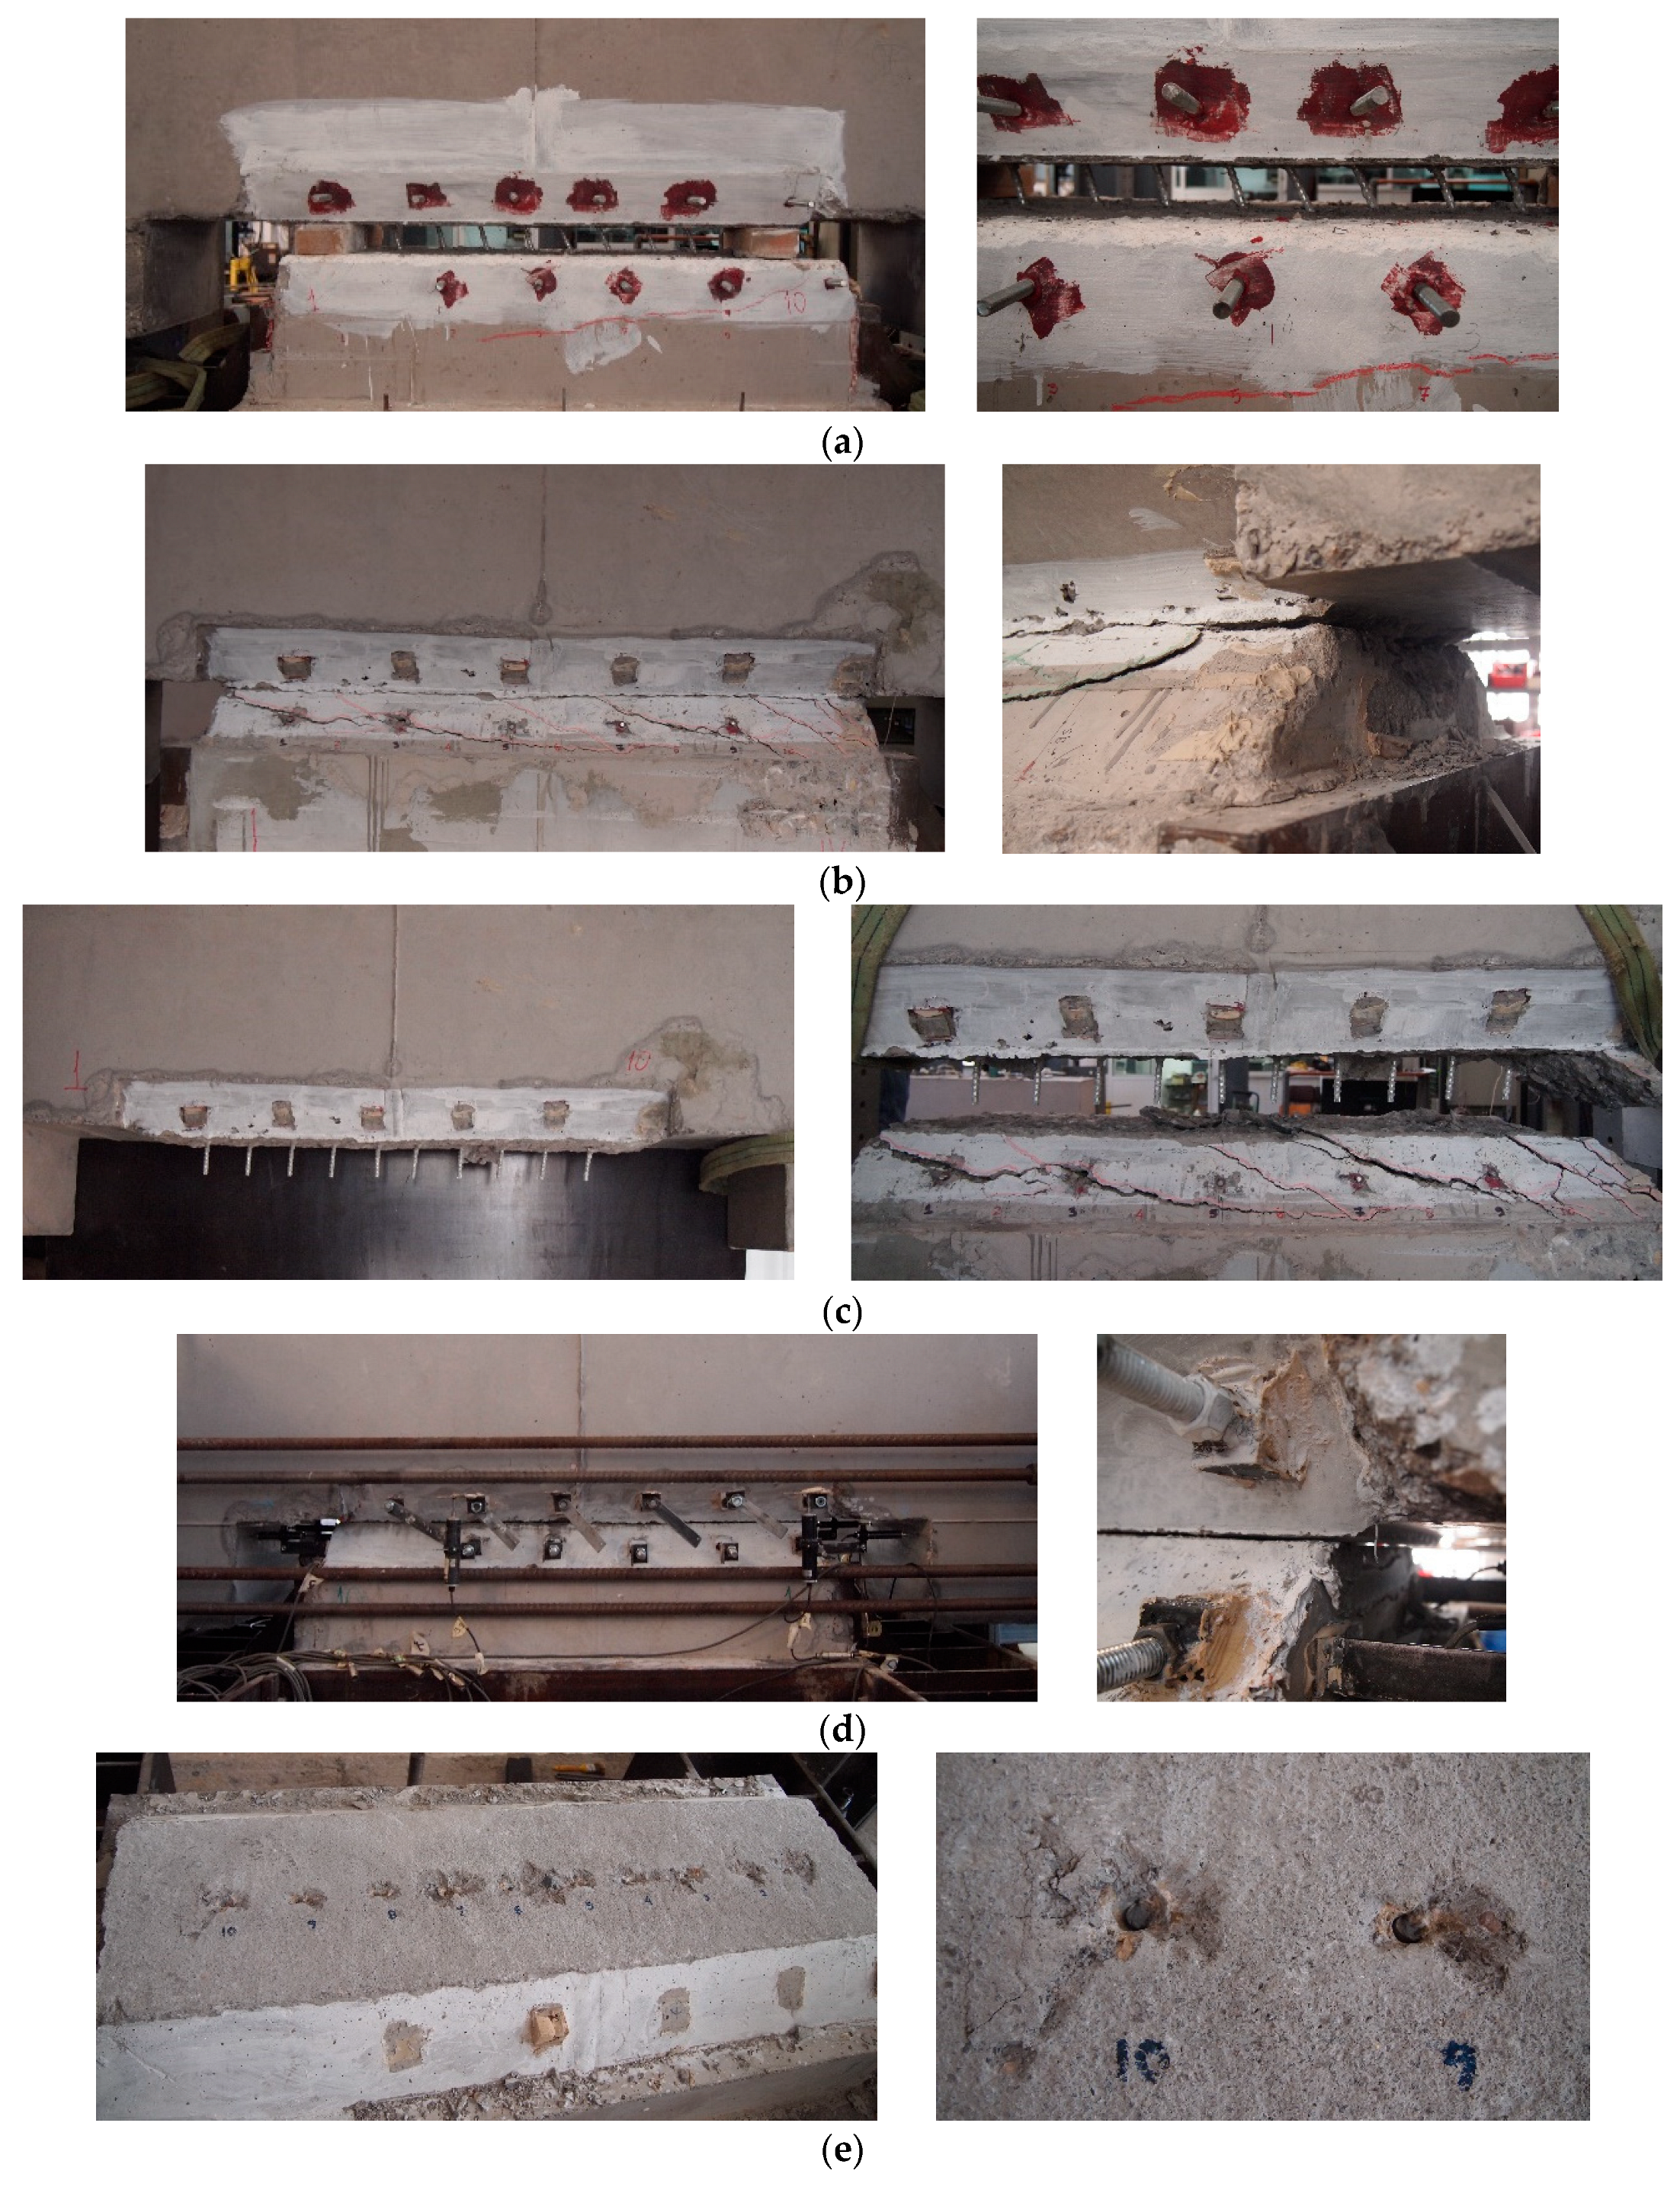
5.1. Failure Mode
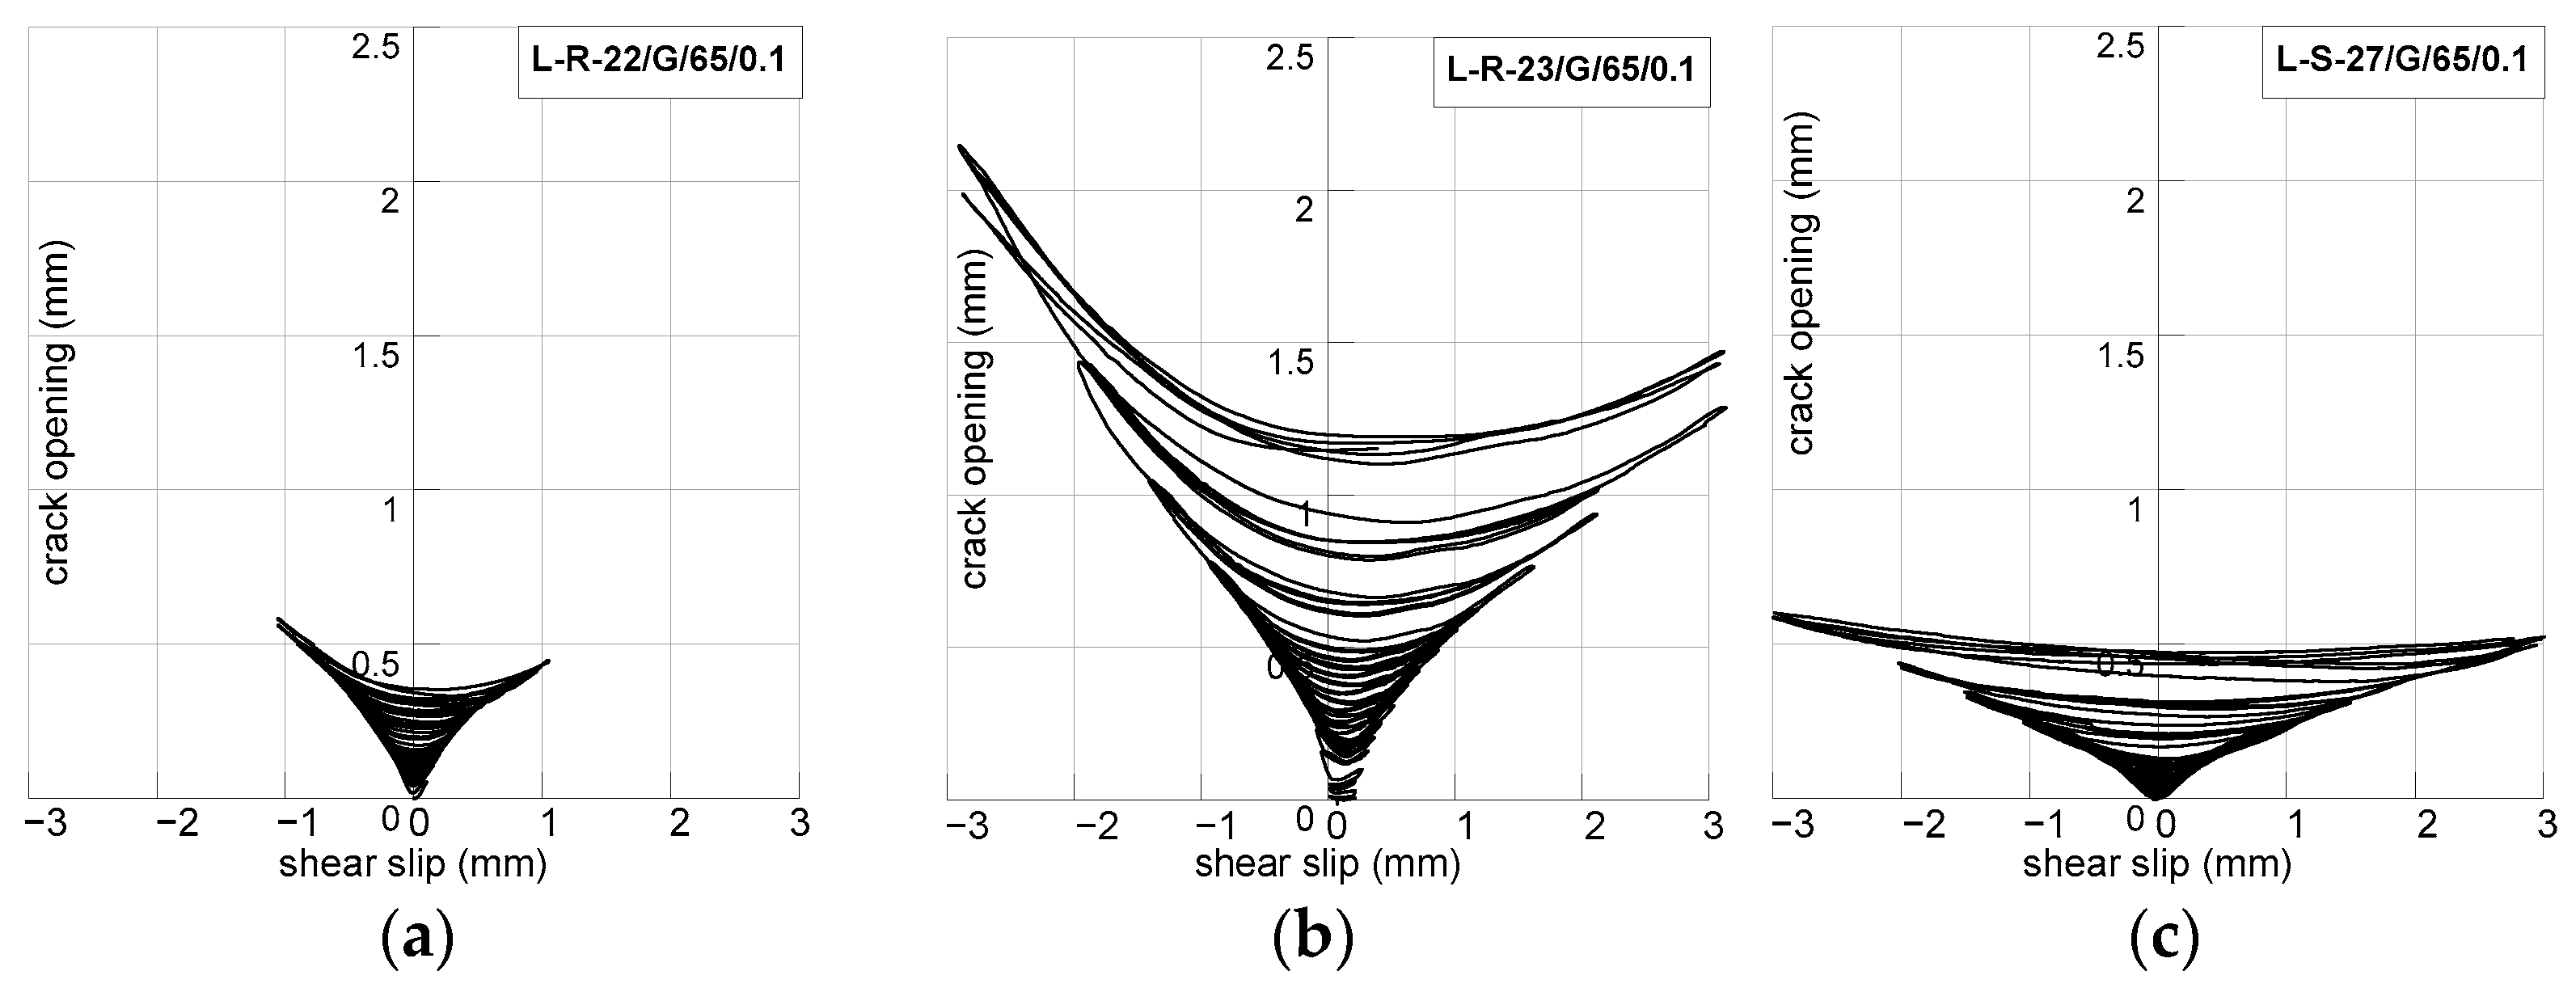
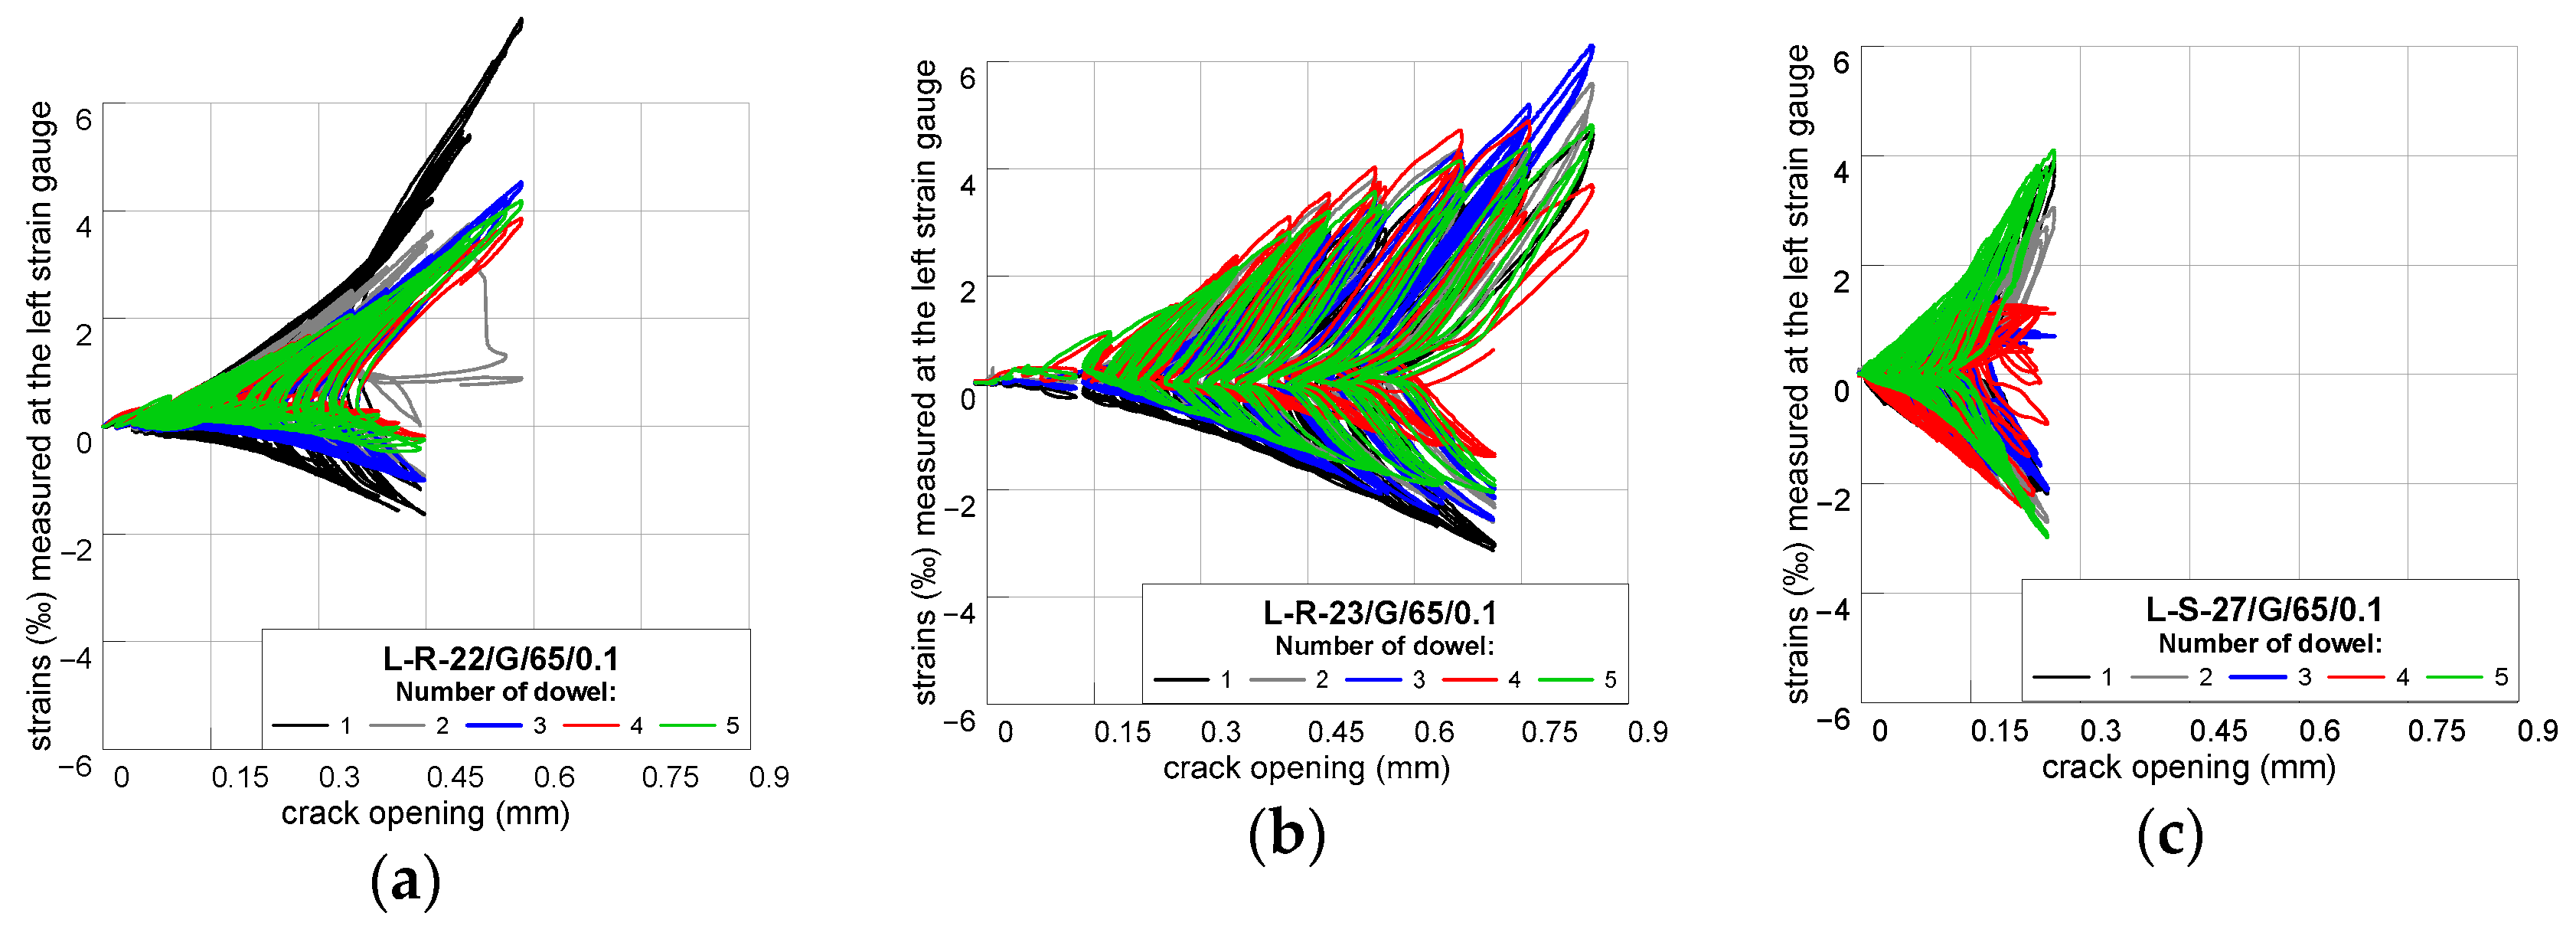
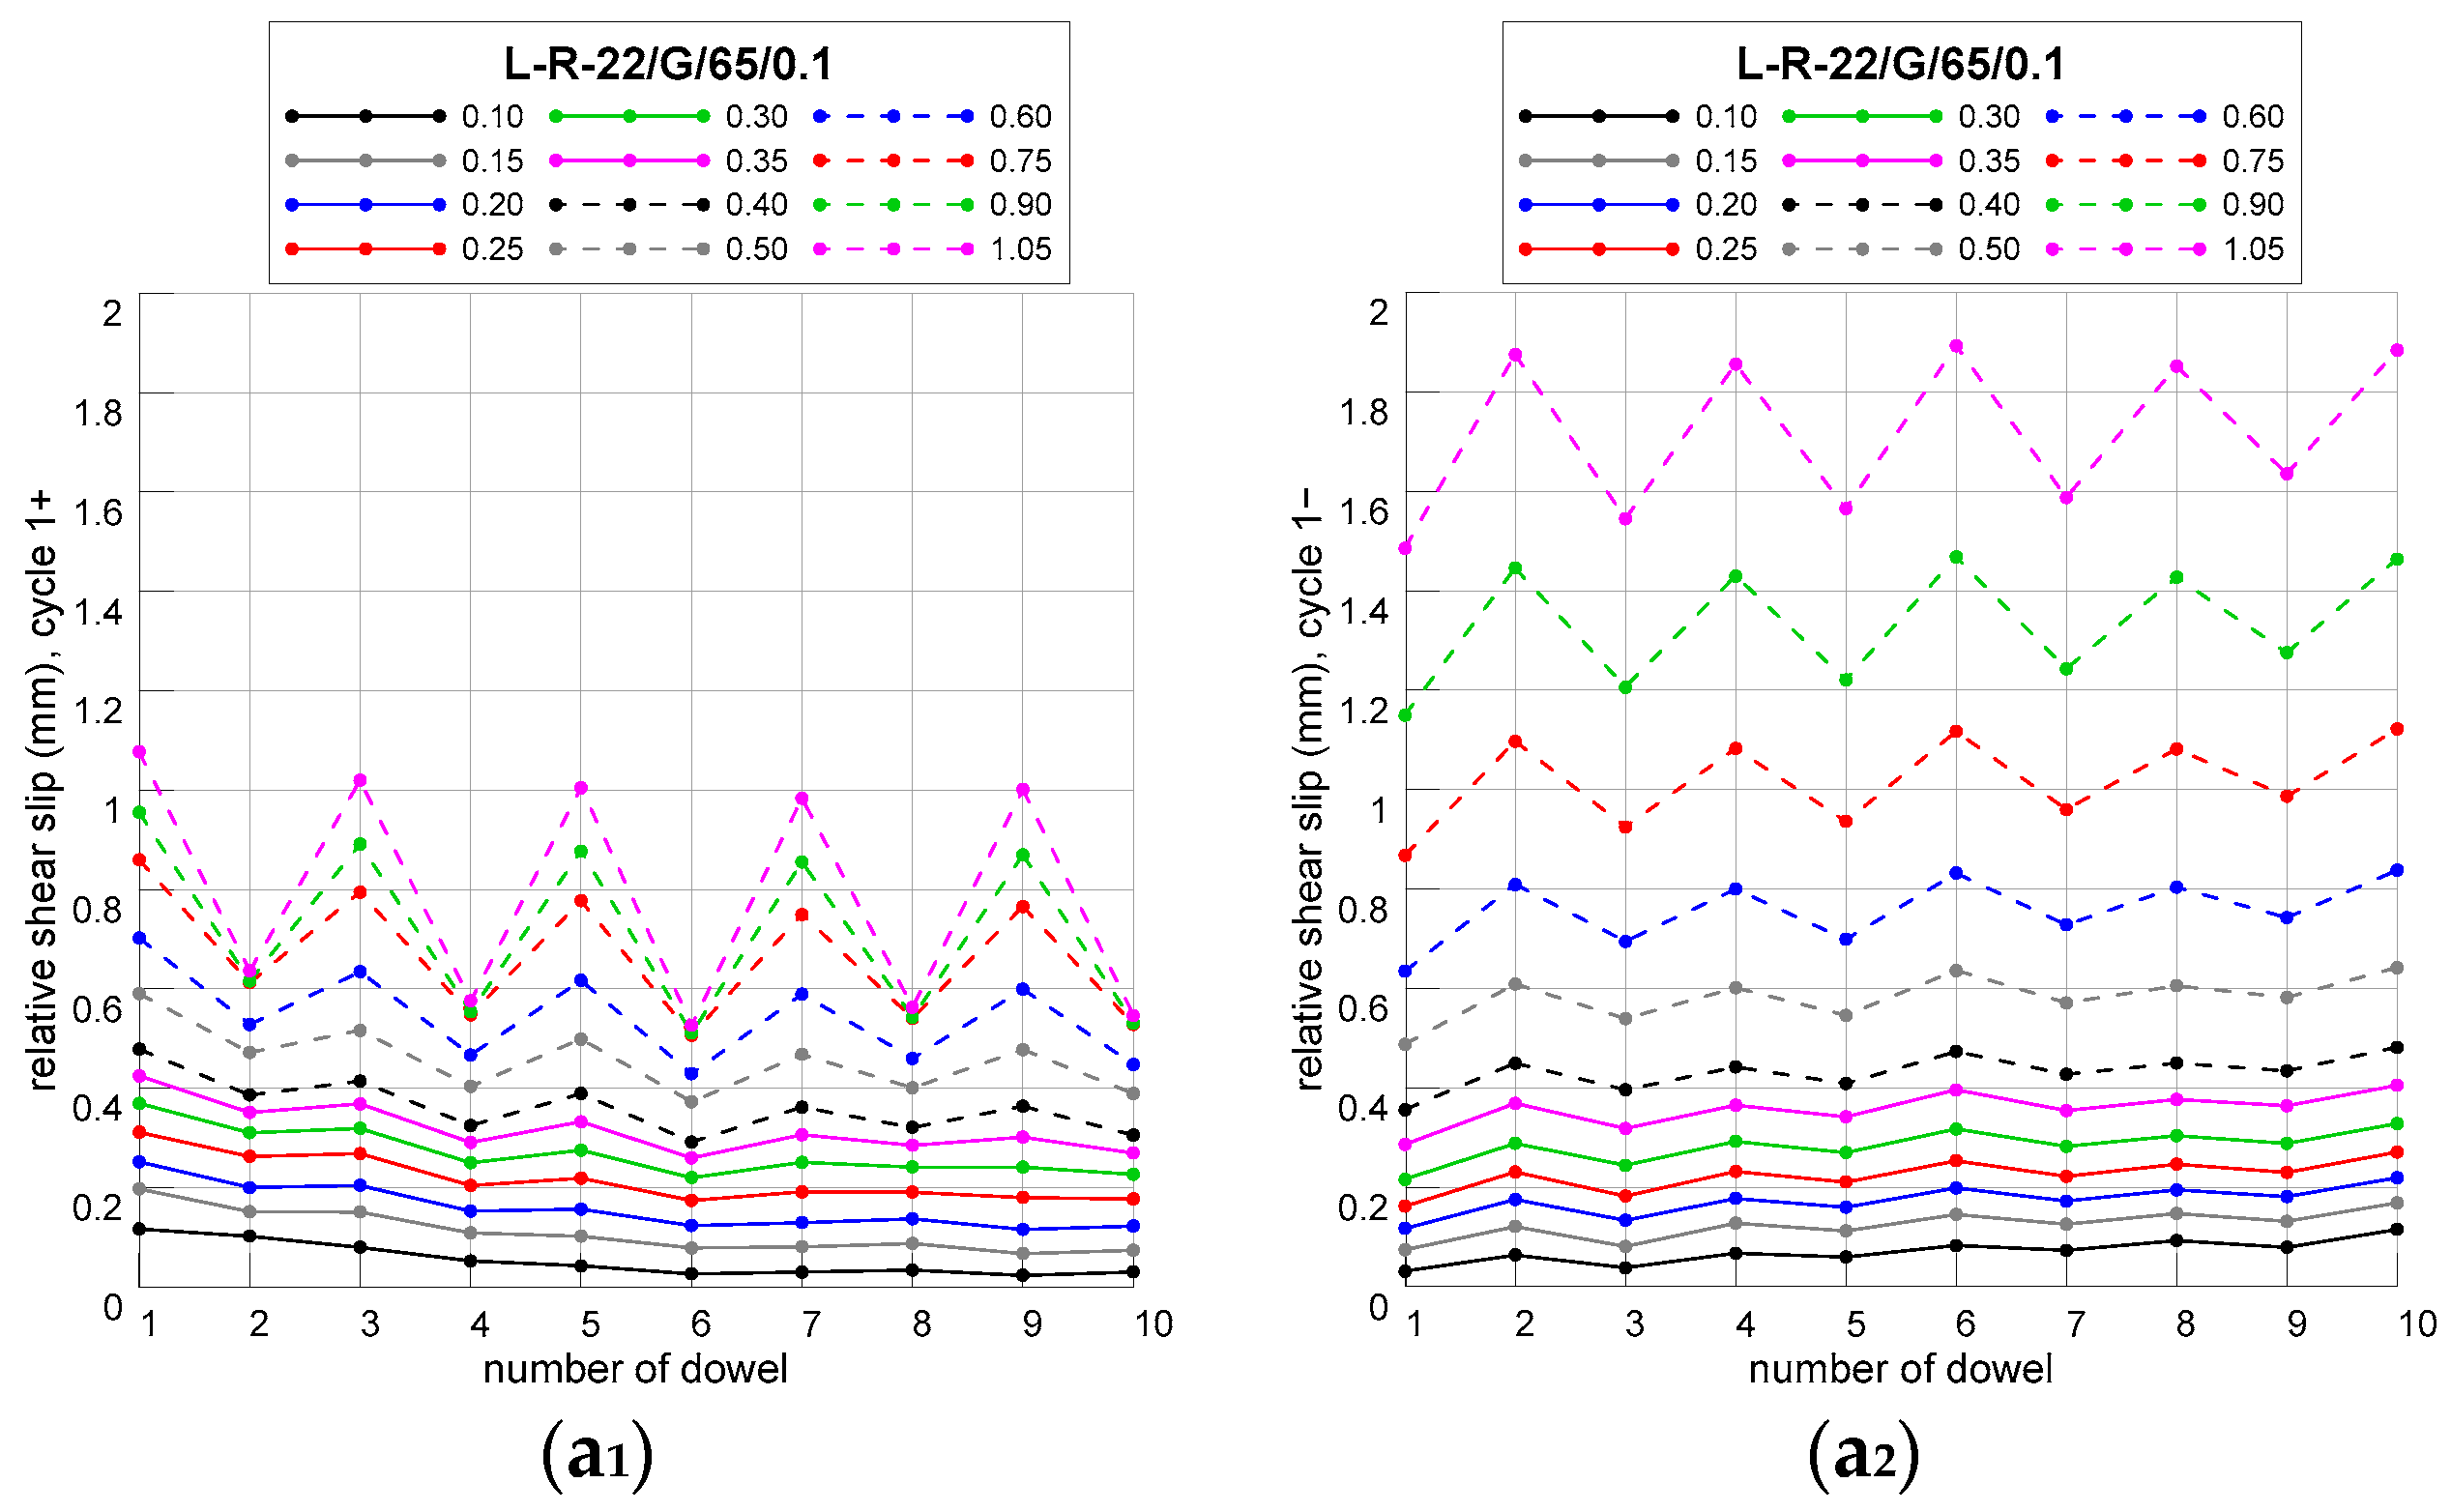
5.2. Crack Openings and Tensile Strains of the Bars Crossing the Interface
5.3. Interface Roughness
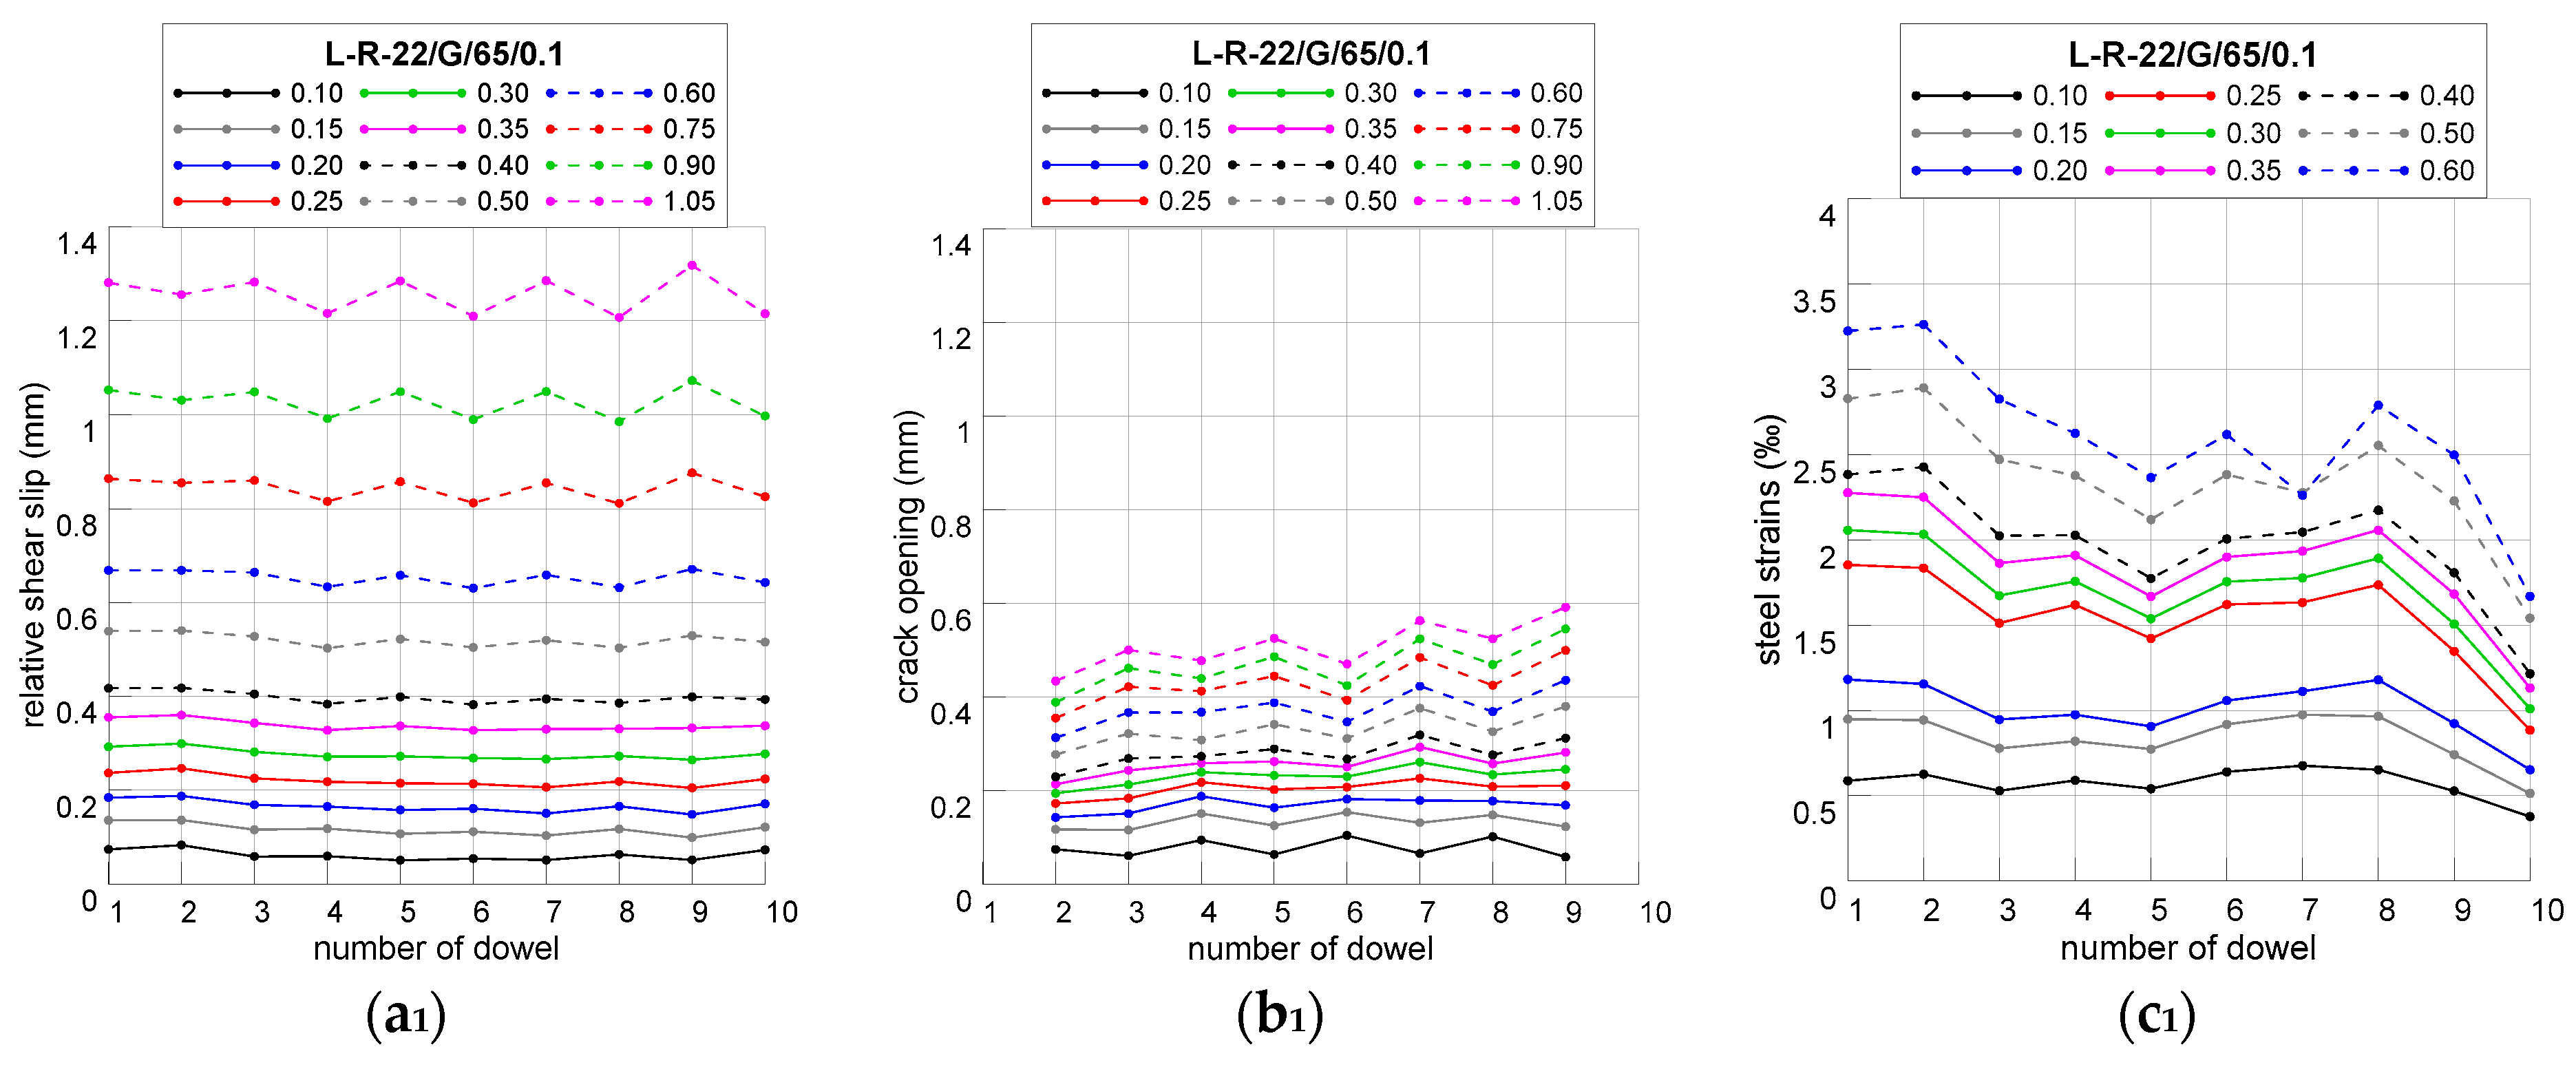
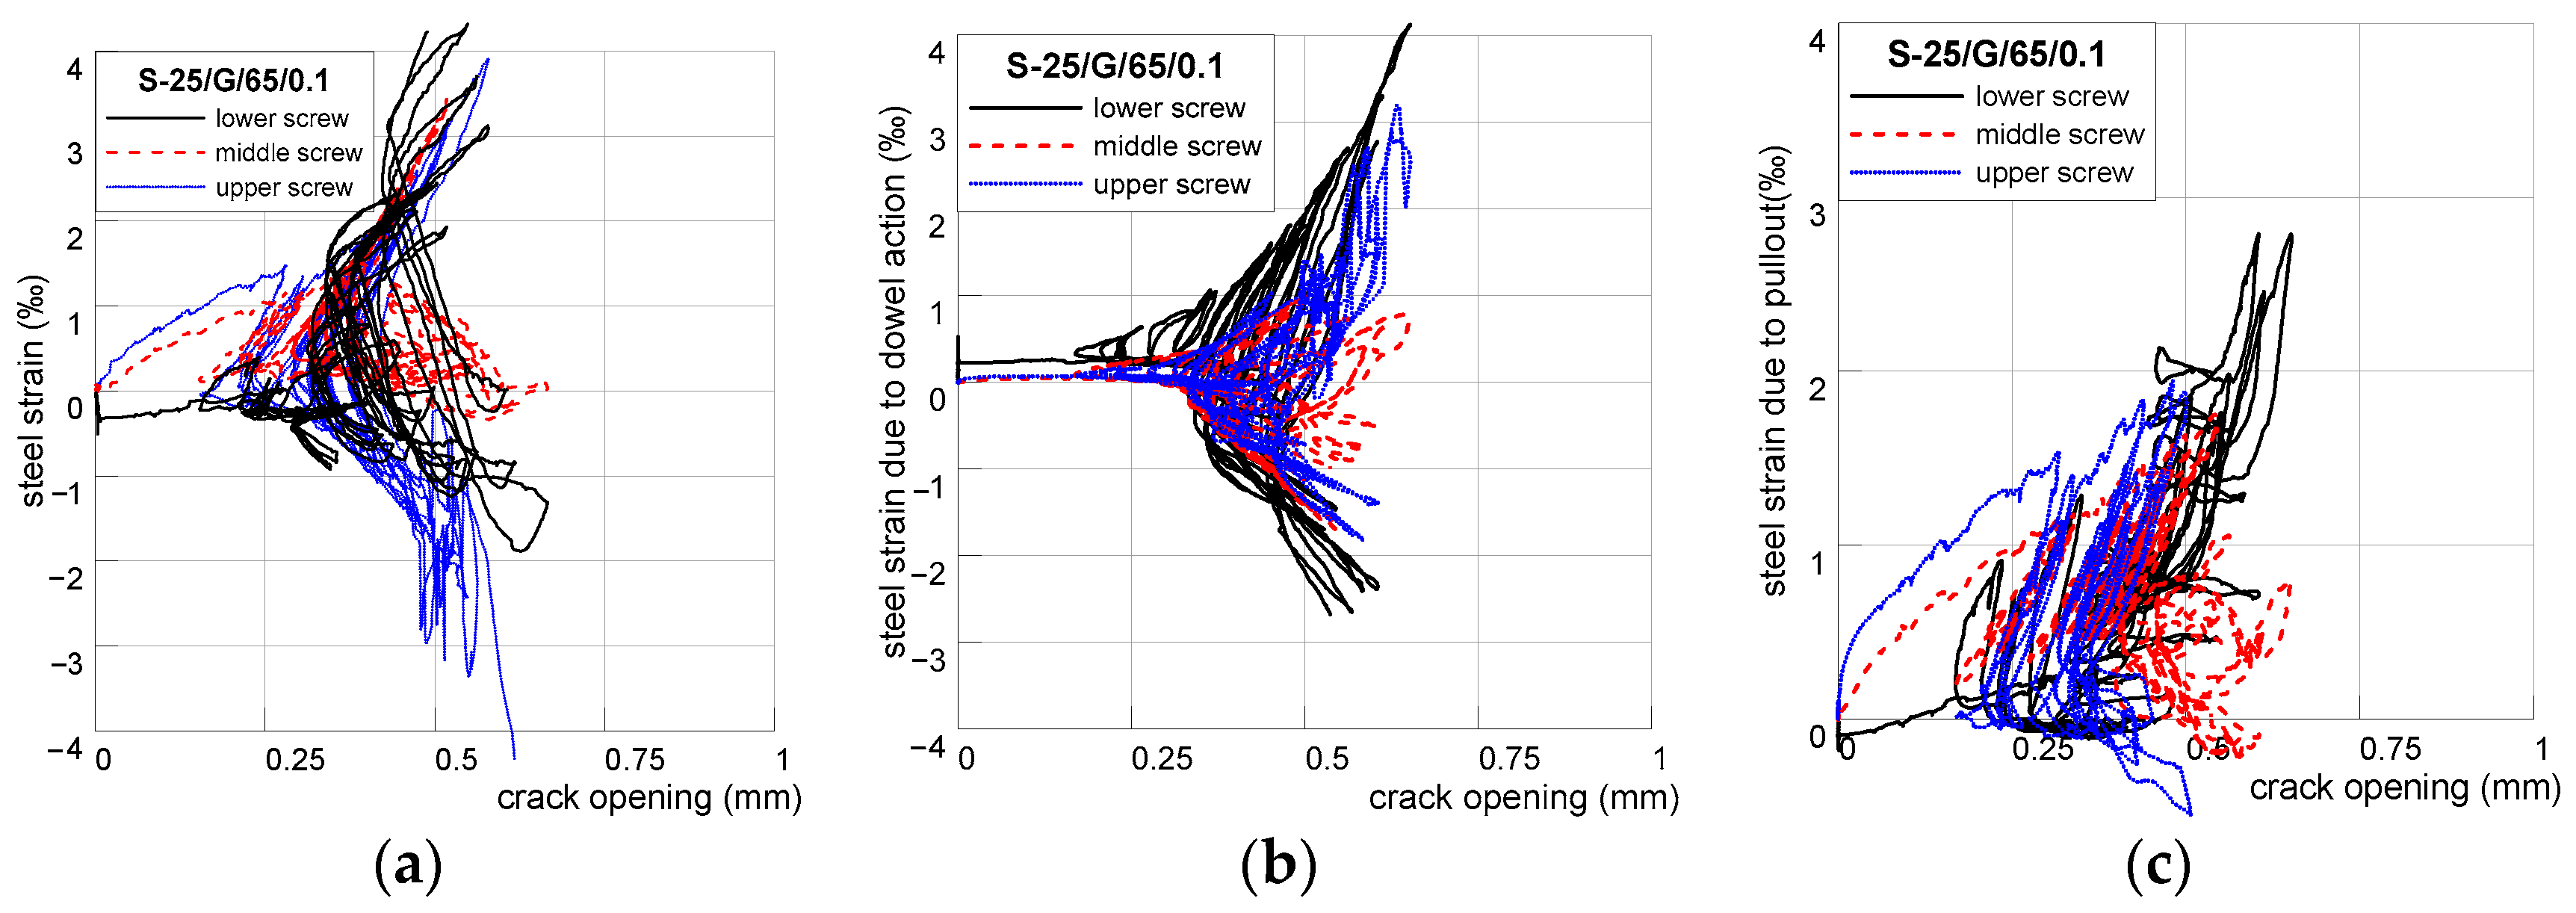
5.4. Steel Strains
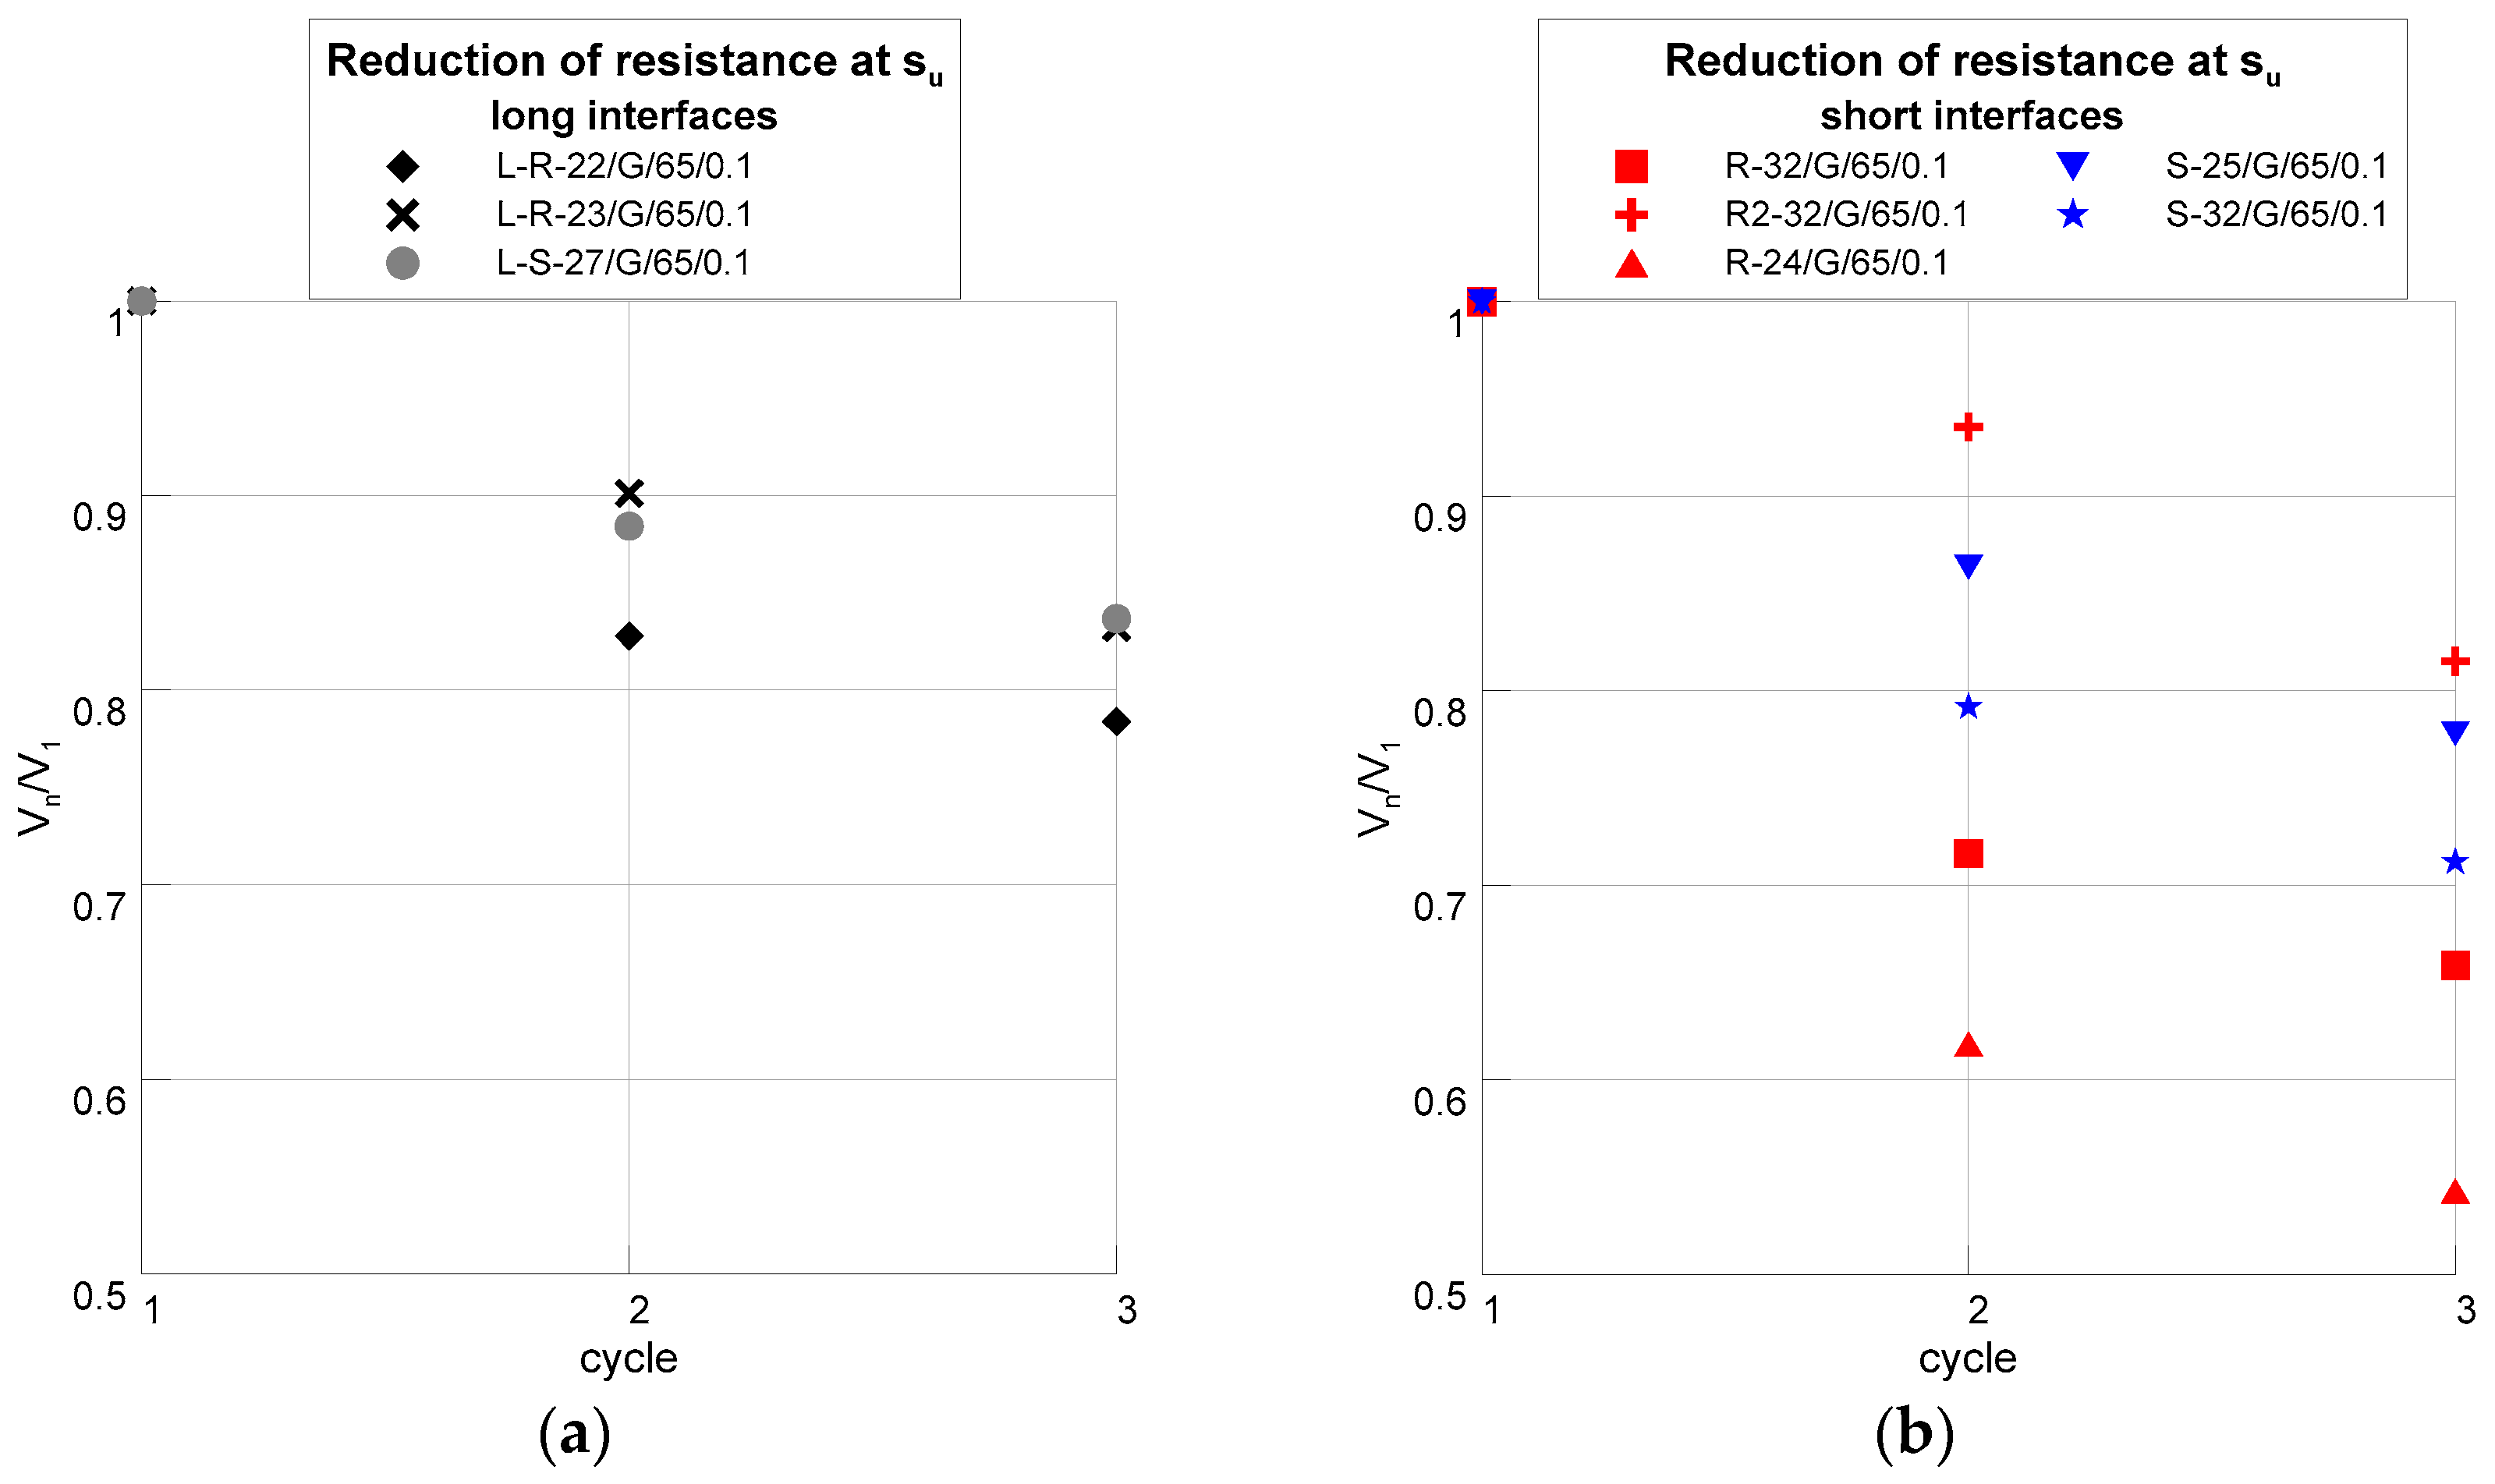
6. Comparison between Long and Short Interfaces
6.1. Failure Mode and Overall Behavior
6.2. Distribution of Shear Slips and Steel Strains
7. Summary and Conclusions
- To record, in detail, the behavior of interfaces, both under monotonic and cyclic actions, adequate experimental setup and instrumentation is needed. The testing procedure adopted in this work was proven to be efficient, as it allowed for shear slips and crack openings to be reliably measured in several locations along the interfaces, thus permitting to closely follow the activation of the interfaces throughout testing.
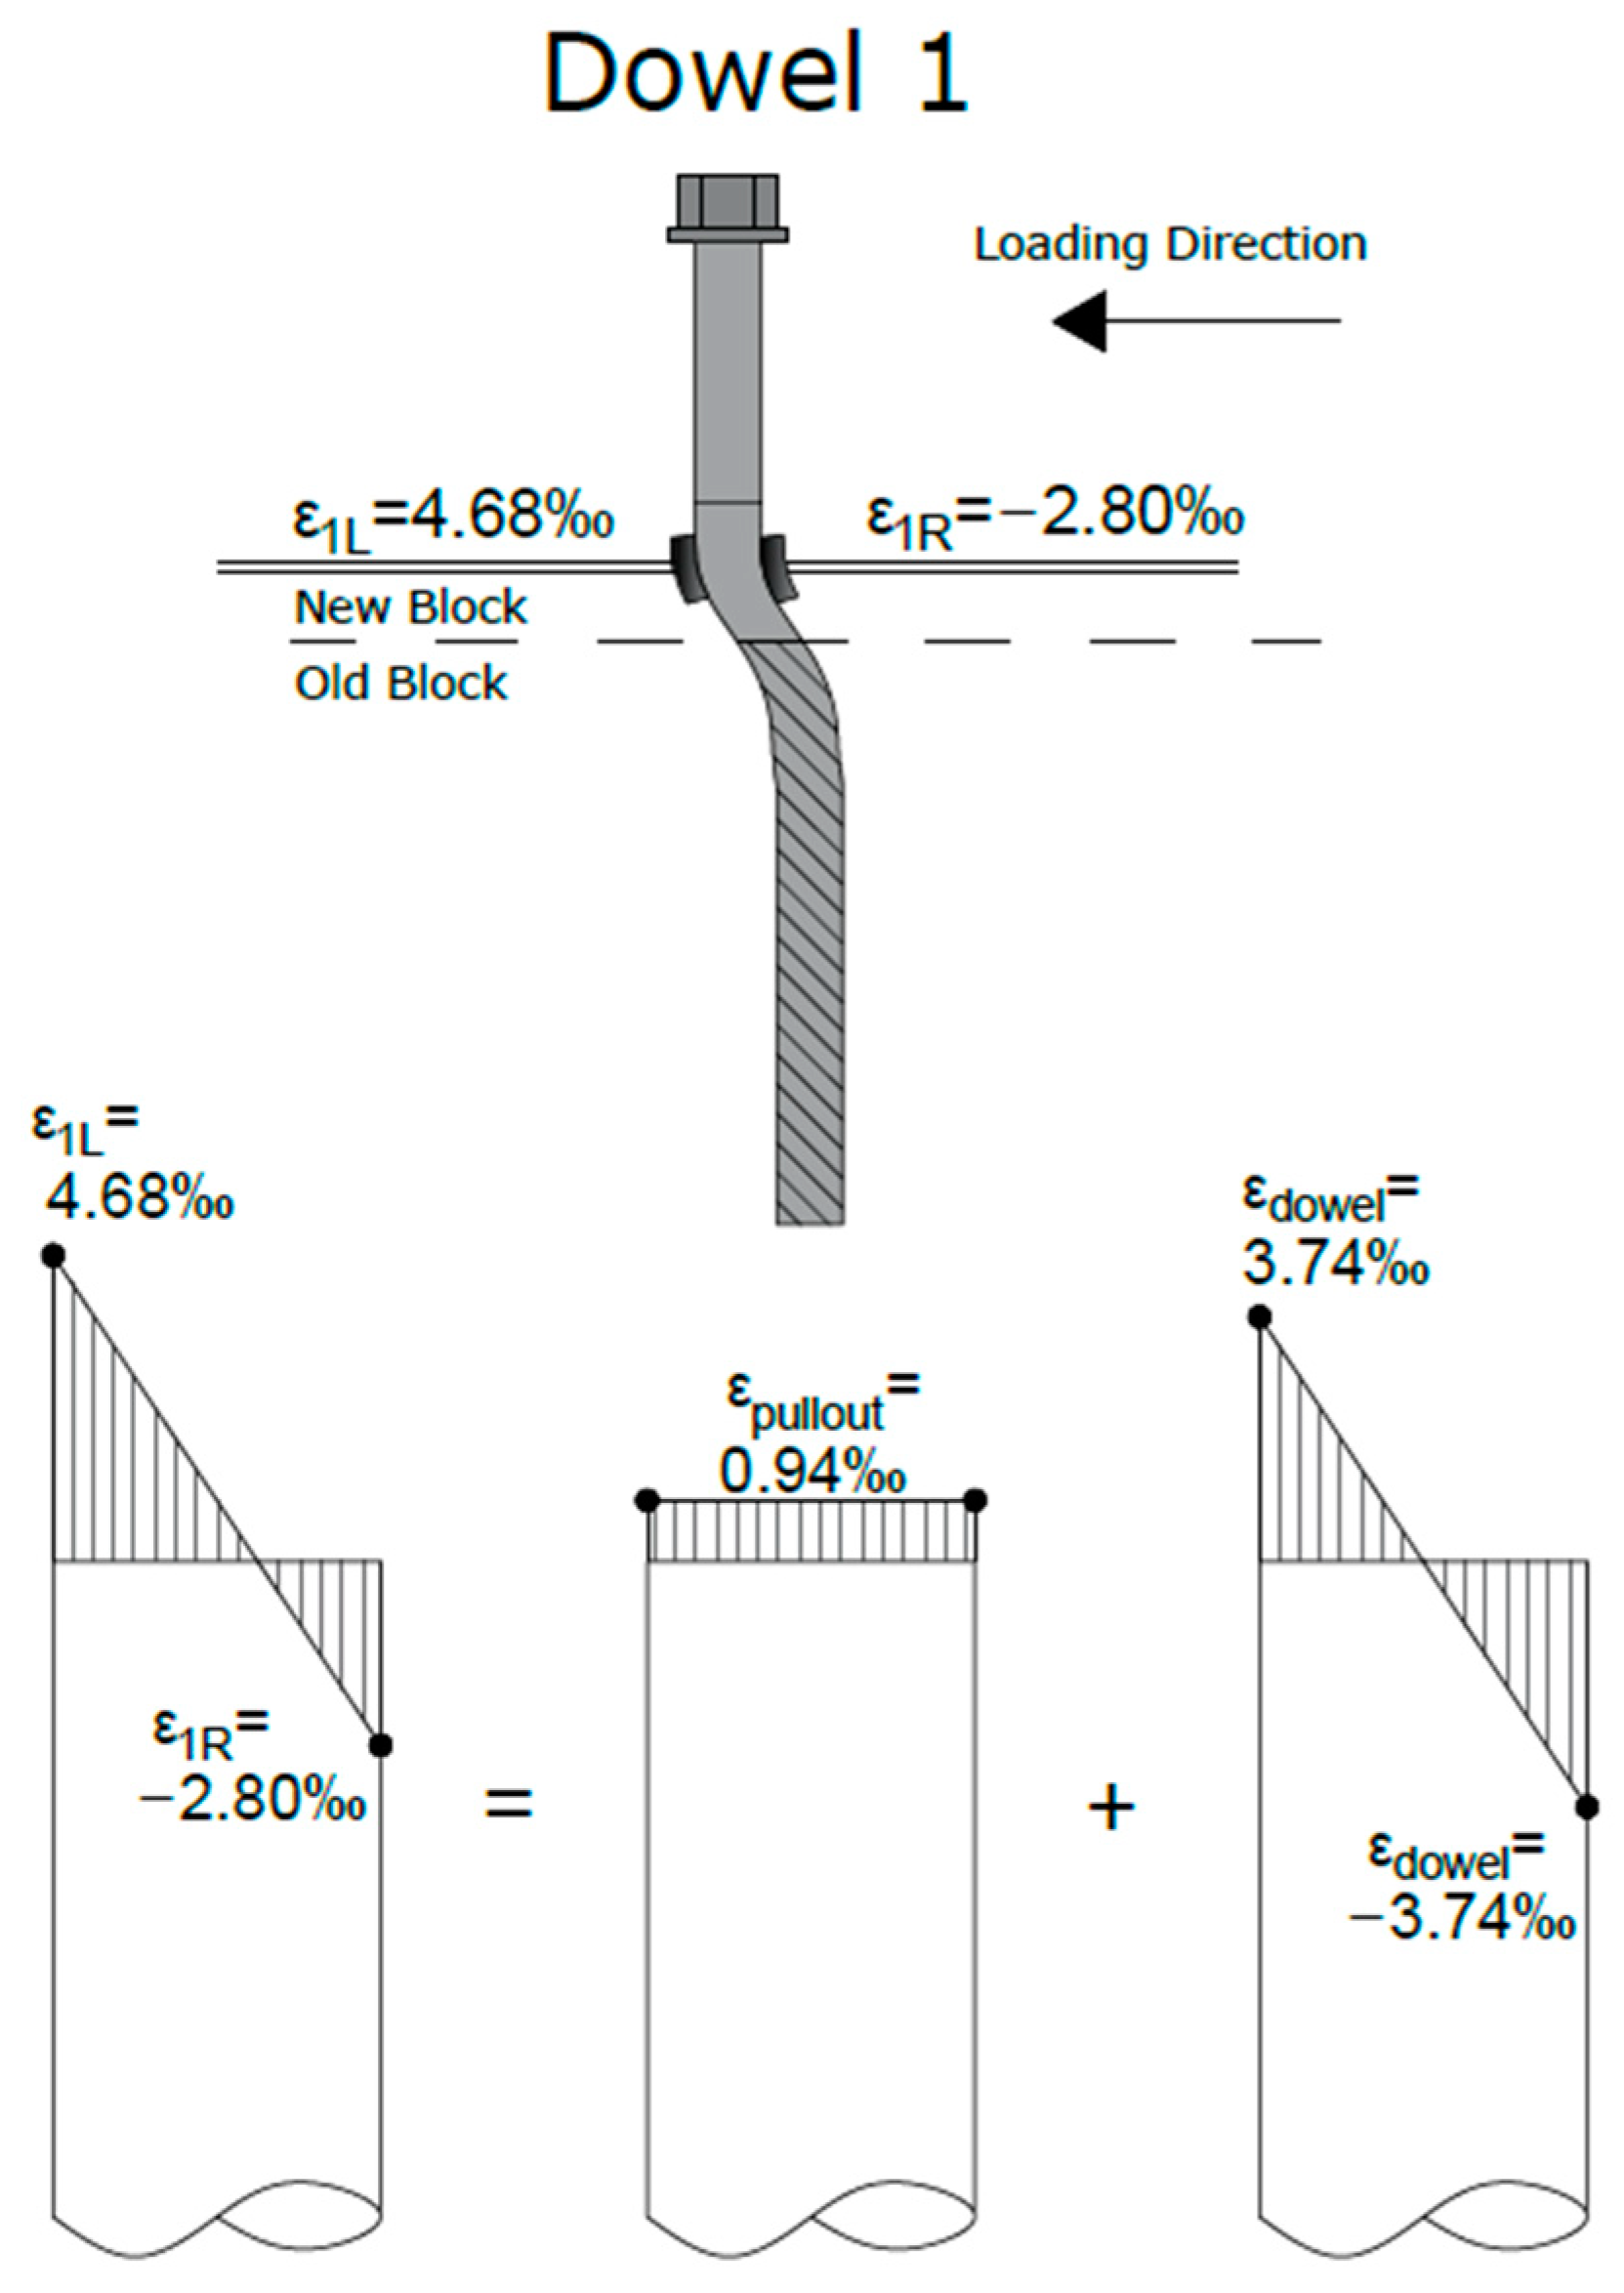
- Furthermore, strain measurements on all screws, along with the technique developed to calculate the contribution of each distinct shear transfer mechanism to the total measured strain, confirmed the rather limited activation of the clamping effect (due to the small embedment depth of the screws) and, on the contrary, the significant contribution of dowel action.
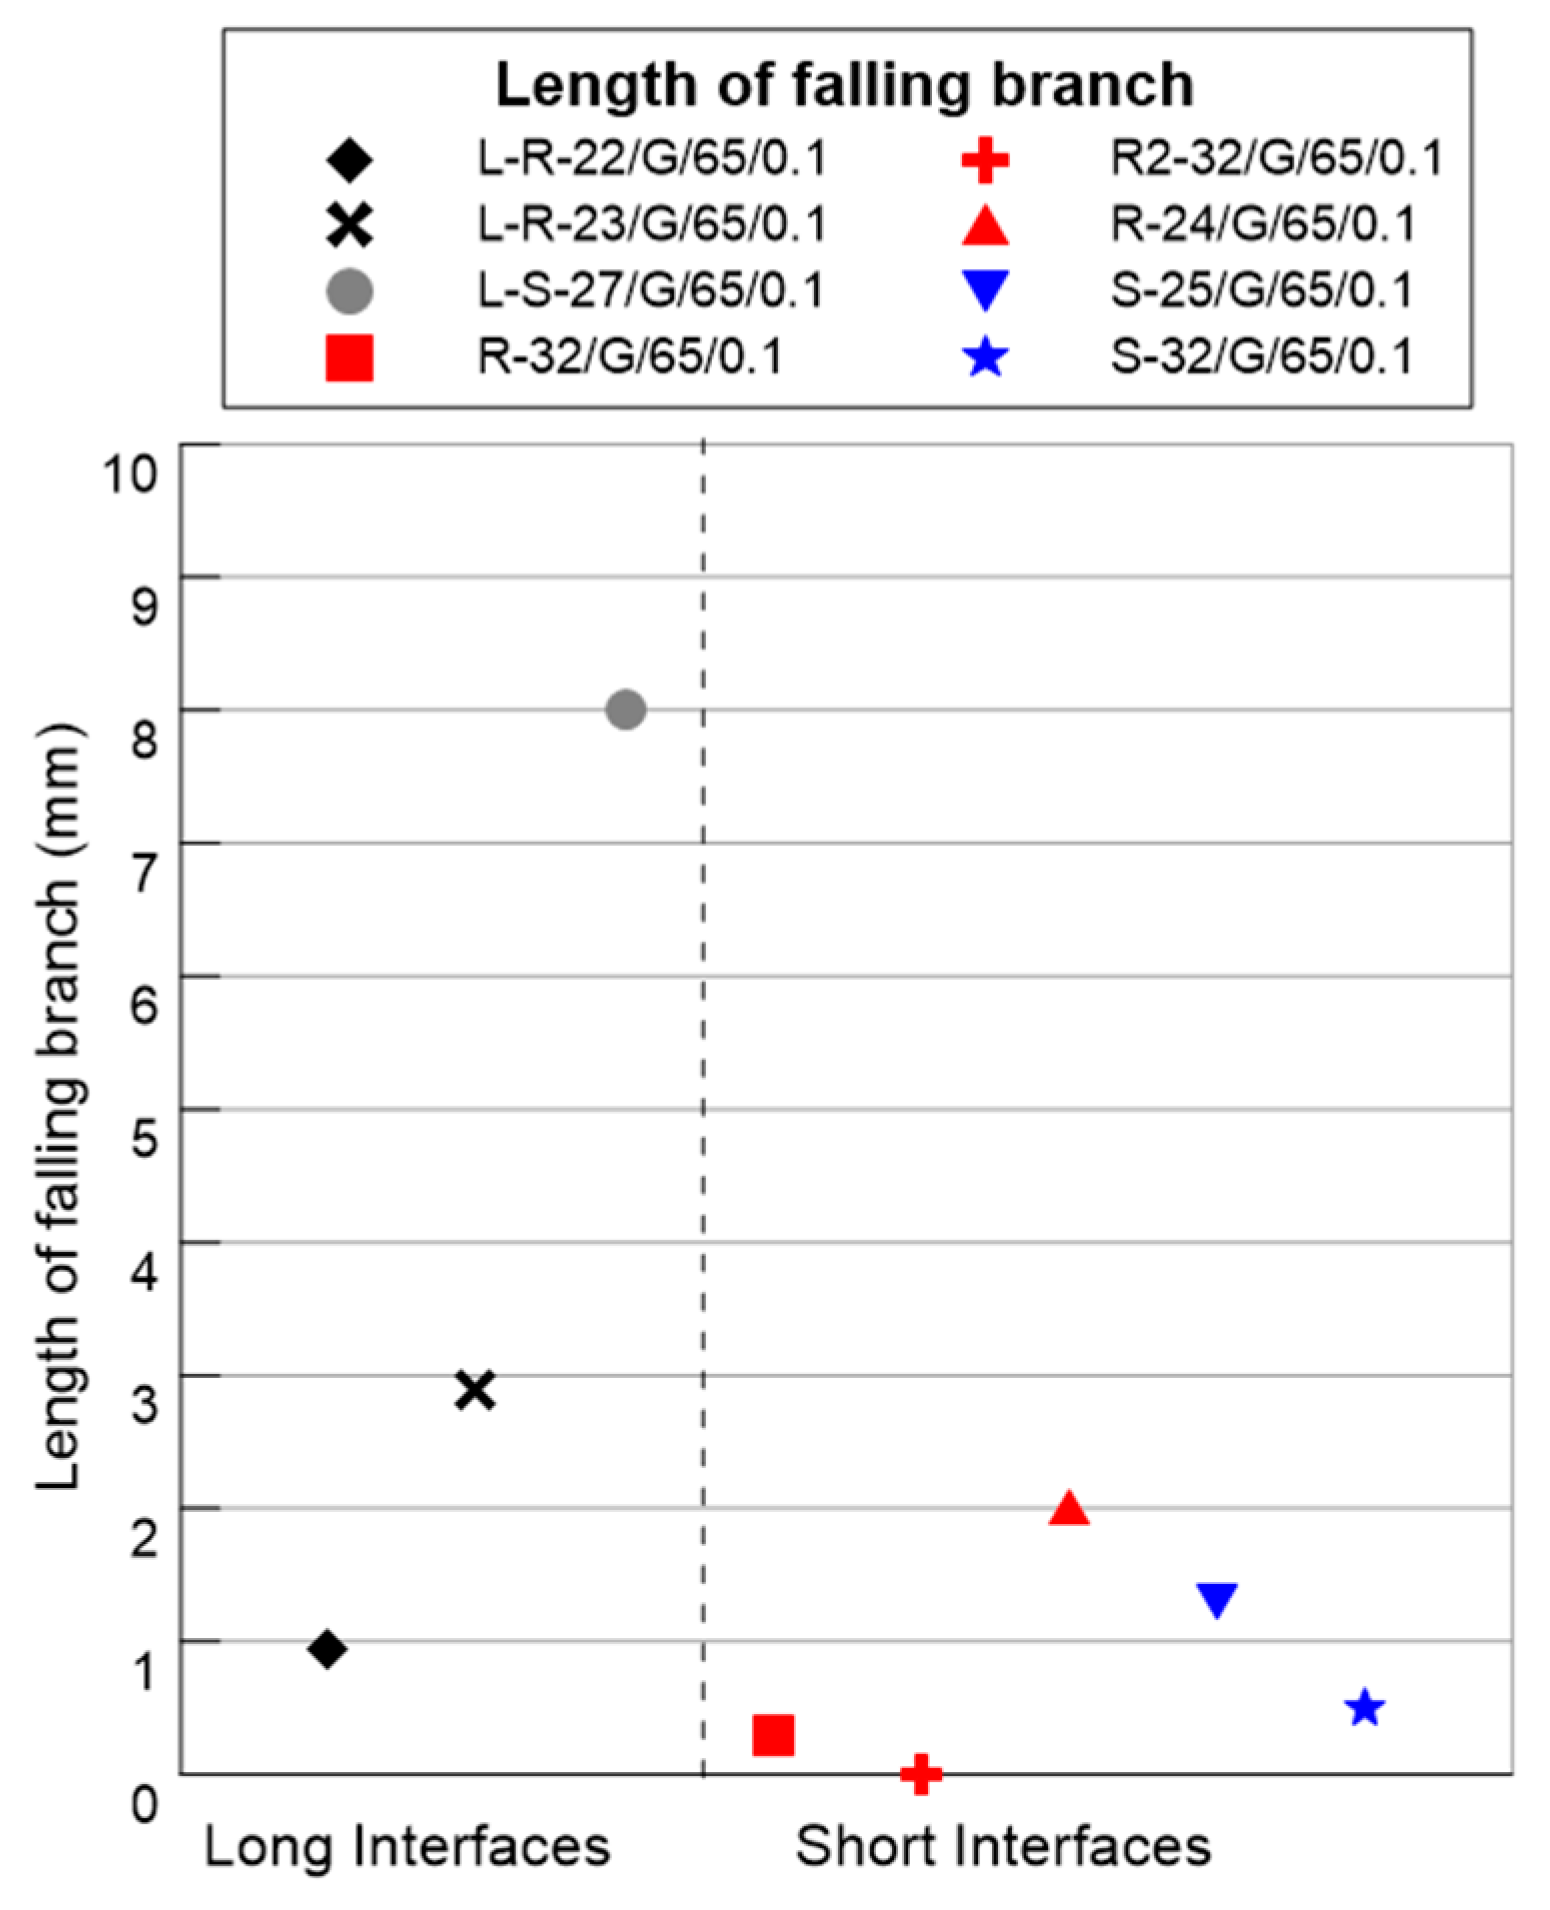
- Rough long interfaces (in contrast to rough short interfaces) activated their maximum resistance at small values of imposed shear slip (of the order of 0.10 mm), at which point only a crack along the interfaces occurred. After that, the response was shown as smoothly degrading. The primary crack was that developed along the interface, whereas a crack parallel to the interface (concrete cone) and, in one case, also concrete struts in the old part, appeared at an advanced state of imposed shear slip.
- Although the results of only one smooth long interface were available, the well-known dependence of the maximum resistance on the interface roughness was confirmed. Indeed, when roughness was reduced, the maximum resistance was reduced, while the corresponding shear slip tended to increase, and the overall behavior was stable.
- The limited embedment length of the steel screws led to their pronounced pullout, documented by the large values of residual crack openings at zero shear slip. Furthermore, in contrast to interfaces crossed by post-installed steel reinforcing bars, where the governing mechanism was the clamping effect, in interfaces crossed by screws (either smooth or rough), the contribution of the dowel mechanism was enhanced.
- The asymmetry of resistance between the two loading directions, which was observed in short interfaces, was alleviated when long ones were concerned, for both levels of the examined roughness. Furthermore, the scatter of the results was limited among duplicate specimens. These observations served as strong indications of the redistribution capacity inside a system, evidencing that the behavior of groups of anchors was differentiated from that of single anchors, not in terms of maximum resistance, but in terms of overall behavior.
- The design equation developed by the authors, applied to predict the shear resistance of the specimens, was proven to be quite accurate.
Author Contributions
Funding
Institutional Review Board Statement
Informed Consent Statement
Data Availability Statement
Conflicts of Interest
References
- Palieraki, V.; Vintzileou, E.; Silva, J.F. Behavior of RC interfaces subjected to shear: State-of-the Art review. Constr. Build. Mater. 2021, 306, 124855. [Google Scholar] [CrossRef]
- Palieraki, V.; Vintzileou, E.; Silva, J.F. Interface Shear Strength under Monotonic and Cyclic Loading. ACI Struct. J. 2022, 119, 17–28. [Google Scholar]
- EOTA. Design and Requirement for Construction Works of Post-Installed Shear Connection for Two Concrete Layers: TR 066, April 2019–Amended November 2020; EOTA: Brussels, Belgium, 2020. [Google Scholar]
- Palieraki, V.; Oikonomopoulou, E.; Genesio, G.; Vintzileou, E. Experimental cyclic behavior of concrete interfaces with postinstalled reinforcing bars or alternative connectors. Struct. Concr. 2023, 24, 5265–5283. [Google Scholar] [CrossRef]
- Choi, D.U.; Fowler, D.W.; Jirsa, J.O. Interface shear strength of concrete at early ages. ACI Struct. J. 1999, 96, 343–348. [Google Scholar]
- Choi, D.U.; Jirsa, J.O.; Fowler, D.W. Shear transfer across interface between new and existing concretes using large powder-driven nails. ACI Struct. J. 1999, 96, 183–192. [Google Scholar]
- Saari, W.K.; Hajjar, J.F.; Schultz, A.E.; Shield, C.K. Behavior of shear studs in steel frames with reinforced concrete infill walls. J. Constr. Steel Res. 2004, 60, 1453–1480. [Google Scholar] [CrossRef]
- Wallenfelsz, J.A. Horizontal Shear Transfer for Full-Depth Precast Concrete Bridge Deck Panels. Master’s Thesis, Virginia Polytechnic University, Blacksburg, VA, USA, 2006. [Google Scholar]
- Alkatan, J. FRP Shear Transfer Reinforcement for Composite Concrete Construction. Master’s Thesis, University of Windsor, Windsor, ON, Canada, 2016. [Google Scholar]
- Menkulasi, F.; Roberts-Wollmann, C.L. Behavior of Horizontal Shear Connections for Full-Depth Precast Concrete Bridge Decks on Prestressed I-Girders. PCI J. 2005, 50, 60–73. [Google Scholar] [CrossRef]
- Kamel, M.R. Innovative Precast Concrete Composite Bridge Systems. Ph.D. Thesis, Lincoln, University of Nebraska, Lincoln, NE, USA, 1996. [Google Scholar]
- Cattaneo, S.; Zorzato, G.; Bonati, A. Assessing method of shear strength between old to new concrete interface under cyclic loading. Constr. Build. Mater. 2021, 309, 125160. [Google Scholar] [CrossRef]
- ASTM E965-96; Standard Test Method for Measuring Pavement Macrotexture Depth Using a Volumetric Technique. ASTM International: West Conshohocken, PA, USA, 1996; Volume 04.03.
- Mishima, T.; Suzuki, A.; Shinoda, Y.; Maekawa, K. Nonelastic Behavior of Axial Reinforcement Subjected to Axial and Slip Deformation at the Crack Surface. ACI Struct. J. 1995, 92, 380–385. [Google Scholar]
- Randl, N. Untersuchungen zur Kraftubertragung zwischen Alt- und Neubeton bei Unterschiedlichen Fugenrauhigkeiten. Ph.D. Thesis, Universitat Innsbruck, Innsbruck, Austria, 1997. (In German). [Google Scholar]
- Vintzeleou, E.N.; Tassios, T.P. Behavior of Dowels under Cyclic Deformations. ACI Struct. J. 1987, 84, 18–30. [Google Scholar]
- Vintzileou, Ε.; Palieraki, V.; Oikonomopoulou, E. Reinforced concrete interfaces: Contribution of the two shear mechanisms based on measured steel strains. In Proceedings of the 17th World Conference on Earthquake Engineering, Sendai, Japan, 27 September–2 October 2021. [Google Scholar]
- Mohyeddin, A.; Gad, E.F.; Lee, J. Failure modes and tensile strength of screw anchors in non-cracked Concrete. Constr. Build. Mater. 2019, 221, 501–513. [Google Scholar] [CrossRef]
- Fib Model Code for Concrete Structures 2010; International Federation for Structural Concrete: Lausanne, Switzerland, 2013.
- Vintzileou, E.; Silva, J.F. Modeling Reinforced Interfaces-Cold Joints Subjected to Cyclic Shear. ACI Struct. J. 2022, 119, 225–238. [Google Scholar]
- Vintzileou, Ε.; Genesio, G.; Oikonomopoulou, E.; Palieraki, V. Alternative Connectors for Seismic Interface Shear Applications. In Proceedings of the 17th World Conference on Earthquake Engineering, Sendai, Japan, 27 September–2 October 2021. [Google Scholar]
- Fuchs, W.; Eligehausen, R.; Breen, J.E. Concrete Capacity Design (CCD) Approach for Fastening to Concrete. ACI Struct. J. 1995, 91, 73–94. [Google Scholar]


| Diameter, d (mm) | 10 |
| Characteristic value of yield strength, fsy (MPa) | 690 |
| Characteristic value of tensile strength, fsu (MPa) | 805 |
| Yield strain, εy (‰) | 3.45 |
| Embedment into old concrete block (mm) | 67 |
| Embedment into new concrete block (mm) | 65 |
| Specimen | Number of Connectors | ρ (%) | ρfsy | Roughness (mm) | fc,old (MPa) | fc,new (MPa) | τu (MPa) | τu,calc (MPa) | τu/τu,calc |
|---|---|---|---|---|---|---|---|---|---|
| L-R-22/G/65/0.1 | 10 | 0.218 | 1.50 | 2.84 | 22 | 26 | 1.36 | 1.18 | 1.15 |
| L-R-23/G/65/0.1 | 10 | 0.218 | 1.50 | 2.66 | 23 | 27 | 1.63 | 1.22 | 1.34 |
| L-S-27/G/65/0.1 | 10 | 0.218 | 1.50 | Smooth | 30 | 27 | 0.88 | 0.81 | 1.09 |
| R-32/G/65/0.1 | 3 | 0.236 | 1.63 | 6.82 | 32 | 42 | 1.64 | 1.63 | 1.00 |
| R2-32/G/65/0.1 | 3 | 0.236 | 1.63 | 5.46 | 32 | 42 | 1.66 | 1.63 | 1.02 |
| R-24/G/65/0.1 | 3 | 0.236 | 1.63 | 1.60 | 24 | 40 | 1.53 | 1.30 | 1.18 |
| S-25/G/65/0.1 | 3 | 0.236 | 1.63 | Smooth | 25 | 43 | 1.28 | 0.81 | 1.58 |
| S-32/G/65/0.1 | 3 | 0.236 | 1.63 | Smooth | 32 | 43.5 | 0.74 | 0.97 | 0.76 |
| Specimen | τu (MPa) | su (mm) | wu (mm) | Damage (at τu) | smax,cyclic (mm) | Length of the Falling Branch (mm) | Damage at Test Termination |
|---|---|---|---|---|---|---|---|
| L-R-22/G/65/0.1 | 1.36 | 0.10 | 0.07 | Crack along the interface | 1.05 | 0.95 | Crack along the interface, crack parallel to the interface (concrete cone) in the old part |
| L-R-23/G/65/0.1 | 1.63 | 0.10 | 0.01 | Crack along the interface | 3.00 | 2.90 | Diagonal cracks (concrete struts) in the old part, crack parallel to the interface (concrete cone) in the old part |
| L-S-27/G/65/0.1 | 0.88 | 3.00 | 0.54 | Crack along the interface | 11.00 | 8.00 | Crack along the interface and connectors’ fracture |
| R-32/G/65/0.1 | 1.64 | 1.10 | 3.12 | Crack along the interface, crack parallel to the interface in the old part, diagonal crack in the new part | 1.40 | 0.30 | Crack parallel to the interface in the old part, diagonal crack in the new part |
| R2-32/G/65/0.1 | 1.66 | 1.50 | 2.87 | Crack along the interface, crack parallel to the interface (concrete cone) in the old part | 1.50 | 0 | Crack parallel to the interface (concrete cone) in the old part |
| R-24/G/65/0.1 | 1.53 | 1.20 | 0.91 | Crack along the interface | 3.20 | 2.00 | Crack parallel to the interface (concrete cone) in the old part |
| S-25/G/65/0.1 | 1.28 | 1.70 | 0.71 | Crack along the interface | 3.00 | 1.30 | Diagonal crack in the new part |
| S-32/G/65/0.1 | 0.74 | 1.20 | 0.58 | Crack along the interface, diagonal crack in the new part | 1.70 | 0.95 | Diagonal crack in the new part |
Disclaimer/Publisher’s Note: The statements, opinions and data contained in all publications are solely those of the individual author(s) and contributor(s) and not of MDPI and/or the editor(s). MDPI and/or the editor(s) disclaim responsibility for any injury to people or property resulting from any ideas, methods, instructions or products referred to in the content. |
© 2024 by the authors. Licensee MDPI, Basel, Switzerland. This article is an open access article distributed under the terms and conditions of the Creative Commons Attribution (CC BY) license (https://creativecommons.org/licenses/by/4.0/).
Share and Cite
Oikonomopoulou, E.; Palieraki, V.; Vintzileou, E.; Genesio, G. Cyclic Behavior of Long Concrete Interfaces Crossed by Steel Screws. Appl. Sci. 2024, 14, 8246. https://doi.org/10.3390/app14188246
Oikonomopoulou E, Palieraki V, Vintzileou E, Genesio G. Cyclic Behavior of Long Concrete Interfaces Crossed by Steel Screws. Applied Sciences. 2024; 14(18):8246. https://doi.org/10.3390/app14188246
Chicago/Turabian StyleOikonomopoulou, Erato, Vasiliki Palieraki, Elizabeth Vintzileou, and Giovacchino Genesio. 2024. "Cyclic Behavior of Long Concrete Interfaces Crossed by Steel Screws" Applied Sciences 14, no. 18: 8246. https://doi.org/10.3390/app14188246