Article

DOUNet: Dynamic Optimization and Update Network for Oriented Object Detection

1
Heilongjiang Provincial Key Laboratory of Complex Intelligent System and Integration, School of Automation, Harbin University of Science and Technology, Harbin 150080, China
2
School of Computer Science and Technology, Harbin University of Science and Technology, Harbin 150080, China
*
Author to whom correspondence should be addressed.
Appl. Sci. 2024, 14(18), 8249; https://doi.org/10.3390/app14188249
Submission received: 28 June 2024 / Revised: 5 September 2024 / Accepted: 11 September 2024 / Published: 13 September 2024
(This article belongs to the Section Electrical, Electronics and Communications Engineering)

Abstract

:
Object detection can accurately identify and locate targets in images, serving basic industries such as agricultural monitoring and urban planning. However, targets in remote sensing images have random rotation angles, which hinders the accuracy of remote sensing image object detection algorithms. In addition, due to the long-tailed distribution of detected objects in remote sensing images, the network finds it difficult to adapt to imbalanced datasets. In this article, we designed and proposed the Dynamic Optimization and Update network (DOUNet). By introducing adaptive rotation convolution to replace 2D convolution in the Region Proposal Network (RPN), the features of rotating targets are effectively extracted. To address the issues caused by imbalanced data, we have designed a long-tail data detection module to collect features of tail categories and guide the network to output more balanced detection results. Various experiments have shown that after two stages of feature learning and classifier learning, our designed network can achieve optimal performance and perform better in detecting imbalanced data.

1. Introduction

Remote sensing images, as one of the important sources of information for Earth observation and resource management, can provide accurate surface information and serve industries such as agricultural monitoring, urban planning, environmental protection, and disaster response. In recent years, object detection methods based on convolutional neural networks have brought significant breakthroughs in the utilization of remote sensing image information due to their high efficiency and ease of training [1]. How to use deep learning to complete remote sensing image object detection tasks has also become a hot research topic.
Unlike natural images, in remote sensing images, due to the detected categories being severely imbalanced and the angle distribution of objects being random, it is usually necessary to use rotated rectangular boxes to accurately represent them. Due to the dense arrangement of objects, the dataset in remote sensing images exhibits an inherent long-tail distribution. The categories occupying the top are usually a few densely arranged categories, while most other categories only occupy a small part of the dataset.
Derived from horizontal detection algorithms, five-parameter representation with anchor boxes is usually used for representation, such as the one-stage network Rotated RetinaNet [2] and two-stage network Rotated Faster R-CNN [3]. In addition, other networks use anchor-free box methods, such as Oriented Reppoints and Rotated Reppoints [4] based on adaptive point representation. Although these methods address the issue of representing rotating targets, they do not take into account the impact of imbalanced data on detection accuracy. This can cause convolutional neural networks to lean towards the head of the dataset, while for the tail categories of the dataset, due to insufficient learning of features, the detection accuracy will be greatly reduced.
Secondly, due to the wide variety of objects detected in remote sensing images, the detected objects usually have a large-scale distribution, from larger tennis courts and football fields to smaller vehicles, different types of objects require different contextual information, and objects of various sizes require different receptive fields. This not only leads to different representation methods for objects but also results in poor performance of a series of feature extraction methods designed based on horizontal object detection. Therefore, scholars have used this idea to design many feature extraction methods, such as LSKNet [5] and PKINet [6], to customize receptive fields and feature extraction methods for different types of objects. However, these authors have noted the performance impact of target scale changes on the detection performance of the detector. They do not take into account the impact of the rotation features of the target on the detection accuracy.
In addition, due to the target being detected as having a certain rotation angle, using only regular convolutions and feature fusion methods will reduce the efficiency of feature extraction. Based on this idea, convolutions that can extract rotational features were designed, such as ARCNet [7], S2A-Net [8], ReDet [9], etc. They did not consider the different receptive fields required to detect targets of different scales and categories.
Summarizing the research content of previous scholars, we found that some factors still affect the accuracy of the detection process on remote sensing images, and based on this, we designed corresponding methods to solve the following problems:
(1)
Previous research on feature extraction and fusion of rotating targets was not sufficiently comprehensive. In response to this issue, we combined previous research results and added both large kernel convolution and rotation convolution to the network, modified the backbone network and feature fusion network, and designed an effective feature extraction method.
(2)
Previous studies did not take the impact of dataset imbalance on detection accuracy into account. To this end, we have designed a detection framework for long-tailed datasets to address data imbalance.
Our key contributions are outlined as follows:
  • We use large kernel convolution to expand the receptive field of the network, thereby obtaining a wide range of contextual information. In the Region Proposal Network (RPN), rotational convolution is used to extract rotating targets with different angles.
  • We propose a long-tail data detection module that measures categories with different levels of imbalance, fine-tuning the trained model through loss weighting and frozen training. In addition, we have added a feature generator to generate robust features for network training.
  • We propose a new network called the Dynamic Optimization and Update network (DOUNet) and demonstrate the effectiveness of our proposed method through ablation experiments and comparative experiments. The experimental results show that our proposed model performs better than the baseline model and has significantly higher accuracy in tail categories than other networks.
The rest of this paper is organized as follows. Section 2 introduces the various difficulties and solutions of rotating object detection compared to horizontal object detection, and summarizes the detection methods for imbalanced datasets. Section 3 introduces our proposed method, including the detailed design of the network, the principles of the detector, and the calculation of the loss function. Section 4 introduces the detailed experimental setup, including the selection of evaluation indicators, qualitative and quantitative analysis, as well as visualization analysis and indicator results. Finally, we discuss the results in Section 5 and summarize the main contributions of this paper in Section 6.

2. Related Work

2.1. Target Detection in Remote Sensing Images

Different from conventional images, remote sensing images typically contain multi-channel, multispectral, and large-scale information. The target information usually contains characteristics such as multiple scales, dense arrangement, random direction, and high background noise. For rotating targets in remote sensing images, their morphology changes greatly, and detection difficulty is high. Many scholars have made improvements to existing algorithms to address these issues.
Many authors have provided meaningful work on target representation and loss function optimization in rotating object detection problems. Rotated RetinaNet [2] detects rotating targets by directly regressing five parameters. Oriented R-CNN [10] avoids boundary problems caused by five-parameter representation by using Midpoint Offset Representation during the region proposal stage. CSL [11] avoids the issue of angle periodicity by transforming the regression process into a classification process. PSC [12] avoids angle period issues by adding angle encoding. GWD [13], KLD [14], and KFIoU [15] avoid the periodic problem of angles by converting rotating rectangles into Gaussian distributions. These works have to some extent solved the feature extraction problem of rotating targets, but have not considered the scale distribution of the targets.
In addition to this work, other scholars have proposed feature extraction and representation methods that differ from horizontal object detection. The LSK module is used in LSKNet [5] to efficiently extract multi-scale features. Rotational convolution is used in ARC [7] networks to extract rotated features. ReDet [9] extracts rotation-invariant features through rotation equivariant networks. S2A-Net [8] extracts accurate angle features through two rounds of regression. PKINet [6] extracts features of different scales through convolutions with different kernel sizes. These methods solve the problem of multi-scale extraction of targets but do not consider the rotation features of the targets.

2.2. Detection of Long-Tail Imbalanced Datasets

The dataset in remote sensing images is usually imbalanced, which is in line with the distribution patterns of different categories of objects in real life. However, if we directly use these data to train the network without any data preprocessing, it will lead to overfitting of the classifier to frequently occurring categories and underfitting to tail categories. Therefore, how to train a class-balanced classifier using imbalanced data has great research significance.
For data with imbalanced samples, a common method is to use resampling and reweighting. However, their essence is to reverse-weight the sampling frequency of different categories based on the ground truth instances. Equalization Loss (EQL) achieves the effect of balancing the detector by alleviating gradient suppression from the head class to tail class. EQLv2 [16] uses gradient-guided methods to re-measure the weight of losses caused by different categories, which is more effective than EQL [17]. Some scholars have also explained the problem of long-tailed distribution from a non-statistical perspective and proposed Adaptive Class Suppression Loss [18].
Inspired by Focal Loss, Equalized Focal Loss [19] achieves balanced detection by designing a hyperparameter based on changes in class imbalance to apply different weights to samples of different categories. DisAlign [20] proposed a generalized reweighting method for balancing classes before loss calculation. BACL [21] achieves balance detection by reverse-weighting the imbalance of statistical samples. However, the above research contents are all within the scope of horizontal object detection, and there are still gaps in the research scope of rotating object detection for remote sensing images.

3. The Proposed Method

3.1. The Proposed Detector

The overall structure of the Dynamic Optimization and Update network adopts a two-stage object detection algorithm, as shown in Figure 1; the DOUNet consists of four parts: the backbone, neck, Region of Interest (ROI) head, and Region Proposal Network (RPN) head. Among them, the backbone of the network uses the Large Selective Kernel Network (LSKNet) to extract features of objects of different scales. Rotational convolution is added to the neck of the network to extract features of rotating targets, and to improve the accuracy of network feature extraction. In addition, we have added a feature enhancement module to the RPN header and designed a loss weighting module that can adapt to changes in data deviation to facilitate network learning of tail category features. Next, we will provide a detailed introduction to the specific design details of each section.

3.2. LSK Module for Multi-Scale Feature Extraction

The backbone of the network adopts the convolutional neural network model LSKNet [5], which performs well in feature extraction and performance improvement. Its backbone network is built by stacking Large-Scale Kernel (LSK) blocks. The LSK block model is shown in Figure 2. The LSK module mainly consists of two parts: the large kernel feature extraction module and the scale selection module.
Among them, the large kernel feature extraction module consists of a convolution kernel of size 5 × 5, and a dilated convolution kernel of size 7 × 7 with a dilation rate of 3, which is the same as the LSKNet. Concatenate convolutions with different dilation rates can minimize the number of parameters while maximizing the receptive field of the convolutional kernel. Among them, the receptive field of the first-layer convolution is 5, and according to Equation (1), the receptive field of the second-layer convolution can be further calculated to be 23. In Equation (1), k i represents the size of the i-th convolutional kernel, R F represents the receptive field, and d i represents the dilation rate of the i-th convolutional kernel.
R F i = k 1 , i = 1 d i ( k i 1 ) + R F i 1 , i > 1
The attention module outputs attention information by using average pooling and maximum pooling on the input feature maps. The scale selection module weights the corresponding feature maps through attention information.
The output of the LSK module refers to the design of the residual network, which is the superposition of three-scale information. This approach can quickly help the network converge while extracting multi-scale features.

3.3. Rotation Convolution for Oriented Feature Extraction

The design of the LSK module and the proposal of the backbone network LSKNet have certainly solved the problem of low efficiency in multi-scale feature extraction to a certain extent. However, due to the lack of consideration that the detected targets in remote sensing images are rotating, only 2D convolutions are used for feature extraction and fusion. This approach to some extent reduces the efficiency and accuracy of network learning features. Therefore, we drew inspiration from the aligned convolution in S2A-Net and extended the application range of ARC convolution to rotation convolutions of any size.
Firstly, the network uses the input layer x to predicts the rotation angle θ and the corresponding weights w for each rotation angle through a simple set of regression networks, as shown in Equation (2). Then, based on the corresponding rotation angle and weight, feature extraction is performed. This process can be described in language as rotating the feature map by a certain angle and then using 2D convolutions for feature extraction. However, because the size of the input layer is often much larger than the size of the convolution, this can lead to an exponentially increased computational workload. Therefore, an efficient method is to rotate the convolution kernel in the opposite direction and then use the rotated convolution kernel to extract the feature map. This process is shown in Equation (3). In the equation, × is the operator that weights the convolution results using the weight w i . W represents the weight of the original 2D convolution kernel, the rotate operator rotates the original weights by a certain angle θ which ranges from −40 degrees to 40 degrees, and the output feature map is represented as x which is the weighted result of x i . Note that the entire process of convolution and weighting is linear, so it can be further simplified as shown in Equation (4). In this way, we only need to calculate the weight of the transformed convolutional kernel and extract the feature map once to solve this task, greatly reducing the computational workload.
w i , θ i = f ( x )
x = i = 1 n x i = i = 1 n w i × c o n v 2 d ( r o t a t e ( W , θ i ) , x )
x = c o n v 2 d ( i = 1 n w i × r o t a t e ( W , θ i ) , x )
The weight calculation process of the convolutional kernel is shown in Figure 3. This process is equivalent to the alignment convolution operation in S2A-Net. Firstly, we treat the original weights in the original convolution kernel as reference points and use bilinear interpolation to unfold them into an image. Next, we calculate the distance between each weight point and the center point of the image, and rotate this vector by the corresponding angle, as shown in Equation (5). Finally, we use the rotated reference points to sample the original image and ultimately obtain the rotated convolutional kernel weights.
r o t a t e ( W i , θ ) = s a m p l i n g x c e n t e r y c e n t e r + cos θ sin θ sin θ cos θ x i x c e n t e r y i y c e n t e r
Compared to 2D convolution, using this method for convolution operations greatly enhances the feature capture ability of the convolution kernel for rotating features, making the network more accurate in recognizing rotating targets. This rotation feature extraction method can be applied to convolutions of any size and with any dilation rate. Compared to the original convolutions, it has wider universality and more adjustable parameters.

3.4. Long-Tail Data Detection Module

As stated in the introduction, although significant progress has been made in solving the problem of representing rotating targets, there is relatively little research on data imbalance. To prevent the serious consequences of poor network classification performance caused by excessive reliance on data in the dataset, we borrowed some ideas from long-tail object detection and applied them to rotating object detection. The network framework is shown in Figure 4.
Our main idea is to design a module that can dynamically adjust the corresponding weights based on sample distribution and network learning. To achieve this, we divide the entire network learning process into two stages. The first stage is the feature learning stage, during which we perform routine network training. The second stage is the classifier learning stage. We freeze the feature extraction network and only train the RPN network and Box classifier to fine-tune the weights in the network, achieving the goal of selective learning for tail class samples. The classifier learning stage uses two modules: one is the feature generation module, and the other is the foreground category loss calculation module. To accurately estimate the category of the tail, we also introduced a group of short-term indicator pairs. Below, we will provide a detailed introduction to these concepts.

3.4.1. Feature Generation Module

The main function of this module is to generate fake features for the tail categories in the dataset, preventing the classifier from overfitting small category samples, and helping the network learn more robust features. This module works on the ROI feature extractor of the network and performs data enhancement operations on the proposed area generated by the original RPN classifier. To generate better pseudo labels without losing the features of the original category of objects, we forge the original label multiple times and send it to the network for feature extraction to collect the forged features. The data augmentation operation is described mathematically as shown in Equation (6). In the equation, x , y , w , h , θ represents the center point (x,y), width (w), height (h), and rotation angle (θ) of the original label and the random number η ranges from −1 to 1, which randomly offsets the length, width, and rotation angle of the object in the original label relative to itself within plus or minus 1/6, and randomly offsets the angle within plus or minus π/12. As shown in Figure 5, the pseudo labels generated after offset are not significantly different from the original labels in terms of visual results. But certain differences were retained.
l a b e l = ( x , y , w + η 1 6 w , h + η 2 6 h , θ + η 3 π 12 θ )
After feature extraction, the pseudo labels will be collected for generating pseudo features. It should be noted that we use a decay process with momentum to collect the mean and variance of features corresponding to each category. The advantage of doing this is that it can enable the network to quickly adapt to the characteristics of the current sample without losing previously learned features too quickly. The specific implementation process is shown in Equation (7). In the equation, μ , σ are the mean and variance of the accumulated features and u , v are the mean and variance of the current feature. When this part of the features needs to be used later, the approximate feature distribution can be restored to the original through Equation (8); in the equation, f i is the approximate feature and ε is data that follow the standard normal distribution.
μ i 0.9 μ i + 0.1 u i σ i 0.9 σ i + 0.1 v i
f i = μ i + ε × σ i , ε Ν 0 , 1

3.4.2. Foreground Category Loss Calculation Module

Due to the use of online methods for data augmentation and network training, accurately estimating tail categories during network training has become an important issue. The calculation of foreground categories also requires an estimation of the degree of imbalance between categories. To this end, we introduce the confusion matrix M as a long-term indicator to estimate the degree of imbalance in the dataset. In Equations (9) and (10), M i , j represents the confusion matrix value that belongs to category i but is predicted as category j. It can be calculated when the condition that label y is the i-th category holds. P is the prediction of the network, C represents the total number of categories, and n is an instance of the corresponding category under the current input. x is an operator that outputs 1 if and only if the input condition x holds. Specifically implemented in the program, we maintain a C × C two-dimensional array, representing the degree of imbalance between every two types of samples counted at the beginning of the network’s self-classifier learning stage. If M j , i > M i , j , it means that the i-th category (header data) is greater than the j-th category (tail data).
Meanwhile, we introduced short-term indicator pairs to represent the classification ability of the current stage network, as shown in Equation (11). In Equation (11), p ˜ i is the short-term indicator of category i, C is the total number of categories and p C + 1 is the predicted probability of the background category output by the network. These two indicators work together to monitor the learning status of different categories and guide the network in learning tail categories with poor classification performance.
M i , j = n p ¯ n , j y n , i = 1 n y n , i = 1
p ¯ n , j = exp ( z j ) k = 1 C exp ( z k )
p ˜ i = 1 p C + 1 p i , 1 i C p C + 1 , i = C + 1
The final network loss function design is shown in Equation (12). In the equation, w j is the weight for different classes, p j is corrected probability, and p ˜ t is set to 0.7 by default; this hyperparameter is only used in extreme cases where the confidence level of the network’s output data is not high, such as at the beginning of training or when the difficulty of classifying the current input samples is relatively high, resulting in a low confidence level of the network’s output. It is used to quickly converge the network and accelerate the learning process of tail categories. If category i is stronger than j, the margin δ i j is negative, guiding the network to output a larger output z j , resulting in a higher probability of obtaining p j during prediction. w j , δ i j , and p j are defined in Equations (13)–(15).
L c l s = log p i log 1 p C + 1 j = 1 , j i C w j log 1 p j
w j = 1 , p ˜ j p ˜ i 1 , p ˜ j p ˜ t 0 ,   otherwise  
δ i j = log M i , j M j , i
p j = 1 1 + exp z j + δ i j

4. Experiments

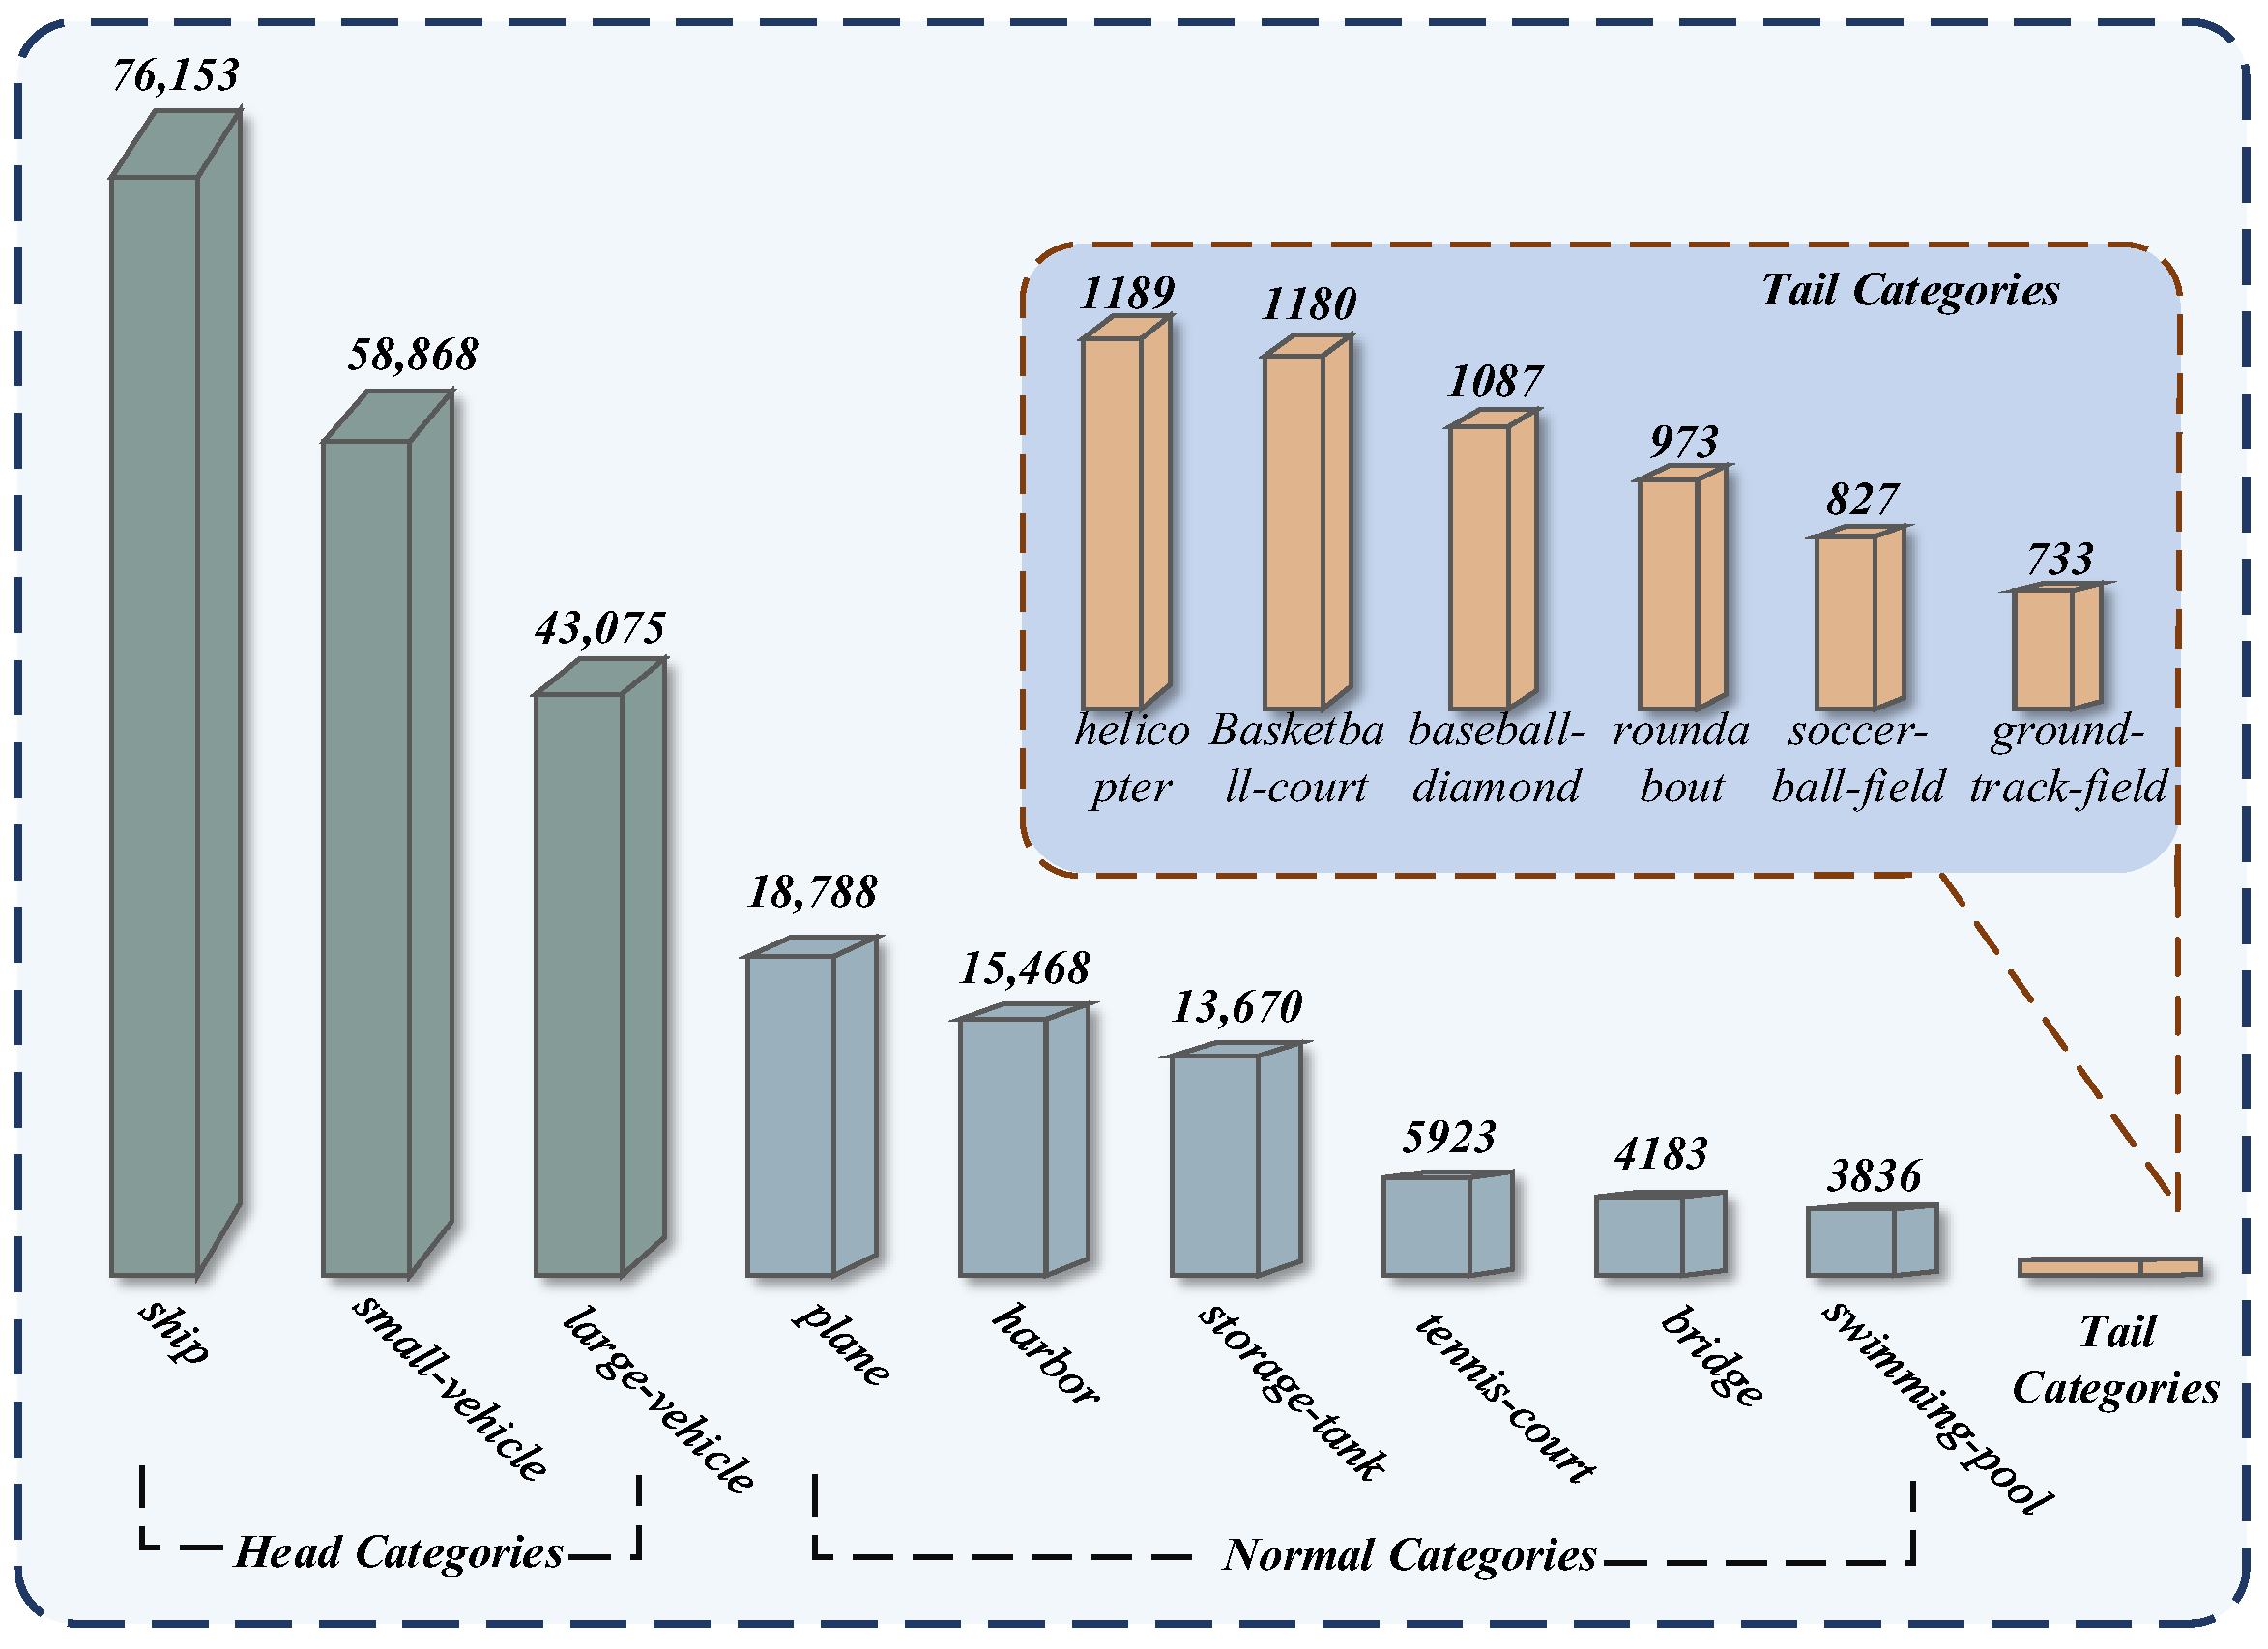
4.1. Dataset Introduction and Evaluation Indicators

We conducted experiments using the DOTA-v1.0 dataset. After preprocessing, the number of instances is 245,953, containing 15 categories. Among them, only small vehicles, large vehicles, and ships account for more than 10% of the dataset, and these three categories together account for 72.41% of the dataset, as shown in Figure 6. The samples of different categories in the dataset are severely imbalanced.
In the selection of evaluation indicators, we use the AP50, AP75, and mAP returned by the DOTA testing server as indicators. In addition, we have also customized three custom metrics: Average Precision of Tail Categories (APT), Average Precision of Tail and Normal Categories (APTN), and Average Precision of Head Categories (APH). Among them, APT represents the average accuracy of categories that account for less than 1% of the dataset. APTN represents the average accuracy of 12 categories except for three frequent categories. APH is the average accuracy of three frequent head categories. Since the DOTA testing server only returns the AP50 metric for each category, we also only use AP50 as the evaluation metric for the detector on the long tail dataset.

4.2. Implementation Details

4.2.1. Dataset Processing and Data Augmentation Operations

We use MMRotate for preprocessing and image segmentation operations on the DOTA dataset, which is a framework for orient object detection. We use default configuration files for data preprocessing operations, including dividing images into 1024 × 1024 sizes, filling small images with black, and clipping single-scale small images by overlapping 200 pixels in the larger image. Only random flipping is used in data augmentation operations, and no other data augmentation operations are used.

4.2.2. Environment and Experimental Setup

Except for special instructions, all experiments were trained and inferred using Python 3.8 and MMRotate 0.3.4 with PyTorch, the Windows 11 operating system, and an NVIDIA GeForce RTX 3090 GPU. All hyperparameters trained follow the default MMRotate configuration. The training batch size was set to 2 using the AdamW optimizer. The binary cross-entropy classification loss and the L1 regression loss function were used. In the classifier learning stage, extra freeze training for 12 epochs and the classification loss function are referred to in Section 3.4.2. The training and validation sets of DOTA were used as training data for fair comparison with other models in MMRotate. Unless otherwise specified, all models in the comparative experiment are default references to the author’s paper or publicly available data on GitHub. The backbone network LSKNet was pre-trained with 300 epochs on ImageNet. Due to the original author using 4 GPUs for the experiment and the lack of single-scale training results in the paper results, the learning rate was set to 5 × 10 5 after multiple optimizations to find the best learning rate, and a fair comparison was conducted on a single GPU. Finally, LSKNet-T was used as the baseline model and subjected to a fair comparison.

4.3. Ablation Study

The ablation experiment results are shown in Table 1. Among them, LSKNet is the baseline model, LSK-CLS represents the model trained after the classifier learning stage, LSK-ARC represents the result obtained by replacing the convolution of RPN layers with rotation convolution, and DOUNet represents the model trained with the classifier learning stage added to the previous model. From the detection results, the model with the addition of the classifier learning stage has significantly improved accuracy in tail categories, which also verifies the superiority of our method in dealing with long-tail data. In addition, the overall performance of the network has also been improved after adding rotation convolution, which also verifies the advantages of rotation convolution in extracting accurate features and improving the accuracy compared to 2D convolution.
To fairly compare the convergence efficiency of rotation convolution and 2D convolution, we chose the baseline model LSKNet-T without adding pre-training weights and replaced the large kernel convolution of the backbone network in the baseline model with rotation convolution, marked as LSKNet-ARC. From the experimental results shown in Table 2, adding rotation convolution can indeed improve the overall accuracy and convergence efficiency of the network, Frame Per Second (FPS), parameters, and Giga Floating-point Operations Per Second (GFLOPs) of the model shown in the table; it can be seen that after adding the rotation convolution, the computational load has significantly increased and the inference speed of the network has significantly decreased, but this has also resulted in higher detection accuracy.

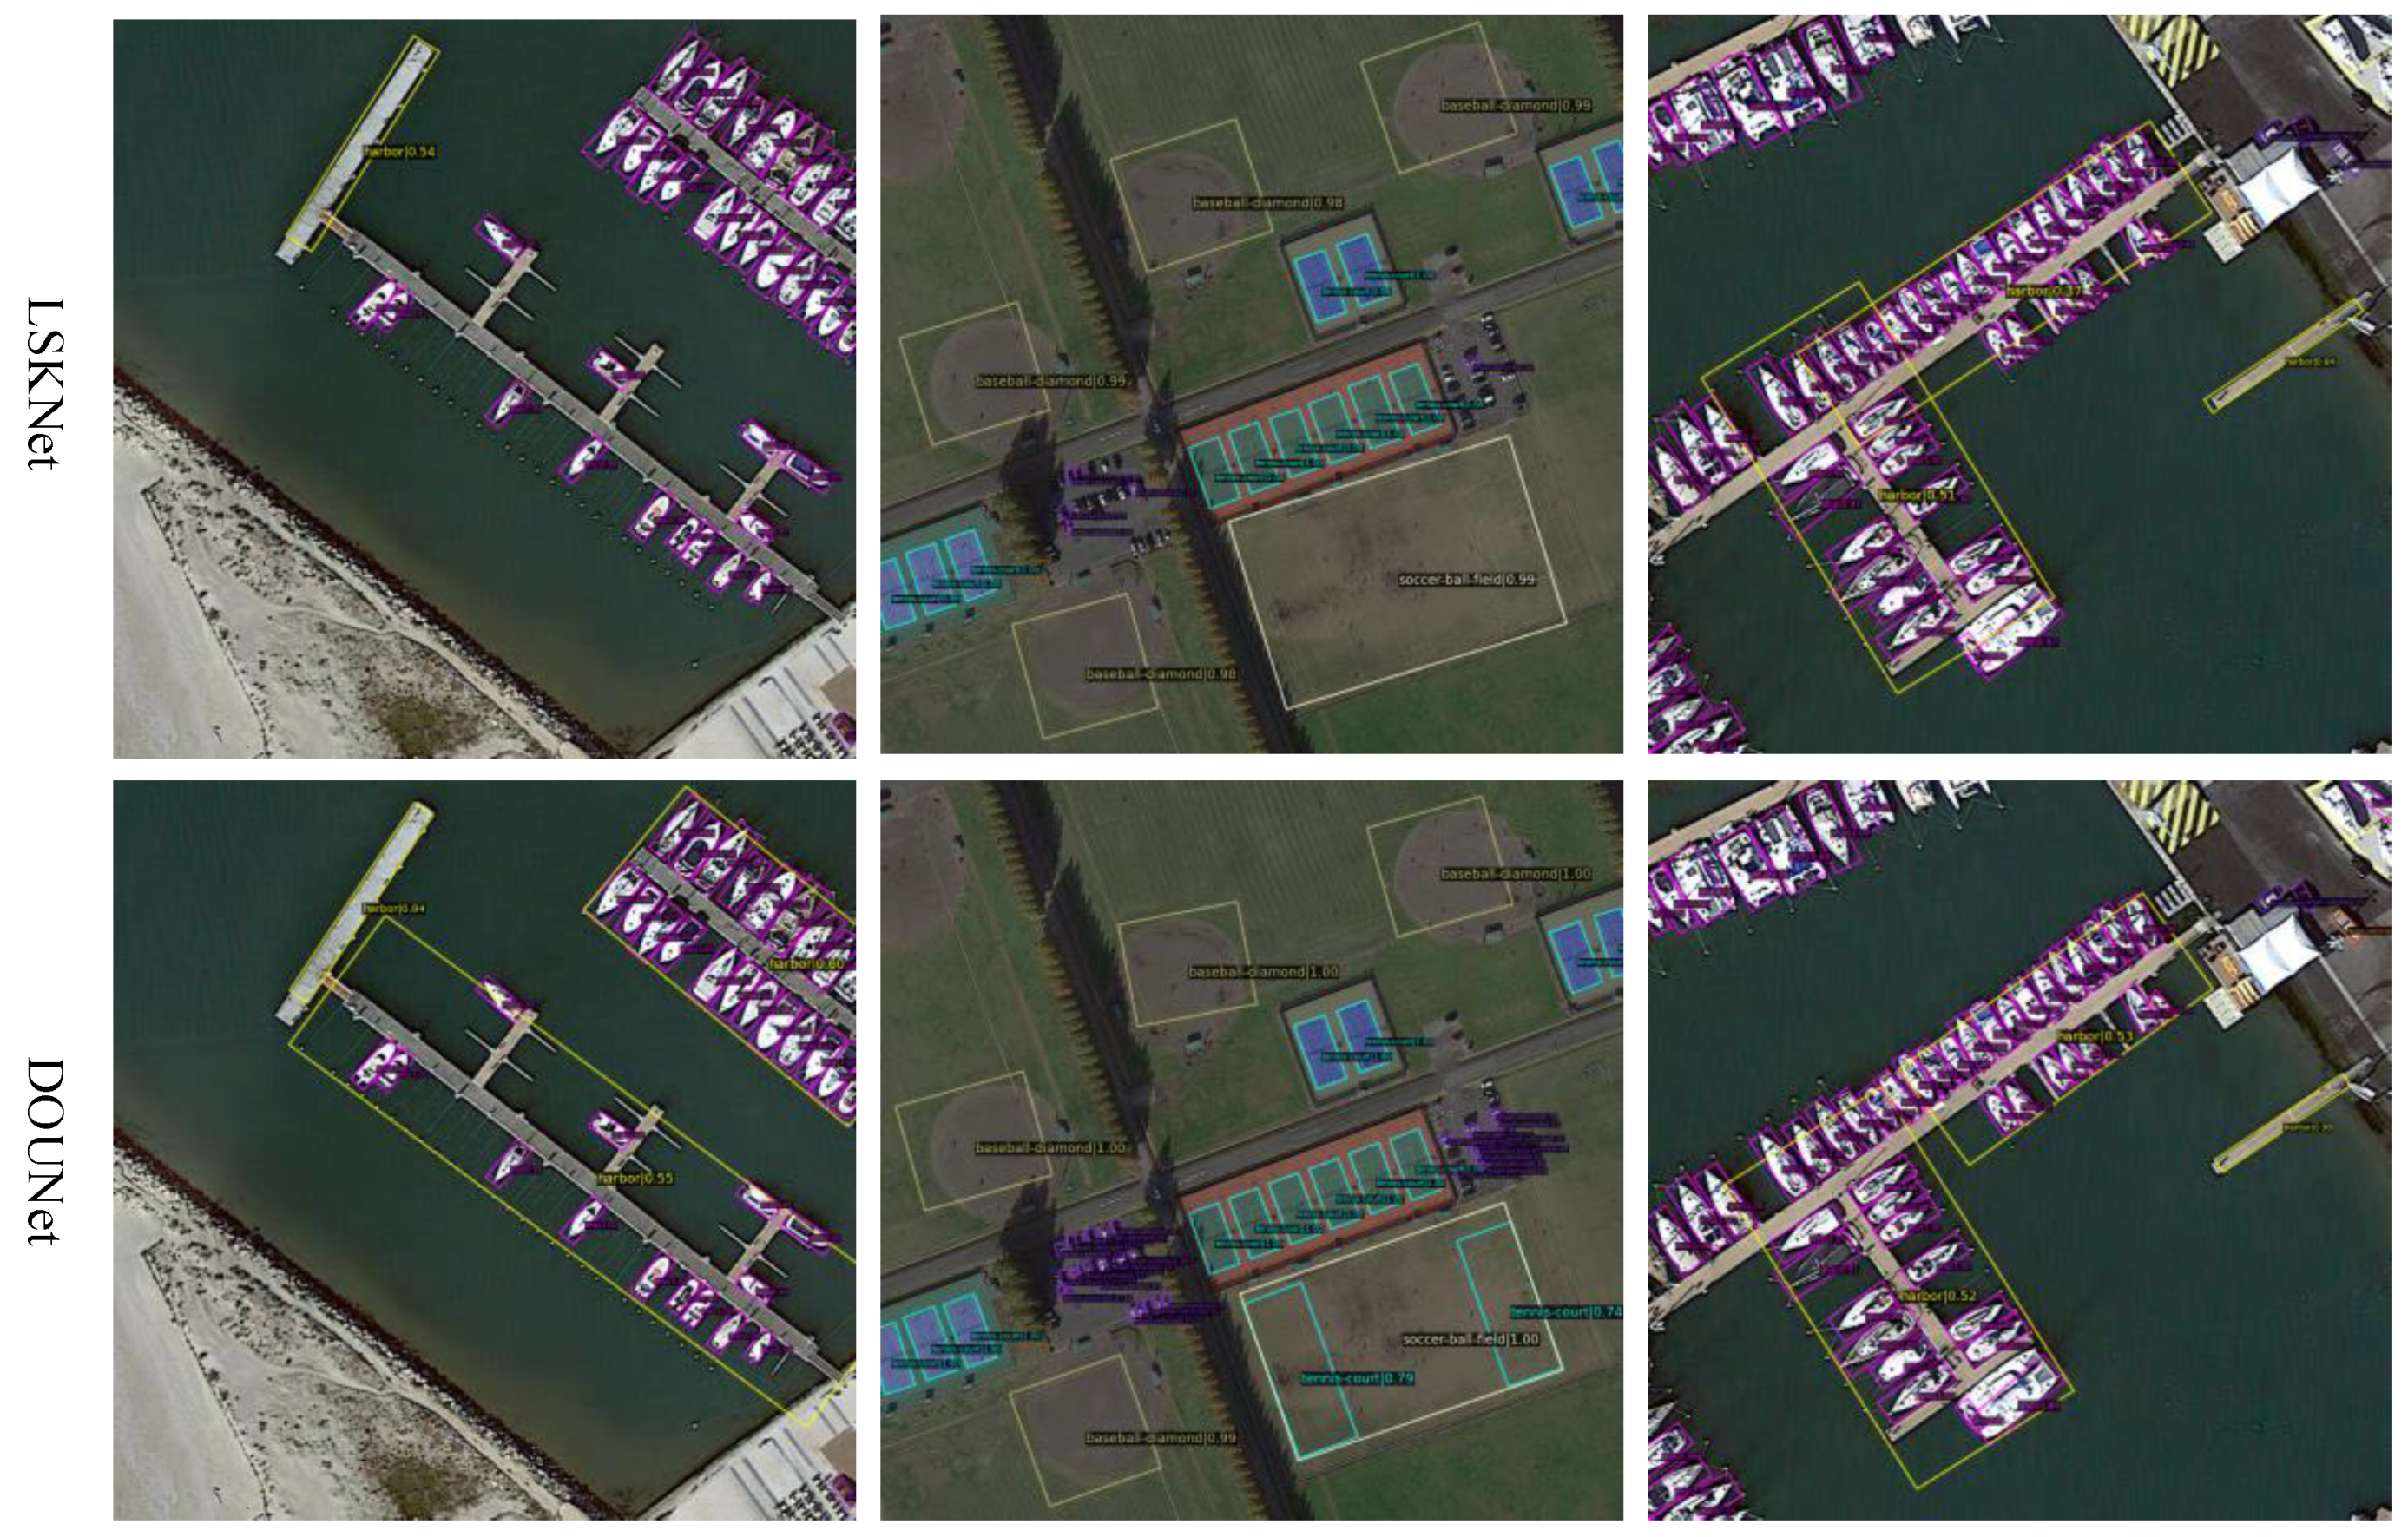
4.4. Comparison with Other Methods

We also conducted experiments to compare our model with other state-of-the-art methods. To ensure fairness, all models were loaded with pre-trained models and run for 12 epochs using the DOTA-1.0 single-scale train and val dataset. The evaluation metrics were tested on the undisclosed label test set. To compare the effectiveness of our proposed method in more detail, we added indicators and visual images of the head categories large vehicle (LV) and small vehicle (SV), regular categories harbor (HA) and bridge (BR), and tail categories basketball court (BC) and tennis court (TC) in the results. Both qualitative and quantitative results are shown in Figure 7 and Table 3. In Figure 7, comparing (a) and (b), for the head category, the improved network output has higher confidence, increasing the recall rate and the probability of misclassification. Therefore, from Table 3, the head category does not show significant improvement compared to LSKNet. From (c), due to the sensitivity of slender objects such as bridges to changes in angle, adding random angle offsets may increase the probability of false positives. From (d), for categories like the harbor, the detection effect is better than that of the bridge, and the indicators are also better. From (e) and (f), our improved network performs better in detecting samples of tail categories compared to the LSKNet. As can also be seen from Table 3, our network has higher detection accuracy. In summary, our network performs better in detecting tail categories than LSKNet.

5. Discussion

For remote sensing image object detection tasks, we use an improved LSKNet to complete the object detection task on long-tail datasets. Using LSKNet as the backbone of the network, more accurate features are obtained by adding rotational convolution to the RPN network. By using a simple regression network to predict the true rotation angle of feature maps and extending the idea of 2D convolution to rotation convolution, experiments have shown that our proposed rotation convolution is more universal and has better detection performance. In response to the problem of the imbalanced distribution of datasets, we draw on the commonly used techniques for processing long-tailed datasets in object detection. We prevent overfitting of tail features by adding pseudo feature collection and generation modules and guide the network to correctly classify tail samples through loss function weighting. We can conclude from the experimental results that both adding rotational convolution and the long-tail data detection module can improve the detection accuracy of the network. As shown in Figure 8, the network detection performance we proposed is better than the baseline network LSKNet in terms of detection performance. But overall, although rotation convolution solves the problems of universality and computational complexity, it has a much larger number of parameters compared to 2D convolutions. In the solution for long-tailed datasets, there may still be some overfitting of the tail samples. Therefore, we will continue to attempt to reduce the number of parameters in the rotation convolution while maintaining detection accuracy and explore the use of data augmentation methods to improve the problem of imbalanced data categories.

6. Conclusions

In this paper, we have made improvements to the network from two perspectives: feature extraction for rotating targets and sample learning for long-tailed datasets. They were added to the baseline network LSKNet to verify their effectiveness.
Firstly, feature extraction of rotating targets is a highly valued aspect of remote sensing image target detection. How to extract the features of rotating targets has been a question that researchers have been exploring. In this article, we eliminate the tedious operation of feature map rotation by transforming the convolutional kernel weights into continuous weights through bilinear interpolation, and then through a series of sampling methods. We also extend the applicability of rotation convolution from a fixed kernel size to convolution kernels of any size and dilation rate, greatly enhancing the universality of rotation convolution, and enabling the network to dynamically optimize the extracted features. The experiment shows that our improved rotation convolution improves the accuracy of the object detection network in detecting rotating objects. Compared with the LSKNet, our proposed DOUNet improves mAP by 0.46%.
In addition, to alleviate the impact of long-tail datasets on detector performance, we designed a weighted loss function based on the degree of dataset imbalance and changes in the learning state of the classifier. We fairly evaluated the degree of imbalance between each class sample based on long-term and short-term indicators, helping the classifier selectively learn tail-class data. We also designed a feature collection and generation module for tail-class data to prevent overfitting of the classifier. We use the above methods to enable the network to dynamically update the weights of tail samples and dynamically optimize the parameters of the network based on the learning situation of tail samples. The experiment shows that the improved network can effectively reduce the detection performance degradation caused by long -tail datasets, and our network improved the detection accuracy of tail categories by 1.15% compared to the baseline LSKNet.
Although our work has achieved certain results in both detection accuracy and the balance of detection results, there are still some problems that need to be solved: although rotational convolution improves the accuracy of the network, it brings several-times-larger parameter quantities compared to 2D convolution, which is the disadvantage of rotational convolution. Although the idea of feature enhancement has to some extent solved the problem of overfitting of tail categories, it has not yet fully solved this problem. The accuracy improvement of tail categories is not significant enough. In future research, we will continue to explore effective solutions to these problems and design lightweight and efficient object detection models.

Author Contributions

Conceptualization, L.D. and D.Z.; methodology, Q.L.; software, D.Z.; validation, D.Z., F.C. and Q.L.; resources, L.D.; data curation, F.C.; writing—original draft preparation, D.Z.; writing—review and editing, L.D.; visualization, F.C.; supervision, Q.L.; project administration, L.D.; funding acquisition, L.D. All authors have read and agreed to the published version of the manuscript.

Funding

This research was funded by Key R&D Program Guidance Projects of Heilongjiang Province (Grant No. GZ20210065), 2021–2024, and Natural Science Foundation of Heilongjiang Province (Grant No. LH2019F024), China, 2019–2022.

Institutional Review Board Statement

Not applicable.

Informed Consent Statement

Not applicable.

Data Availability Statement

The datasets used in the article are all available. The DOTA dataset is available at https://captain-whu.github.io/DOTA/dataset.html, accessed on 9 September 2024. The code and model files used in this article is available at https://github.com/gbdjxgp/DOUNet, accessed on 9 September 2024.

Conflicts of Interest

The authors declare that they have no known competing financial interests or personal relationships that could have appeared to influence the work reported in this paper.

References

  1. Xia, G.-S.; Bai, X.; Ding, J.; Zhu, Z.; Belongie, S.; Luo, J.; Datcu, M.; Pelillo, M.; Zhang, L. DOTA: A large-scale dataset for object detection in aerial images. In Proceedings of the IEEE Conference on Computer Vision and Pattern Recognition, Salt Lake City, UT, USA, 18–22 June 2018; pp. 3974–3983. [Google Scholar]
  2. Lin, T.-Y.; Goyal, P.; Girshick, R.; He, K.; Dollár, P. Focal loss for dense object detection. In Proceedings of the IEEE International Conference on Computer Vision, Venice, Italy, 22–29 October 2017; pp. 2980–2988. [Google Scholar]
  3. Ren, S.; He, K.; Girshick, R.; Sun, J. Faster r-cnn: Towards real-time object detection with region proposal networks. In Proceedings of the Advances in Neural Information Processing Systems, Montreal, QC, Canada, 7–12 December 2015; Volume 28. [Google Scholar]
  4. Yang, Z.; Liu, S.; Hu, H.; Wang, L.; Lin, S. Reppoints: Point set representation for object detection. In Proceedings of the IEEE/CVF International Conference on Computer Vision, Seoul, Republic of Korea, 27 October–2 November 2019; pp. 9657–9666. [Google Scholar]
  5. Li, Y.; Hou, Q.; Zheng, Z.; Cheng, M.-M.; Yang, J.; Li, X. Large selective kernel network for remote sensing object detection. In Proceedings of the IEEE/CVF International Conference on Computer Vision, Paris, France, 1–6 October 2023; pp. 16794–16805. [Google Scholar]
  6. Cai, X.; Lai, Q.; Wang, Y.; Wang, W.; Sun, Z.; Yao, Y. Poly kernel inception network for remote sensing detection. In Proceedings of the IEEE/CVF Conference on Computer Vision and Pattern Recognition, Seattle, WA, USA, 17–21 June 2024; pp. 27706–27716. [Google Scholar]
  7. Pu, Y.; Wang, Y.; Xia, Z.; Han, Y.; Wang, Y.; Gan, W.; Wang, Z.; Song, S.; Huang, G. Adaptive rotated convolution for rotated object detection. In Proceedings of the IEEE/CVF International Conference on Computer Vision, Paris, France, 1–6 October 2023; pp. 6589–6600. [Google Scholar]
  8. Han, J.; Ding, J.; Li, J.; Xia, G.-S. Align deep features for oriented object detection. IEEE Trans. Geosci. Remote Sens. 2021, 60, 5602511. [Google Scholar] [CrossRef]
  9. Han, J.; Ding, J.; Xue, N.; Xia, G.-S. Redet: A rotation-equivariant detector for aerial object detection. In Proceedings of the IEEE/CVF Conference on Computer Vision and Pattern Recognition, Virtual, 19–25 June 2021; pp. 2786–2795. [Google Scholar]
  10. Xie, X.; Cheng, G.; Wang, J.; Yao, X.; Han, J. Oriented R-CNN for object detection. In Proceedings of the IEEE/CVF International Conference on Computer Vision, Virtual, 11–17 October 2021; pp. 3520–3529. [Google Scholar]
  11. Yang, X.; Yan, J. Arbitrary-oriented object detection with circular smooth label. In Proceedings of the Computer Vision–ECCV 2020: 16th European Conference, Glasgow, UK, 23–28 August 2020; Proceedings, Part VIII 16. Springer: Berlin/Heidelberg, Germany, 2020; pp. 677–694. [Google Scholar]
  12. Yu, Y.; Da, F. Phase-shifting coder: Predicting accurate orientation in oriented object detection. In Proceedings of the IEEE/CVF Conference on Computer Vision and Pattern Recognition, Vancouver, BC, Canada, 18–22 June 2023; pp. 13354–13363. [Google Scholar]
  13. Yang, X.; Yan, J.; Ming, Q.; Wang, W.; Zhang, X.; Tian, Q. Rethinking rotated object detection with gaussian wasserstein distance loss. In Proceedings of the International Conference on Machine Learning, Online, 18–24 July 2021; pp. 11830–11841. [Google Scholar]
  14. Yang, X.; Yang, X.; Yang, J.; Ming, Q.; Wang, W.; Tian, Q.; Yan, J. Learning high-precision bounding box for rotated object detection via kullback-leibler divergence. Adv. Neural Inf. Process. Syst. 2021, 34, 18381–18394. [Google Scholar]
  15. Yang, X.; Zhou, Y.; Zhang, G.; Yang, J.; Wang, W.; Yan, J.; Zhang, X.; Tian, Q. The KFIoU loss for rotated object detection. arXiv 2022, arXiv:2201.12558. [Google Scholar]
  16. Tan, J.; Lu, X.; Zhang, G.; Yin, C.; Li, Q. Equalization loss v2: A new gradient balance approach for long-tailed object detection. In Proceedings of the IEEE/CVF Conference on Computer Vision and Pattern Recognition, Virtual, 19–25 June 2021; pp. 1685–1694. [Google Scholar]
  17. Tan, J.; Wang, C.; Li, B.; Li, Q.; Ouyang, W.; Yin, C.; Yan, J. Equalization loss for long-tailed object recognition. In Proceedings of the IEEE/CVF Conference on Computer Vision and Pattern Recognition, Seattle, WA, USA, 14–19 June 2020; pp. 11662–11671. [Google Scholar]
  18. Wang, T.; Zhu, Y.; Zhao, C.; Zeng, W.; Wang, J.; Tang, M. Adaptive class suppression loss for long-tail object detection. In Proceedings of the IEEE/CVF Conference on Computer Vision and Pattern Recognition, Virtual, 19–25 June 2021; pp. 3103–3112. [Google Scholar]
  19. Li, B.; Yao, Y.; Tan, J.; Zhang, G.; Yu, F.; Lu, J.; Luo, Y. Equalized focal loss for dense long-tailed object detection. In Proceedings of the IEEE/CVF Conference on Computer Vision and Pattern Recognition, New Orleans, LA, USA, 18–24 June 2022; pp. 6990–6999. [Google Scholar]
  20. Zhang, S.; Li, Z.; Yan, S.; He, X.; Sun, J. Distribution alignment: A unified framework for long-tail visual recognition. In Proceedings of the IEEE/CVF Conference on Computer Vision and Pattern Recognition, Virtual, 19–25 June 2021; pp. 2361–2370. [Google Scholar]
  21. Qi, T.; Xie, H.; Li, P.; Ge, J.; Zhang, Y. Balanced Classification: A Unified Framework for Long-Tailed Object Detection. IEEE Trans. Multimed. 2023, 26, 3088–3101. [Google Scholar] [CrossRef]
  22. Hou, L.; Lu, K.; Xue, J.; Li, Y. Shape-adaptive selection and measurement for oriented object detection. In Proceedings of the AAAI Conference on Artificial Intelligence, Online, 22 February–1 March 2022; pp. 923–932. [Google Scholar]
  23. Guo, Z.; Liu, C.; Zhang, X.; Jiao, J.; Ji, X.; Ye, Q. Beyond bounding-box: Convex-hull feature adaptation for oriented and densely packed object detection. In Proceedings of the IEEE/CVF Conference on Computer Vision and Pattern Recognition, Virtual, 19–25 June 2021; pp. 8792–8801. [Google Scholar]
  24. Yu, Y.; Yang, X.; Li, Q.; Zhou, Y.; Zhang, G.; Yan, J.; Da, F. H2rbox-v2: Boosting hbox-supervised oriented object detection via symmetric learning. arXiv 2023, arXiv:2304.04403. [Google Scholar]
  25. Liu, Z.; Mao, H.; Wu, C.-Y.; Feichtenhofer, C.; Darrell, T.; Xie, S. A convnet for the 2020s. In Proceedings of the IEEE/CVF Conference on Computer Vision and Pattern Recognition, New Orleans, LA, USA, 18–24 June 2022; pp. 11976–11986. [Google Scholar]
Figure 1. Detailed network structure of the proposed DOUNet detector.
Applsci 14 08249 g001
Figure 2. Detailed structure of the LSK module.
Applsci 14 08249 g002
Figure 3. The weight calculation process of the convolutional kernel. (a) Input the weight of a certain channel in the convolutional kernel, and use colors to distinguish different weight values. (b) Treat the weights in the original convolution kernel as reference points and use bilinear interpolation to unfold them into an image. (c) Rotate the position of each point in the convolution kernel, discarding the original weights and displaying them in white. (d) Sample each weight point after rotation using its relative center position, where the sampled image is generated by the previous process. (e) The convolutional kernel after rotation.
Applsci 14 08249 g003
Figure 4. The framework of the long-tail data detection module. The boxes of different colors in the figure represent the extracted features, and the lines of different colors represent the pseudo features generated using the corresponding features.
Applsci 14 08249 g004
Figure 5. Visualization of pseudo labels. (a) Original image (with background). (f) Original label (black background). (b,d,g,i) Add counterclockwise random angles based on the original labels. (c,e,h,j) Add clockwise random angles based on the original labels. (be) Extend the length based on the original label. (gj) Shorten the length based on the original label. (b,c,g,h) Widen the width based on the original label. (d,e,i,j) Narrow the width based on the original label.
Applsci 14 08249 g005
Figure 6. Visualization of DOTA dataset classification statistics. Above the bar in the figure is the number of categories, with the top categories accounting for more than 15% of the total dataset and the tail categories accounting for less than 1%.
Applsci 14 08249 g006
Figure 7. Qualitative visualization results of LSKNet and DOUNet. (a,b) Visualization of detection results for head categories, with purple representing small vehicles and orange red representing large vehicles. (c,d) Visualization of normal categories, lemon yellow for harbor and pink for ship. (e,f) Visualization of tail categories, sky blue for tennis-court, yellow for baseball-diamond, white for basketball-court, light pink for soccer-ball-field.
Applsci 14 08249 g007
Figure 8. Qualitative comparison of different algorithms.
Applsci 14 08249 g008
Table 1. Results of the ablation study on the DOTA-v1.0 dataset.
ModelAP50AP75mAP.5:.95APTAPTNAPH
LSKNet75.8647.6545.4672.3374.2582.32
LSK-CLS76.4348.7746.1873.5975.0482.02
LSK-ARC75.9147.4145.5372.2074.2882.44
DOUNet(ours)76.5449.0146.2273.4875.1881.98
Table 2. Comparison of model accuracy without pre-training.
ModelAP50AP75mAP.5:.95FPS(s)Parameter(M)GFLOPs
LSKNet75.8647.6545.4622.621.0124.42
LSK-CLS76.4348.7746.1822.721.0124.42
LSK-ARC75.9147.4145.536.322.7773.2
DOUNet(ours)76.5449.0146.226.322.7773.2
Table 3. Quantitative comparison with other rotation detectors on the DOTA-v1.0 dataset.
MethodHead CategoriesNormal CategoriesTail CategoriesmAP(%)
SVLVTCBCHABR
Rotated RepPoints [4]71.2751.7890.5170.4650.6936.3259.44
SASM [22]72.0872.3590.9075.6963.7545.4166.43
Rotated RetinaNet [2]77.5162.6390.8982.3156.4640.8868.42
KFIoU [15]72.3064.0190.9082.3363.0046.2569.59
CFA [23]79.0574.1490.8780.3564.4049.1969.63
Oriented RepPoints [4]78.3873.1490.8783.7563.6949.6171.72
PSC [12]78.9270.0890.9082.8261.3542.4871.91
H2RBox-v2 [24]79.8174.7790.8885.4765.8750.7572.61
PKINet-T [6]76.3581.9290.8584.1467.1151.2473.60
S2A-Net [8]78.6177.3790.9086.2866.0851.5773.92
RetinaNet ConvNeXt [25]78.9174.1190.9087.7562.6246.7874.47
Oriented R-CNN [10]78.3377.8290.8885.6067.6751.7874.99
LSKNet [5]75.0283.7790.9086.3068.6550.8775.86
DOUNet(ours)75.1182.9590.9087.9273.2751.0476.54
Disclaimer/Publisher’s Note: The statements, opinions and data contained in all publications are solely those of the individual author(s) and contributor(s) and not of MDPI and/or the editor(s). MDPI and/or the editor(s) disclaim responsibility for any injury to people or property resulting from any ideas, methods, instructions or products referred to in the content.

