Article

A Study on Karst Cave Collapse Based on Improved Terzaghi Theory and Upper Limit Analysis

Faculty of Engineering, China University of Geosciences, Wuhan 430074, China
*
Author to whom correspondence should be addressed.
Appl. Sci. 2024, 14(18), 8252; https://doi.org/10.3390/app14188252
Submission received: 26 April 2024 / Revised: 8 August 2024 / Accepted: 10 September 2024 / Published: 13 September 2024

Abstract

:
Karst areas exhibit intricate geological attributes, and the geological and environmental issues caused by urban development cannot be ignored, especially the issue of karst surface collapses. In this study, we developed two analytical methods and analyzed the stability of the overburden stratum of 3D spherical karst caves with surface load, vacuum absorption erosion force, and groundwater table considerations. The first analytical method is based on the improved Terzaghi theory, while the second analytical method is based on the upper limit analysis. A case study was conducted in Wuhan, China. The results from both analytical methods indicated a potential susceptibility to collapse, suggesting the excellent accuracy of these two methods. The results were also compared with the numerical solutions from previous studies. Notably, the accuracy of the upper limit analysis was inversely proportional to the depth ratio, while the results obtained through the improved Terzaghi theory were consistent with those of the numerical solutions, particularly under conditions of relatively high depth ratios. This study examined various facets, including the development of karst caves, soil shear strength, groundwater table fluctuations, and boundary failure angles. Furthermore, we explored the effects of geometric and geotechnical parameters on the stability of karst caves.

1. Introduction

In over 140 countries, the area of various soluble rock formations is approximately 19.3 × 10⁶ km2. The Classical Karst Region (Kras–Carso) extends across the border between SW Slovenia and NE Italy and has a special place among karst regions in the world. Geological investigations of the region date back to the seventeenth century and continued during the eighteenth and the beginning of the nineteenth centuries, when studies were focused on karst phenomena [1]. Notably, countries with soluble rock areas of more than 1 × 10⁶ km2 include Russia, the United States, China, and Canada [2]. Karst surface collapse, recognized as a prevalent geohazard, poses formidable challenges in prevention owing to its inherent concealment and sudden occurrence [3]. Karst collapse evolution is influenced by human engineering activities, natural environmental changes, and karst effects. In recent years, consistent urbanization, extensive underground space development, groundwater extraction activity, and large-scale engineering construction have inevitably increased susceptibility to karst collapse [4]. This poses significant threats to human lives and property in addition to the overall security of the nation. Therefore, it is imperative to conduct comprehensive research on the karst surface collapses.
Underground cavities, including karst caves, are one of the fundamental prerequisites for surface collapses. Karst surface collapse results from the combined action of both the overburden and the underlying karst caves, and it is profoundly influenced by the stratum lithology and geological formation structure. Currently, research on karst surface collapse predominantly employs methods such as engineering geological discrimination, physical model testing, numerical simulation, and mechanical analysis.
In the study of engineering geological discrimination, Heidari and Khanlari [5] examined karst surface collapses in the central plain of the Hamedan region of western Iran and they discovered that these collapses predominantly developed in groundwater discharge areas near the base of karstic limestone. Pando et al. [6] analyzed the genetic mechanisms of a karst collapse and the settlement of surrounding buildings in Spain. Their investigation suggested that the extraction and drainage of karst groundwater during the construction of adjacent subterranean parking lots induced the loss of the upper sand layers. In summary, engineering geological discrimination facilitates the elucidation of the mechanisms behind geological hazard processes and qualitative conclusions [7]. The mechanism of karst ground collapse is analyzed from the aspects of topography, formation structure, and hydrogeological conditions, and the overburden is taken as an important analysis object. However, such a kind of method inherently lacks the capacity for quantitative assessments.
Due to the concealment of the disaster-causing process of karst surface collapse, it is difficult to directly study the collapse mechanism of actual cases. Therefore, indoor physical model tests are commonly used research methods. Jiang et al. [8] examined soil permeability resistance through physical model tests and revealed hydrodynamic conditions for the migration of soil particles. Jeong et al. [9] simulated the formation of collapses in sand-rich strata using tank model experiments. They analyzed various factors influencing cavity formation, expansion, and upward migration in response to different cavity water levels. These tests have intuitively restored the process of collapse and obtained the law of collapse and suggestions for prevention and treatment. Similar to engineering geological discrimination, physical model tests offer valuable insights into the verification of the mechanisms and prevention of collapse [10,11]. However, it is important to note that these tests are resource-intensive and time-consuming. In terms of numerical simulation of karst ground collapse, the main methods used include finite element method (FEM), finite difference method (FDM), and discrete element method (DEM) [12,13,14,15]. The emergence and development of numerical simulations have profoundly advanced the study of karst surface collapses. Through the simulation of karst surface collapse processes under varying conditions [16,17], the collapsing mechanisms can be revealed from the perspective of the geotechnical mechanical characteristics. They facilitate the analysis of factors influencing the stability of karst caves. However, as reported by Hartmann et al. [18], the existing karst cave models face challenges in terms of data availability and the informational content of existing data, rendering the attainment of accurate conclusions a challenging endeavor because of the inability to closely reflect reality.
Mechanical analysis methods for assessing the stability of karst caves predominantly rely on conventional engineering theories or empirical formulas. Currently, common traditional calculation techniques include Protodyakonov’s pressure arch theory, Terzaghi theory, empirical formula methods, and roof collapse sealing methods [19]. Nevertheless, there is the issue of oversimplification and empiricism in the calculation of karst cave stability using traditional theoretical methods, which only consider the gravity, cohesion, and friction of soil, ignoring or simplifying the influence of groundwater and vacuum absorption erosion force. It is difficult to accurately summarize the law of karst cave stability. For instance, in Protodyakonov’s pressure arch theory, calculation results rely on the empirical coefficient of Protodyakonov. Jia et al. [20] employed Terzaghi theory and considered excessive pore water pressure to analyze the karst surface collapses; the results of this study are satisfactory. However, referring to the strata above karst caves as a uniform medium, this study ignored the groundwater table factor, potentially leading to inaccuracies in the calculations. Therefore, these oversimplified methods can only reflect the intricate relationships between karst cave stability and partial factors.
To overcome the shortcomings of oversimplification and empiricism of traditional stability analysis methods, the limit analysis method with higher accuracy and precision has become a widely used tool in geotechnical engineering. As early as 2003, Augarde et al. [21] introduced the limit analysis method to assess the stability of karst cave overburden. In recent years, the limit analysis method has been increasingly applied to evaluate the stability of karst caves and tunnels. Keawsawasvong et al. [22] conducted a parameter study on the undrained stability of spherical cavities in clay by employing a finite element limit analysis method under axisymmetric conditions. Their study explored the influence of cavity coverage depth ratios and other dimensionless factors on the ultimate surface load. Through a combination of the lower bound theorem of the limit analysis method and the finite discretization method, Liu et al. [23] proposed a 3D collapse mechanism capable of considering the simultaneous collapse of tunnel roofs and sidewalls. The limit analysis method was employed to calculate the upper limit of the 3D support pressure, and the results aligned favorably with numerical findings from prior studies. While the implementation of the limit analysis method in existing research has yielded valuable insights into the potential failure modes of karst collapses, the impact of groundwater on the collapse of karst cave overburdens is frequently ignored. Mechanical analysis needs to combine more factors to ensure the reliability of the calculated results and adopt more reasonable failure models to make them fit reality.
In this study, we employed an improved Terzaghi theory and limit analysis method to conduct a mechanical analysis of the 3D stability of a karst cave overburden. New types of collapse failure models and the interplay between groundwater and karst caves were considered. Furthermore, we performed this analysis using numerical simulations to validate the actual collapse cases. Additionally, we explored the effects of karst cave development, soil shear strength, groundwater table, and boundary failure angles on the occurrence of karst collapse.

2. Basic Theories

It should be stated that the main purpose of this paper is to develop a new theoretical formula for the analysis of cave stability under the influence of various factors, such as the influence of groundwater level fluctuation on the stability of overburden, and derive a three-dimensional form that is more in line with the actual application requirements. This is a study worthy of study. However, on this basis, considering the physical parameters of the model such as the geometric shape of the cave, the theoretical formula will become very complex and lose the application value of the formula. For these reasons, the mechanical and stability analyses of karst caves in this study are based on the following assumptions: (1) materials were considered to be homogeneous, isotropic, and elastoplastic, constituting a continuous medium; (2) materials satisfied the hypothesis of small deformation; (3) materials satisfied the associated flow law [24]; and (4) the sliding block produced by failure was regarded as a rigid body, with the deformation of the sliding block disregarded; and (5) the geometric shape of the karst cave is assumed to be spherical.

2.1. Protodyakonov’s Pressure Arch Theory

In the conventional Protodyakonov’s pressure arch theory, the height of the pressure arch was denoted as hmax. A pressure arch was generated only when the overburden thickness exceeds the critical height Hmin, which can be determined through the following calculation [25]:
H min = 2 h max = α d 1 + tan 45 ° φ 2 f k
where α represents the empirical coefficient of Protodyakonov’s pressure arch theory, d represents the width of the pressure arch, φ represents the internal friction angle of the soil, and fk represents Protodyakonov’s coefficient of the soil.
Apparently, Protodyakonov’s pressure arch theory consists of few variables and is too empirical. In practice, these variables are insufficient to represent the stability of karst caves.

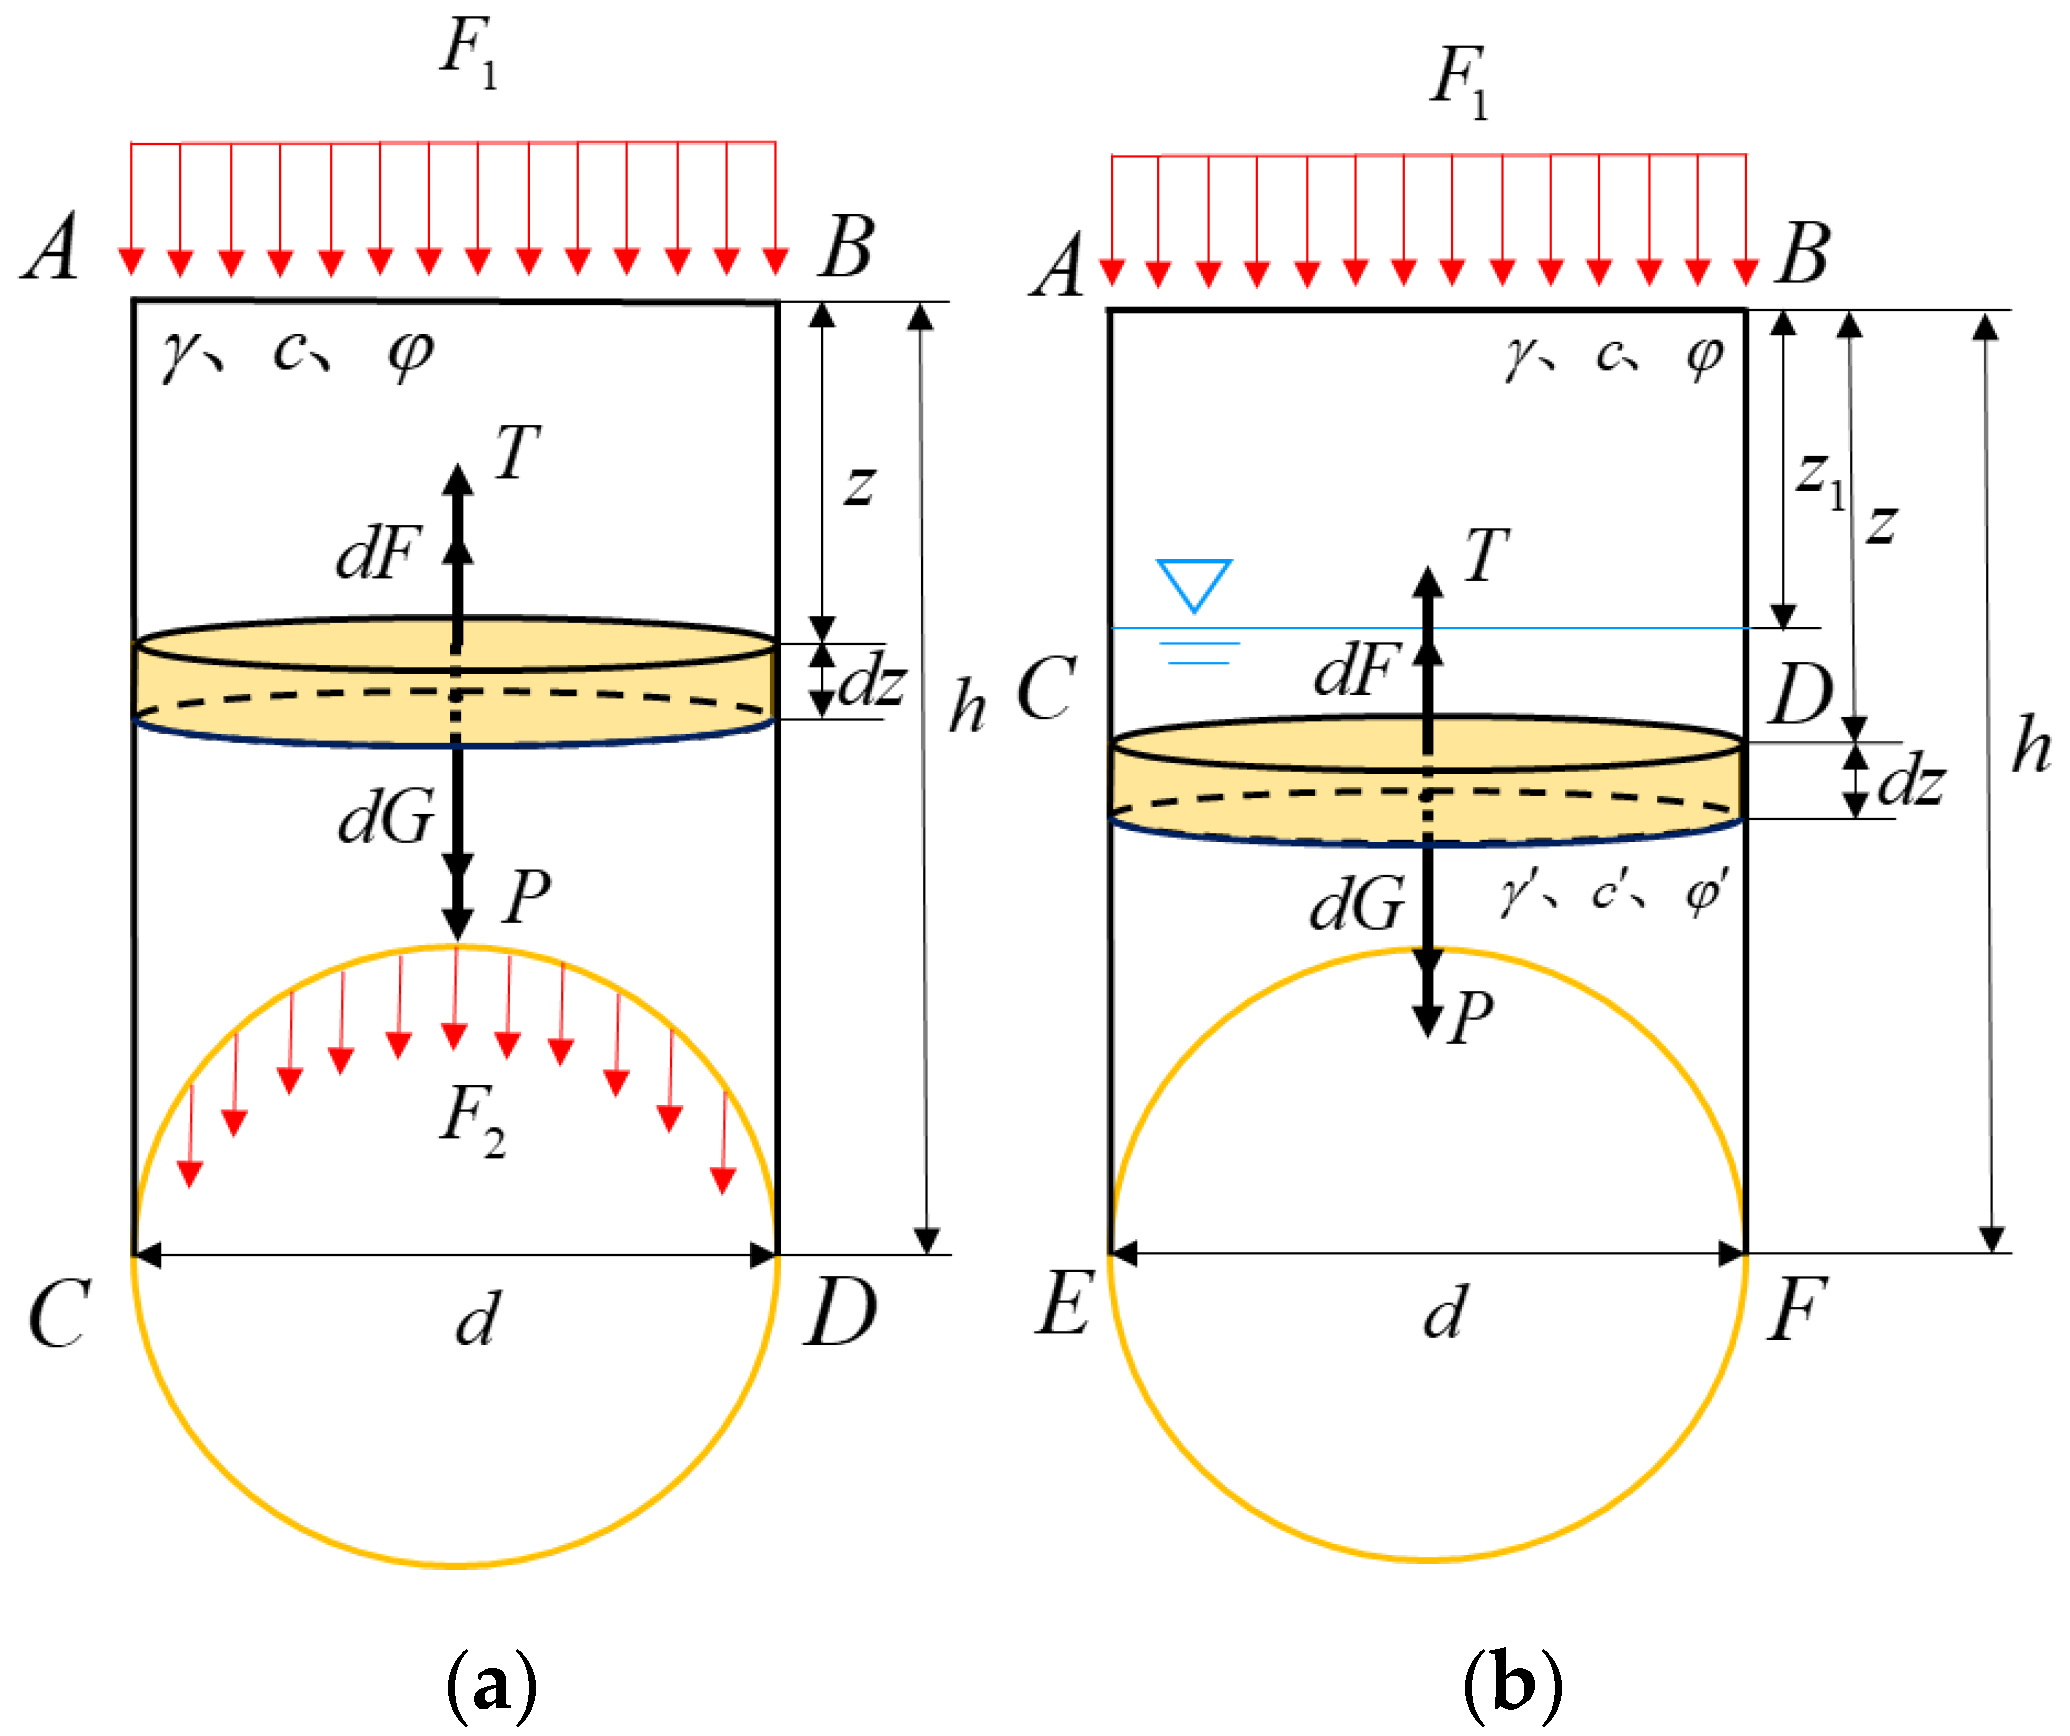
2.2. Improved Terzaghi Theory

The failure model in the improved Terzaghi theory is plotted in Figure 1, where the diameter of the karst cave is d, the overburden thickness is h, the soil unit weight above and below groundwater table are γ and γ’, the cohesions are c and c’, and the internal friction angles are φ and φ’. A uniform surface load, F1, is imposed on the top of the soil column. When the groundwater table is below the karst cave, the vacuum absorption erosion force is one of the reasons for the failure of the karst cave [26]; thus, it is simplified as F2. F1 and F2 can be obtained by
F 1 = π d 2 4 σ 1 F 2 = π d 2 4 σ p
where σ1 represents the average surface pressure and σp represents the average vacuum absorption erosion pressure.
According to the Terzaghi theory by Kezdi [27], the improvement in this study includes two key aspects.
1. In practice, diverse relative positional arrangements exist between the groundwater table and karst cave, leading to two distinct scenarios, where the groundwater table can be situated either above or below the karst cave.
2. Equation (3) represents the Coulomb shear strength formula. To facilitate its application within the failure model, the shear strength is defined by Equation (4).
τ f = c + σ tan φ
τ f = c + K 0 γ z tan φ
where K0 denotes the static earth pressure coefficient.
(1) 
The groundwater table lies beneath the karst cave
For the 3D soil column above the karst cave, at a depth of z, a circular thin-layer element with a thickness of dz was selected as the analysis object. If the self-weight of the circular thin-layer element is dG, the pressure of overlying soil body is P, the supporting force of the underlying soil body is T, and the lateral shear strength is dF, then
d G = π d 2 γ 4 d z P = π d 2 4 σ z T = π d 2 4 σ z + d σ z d F = π d K 0 γ z tan φ + c d z
where σz represents the vertical stress of the soil at the depth of z, with the downward direction being positive.
Figure 1 demonstrates the directional relationship among the forces. Combined with Equation (5), according to the vertical equilibrium condition, the following can be obtained:
P + d G T d F = 0
d σ z d z + 4 K 0 tan φ γ z d + 4 c d γ = 0
σ z = 2 K 0 γ tan φ d z 2 + d γ 4 c d z + C
Due to the existence of σ1 and σp, C = σ1 + σp, which is substituted into Equation (8) as follows:
σ z = 2 K 0 γ tan φ d z 2 + d γ 4 c d z + σ 1 + σ p
In the lowest boundary of overburden, the top of karst cave, R represents the residual collapse resistance upward at the top of the karst cave. At this time, z = h, which is substituted into Equation (9), as follows:
R = σ z = 2 K 0 γ tan φ d h 2 d γ 4 c d h σ 1 σ p
This force can ensure the soil stability. When R = 0, karst cave is in limit equilibrium; when R > 0, karst cave is stable; and when R < 0, failure of the karst cave can occur.
(2) 
The groundwater table is above the karst cave.
The height of the water table from the ground is z1. If zz1, then
σ z = 2 K 0 γ tan φ d z 1 2 + d γ 4 c d z 1 + σ 1
If z > z1, then
P + d G T d F = 0 d G = π d 2 γ 4 d z P = π d 2 4 σ z T = π d 2 4 σ z + d σ z d F = π d K 0 γ z z 1 tan φ + K 0 γ z 1 tan φ + c d z z 1
σ z = 2 K 0 γ tan φ d z 2 + d γ 4 c + 4 K 0 tan φ z 1 γ γ d z + C
The vertical stresses above and below the groundwater surface σz are the same. When z = z1, combine Equations (11) and (13), then
σ z = 2 K 0 γ tan φ d z 2 + d γ 4 c + 4 K 0 tan φ z 1 γ γ d z + M + σ 1
where M = 2 K 0 z 1 2 d γ tan φ + γ tan φ 2 γ tan φ + z 1 γ γ + 4 z 1 d c c .
The residual collapse resistance (R) can be calculated as
R = σ z = 2 K 0 γ tan φ d z 2 d γ 4 c + 4 K 0 tan φ z 1 γ γ d z M σ 1

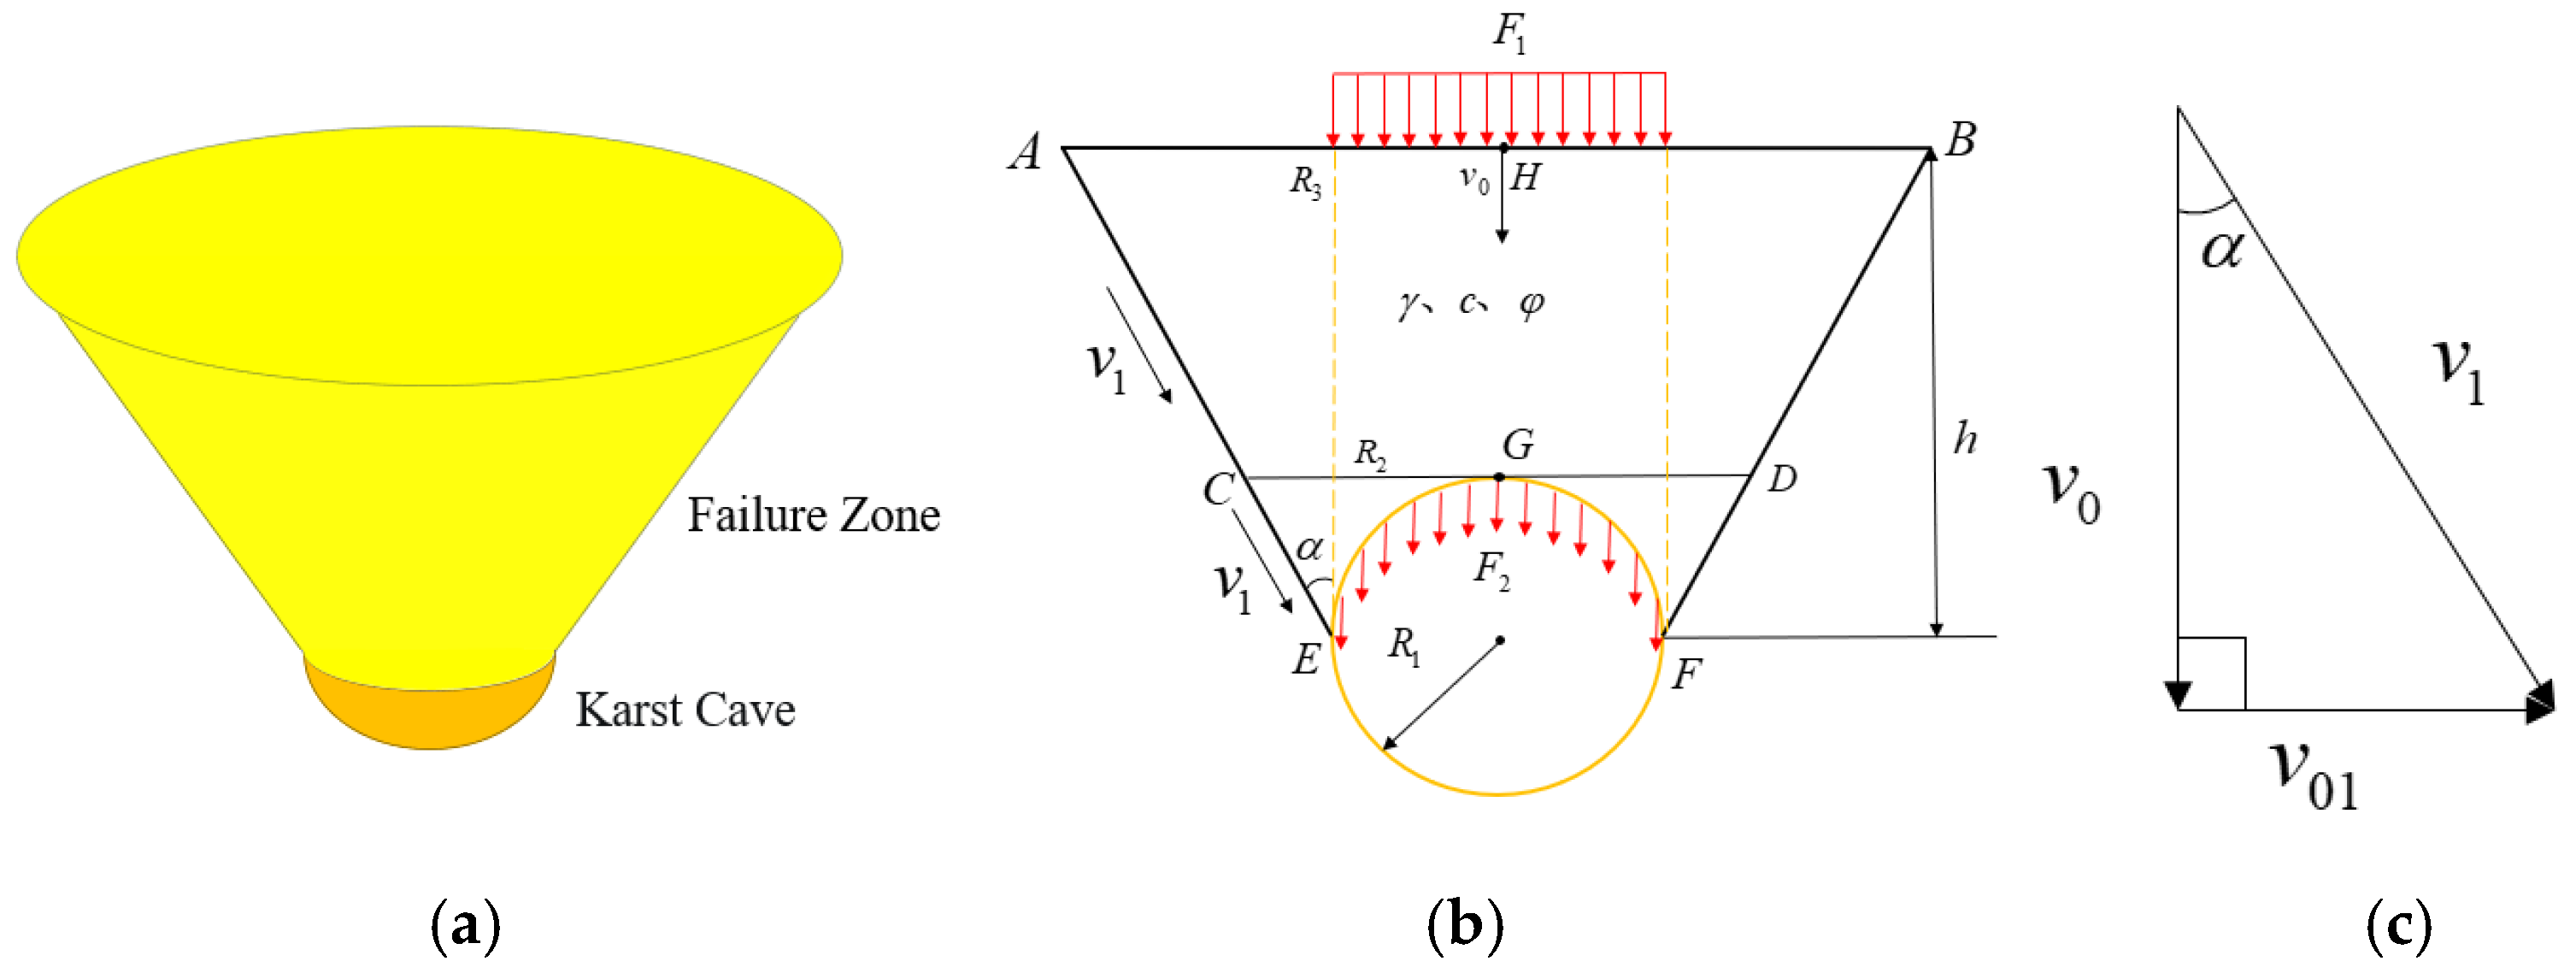
2.3. Limit Analysis Method

The limit analysis method includes upper and lower limit analyses. The lower limit analysis determines the maximum load that remains static through the construction of a static field, whereas the upper limit analysis identifies the minimum load that induces motion by establishing a velocity field [28]. Compared with the lower limit analysis, the upper limit analysis yields load values that approximate the actual situation more closely [29]. Jafari and Fahimifar [29] used the upper limit analysis method to carry out the stability analysis of two-dimensional tunnels. In this study, we employed a similar theory to assess the stability of three-dimensional karst caves.
Assuming that the properties of the failure zone satisfy the fundamental assumptions, we can establish the failure models illustrated in Figure 2 and Figure 3 according to the upper limit theorem of the limit analysis method. These models consider spherical karst caves with a diameter denoted as d and the distance between the surface and center of the karst caves represented as h.
As shown in Figure 2b, the groundwater table is below the karst cave and G and H are the midpoints of CD and AB, respectively. The soil unit weight of the failure zone ABFGE is γ, cohesion is c, the internal friction angle is φ, and the angle between the perpendicular lines of the surface and the boundary is α. The surface load above the karst caves is F1, and the upper vacuum absorption erosion force of the karst cave is F2.
As shown in Figure 3b, when the groundwater table is above the karst cave, I, J, and K are the midpoints of EF, CD, and AB. CD is the groundwater table, at a distance from the ground of z1. The soil unit weight of failure zone ABDC above groundwater is γ, cohesion is c, internal friction angle is φ, and the angle between perpendicular lines of the surface and the boundary is α. The soil unit weight of failure zone CDHIG below groundwater is γ’, cohesion is c´, internal friction angle is φ´, and the angle between perpendicular lines of the surface and the boundary is β. F1 and F2 have expressions detailed in Equation (16).
F 1 = π r 1 2 σ 1 F 2 = π r 1 2 σ p
To ensure the uniqueness of the limit analysis method calculations, according to the associated flow rule, a dilation angle exists between the velocity discontinuity line and the velocity direction. When the failure law of soil adopts the Mohr–Coulomb yield criterion, the dilation angle is equal to the internal friction angle. However, the actual dilation angle of the soil is very small and its influence on the calculation result is negligible. The compatible velocity field corresponds to the failure model (Figure 2c and Figure 3c). The angle is α when the groundwater table is below the karst cave, while it is β when the groundwater table is above the karst cave. According to the motion permission conditions applicable to a rigid body and taking the groundwater table above the karst cave as an example, the relationship between v0, v1, v2, v01, and v12 can be obtained as follows:
v 1 = v 0 cos α v 2 = v 0 cos β v 01 = v 0 tan β v 12 = v 0 tan β tan α
(1) 
Groundwater table below karst cave
Evidently, the failure zone and half of the karst cave simultaneously constitute two frustum of cones. The radii of the bottom and top surfaces of the circular frustum of cones are expressed as follows:
r 1 = d 2 r 2 = d 2 1 + tan α r 3 = d 2 + h tan α
The total gravitational power Pg is the sum of gravitational power acting on the circular frustum of cone ABDC and the irregular region CDFGE:
P g = γ v 0 π 3 tan α r 3 3 r 1 3 1 + 2 tan α
Similar to the force method in Terzaghi theory, the power Pl generated by the surface load (F1) and the vacuum absorption erosion force (F2) is as follows:
P l = σ 1 + σ p π r 1 2 v 0
For the entire failure zone, the velocity discontinuity surface is the side of the circular frustum of cone ABFE. The internal dissipation power, Pi, is the sum of the energy dissipation power on the velocity discontinuity surface.
P i = 1 3 cos α π K 0 γ h 2 v 0 tan φ 2 r 1 + r 3 + c π h v 0 cos 2 α r 1 + r 3
(2) 
Groundwater table above karst cave
As previously noted, the failure zone and half of the karst cave form three frustum of cones. The radii of these frustum cones can be described as
r 1 = d 2 r 4 = d 2 1 + tan β r 5 = h z 1 tan β + d 2 r 6 = h z 1 tan β + z 1 tan α + d 2
If the gravitational power of ABDC is PABDC, the gravitational power of CDFE is PCDFE, the gravitational power of irregular region EFHIG is PEFHIG, and the total gravitational power is Pg, the following formulas are obtained:
P g = P A B D C + P C D F E + P E F H I G P A B D C = γ v 0 π 3 tan α r 6 3 r 5 3 P C D F E = γ v 0 π 3 tan β r 5 3 r 4 3 P E F H I G = γ v 0 π 3 tan β r 4 3 r 1 3 1 + 2 tan β
The power Pl conducted by surface load F1 is
P l = σ 1 π r 1 2 v 0
The velocity discontinuity surfaces are defined by the circular frustum of cones ABDC, CDFE, and EFHG, as well as the circle centered at J with a given radius r5. The internal dissipation power Pi is the sum of the energy dissipation on the velocity discontinuity surfaces. Let the energy dissipation powers of these four areas be P1, P2, P3, and P4.
P i = P 1 + P 2 + P 3 + P 4 P 1 = 1 3 cos α π K 0 γ z 1 2 v 0 tan φ 2 r 5 + r 6 + c π z 1 v 0 cos 2 α r 5 + r 6 P 2 = 1 3 cos β π K 0 z 2 v 0 tan φ 3 γ z 1 r 4 + r 5 + γ z 2 2 r 4 + r 5 + c π z 2 v 0 cos 2 β r 4 + r 5 P 3 = 1 3 cos β π K 0 r 1 v 0 tan φ 3 γ z 1 + γ z 2 r 1 + r 4 + γ r 1 2 r 1 + r 4 + c π r 1 v 0 cos 2 β r 1 + r 4 P 4 = π r 5 2 v 0 tan β tan α γ z 1 tan φ + c
According to virtual power theory, at the point of limit equilibrium in the failure zone, the power of the external forces equals the sum of the internal dissipation power. The stability coefficients can be defined to evaluate the failure zone as follows:
K = P i P g + P l
When K = 1, the karst cave is in a state of limit equilibrium. When K > 1, the karst cave is stable. When K < 1, the karst cave fails.

3. Case Study

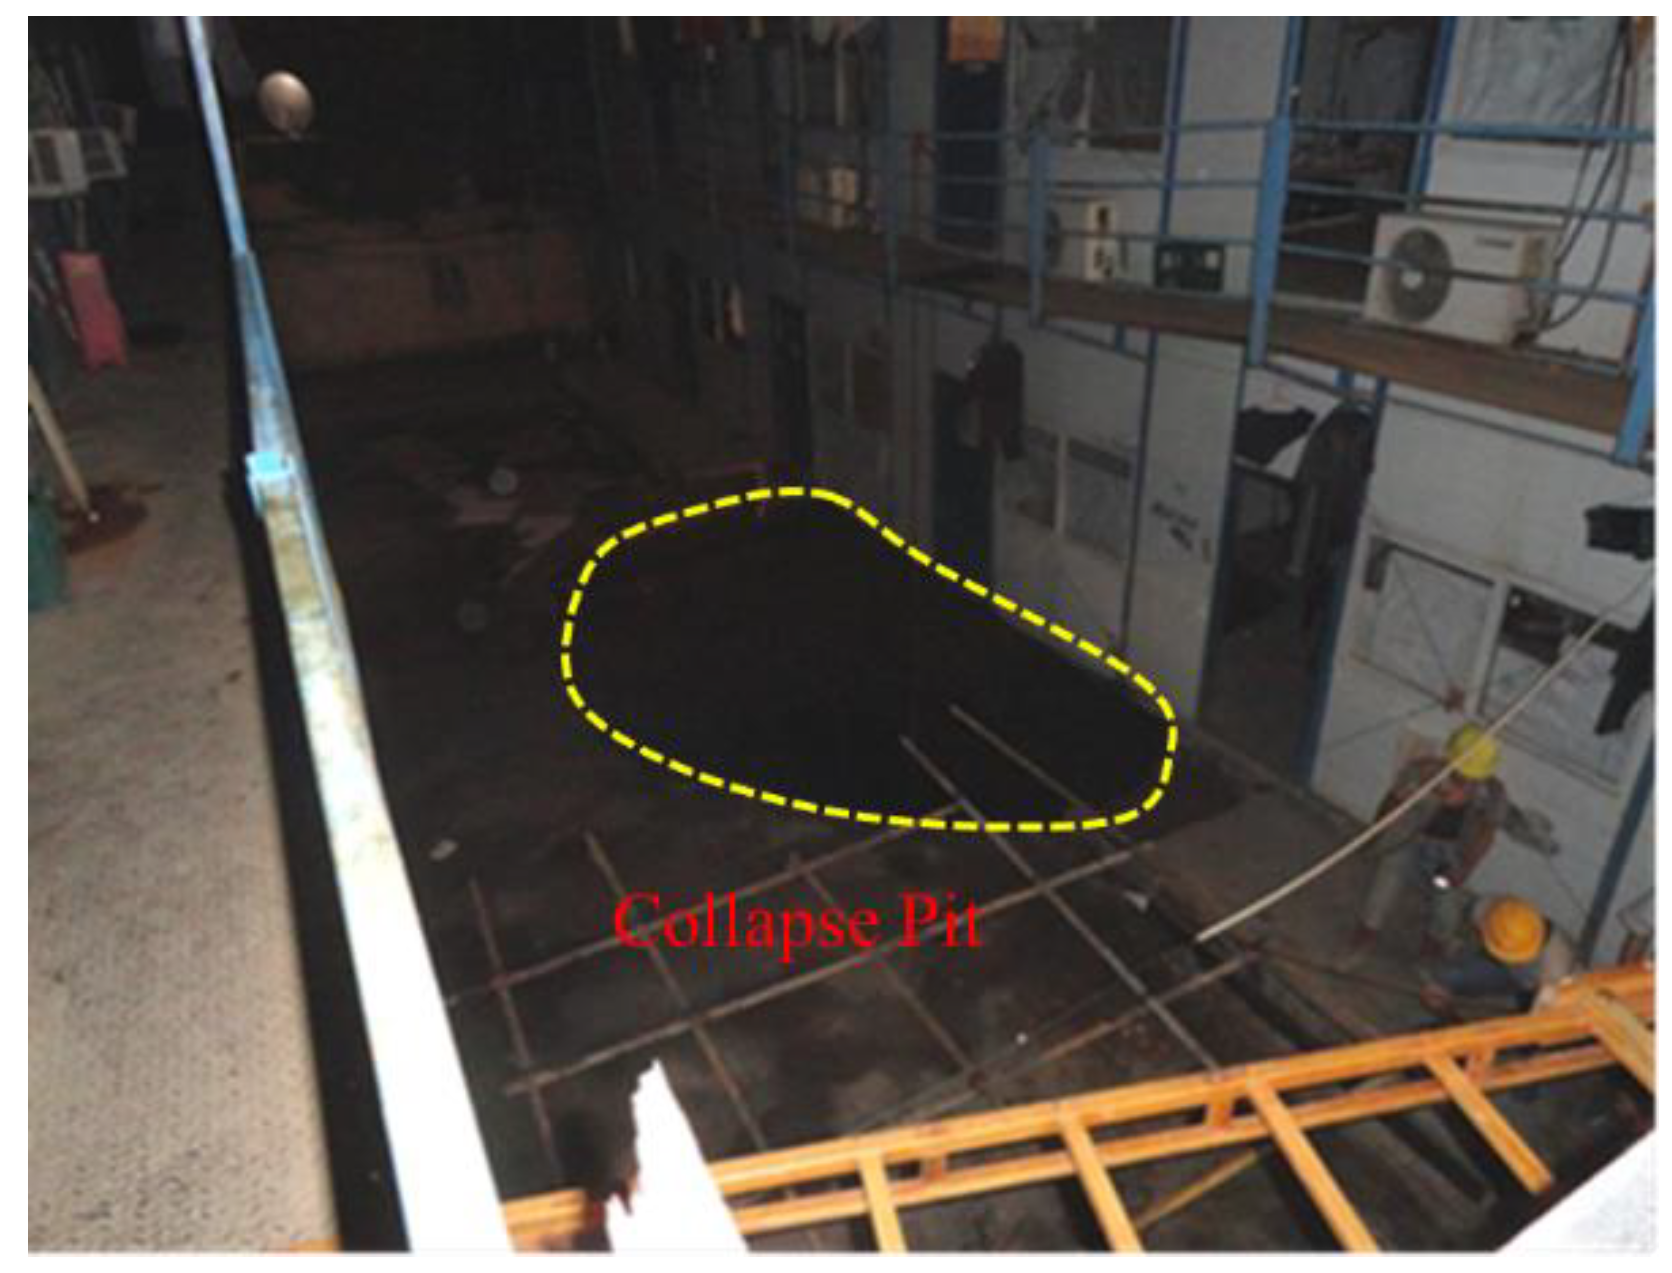
3.1. Case Description

A collapse transpired on Parrot Avenue in Hanyang, Wuhan, on 10 August 2015, as depicted in Figure 4 and Figure 5c. This collapse created a circular plane with an approximate diameter of 7 m on the surface. This incident resulted in two individuals missing, and a two-story movable house was damaged.
The main research content of this paper is the stability analysis of the caves, and the caves referred to in the subject are not karst caves located in the soluble bedrock (as shown in the red font in Figure 5a). It refers to the soil cave in the overburdened strata above the bedrock (as shown in the red font in Figure 5b), which is caused by the karst cave in the bedrock. In summary, the research object of the stability analysis in this paper is the overburdened soil in the stage 2 model. Considering that the lower part is formed by sand leakage and the upper part is due to the equilibrium arch effect in clay, the shape is simplified to be spherical in this paper.
The regional geomorphic unit of the site belongs to the first-class terrace of the Yangtze River, and the site elevation is 20–22 m. The groundwater in the area is mainly composed of upper stagnant water, confined water in strata, and karst fissure water, which is closely related to the Yangtze River. The upper stagnant water is recharged by atmospheric precipitation and artificial drainage. The water level changes with the season, and there is no fixed water level. The confined water of the soil layer has a close hydraulic connection with the Yangtze River, its water level is affected by the change in the water level of the Yangtze River, and the water is abundant. The simple pumping test results in January 2015 show that the confined water level is 7.5 m below the ground, which is equivalent to the absolute elevation of 13.5 m. According to the experience of the Wuhan area, the monthly variation range of confined water is 3.0–5.0 m.
The collapse was primarily due to erosion, seepage, and liquefaction caused by the subway construction and the karst cave was beneath the groundwater table. This incident represented a type of man-made collapse, with induced factors including external load and recurrent vibrations from the construction.
Geological survey data are presented in Table 1. For ease of viewing, Table 1 only shows the critical parameters for numerical simulation and stability analysis below. At a surface load of 60 kPa, the groundwater decreased to 7.5 m (z1 = 7.5 m) from the surface. The static earth pressure coefficient of the soil (K0) was 0.58 and the Protodyakonov’s coefficient was 0.8.
According to the limitations of the stability analysis theory described in the second chapter, the model of the case study in this chapter is simplified accordingly. (1) In addition to the clay layer in the overburdened soil in Figure 5, there is also a certain thickness of the sand layer. However, because the sand has no cohesion, it does not have stability under natural conditions. It is assumed that once the karst channel appears at the bottom, it will collapse naturally. Therefore, the stratum model is simplified into a homogeneous clay layer, and the stability analysis is carried out for the clay. (2) Obviously, the shape of the cave, in this case, is not round because the geometric shape of the karst cave is not the focus of this study, so in order to derive the three-dimensional form of the stability analysis formula and consider the influence of other factors such as groundwater level, this paper makes the necessary simplification of the geometric shape of the cave, which is regarded as a spherical cave.

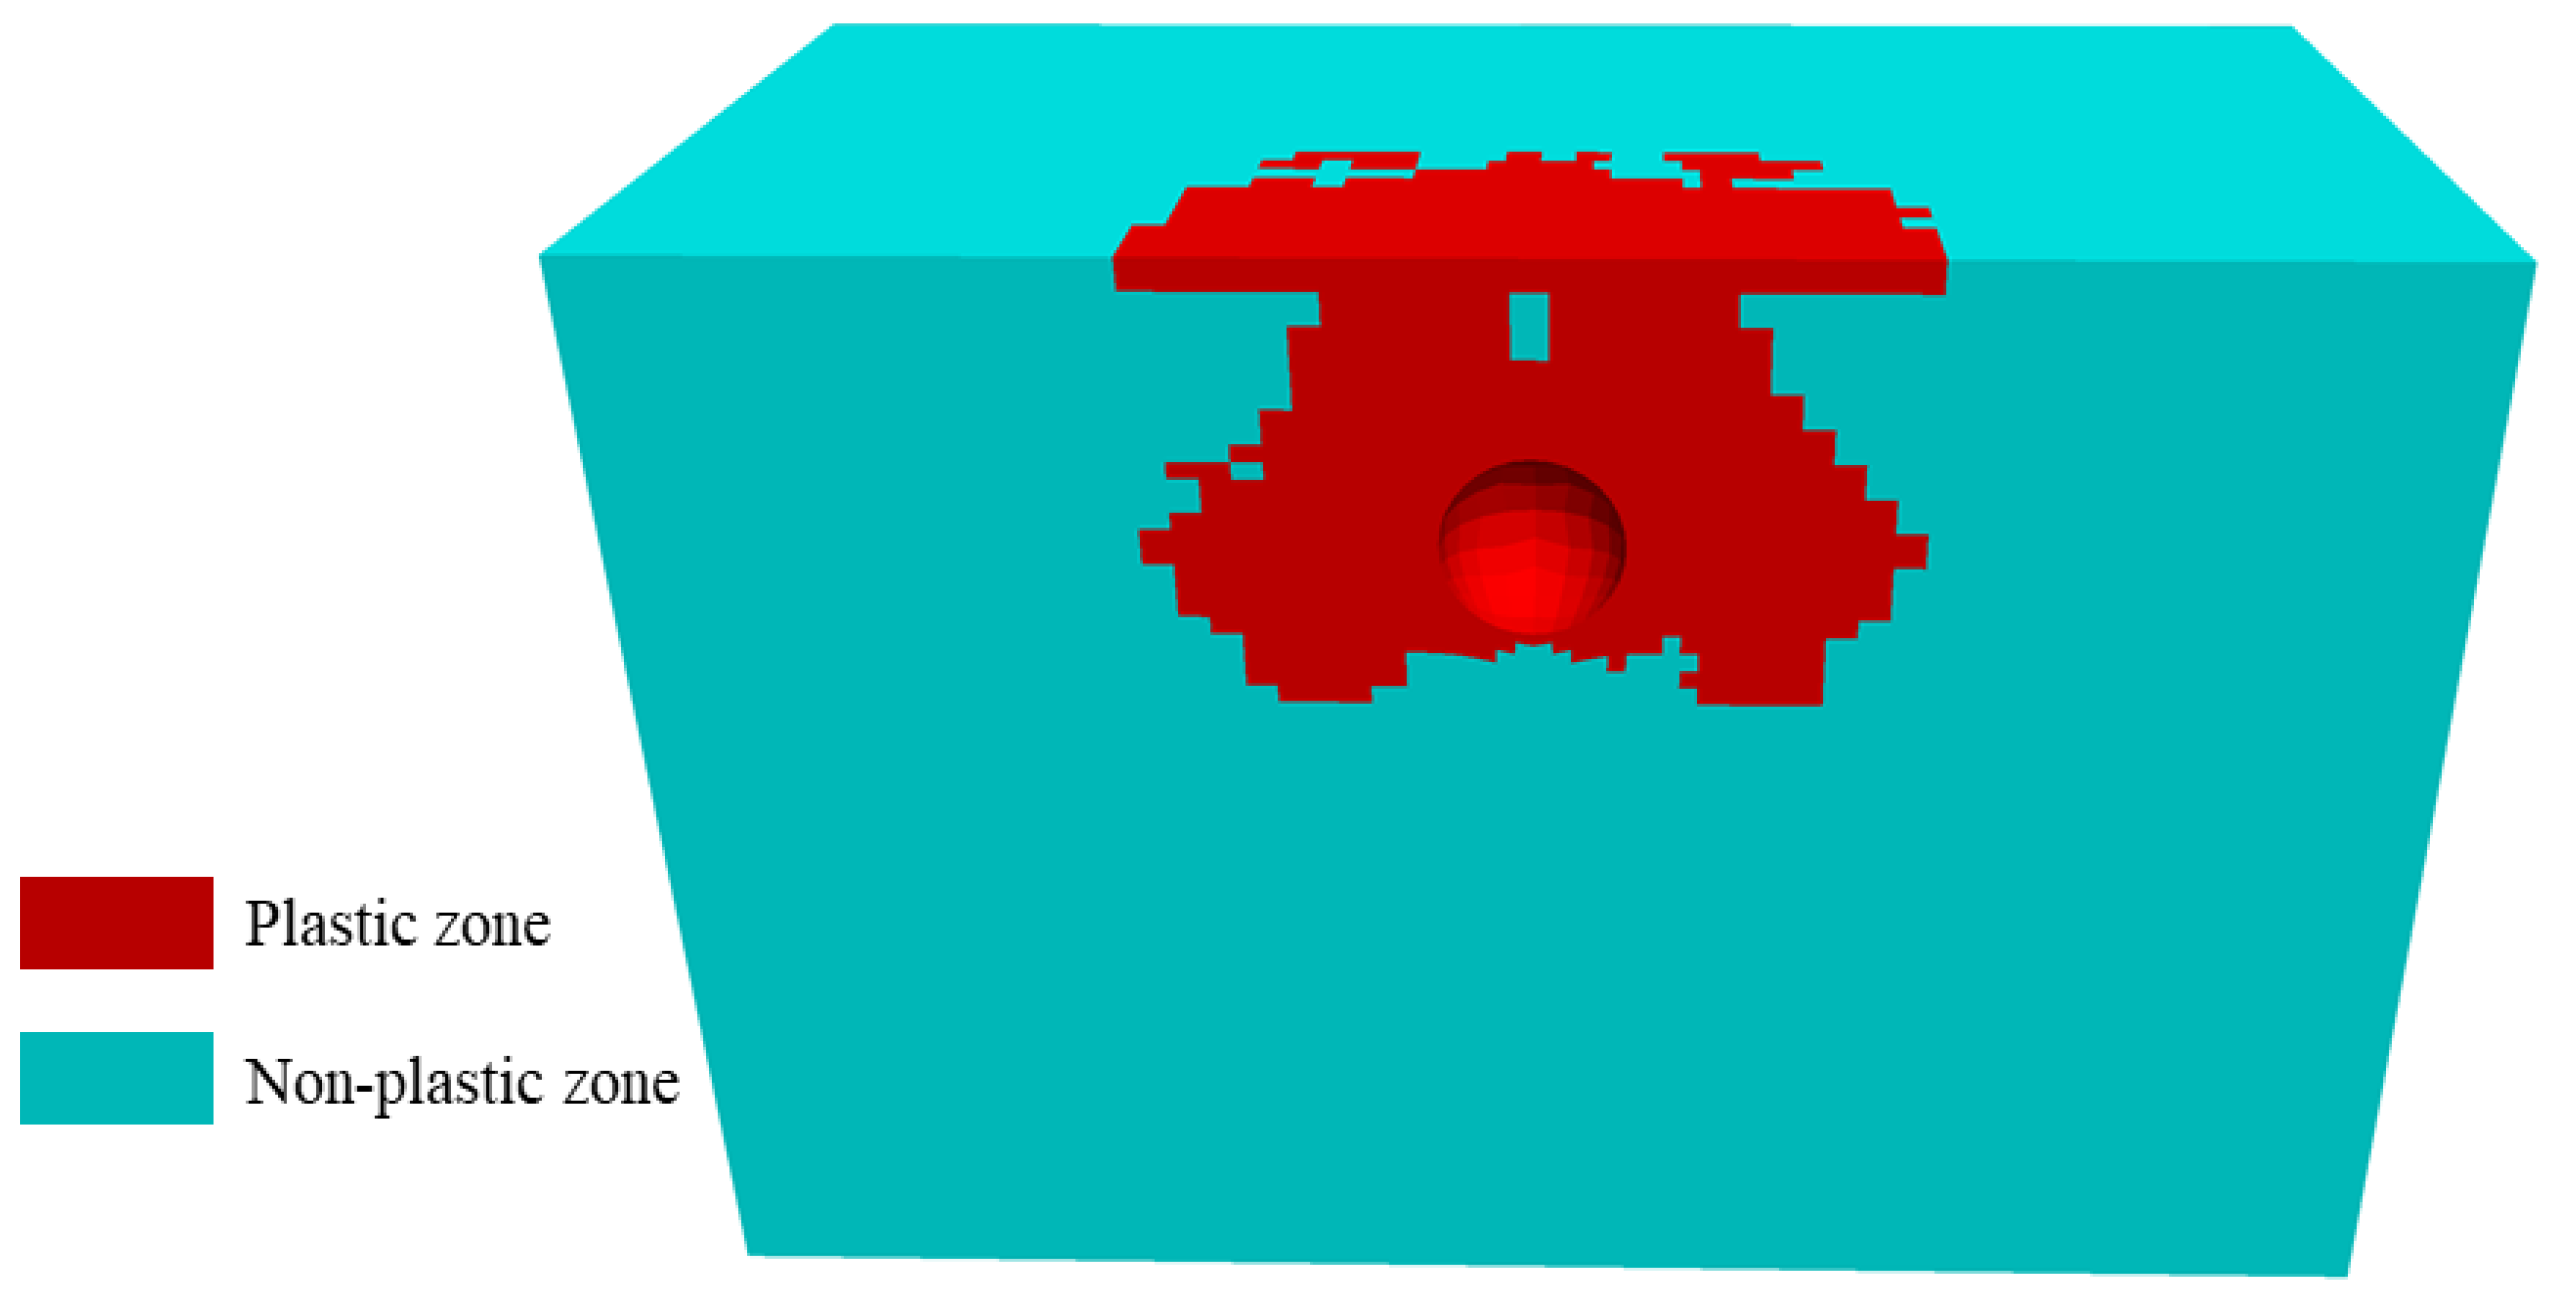
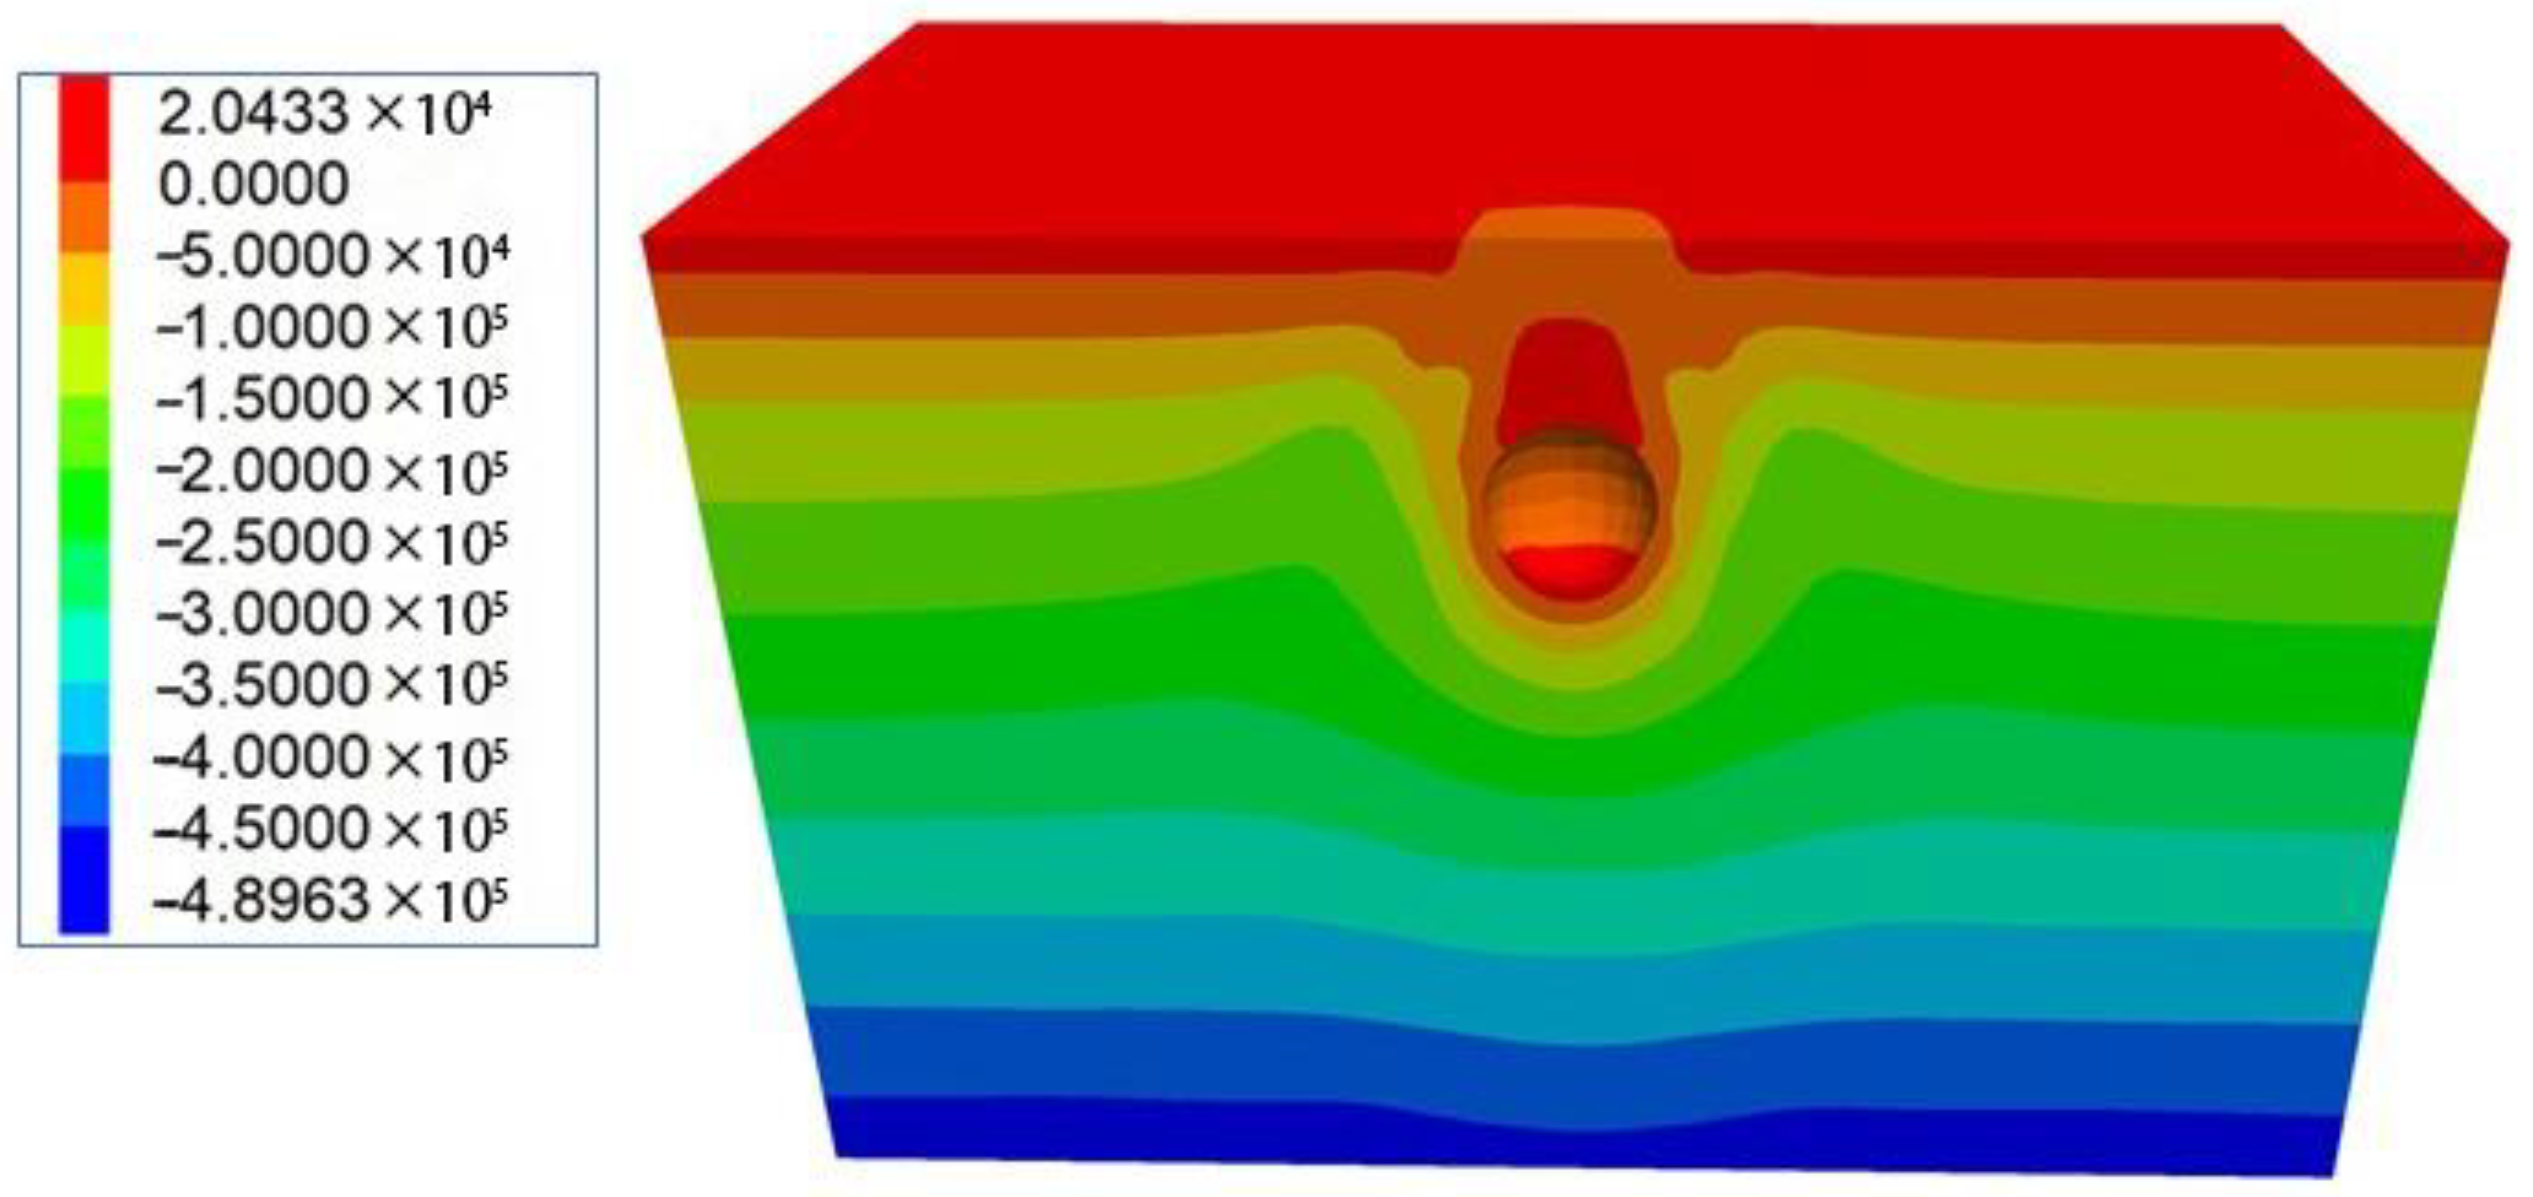
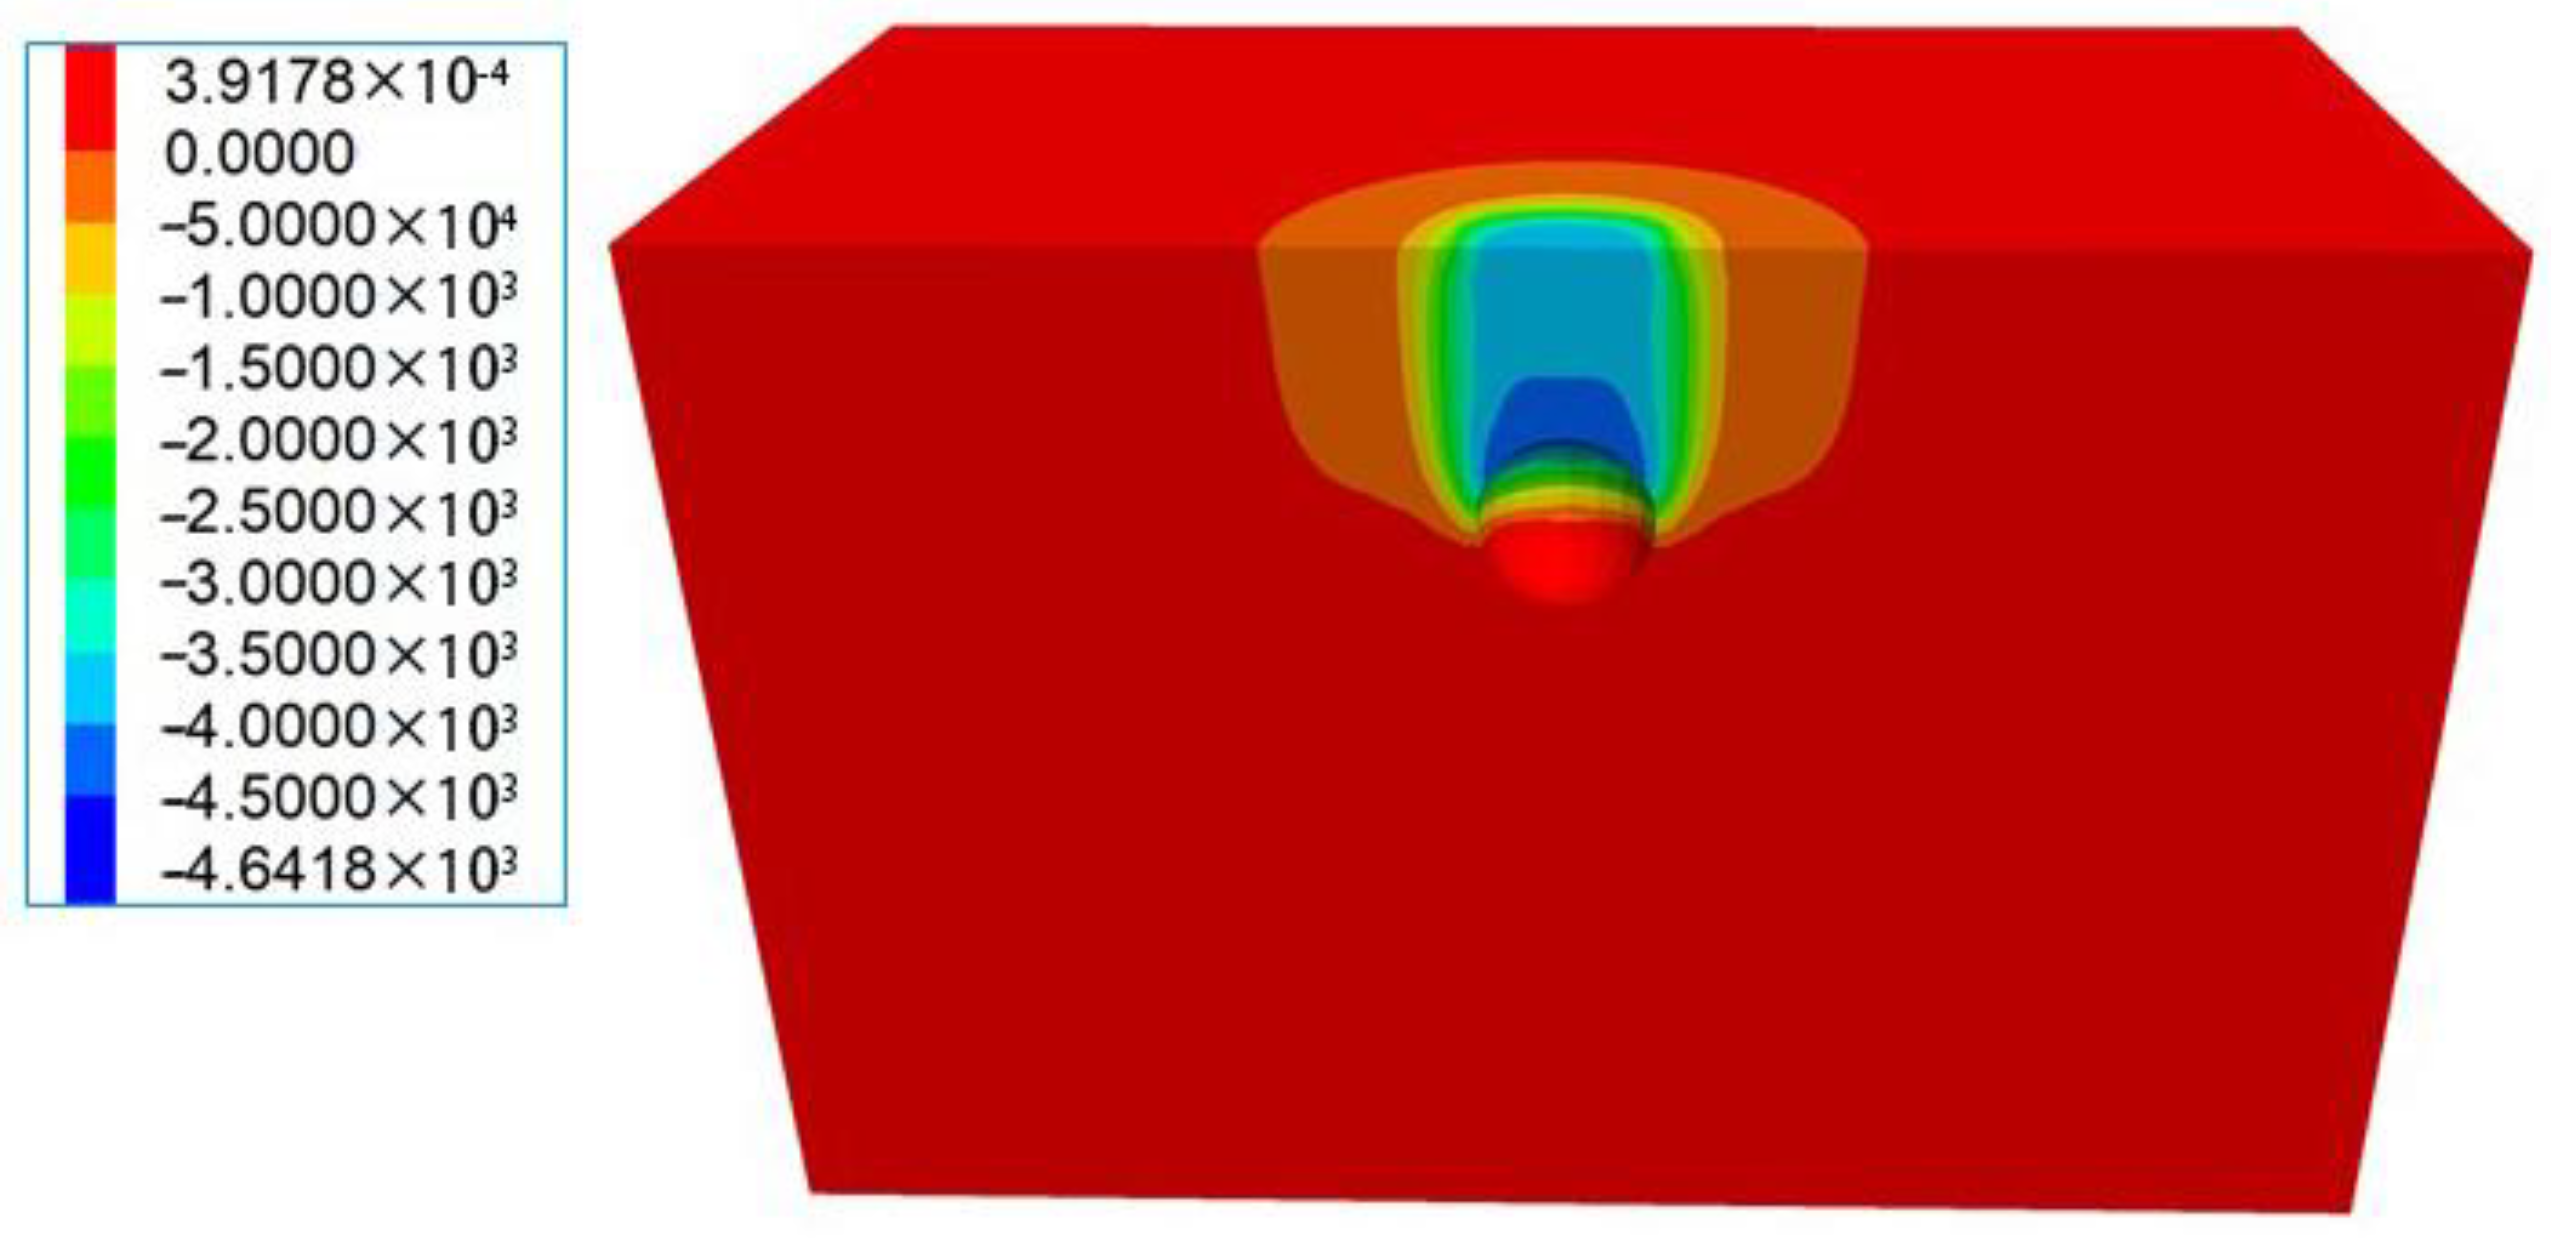
3.2. Numerical Simulation

The finite difference method (FDM) is an approximate method for solving partial differential equations [30]. The main principle is the direct difference approximation of the differential term in the differential equation such that the differential equation can be transformed into algebraic equations. Based on the parameters from the case, we established a numerical model based on the finite difference method to analyze the karst caves. During the analysis, the Mohr–Coulomb constitutive model was adopted. Dimensions of the numerical model are set as follows: the length, width, and height are 80 m, 40 m, and 50 m, respectively. The bottom and top of the model are fixed and free separately, while the remaining external boundaries are subject to normal constraints. Similarly, the groundwater table is 7.5 m away from the surface and the mechanical parameters in the numerical model can be obtained from Table 1. The vacuum absorption erosion force is applied to the upper surface of the cavity according to Equation (2). The distributions of the plastic zone, stress, and displacement are shown in Figure 6, Figure 7 and Figure 8.
Figure 6 illustrates the plastic zone traversing the surface, where the karst cave is in an unstable state. Figure 7 shows the stress concentration at the karst cave boundaries, indicating potential failures. In Figure 8, both the upper and lower portions of the karst cave exhibited deformation downward and upward, respectively, with the upper cave showing a maximum deformation of 5 mm. The impact of groundwater on the failure zone boundary is minimal and thus, α = β can be considered in the limit analysis method. The most critical area is concentrated in the upper part of the karst cave, aligning closely with the damage model of the improved Terzaghi theory. If considering the failure area to expand in the shape of a circular frustum of a cone, then limit analysis provides a more suitable failure model. Therefore, both failure models are reasonable but applicable to different situations.

3.3. Stability Analysis of the Karst Cave

(1) 
Protodyakonov’s pressure arch theory
Substituting Equation (1) results in
H min = 0.828 d 1 + tan 45 φ 2 f k = 13.2 m
In practice, the overburden clay thickness at the karst cave was 11 m, which was less than the critical overburden height. This indicates that the karst cave was potentially unstable with the possibility of collapse.
(2) 
Improved Terzaghi theory
Equation (15) is employed to calculate residual collapse resistance, as follows:
R = 2 K 0 γ tan φ d z 2 d γ 4 c + 4 K 0 tan φ z 1 γ γ d z M = 48 kPa
The calculation demonstrated that T < 0, which indicates that the karst cave was in an unstable state. According to Figure 7, the vertical stress of the karst cave boundary is approximately −50 kPa, demonstrating the accuracy of the improved Terzaghi theory.
(3) 
Limit analysis method
According to the collapse profile (Figure 5), the angle between perpendicular lines of the surface and failure boundary is minor (5°, namely α = β = 5°), thus substituting Equation (26) to obtain
K = P i P g + P l = 0.96
The calculation demonstrated that K < 1, which suggested that the karst cave was in an unstable state, as in the case of the improved Terzaghi theory.
To sum up, the three analytical methods have the same conclusion and are consistent with reality, which proves the accuracy of the two new methods. Compared with Protodyakonov’s pressure arch theory, the improved Terzaghi theory and limit analysis take into account more factors and can be closer to the actual situation.

4. Discussion

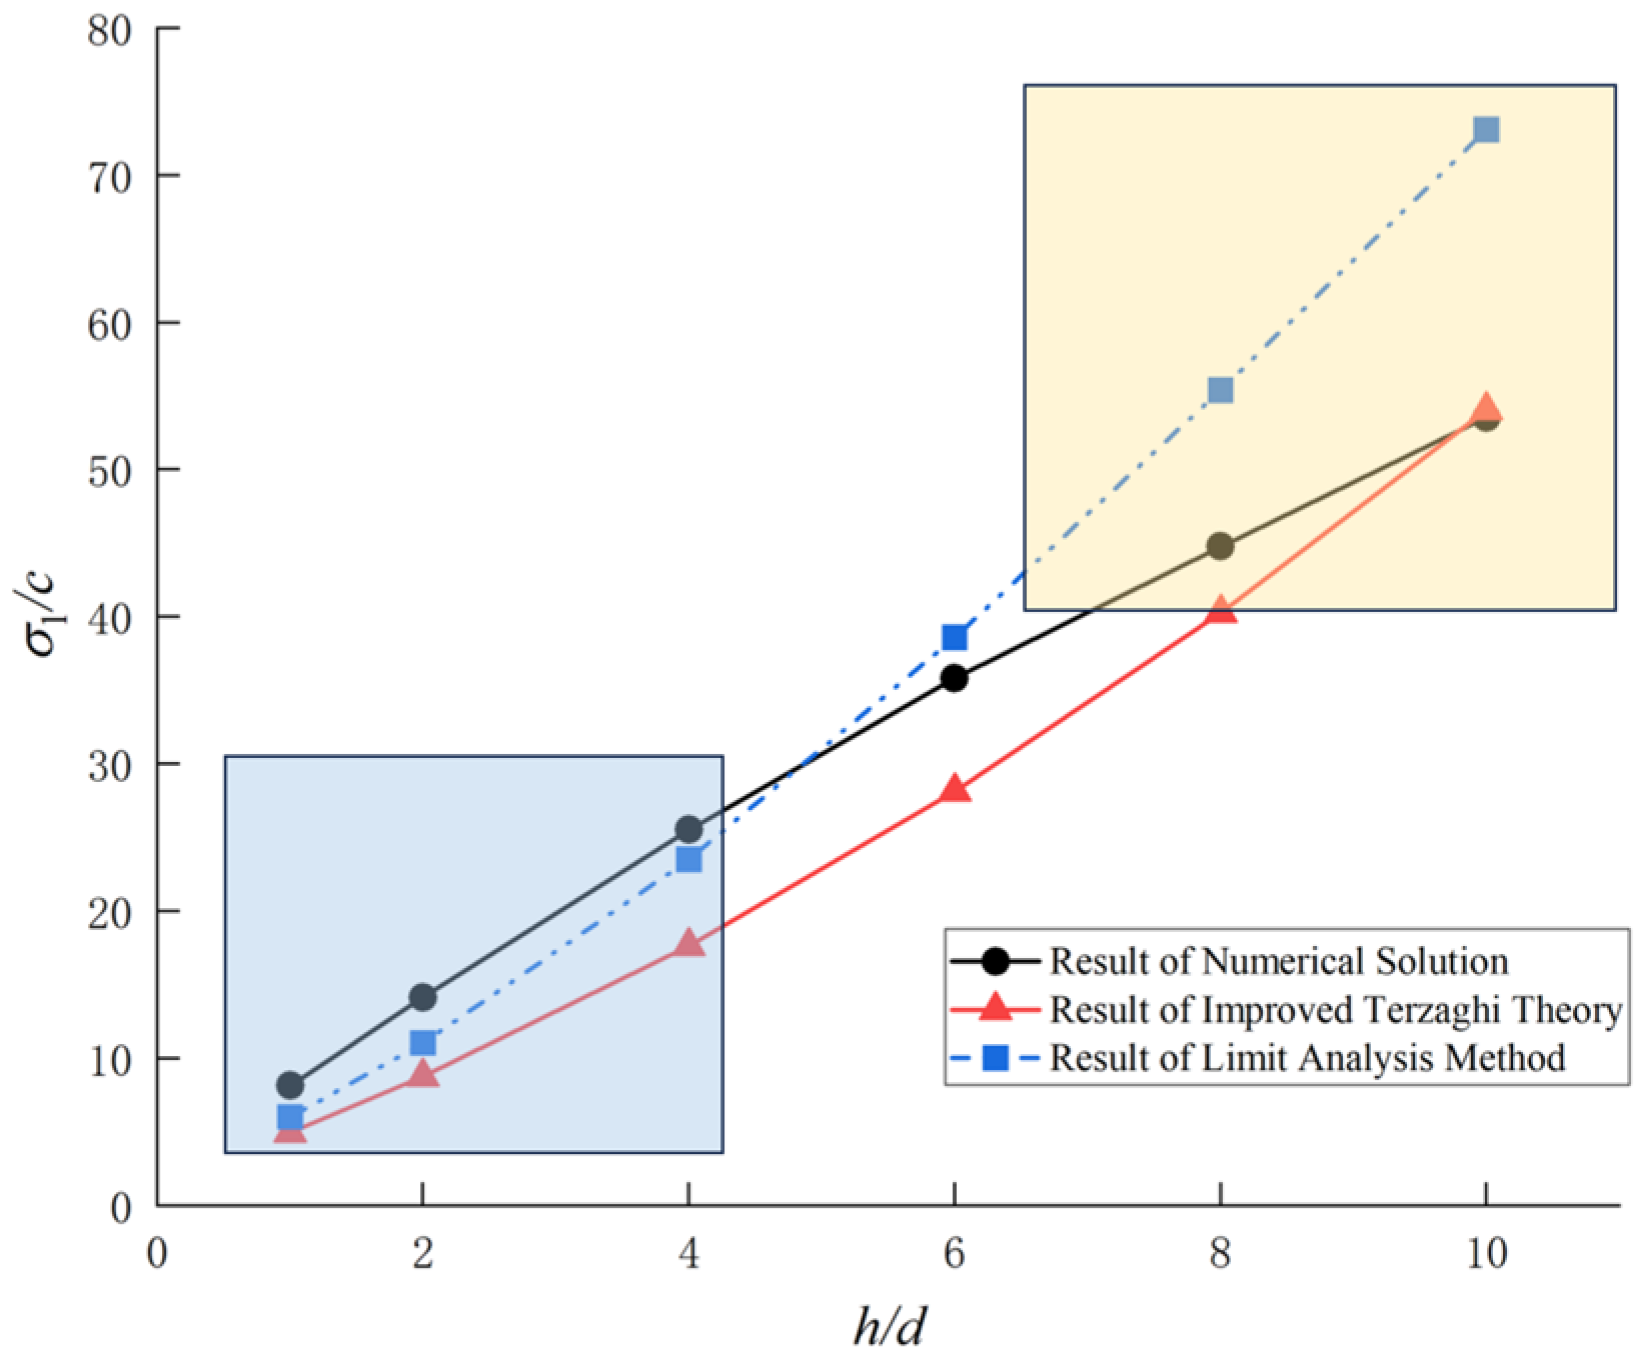
4.1. Comparison with the Numerical Solution

If the karst cave is located above the groundwater table and under the condition of limit equilibrium, Equations (10) and (26) can be converted to a relationship between dimensionless numbers. In order to compare with the work of Keawsawasvong [31], the relevant parameters need to be configured, i.e., static earth pressure coefficient K0 = 0.58, α = 0°, γd/c = 1, φ = 10°, and the variable is h/d, indicating the depth ratio of karst cave. The dependent variable is σ1/c, indicating the load factor of the karst cave. The results of the improved Terzaghi theory and limit analysis method in this study were compared with Keawsawasvong’s numerical solutions, which are presented in Figure 9.
As shown in Figure 9, σ1/c was positively related to h/d in all three cases, demonstrating the accuracy of improved Terzaghi theory and limit analysis method. When h/d was relatively small, as indicated by the blue area in Figure 9, signifying the development of the karst cave closer to the surface, the load factors σ1/c in three cases became similar; however, the limit analysis method yielded a higher accuracy. When h/d was relatively large, as indicated by the yellow area in Figure 9, the load factor in the improved Terzaghi theory was significantly closer to that in the numerical solutions than in the limit analysis method. For cases with a lower depth ratio, the limit analysis method was adopted, whereas, for those with a higher depth ratio, the improved Terzaghi theory should be utilized.

4.2. Parameter Analysis

Different from Keawsawasvong’s study [31], this study employed the critical surface load (σ1) at the point of limit equilibrium as an indicator of karst cave stability and a higher σ1 suggests enhanced stability. Subsequent sections can address the effects of karst cave development, soil shear strength, groundwater table, and boundary failure angle on the stability of karst cave.

4.2.1. Effect of Karst Cave Development

The diameter of the karst cave (d) and the overburden thickness (h) were adopted to represent the development of the karst cave. If the groundwater table is positioned below the karst cave, soil unit weight γ = 18.5 kN/m3, c = 24 kPa, φ = 14°, static earth pressure coefficient K0 = 0.58, the angle between perpendicular lines of the failure profile and surface α = 0°, and vacuum absorption erosion pressure is set as σp = 50 kPa [32]. The relationship between the critical surface load σ1 and the development of karst cave (d, h) is given in Figure 10.
In Figure 10, the dashed line “Limit Equilibrium” denotes the critical surface load σ1 = 0 kPa. This implies that, without a surface load, karst cave is stable. The upper part of the dashed line indicates the stable state of the karst cave. The lower part of the dashed line represents the failure of the karst cave. Moreover, the critical surface load σ1 is positively correlated with overburden thickness h and negatively correlated with d. This suggests that the larger h, the smaller d, and the more stable the karst cave. This result aligns with the relevant research [33,34] and the actual situation.

4.2.2. Effect of Shear Strength of the Soil

The shear strength of the soil is directly related to its cohesion (c) and internal friction angle (φ). When the groundwater table is located below the karst cave, the soil unit weight γ = 18.5 kN/m3, d = 6 m, h = 10 m, static earth pressure coefficient K0 = 0.58, the angle between perpendicular lines of the surface and failure profile α = 0°, and vacuum absorption erosion pressure σp = 50 kPa. The relationship between the critical surface load σ1 and the shear strength of soil c, φ is illustrated in Figure 11.
Figure 11 illustrates that the improved Terzaghi theory and limit analysis method yielded results with a constant difference when d = 6 m was fixed. Concurrently, the critical surface load σ1 increased with increases in c and φ, which was consistent with the shear strength of the soil and conclusions of previous studies [35,36].

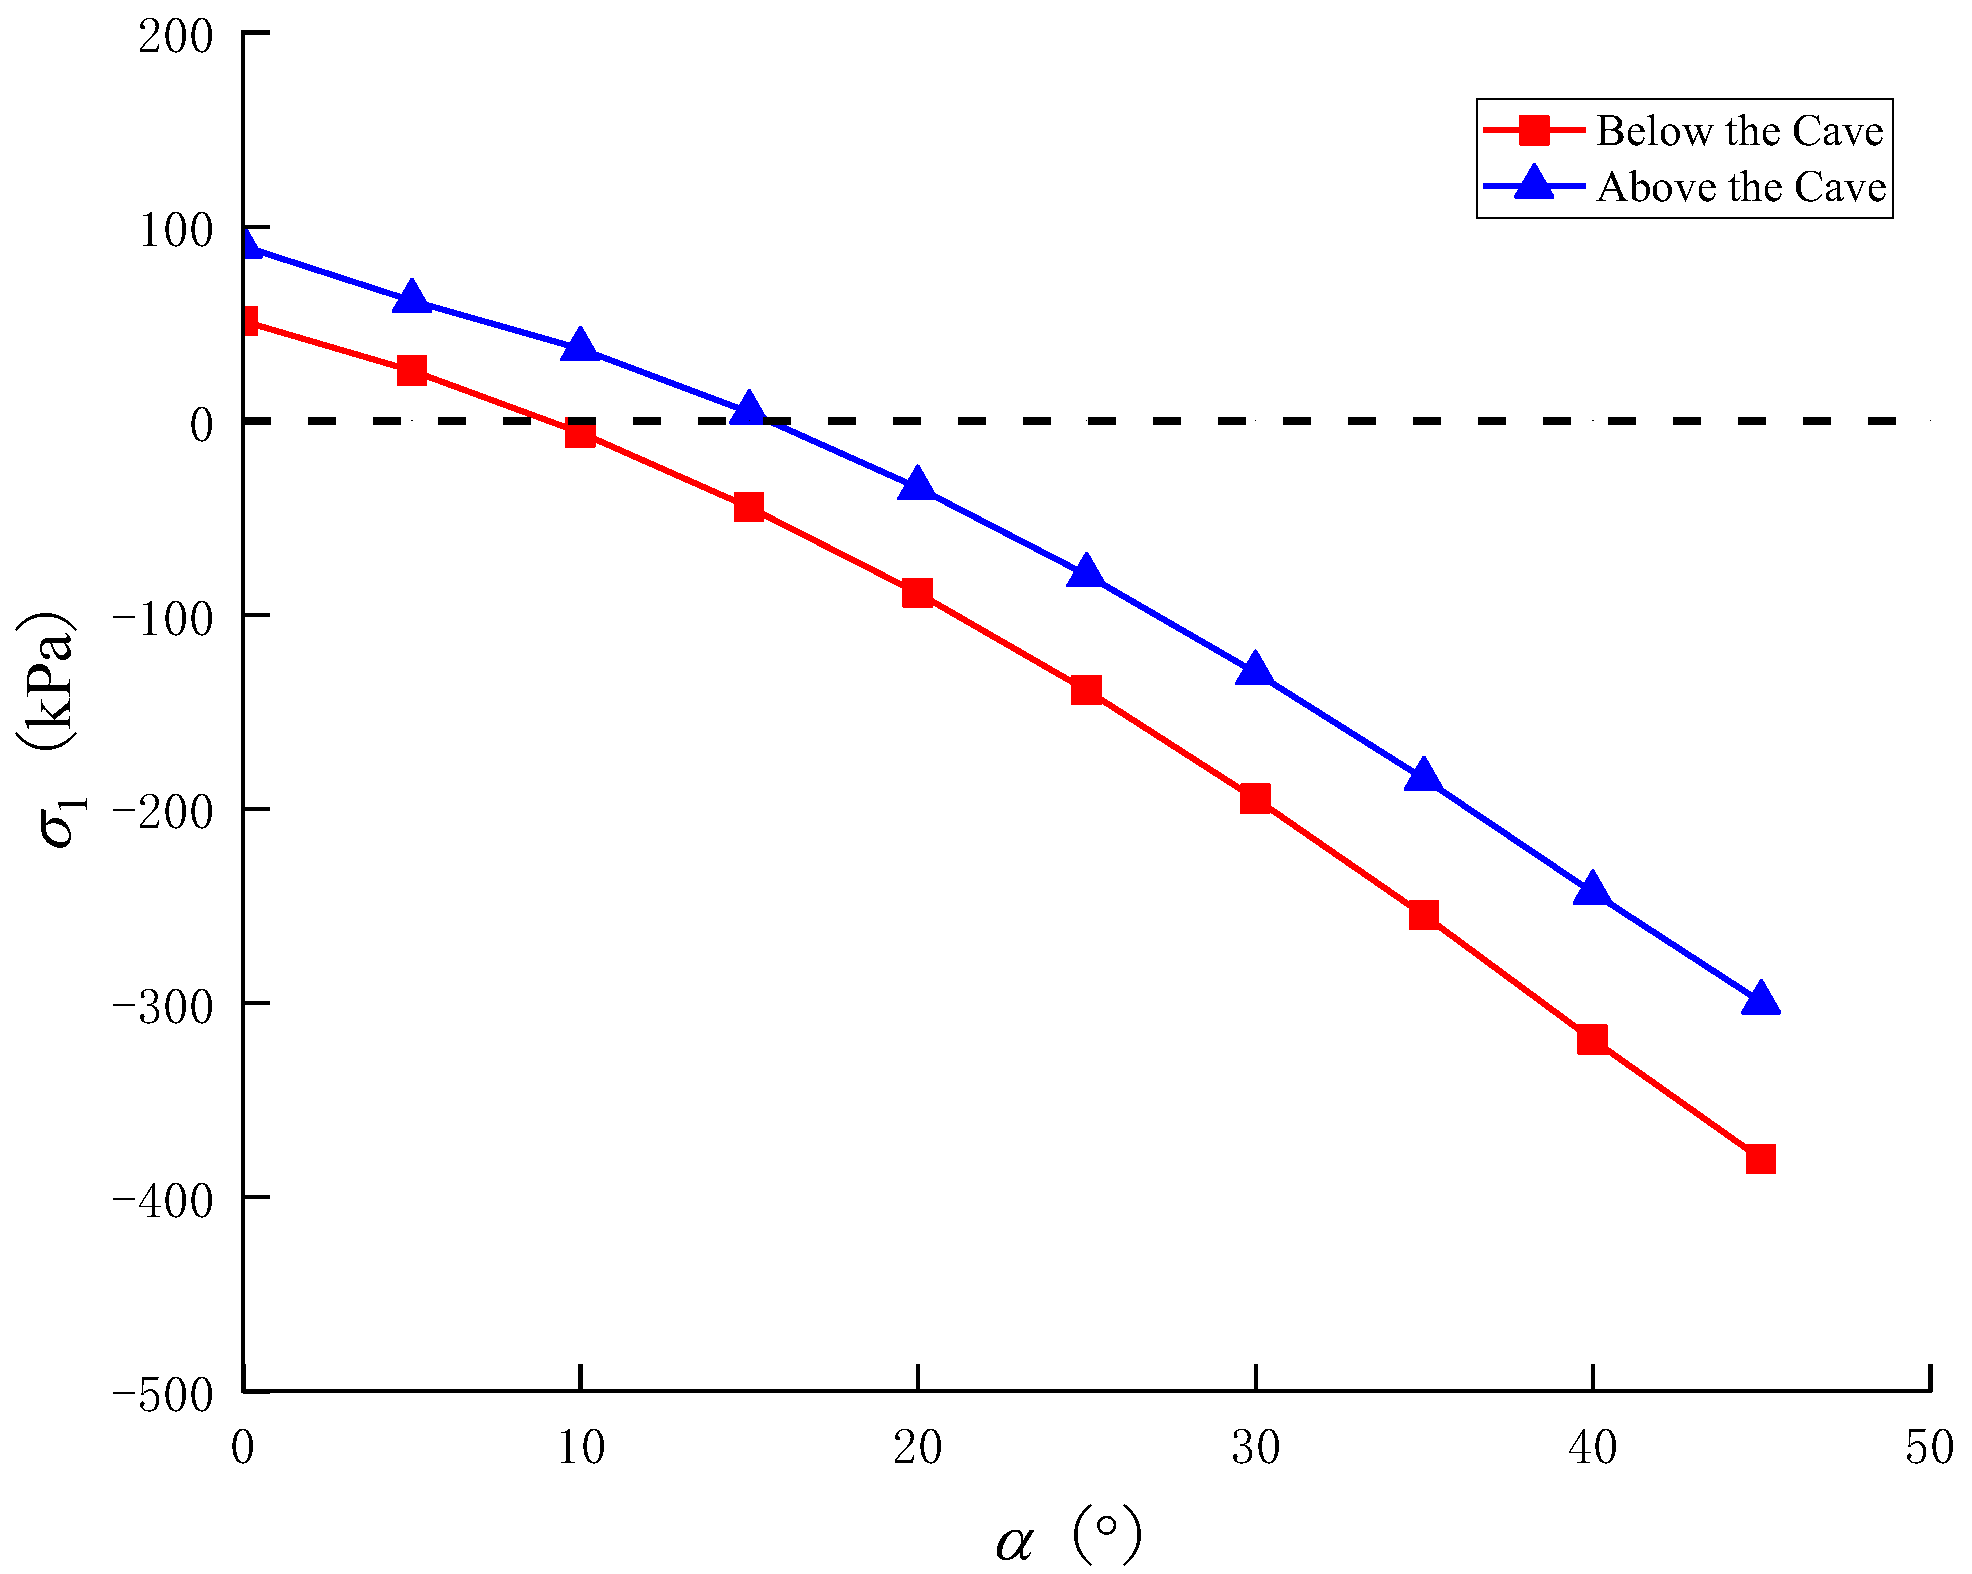
4.2.3. Effect of Groundwater Table and Boundary Failure Angle

If the groundwater table is located above the karst cave, α = β = 0° and other conditions are the same as those in Section 4.2.1 and Section 4.2.2, the relationship of the critical surface load σ1 and groundwater table z1 is shown in Figure 12.
Similarly, the difference between the results from the improved Terzaghi theory and the limit analysis method remained consistent. Notably, the groundwater table had a minimal impact on the critical surface load, implying that varying water levels within identical formations had little influence on karst cave stability. The primary effect of the groundwater table on karst caves was reflected in the dynamic changes in the groundwater table and the penetrating channel of pore and karst water [12].
It is assumed that α = β. If the groundwater table is located above the karst cave and 5 m away from the surface with other conditions consistent with those in Section 4.2.1 and Section 4.2.2, the relationship of the critical surface load σ1 and the boundary failure angle (α) is shown in Figure 13.
As shown in Figure 13, due to vacuum absorption erosion pressure σp, the underground water table below the karst cave is more unfavorable to the stability of the karst cave. When σp is 50 kPa, the gap between them is shown in Figure 13. As the boundary failure angle α increases, the critical surface load σ1 gradually decreases. When the karst cave expands, the larger the disturbance within the failure zone, the worse the stability of the karst cave becomes.

5. Conclusions

Considering the influence of groundwater, this study explored the 3D stability of karst caves based on an actual karst surface collapse case. We introduced the improved Terzaghi theory and upper bound method for the limit analysis method of a rigid body, offering effective formulas for calculating the stability coefficient and critical surface load to analyze the underground karst cave stability. Numerical simulations were performed to validate the analytical model using actual collapse cases. This study also investigated the effects of four kinds of parameters on karst cave stability, leading to the following conclusions.
(1)
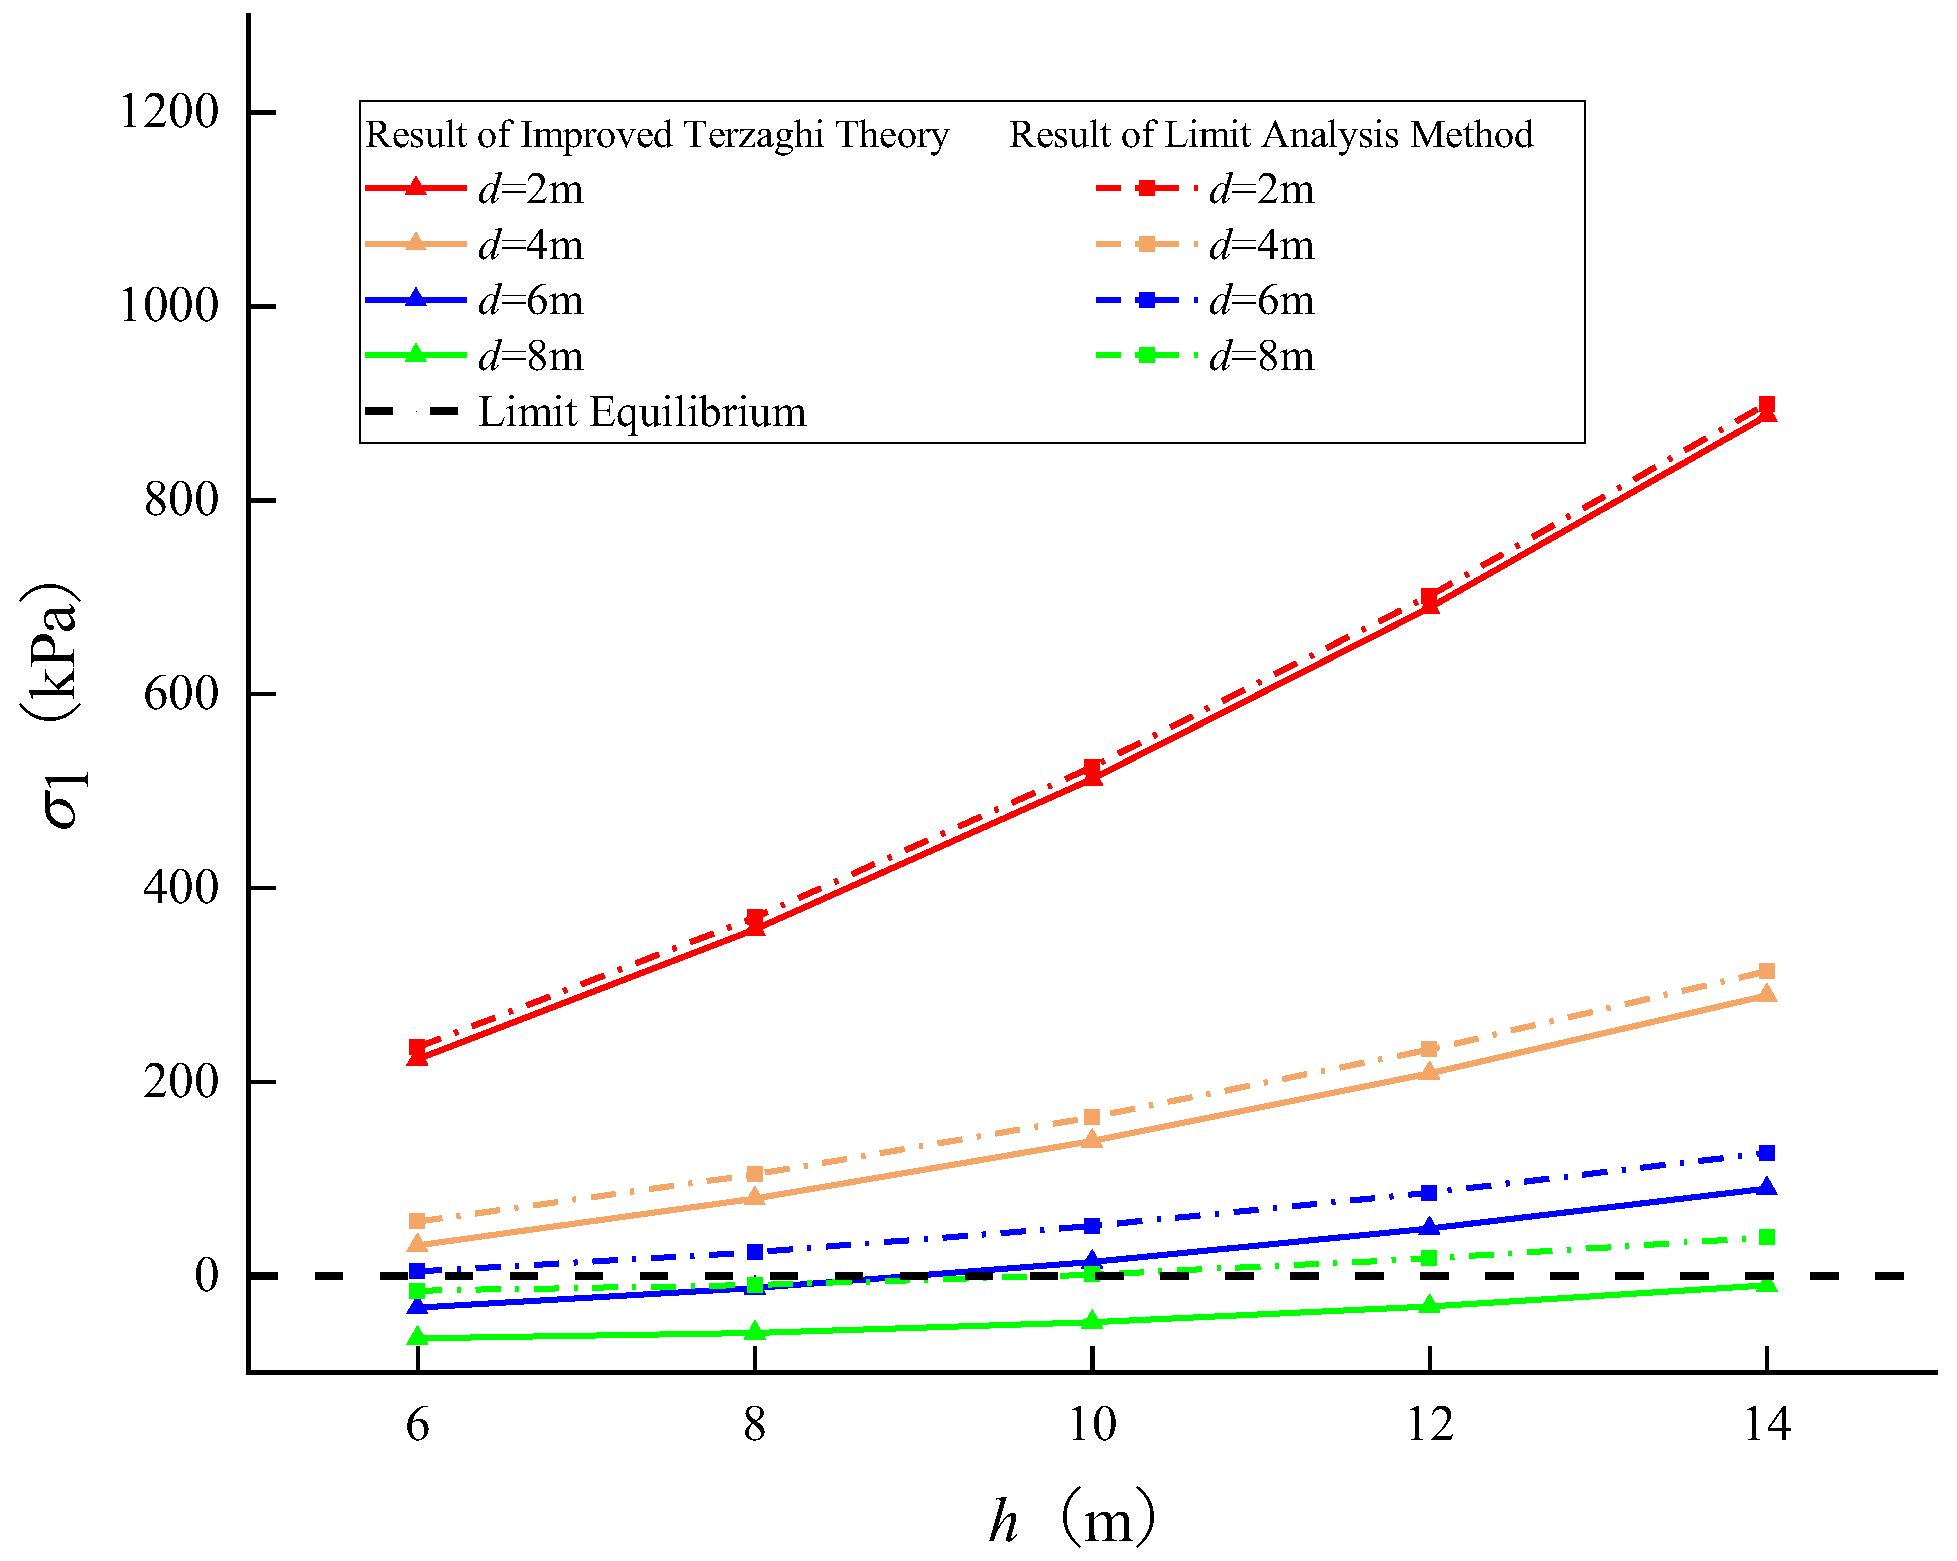
The improved Terzaghi theory focuses on karst caves and their overburden, whereas the limit analysis method focuses only on the overburden. Consequently, the results of the improved Terzaghi theory are lower than those of the limit analysis method. Moreover, the difference between them increases with an increase in the diameter of karst cave d;
(2)
For karst caves, the overburden thickness h is proportional to their stability, while the diameter of the karst cave d is inversely proportional to their stability. Additionally, the shear strength of soil (c and φ) is proportional to their stability. When the groundwater table is regarded as stable, the effect of groundwater level z1 on the stability of karst caves is limited and the stability of karst caves decreases as boundary failure angle α or β increases.
This paper forms a complete set of the scientific research process of ‘formula derivation-case study-comparative analysis’. The results are consistent with the existing geotechnical engineering knowledge, which verifies the accuracy of the stability analysis formula.

Author Contributions

W.Y.: Writing—Original draft preparation; R.L.: Writing—Review and Editing; S.T.: Investigation; F.T.: Conceptualization, Methodology, Writing—Review and Editing; H.W. and J.L.: Data curation. All authors have read and agreed to the published version of the manuscript.

Funding

This research was funded by the National Natural Science Foundation of China (Grant No. 42277165), the Hubei Natural Science Foundation (No. 2023AFD217), and the Fundamental Research Funds for the Central Universities, China University of Geosciences (Wuhan) (Grant No. CUGCJ1821).

Institutional Review Board Statement

Not applicable.

Informed Consent Statement

Not applicable.

Data Availability Statement

Some or all data, models, or codes that support the findings of this study are available from the corresponding author upon reasonable request.

Conflicts of Interest

The authors declare no conflicts of interest.

References

  1. Jurkovšek, B.; Biolchi, S.; Furlani, S.; Kolar-Jurkovšek, T.; Zini, L.; Jež, J.; Tunis, G.; Bavec, M.; Cucchi, F. Geology of the classical karst region (SW Slovenia–NE Italy). J. Maps 2016, 12 (Suppl. S1), 352–362. [Google Scholar] [CrossRef]
  2. Stevanović, Z. Karst waters in potable water supply: A global scale overview. Environ. Earth Sci. 2019, 78, 662. [Google Scholar] [CrossRef]
  3. De Waele, J.; Plan, L.; Audra, P. Recent developments in surface and subsurface karst geomorphology: An introduction. Geomorphology 2009, 106, 1–8. [Google Scholar] [CrossRef]
  4. Delle Rose, M.; Federico, A.; Parise, M. Sinkhole genesis and evolution in Apulia, and their interrelations with the anthropogenic environment. Nat. Hazard. Earth Syst. Sci. 2004, 4, 747–755. [Google Scholar] [CrossRef]
  5. Heidari, M.; Khanlari, G.; Beydokhti, A.T.; Momeni, A. The formation of cover collapse sinkholes in North of Hamedan, Iran. Geomorphology 2011, 132, 76–86. [Google Scholar] [CrossRef]
  6. Pando, L.; Pulgar, J.A.; Gutiérrez-Claverol, M. A case of man-induced ground subsidence and building settlement related to karstified gypsum (Oviedo, NW Spain). Environ. Earth Sci. 2013, 68, 507–519. [Google Scholar] [CrossRef]
  7. Kamran, M.; Hu, X.; Hussain, M.A.; Sanaullah, M.; Ali, R.; He, K. Dynamic Response and Deformation Behavior of Kadui-2 Landslide Influenced by Reservoir Impoundment and Rainfall, Baoxing, China. J. Earth Sci. 2023, 34, 911–923. [Google Scholar] [CrossRef]
  8. Jiang, F.; Dai, J.; Lei, M.; Qin, Y.; Jiang, X.; Meng, Y. Experimental study on the critical triggering condition of soil failure in subsidence sinkholes. Environ. Earth Sci. 2015, 74, 693–701. [Google Scholar] [CrossRef]
  9. Jeong, S.W.; Yum, B.W.; Ryu, D.W.; Lee, H.J.; Jung, B. The influence of clay content on cave-ins in tank model tests and monitoring indicators of sinkhole formation. Appl. Sci. 2019, 9, 2346. [Google Scholar] [CrossRef]
  10. Chen, X.; Gao, X.; Li, H.; Xue, M.; Gan, X.; Song, Y. Model test analysis of groundwater level fluctuations on Karst cover deformation taking the monolithic structure of Guilin as an example. Appl. Sci. 2023, 13, 1747. [Google Scholar] [CrossRef]
  11. Tan, F.; Tan, W.; Yan, F. Model test analysis of subsurface cavity and ground collapse due to broken pipe leakage. Appl. Sci. 2022, 12, 13017. [Google Scholar] [CrossRef]
  12. Parise, M.; Lollino, P. A preliminary analysis of failure mechanisms in karst and man-made underground caves in Southern Italy. Geomorphology 2011, 134, 132–143. [Google Scholar] [CrossRef]
  13. Ma, D.; Bai, H.; Wang, Y. Mechanical behavior of a coal seam penetrated by a karst collapse pillar: Mining-induced groundwater inrush risk. Nat. Hazards 2015, 75, 2137–2151. [Google Scholar] [CrossRef]
  14. Guo, L.; Wang, S.; Sun, L.; Kang, Z.; Zhao, C. Numerical simulation and experimental studies of karst caves collapse mechanism in fractured-vuggy reservoirs. Geofluids 2020, 2020, 8817104. [Google Scholar] [CrossRef]
  15. Mao, W.; Li, W.; Rasouli, R.; Ahmad, N.; Zheng, H.; Huang, Y. Numerical Simulation of Liquefaction-Induced Settlement of Existing Structures. J. Earth Sci. 2023, 34, 339–346. [Google Scholar] [CrossRef]
  16. Hatzor, Y.H.; Wainshtein, I.; Mazor, D.B. Stability of shallow karstic caverns in blocky rock masses. Int. J. Rock Mech. Min. Sci. 2010, 47, 1289–1303. [Google Scholar] [CrossRef]
  17. Likitlersuang, S.; Keawsawasvong, S.; Tanapalungkorn, W. Undrained stability analysis of spherical cavities in non-homogeneous clay. Transp. Infrastruct. Geotechnol. 2023, 11, 152–170. [Google Scholar] [CrossRef]
  18. Hartmann, A.; Goldscheider, N.; Wagener, T.; Lange, J.; Weiler, M. Karst water resources in a changing world: Review of hydrological modeling approaches. Rev. Geophys. 2014, 52, 218–242. [Google Scholar] [CrossRef]
  19. Jiang, C.; Zhao, M.; Cao, W. Stability analysis of subgrade cave roofs in karst region. J. Cent. South Univ. Tech. 2008, 15, 38–44. [Google Scholar] [CrossRef]
  20. Jia, L.; Li, L.; Meng, Y.; Wu, Y.; Pan, Z.; Yin, R. Responses of cover-collapse sinkholes to groundwater changes: A case study of early warning of soil cave and sinkhole activity on Datansha Island in Guangzhou, China. Environ. Earth Sci. 2018, 77, 488. [Google Scholar] [CrossRef]
  21. Augarde, C.E.; Lyamin, A.V.; Sloan, S.W. Prediction of undrained sinkhole collapse. J. Geotech. Geoenviron. Eng. 2003, 129, 197–205. [Google Scholar] [CrossRef]
  22. Keawsawasvong, S.; Ukritchon, B. Undrained stability of a spherical cavity in cohesive soils using finite element limit analysis. J. Rock Mech. Geotech. Eng. 2019, 11, 1274–1285. [Google Scholar] [CrossRef]
  23. Liu, Z.; Cao, P.; Wang, F.; Meng, J.; Cao, R.; Liu, J. Three-dimensional upper bound limit analysis of tunnel stability with an extended collapse mechanism. KSCE J. Civ. Eng. 2022, 26, 5318–5327. [Google Scholar] [CrossRef]
  24. Liu, Z.-Z.; Cao, P.; Lin, H.; Meng, J.-J.; Wang, Y.-X. Three-dimensional upper bound limit analysis of underground cavities using nonlinear Baker failure criterion. Trans. Nonferr. Metal. Soc. China 2020, 30, 1916–1927. [Google Scholar] [CrossRef]
  25. Hu, Z.; Zhang, J.; Yang, Y.; Wang, Z.; Xie, Y.; Qiu, J.; He, S.; Wang, X. Study on the surrounding rock pressure characteristics of loess tunnel based on statistical analysis in China. Appl. Sci. 2022, 12, 6329. [Google Scholar] [CrossRef]
  26. He, K.; Liu, C.; Wang, S. Karst collapse related to over-pumping and a criterion for its stability. Environ. Geol. 2003, 43, 720–724. [Google Scholar] [CrossRef]
  27. Kezdi, A. Lateral earth pressure. In Foundation Engineering Handbook; ASCE Press: Alexander Bell Drive Reston, VA, USA, 1975. [Google Scholar]
  28. Zhang, R.; Chen, G.; Zou, J.; Zhao, L.; Jiang, C. Study on roof collapse of deep circular cavities in jointed rock masses using adaptive finite element limit analysis. Comput. Geotech. 2019, 111, 42–55. [Google Scholar] [CrossRef]
  29. Jafari, P.; Fahimifar, A. Upper-Bound face stability analysis of rectangular shield-driven tunnels in undrained clays. Comput. Geotech. 2022, 146, 104739. [Google Scholar] [CrossRef]
  30. Zhou, P.; Zhou, P. Finite difference method. In Numerical Analysis of Electromagnetic Fields; Springer: Berlin/Heidelberg, Germany, 1993; pp. 63–94. [Google Scholar]
  31. Keawsawasvong, S. Limit analysis solutions for spherical cavities in sandy soils under overloading. Innov. Infrastruct. Solut. 2021, 6, 33. [Google Scholar] [CrossRef]
  32. Xiong, Q.; Zeng, J.; Wang, R.; Wang, W.; Li, J.; Yang, C.; Tao, L. Study on the genesis and mechanical model of karst collapse in the first-order terrace of Wuhan Yangtze river. Resour. Environ. Eng. 2020, 34, 408. [Google Scholar]
  33. Zhao, Y.; Shi, Y.; Wu, F.; Sun, R.; Feng, H. Characterization of the sinkhole failure mechanism induced by concealed cave: A case study. Eng. Fail. Anal. 2021, 119, 105017. [Google Scholar] [CrossRef]
  34. Shiau, J.; Chudal, B.; Keawsawasvong, S. Three-dimensional sinkhole stability of spherical cavity. Acta Geotech. 2022, 17, 3947–3958. [Google Scholar] [CrossRef]
  35. Zhao, L.; Huang, S.; Zhang, R.; Zuo, S. Stability analysis of irregular cavities using upper bound finite element limit analysis method. Comput. Geotech. 2018, 103, 1–12. [Google Scholar] [CrossRef]
  36. Zhao, Y.; Li, X.; Tai, P.; Huang, L.; Pu, B.; Chen, R. Upper bound limit analysis of roof collapse of deep cavities in unsaturated soils. Int. J. Numer. Anal. Met. Geomech. 2022, 46, 1224–1240. [Google Scholar] [CrossRef]
Figure 1. Failure models developed based on improved Terzaghi theory. (a) Groundwater table below karst cave; (b) groundwater table above karst cave.
Applsci 14 08252 g001
Figure 2. Failure model and compatible velocity field when the groundwater table is below the karst cave. (a) Three-dimensional failure model; (b) failure model profile; (c) compatible velocity field.
Applsci 14 08252 g002
Figure 3. Failure model and compatible velocity field when groundwater table is above karst cave. (a) Three-dimensional failure model; (b) failure model profile; (c) compatible velocity field.
Applsci 14 08252 g003
Figure 4. Collapse pit on Parrot Avenue in Wuhan, China.
Applsci 14 08252 g004
Figure 5. Schematic diagram of collapse pit. (a) Stage 1; (b) Stage 2; (c) Stage 3.
Applsci 14 08252 g005
Figure 6. Distribution of plastic zone.
Applsci 14 08252 g006
Figure 7. Distribution of vertical stress.
Applsci 14 08252 g007
Figure 8. Distribution of vertical displacement.
Applsci 14 08252 g008
Figure 9. Relationship between load factor σ1/c and depth ratio h/d of the karst cave.
Applsci 14 08252 g009
Figure 10. Relationship between the critical surface load σ1 and development of the karst cave (d, h).
Applsci 14 08252 g010
Figure 11. Relationship between the critical surface load σ1 and shear strength of soil.
Applsci 14 08252 g011
Figure 12. Relationship between the critical surface load σ1 and groundwater table z1.
Applsci 14 08252 g012
Figure 13. Relationship between the critical surface load σ1 and boundary failure angle α.
Applsci 14 08252 g013
Table 1. Karst cave and mechanical parameters.
Diameter of karst cave d/m7
Overburden height h/m 11
Cohesion of natural soil c/kPa24
Internal friction angle of natural soil φ14
Unit weight of natural soil γ/(kN/m3)18.5
Cohesion of saturated soil c´/kPa19.2
Internal friction angle of saturated soil φ´/°11.2
Unit weight of saturated soil γ´/(kN/m3)9.5
Disclaimer/Publisher’s Note: The statements, opinions and data contained in all publications are solely those of the individual author(s) and contributor(s) and not of MDPI and/or the editor(s). MDPI and/or the editor(s) disclaim responsibility for any injury to people or property resulting from any ideas, methods, instructions or products referred to in the content.

