Article

Exploring the Association between Pro-Inflammation and the Early Diagnosis of Alzheimer’s Disease in Buccal Cells Using Immunocytochemistry and Machine Learning Techniques

Bioinformatics and Human Electrophysiology Laboratory, Department of Informatics, Ionian University, 49100 Corfu, Greece
*
Author to whom correspondence should be addressed.
Appl. Sci. 2024, 14(18), 8372; https://doi.org/10.3390/app14188372
Submission received: 25 July 2024 / Revised: 12 September 2024 / Accepted: 14 September 2024 / Published: 18 September 2024
(This article belongs to the Special Issue Advances in Bioinformatics and Biomedical Engineering)

Abstract

:
The progressive aging of the global population and the high impact of neurodegenerative diseases, such as Alzheimer’s disease (AD), underscore the urgent need for innovative diagnostic and therapeutic strategies. AD, the most prevalent neurodegenerative disorder among the elderly, is expected to affect 75 million people in developing countries by 2030. Despite extensive research, the precise etiology of AD remains elusive due to its heterogeneity and complexity. The key pathological features of AD, including amyloid-beta plaques and hyperphosphorylated tau protein, are established years before clinical symptoms appear. Recent studies highlight the pivotal role of neuroinflammation in AD pathogenesis, with the chronic activation of the brain’s immune system contributing to the disease’s progression. Pro-inflammatory cytokines, such as TNF- α , IL-1 β , and IL-6, are elevated in AD and mild cognitive impairment (MCI) patients, suggesting a strong link between peripheral inflammation and CNS degeneration. There is a pressing need for minimally invasive, cost-effective diagnostic methods. Buccal mucosa cells and saliva, which share an embryological origin with the CNS, show promise for AD diagnosis and prognosis. This study integrates cellular observations with advanced data processing and machine learning to identify significant biomarkers and patterns, aiming to enhance the early diagnosis and prevention strategies for AD.

1. Introduction

The progressive aging of the world’s population and the high impact of major human pathologies, including neurodegenerative diseases, have catalyzed the emergence of new tools that could lead to preventive, early diagnosis, or therapeutic strategies. Alzheimer’s disease (AD), the most common neurodegenerative disorder among the elderly, accounts for 60–70% of all dementia cases and carries a high morbidity rate, with serious social and economic consequences [1]. By 2030, it is estimated that approximately 75 million people in developing countries will be affected by AD. While each person experiences biological aging differently, aging is widely recognized as a gradual decline in molecular, cellular, tissue, and, ultimately, organ function, leading to a loss of physiological integrity, which includes the underlying pathology of AD [2]. Despite extensive research on the pathological and clinical aspects of AD, its precise etiology remains unknown due to the disease’s heterogeneity and complexity.
The hallmarks of AD pathology, namely amyloid-beta (A β ) formation and extracellular deposits of plaques and hyperphosphorylated tau protein correlated with neurofibrillary tangles (NFTs), which are linked to synaptic and neuronal loss [3,4], are now recognized to develop several years before any clinical symptoms become apparent in patients. Despite extensive investigation into the mechanisms behind the pathology of amyloid-beta (A β ) plaques, hyperphosphorylated tau aggregates, and neurofibrillary tangles (NFT), a clear understanding of AD’s pathogenesis remains elusive, hindering efforts to prevent the disease.
In recent years, numerous clinical and research studies have demonstrated the strong correlation between neuroinflammation and neurodegeneration, with a well-balanced innate and adaptive immune system participating in the inflammatory pathways of the central nervous system (CNS) [5,6]. Neuroinflammation, unlike other risk factors or genetic causes of AD, appears to have a pivotal role as a result rather than as a cause of the AD pathology background. Chronic and persistent activation of the innate immune system of the brain triggers the release and inflammatory cascade of pro-inflammatory and toxic products, such as cytokines and reactive oxygen species, which facilitates the A β and NFT pathologies [7,8,9,10]. The increased presence of pro-inflammatory cytokines, TNF-α, IL-2, IL-1 β , and IL-6 in the CNS and blood of AD and MCI patients [11] suggests a strong correlation between Alzheimer’s disease and MCI patients in a peripheral inflammation state, and its crucial role in the mechanisms associated with aging and neuroinflammation disorders [12]. It is well known that the upregulation of pro-inflammatory cytokines that can affect brain function is a consequence of a chronic low-grade state of inflammation [13,14,15]. Pro-inflammatory cytokines TNFa, IL-1 β , and IL-6 have been described as having a fundamental role in the integrity of the blood–brain barrier (BBB) and its specific defensive functions. During AD progression, the upregulation of TNF-α and IL-6 is linked to the alteration of BBB function, facilitating the crossover of lymphocytes and macrophages from the periphery into the brain, supporting the strong relationship between the immune system and central nervous system (CNS) [16,17,18].
Aging or peripheral inflammatory conditions can also lead to alterations in the blood–brain barrier, allowing immune cells to enter the brain tissue and potentially supporting neuropathological processes [19,20] depending on the duration and intensity of stimulation. The in-depth interpretation and translation of these pathological pathways that could form a potential connection between normal aging and risk factors that lead to neuroinflammation and AD is of great importance for prevention and potential lifestyle interventions [21,22]. Since prevention is crucial in managing AD, the development of new trial designs, diagnostic approaches, and technological solutions using data mining techniques are anticipated to enhance its effectiveness and have a greater impact in the field of prevention.
To date, there has been no minimally invasive, straightforward, and cost-effective procedure available for the early detection or prevention of AD. Apart from the cerebrospinal fluid (CSF) approach, which is unpleasant and unsuitable for routine use, a range of candidate biomarkers from blood samples have been proposed. Although these biomarkers have not yet been validated, they represent a potentially more cost-effective and relatively less invasive approach that could offer valuable information for the early diagnosis or prognosis of the disease or serve as a screening tool [5,6,23,24,25,26]. In recent years, buccal mucosa cells and saliva have emerged as promising tool for the potential diagnosis, prognosis, or screening of AD. This interest stems from their shared embryological origin with the central nervous system (CNS) from differentiated ectodermal tissue. These materials are expected to provide insights into changes related to brain neurodegeneration and the AD pathology [11,27,28,29]. Many studies have shown significant structural and buccal epithelium differences during normal aging or in AD and MCI patients compared with healthy individuals [7,8,9,10].
Buccal cells, associated with the immunocytochemical expression of peripheral pro-inflammatory cytokines, including TNF-α, IL-1 β , and IL-6, have demonstrated the association between peripheral inflammation and CNS degeneration in individuals with MCI and AD or the elderly. This includes the activation and release of various peripheral pro-inflammatory cytokines and antigens, such as TNF- α , IL-1 β , and IL-6, that can penetrate the BBB and provoke specific responses within the brain. Additionally, factors such as insulin levels, insulin receptor resistance, and adipose tissue are implicated in increasing the risk of AD [30,31,32,33,34,35].
This study aims to bridge the gap between clinical and computational methodologies to enhance the understanding and detection of Alzheimer’s disease. By integrating detailed cellular observations with advanced data processing and machine learning techniques, this research seeks to identify significant biomarkers and patterns associated with AD. The goal is to develop minimally invasive, cost-effective, and reliable methods for the early diagnosis and prevention of AD, thereby contributing to better management and potentially mitigating the impact of this neurodegenerative disorder on the aging population.

2. Materials and Methods

2.1. Sample Collection

A cohort of 162 individuals was included in this study, comprising 140 healthy individuals with no symptoms of dementia or cognitive deficits and 22 patients diagnosed with mild cognitive impairment (MCI) or Alzheimer’s disease (AD). The participants, ranging in age from 18 to 80 years, were randomly selected, without gender, literacy, or socioeconomic restrictions. Importantly, none of the participants presented signs of oral injury at the time of buccal cell collection. Buccal cell samples were obtained from the inner cheeks of each participant using soft cyto-brushes. The collected material was partially prepared as smears, immediately fixed in 95% alcohol, and stained using the Papanicolaou (Pap) method for cytomorphological analysis.

2.2. Immunological Analysis

For immunological analysis, additional slides were prepared from the buccal cell samples. These slides were transferred to 4% formaldehyde in PBS for a minimum of 30 min, air-dried for 1 h, and stored in sealed boxes at −4 °C until immunostaining procedures were performed. The antibodies used for immunocytochemistry included TNF α (52B83), IL-1 β (E7-2-hIL1 β ), and IL-6R α (H-7), all mouse monoclonal antibodies from Santa Cruz Biotechnology Inc., each at a dilution of 1:50. The antibodies showed brown cytoplasmic expression when stained with DAB Quanto Chromogen.
Microscope slides containing buccal cell smears were evaluated by visual scoring. Buccal cells were classified as basal, intermediate, differentiated, or karyolitic based on their cytoplasmic and nuclear features and ratios (Pap stain). This stain is valuable in staining a variety of bodily secretions and cell smears (nuclei: blue, superficial cells: pink, intermediate cells: blue). Hematoxylin Gill was selected as it is the lightest basophilic stain and does not overstain the specimen, but it complements the other aspects of the specimen, such as the cytoplasm. The frequency and proportion of these different cell populations were analyzed. Additionally, the cytoplasmic expression of buccal cells stained by the immunocytochemical method was evaluated and scored as mild–negative (<10%), medium (10–50%), and high (>50%) antibody expression according to two variable factors, i.e., counting the number of positively stained cells and scoring the intensity of the staining.

2.3. Data Analysis

Data preprocessing was carried out using Python’s pandas library [36]. The dataset comprised 162 instances across 13 variables, with 9 variables retained for analysis. Categorical variables were converted to numerical values; for example, sex was encoded as 1 for male and 0 for female. Age was categorized into six groups (0–19, 20–25, 26–35, 36–50, 51–65, 65+) and encoded numerically from 0 to 5. The tag for analysis was transformed into three categorical values: 0 for health, 1 for neuro, and 2 for other disease profiles. Health represents a cohort with no symptoms of dementia or cognitive deficits, neuro represent patients diagnosed with MCI and AD, and other denotes a cohort with the positive expression of TNF- α , IL-1 β , and IL-6Rα; smoking; and a neurodegenerative history.
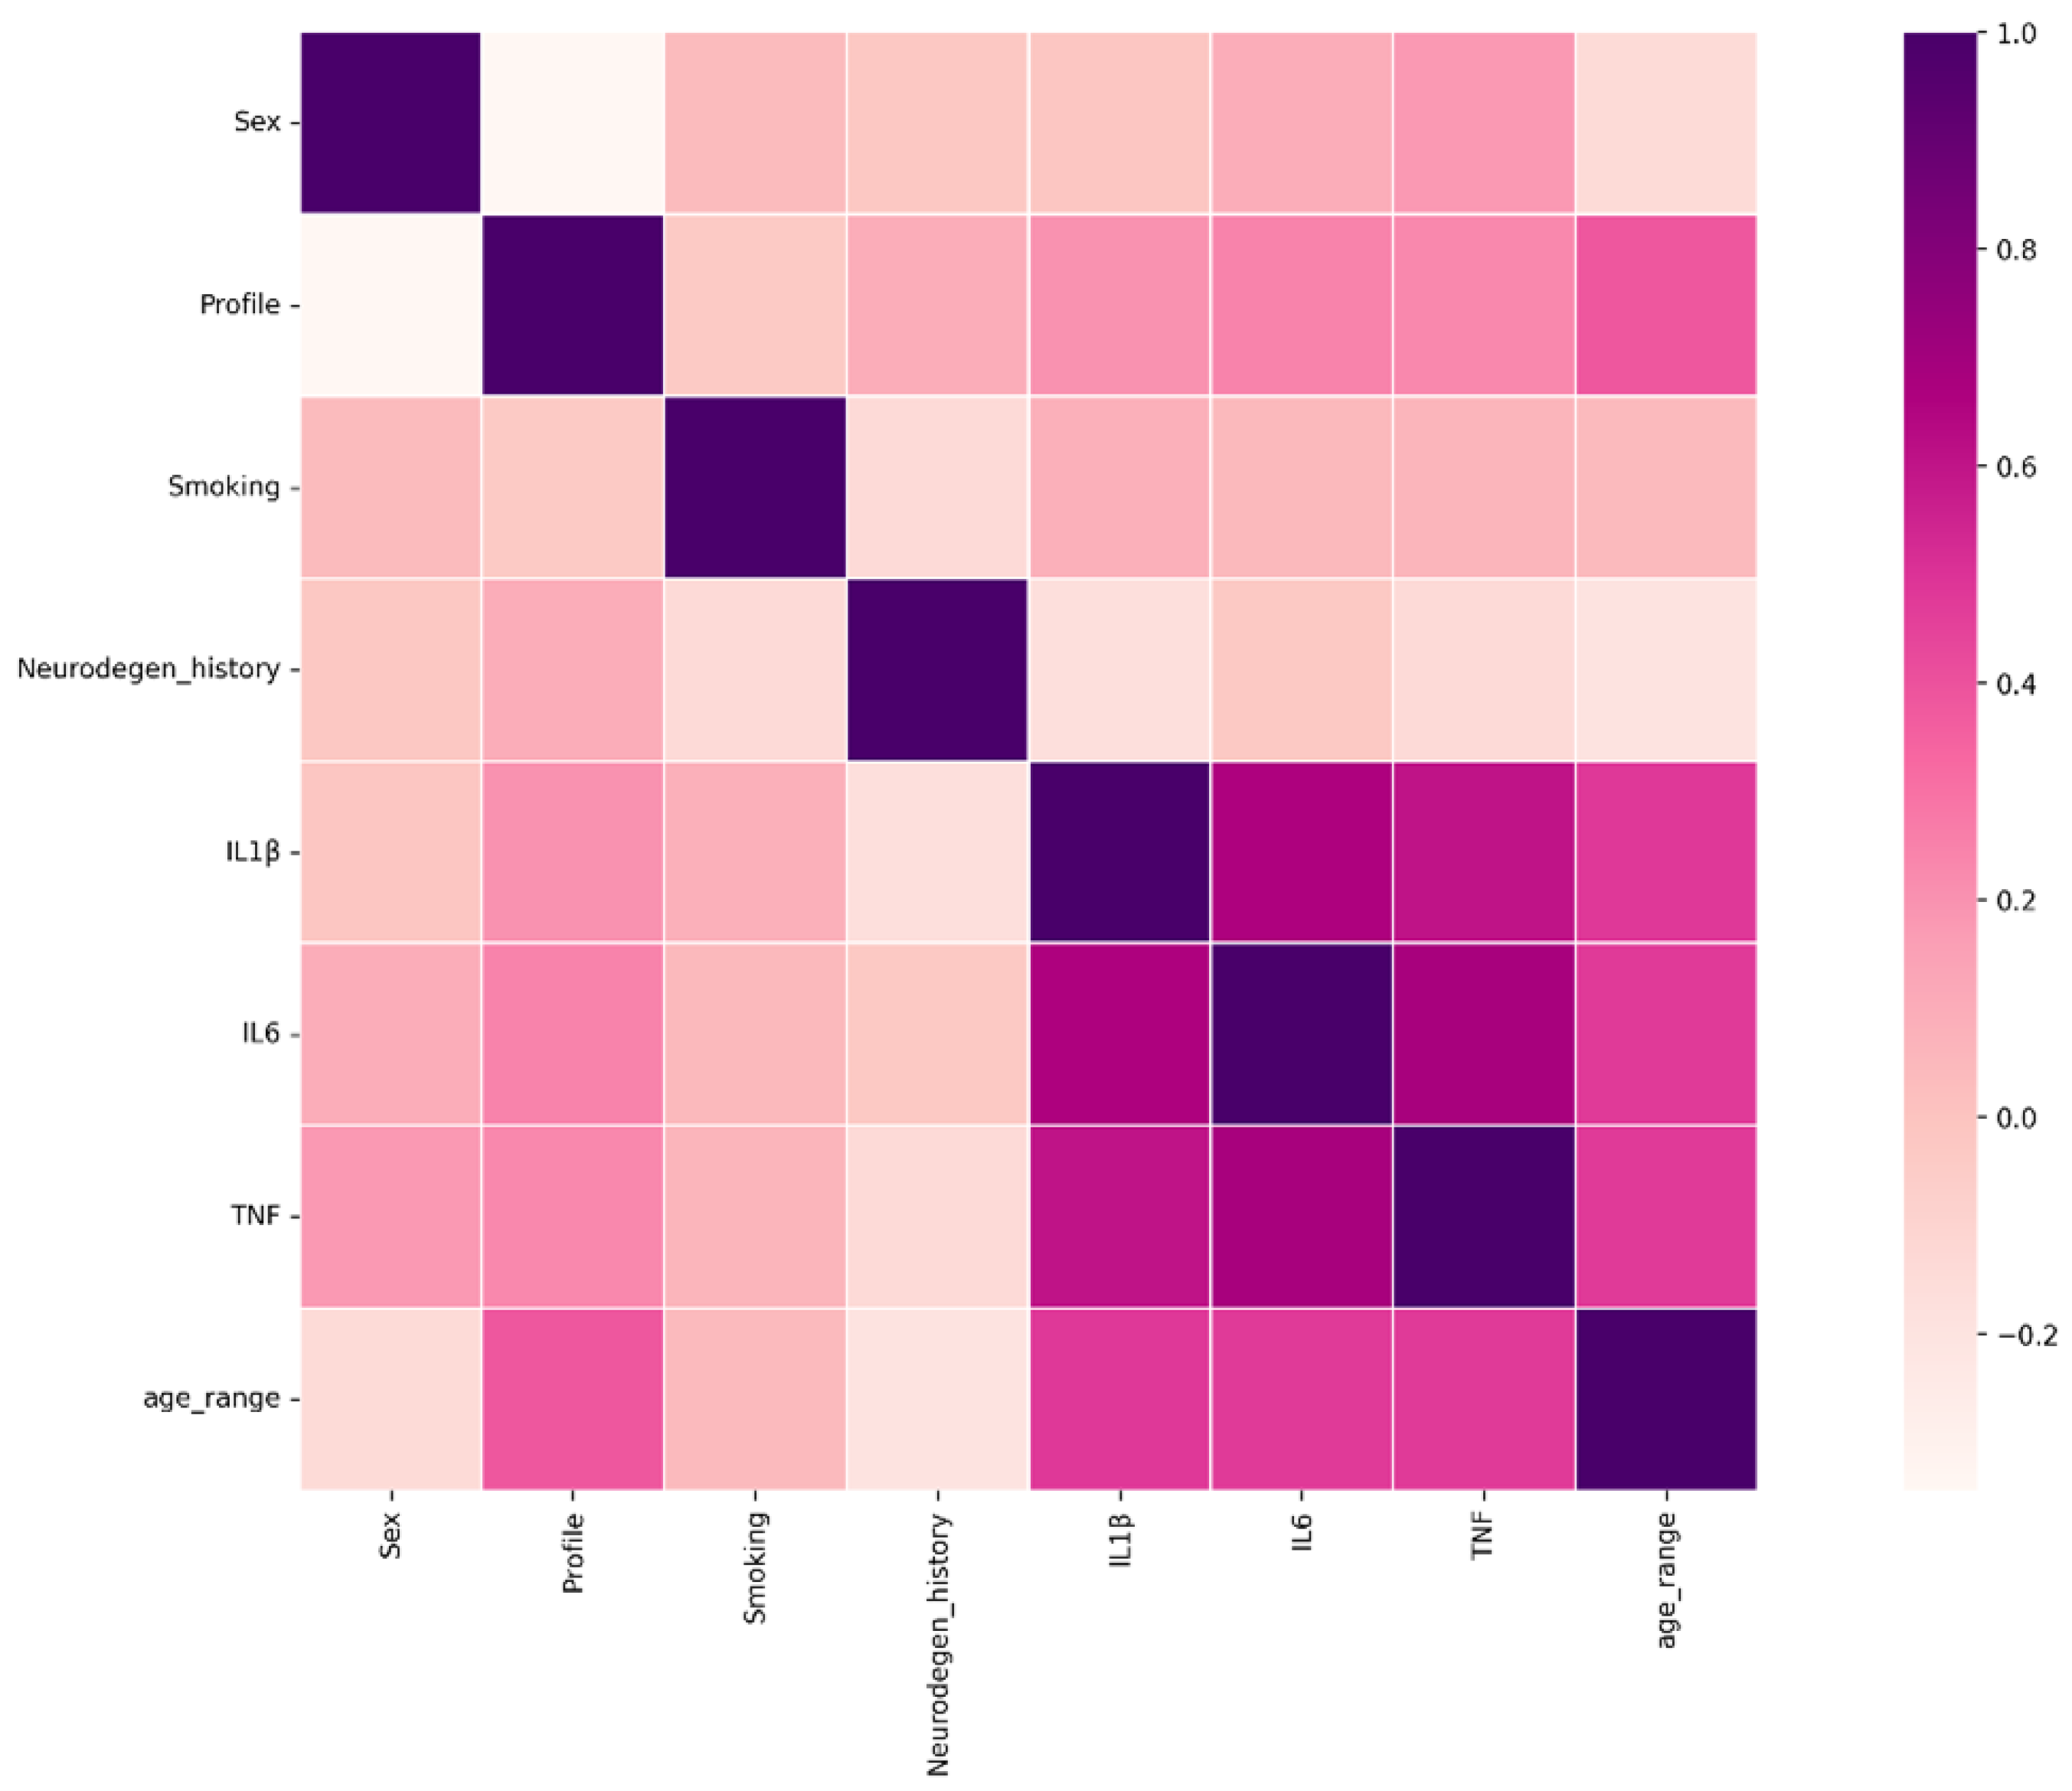
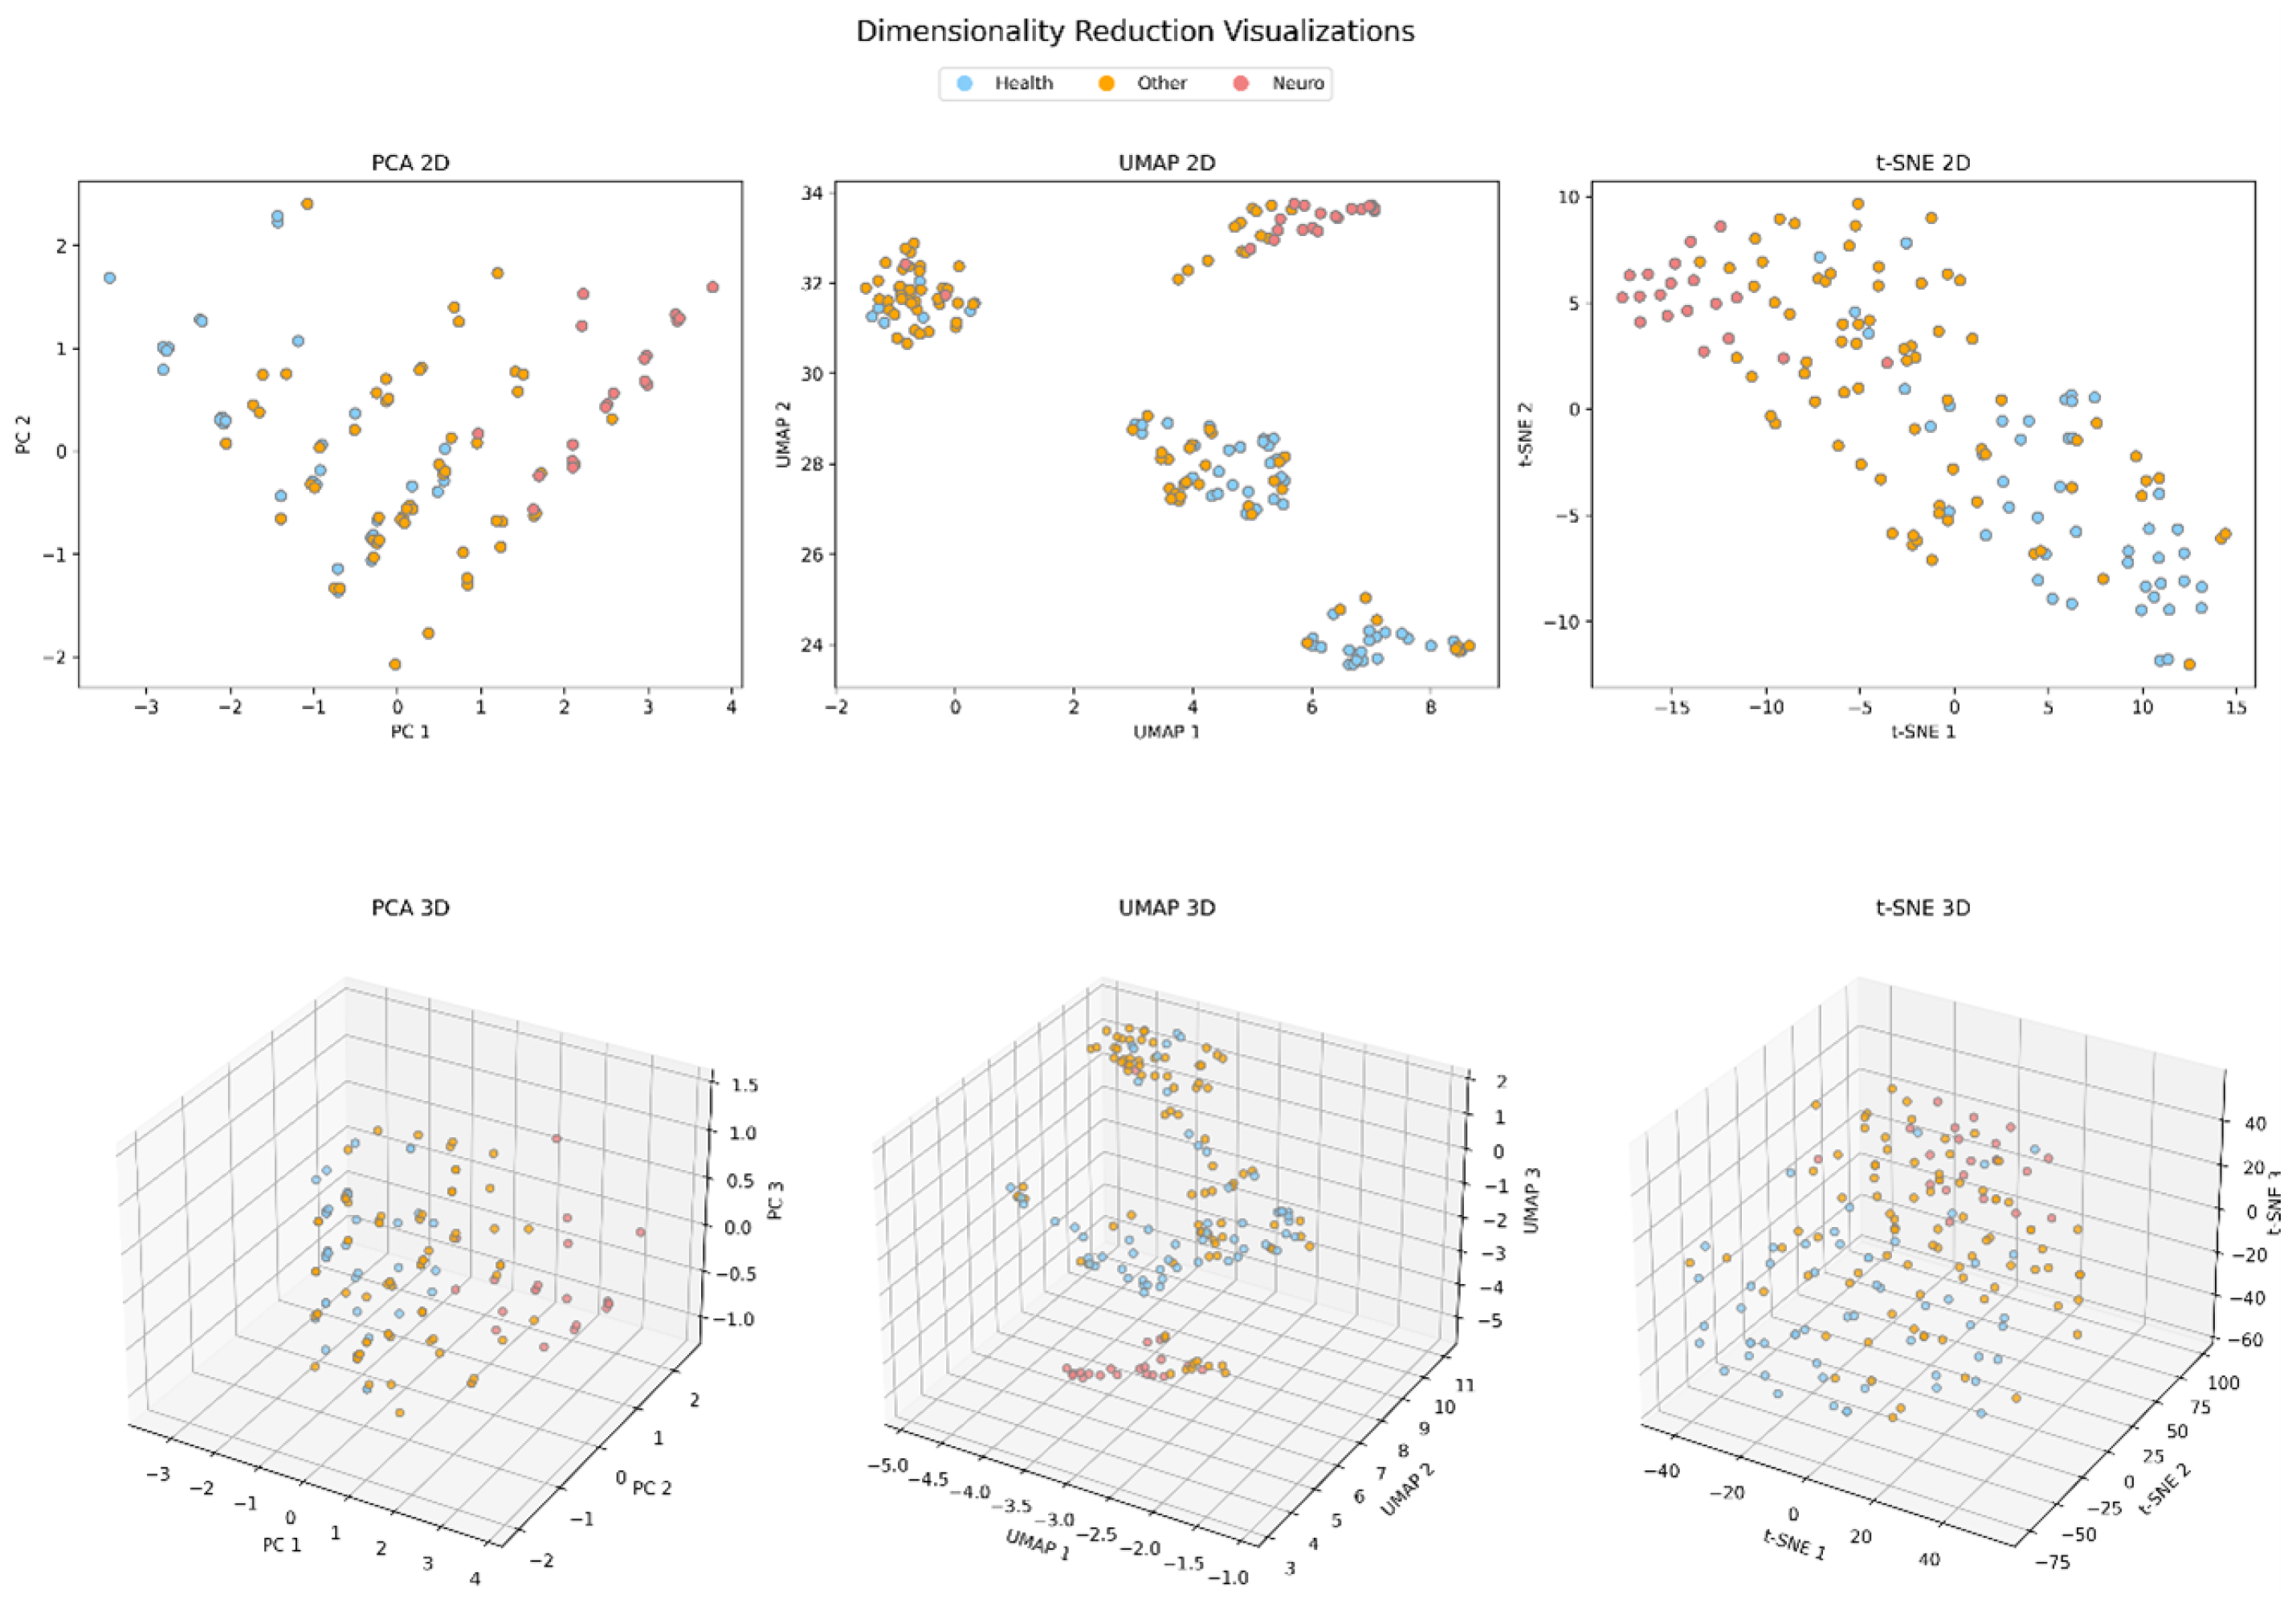
Data visualization was performed using the matplotlib [37] and seaborn [38] libraries. A correlation heatmap using Pearson’s correlation coefficient was created to examine the inter-variable relationships and their associations with the dataset’s tag (profile). Dimensionality reduction was conducted using principal component analysis (PCA) [39], Uniform Manifold Approximation and Projection (UMAP) [40], and t-Distributed Stochastic Neighbor Embedding (t-SNE) [41], with visual representations generated in both 2D and 3D formats.
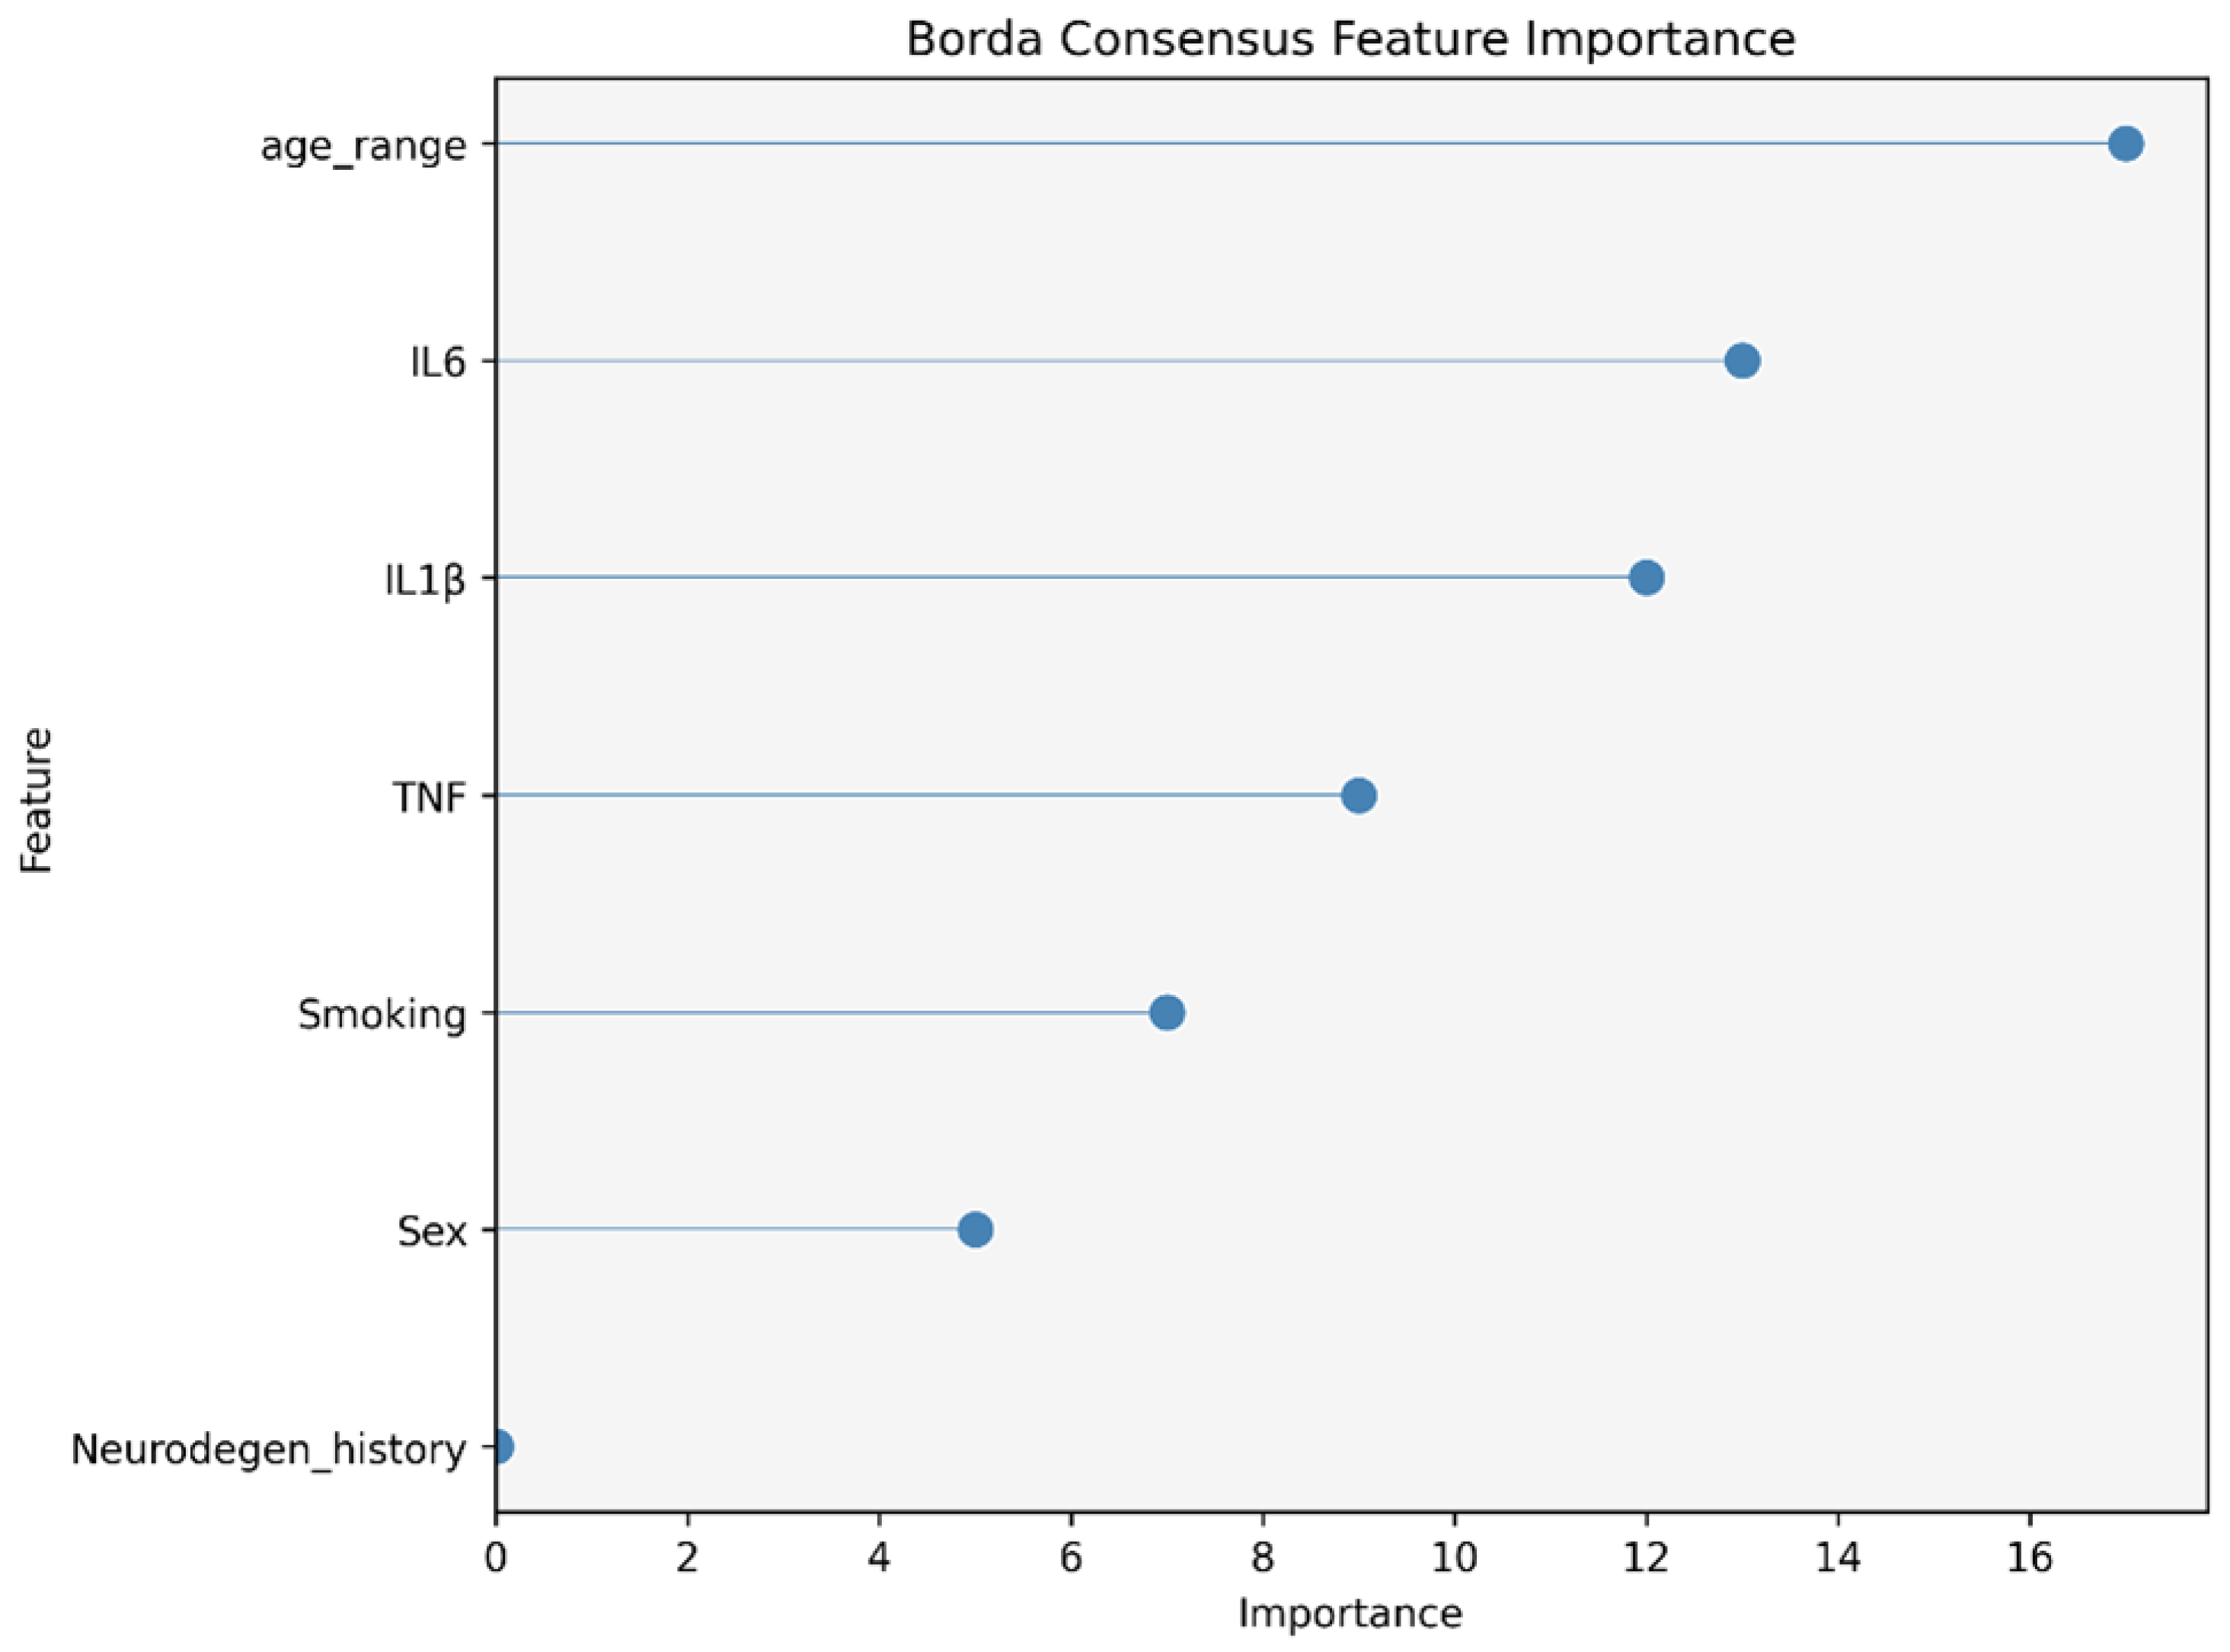
Feature importance was assessed using a hybrid approach [42] combining three gradient boosting classifiers: XgBoost [43], CatBoost [44], and LightGBM [45]. These algorithms ranked the features based on their importance, and the rankings were aggregated using a Borda rank-based count method. A line/dot plot was constructed to display the feature importance values.
Multi-class classification was conducted using the random forest algorithm [46], with a 10-fold cross-validation procedure to evaluate the performance. This particular classifier was selected due to its well-established strong performance on complex biomedical datasets, combined with its interpretability; it offers a valuable feature importance metric to assess the significance of individual features. The results were synthesized into a confusion matrix. Additionally, a decision tree classifier [47] was configured with a maximum depth of 10, a minimum of 15 samples required to split an internal node, and a minimum of 5 samples per leaf node to maintain model interpretability.
These combined biological and computational methodologies ensured a comprehensive analysis, integrating detailed cellular observations with advanced data processing and machine learning techniques to provide robust insights into the dataset. This study aims to bridge the gap between clinical and computational methodologies to enhance the understanding and detection of Alzheimer’s disease. By integrating detailed cellular observations with advanced data processing and machine learning techniques, the research seeks to identify significant biomarkers and patterns associated with AD. The goal is to develop minimally invasive, cost-effective, and reliable methods for the early diagnosis and prevention of AD, thereby contributing to better management and potentially mitigating the impact of this neurodegenerative disorder on the aging population.

3. Results

The results of this study revealed significant findings from both the biological and computational analyses. Microscope slides containing buccal cell smears were evaluated to classify buccal cells based on their cytoplasmic and nuclear features as can be seen in Figure 1. The frequencies and proportions of basal, intermediate, differentiated, and karyolitic cells were analyzed. Additionally, the cytoplasmic expression of buccal cells stained by the immunocytochemical method was evaluated and scored. The analysis showed varied expression levels of pro-inflammatory cytokines TNF α , IL-1 β , and IL-6, with distinct patterns observed in individuals with AD and MCI compared to healthy controls.
From a computational perspective, the correlation heatmap indicated significant positive correlations between the target variable (profile) and the constructed age range, and, to a lesser extent, with the TNF, IL-6, and IL-1β variables as shown in Figure 2. This suggests that these factors are strongly associated with the disease profiles being studied.
Dimensionality reduction visualizations revealed that the data points clustered together distinctly, with the most defined groupings observed. Four distinct clusters were identifiable, with one cluster comprising samples characterized by both ‘neuro’ and ‘other’ profiles, while the remaining clusters encompassed samples with ‘neuro’ and/or ‘other’ profiles as shown in Figure 3. This indicates the clear separation between the different disease profiles based on the analyzed variables. In the 2D PCA plot, 74% of the total variance is captured, while the 3D PCA plot accounts for 81.4% of the variance. Dimensionality reduction was also performed using the top four features identified through the feature importance consensus method. Under this approach, the first two principal components accounted for 87% of the total variance, and the first three principal components explained 95%. However, it is important to highlight that the final PCA visualizations, both in 2D and 3D, did not reveal any clear separation patterns among the samples. As a result, the findings related to the top four features are not included in this manuscript.
The feature importance analysis highlighted the age range as the predominant factor in differentiating among the three categories of the output variables (profiles) as shown in Figure 4. Other significant features included IL-6, IL-1β, and TNF, underscoring their relevance in the context of the disease profiles.
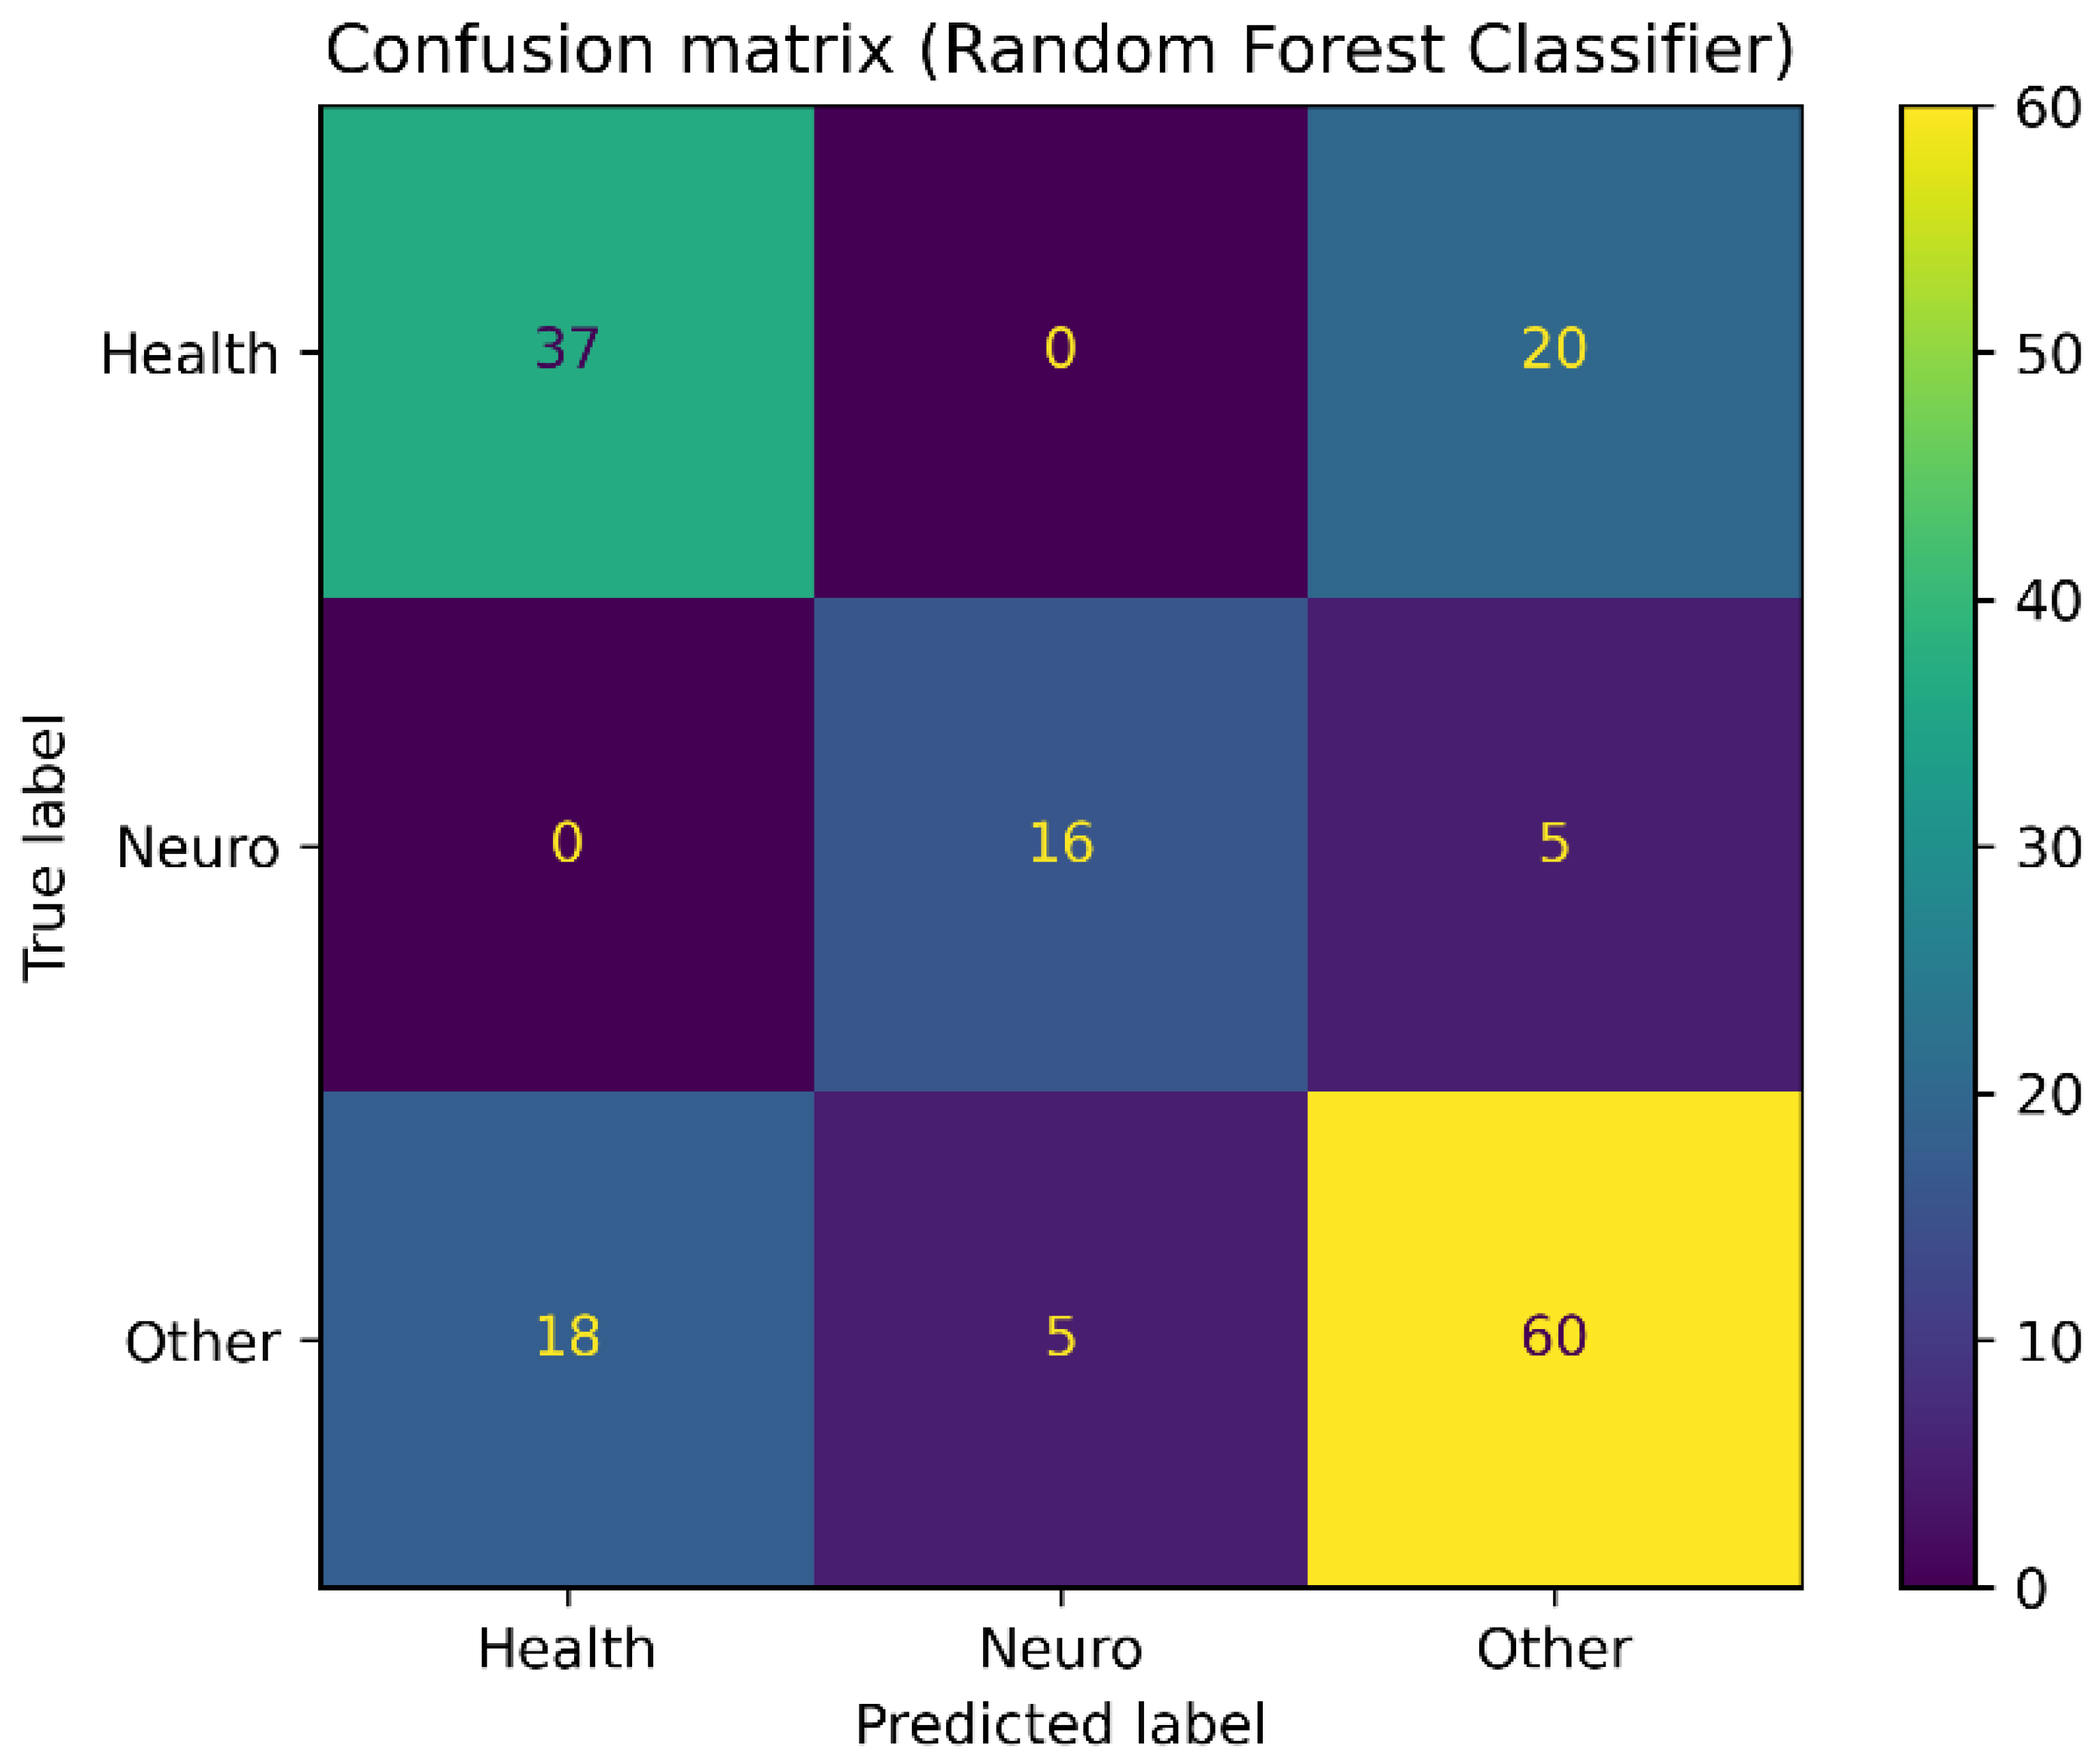
The performance of the random forest algorithm showed the highest accuracy in correctly identifying samples from the ’other’ category, with moderate effectiveness for the ’healthy’ and ’neuro’ categories as can be seen in Figure 5. Specifically, of the 55 samples labeled as healthy, the algorithm accurately classified 37. For the neuro category, it correctly identified 16 out of 21 samples. In the other category, the algorithm achieved the accurate classification of 60 out of a total of 85 samples, underscoring its particular strength in recognizing this class.
The decision tree classifier that was also applied has been configured to balance complexity and interpretability. The tree facilitated the clear visualization of the feature space’s segmentation, capturing essential data patterns and avoiding spurious correlations as can be seen in Figure 6. This approach allowed for transparent and interpretable model results, contributing to a comprehensive understanding of the data.
The integration of detailed cellular observations with advanced data processing and machine learning techniques provided robust insights into the dataset. The findings underscore the potential of combining biological and computational methodologies to enhance the understanding and detection of Alzheimer’s disease, paving the way for the development of effective early diagnosis and prevention strategies.

4. Discussion

This study demonstrates the potential of integrating biological observations with advanced computational methodologies to enhance the understanding and detection of Alzheimer’s disease (AD). The analysis revealed significant patterns and correlations, emphasizing the role of neuroinflammation and its biomarkers in the progression of AD. The findings suggest that peripheral inflammation is critically involved in the disease’s pathogenesis, supporting the hypothesis that immune system dysfunction contributes to neurodegenerative processes.
The application of artificial intelligence (AI) and machine learning (ML) techniques in this research has proven to be instrumental in managing and interpreting complex datasets. These advanced computational methods allowed for the identification of significant biomarkers and the differentiation of disease profiles with high accuracy. As the volume and complexity of biomedical data continue to grow, AI and ML will become increasingly essential in uncovering subtle patterns and relationships that are not readily apparent through traditional analysis.
The use of minimally invasive sampling methods, such as buccal cells, combined with sophisticated data processing, offers a promising approach for the early diagnosis and monitoring of AD. This study highlights the potential of such integrated methodologies to develop reliable, cost-effective diagnostic tools that can be widely applied in clinical settings.
The continuous evolution of AI and ML technologies holds great promise for the future of biomedical research. By enabling the analysis of large and complex datasets, these tools can help to identify novel biomarkers and therapeutic targets, paving the way for more effective prevention and treatment strategies. Future research should focus on leveraging these advancements to explore the intricate interactions between genetic, environmental, and biological factors in AD, ultimately improving patient outcomes and advancing our understanding of this debilitating disease.

Author Contributions

Conceptualization, M.G. and P.V.; methodology, K.L., M.G., N.K. and A.G.V.; software, K.L. and A.G.V.; validation, M.G.K. and T.E.; formal analysis, K.L., M.G., N.K. and A.G.V.; data curation, K.L. and M.G.; writing—original draft preparation, K.L., N.K. and M.G.; writing—review and editing, A.G.V., M.G.K., T.E. and P.V.; funding acquisition, P.V. All authors have read and agreed to the published version of the manuscript.

Funding

This work was supported in part by the European Union Next-Generation EU, Greece 2.0 National Recovery and Resilience Plan Flagship program IAEDR-0535850.

Institutional Review Board Statement

This study was conducted in accordance with the Declaration of Helsinki and was approved by the Ionian University Ethics Committee (Protocol No. 891, 10 March 2022).

Informed Consent Statement

Informed consent was obtained from all subjects involved in the study.

Data Availability Statement

The original contributions presented in this study are included in the article. Please direct any additional inquiries to the corresponding author.

Conflicts of Interest

The authors declare no conflicts of interest.

References

  1. Frigerio, C.S.; Wolfs, L.; Fattorelli, N.; Thrupp, N.; Voytyuk, I.; Schmidt, I.; Mancuso, R.; Chen, W.T.; Woodbury, M.E.; Srivastava, G.; et al. The major risk factors for Alzheimer’s disease: Age, sex, and genes modulate the microglia response to Aβ plaques. Cell Rep. 2019, 27, 1293–1306. [Google Scholar] [CrossRef] [PubMed]
  2. Schellenberg, G.D.; Montine, T.J. The genetics and neuropathology of Alzheimer’s disease. Acta Neuropathol. 2012, 124, 305–323. [Google Scholar] [CrossRef] [PubMed]
  3. Arnold, S.E.; Lee, E.B.; Moberg, P.J.; Stutzbach, L.; Kazi, H.; Han, L.Y.; Lee, V.M.; Trojanowski, J.Q. Olfactory epithelium amyloid-β and paired helical filament-tau pathology in Alzheimer disease. Ann. Neurol. 2010, 67, 462–469. [Google Scholar] [CrossRef] [PubMed]
  4. Laurent, C.; Buée, L.; Blum, D. Tau and neuroinflammation: What impact for Alzheimer’s Disease and Tauopathies? Biomed. J. 2018, 41, 21–33. [Google Scholar] [CrossRef]
  5. Galasko, D.; Golde, T.E. Biomarkers for Alzheimer’s disease in plasma, serum and blood-conceptual and practical problems. Alzheimer’s Res. Ther. 2013, 5, 1–5. [Google Scholar] [CrossRef]
  6. Yao, F.; Zhang, K.; Zhang, Y.; Guo, Y.; Li, A.; Xiao, S.; Liu, Q.; Shen, L.; Ni, J. Identification of blood biomarkers for Alzheimer’s disease through computational prediction and experimental validation. Front. Neurol. 2019, 9, 1158. [Google Scholar] [CrossRef]
  7. Leifert, W.R.; Francois, M.; Thomas, P.; Luther, E.; Holden, E.; Fenech, M. Automation of the buccal micronucleus cytome assay using laser scanning cytometry. In Methods in Cell Biology; Elsevier: Amsterdam, The Netherlands, 2011; Volume 102, pp. 321–339. [Google Scholar]
  8. Choromańska, M.; Klimiuk, A.; Kostecka-Sochoń, P.; Wilczyńska, K.; Kwiatkowski, M.; Okuniewska, N.; Waszkiewicz, N.; Zalewska, A.; Maciejczyk, M. Antioxidant defence, oxidative stress and oxidative damage in saliva, plasma and erythrocytes of dementia patients. Can salivary AGE be a marker of dementia? Int. J. Mol. Sci. 2017, 18, 2205. [Google Scholar] [CrossRef] [PubMed]
  9. Liu, X.X.; Jiao, B.; Liao, X.X.; Guo, L.N.; Yuan, Z.H.; Wang, X.; Xiao, X.W.; Zhang, X.Y.; Tang, B.S.; Shen, L. Analysis of salivary microbiome in patients with Alzheimer’s disease. J. Alzheimer’s Dis. 2019, 72, 633–640. [Google Scholar] [CrossRef]
  10. Huan, T.; Tran, T.; Zheng, J.; Sapkota, S.; MacDonald, S.W.; Camicioli, R.; Dixon, R.A.; Li, L. Metabolomics analyses of saliva detect novel biomarkers of Alzheimer’s disease. J. Alzheimer’s Dis. 2018, 65, 1401–1416. [Google Scholar] [CrossRef]
  11. François, M.; F Fenech, M.; Thomas, P.; Hor, M.; Rembach, A.; N Martins, R.; R Rainey-Smith, S.; L Masters, C.; Ames, D.; C Rowe, C.; et al. High content, multi-parameter analyses in buccal cells to identify Alzheimer’s disease. Curr. Alzheimer Res. 2016, 13, 787–799. [Google Scholar] [CrossRef]
  12. Banks, W.A.; Kastin, A.J.; Broadwell, R.D. Passage of cytokines across the blood-brain barrier. Neuroimmunomodulation 1995, 2, 241–248. [Google Scholar] [CrossRef] [PubMed]
  13. Hearps, A.C.; Martin, G.E.; Angelovich, T.A.; Cheng, W.J.; Maisa, A.; Landay, A.L.; Jaworowski, A.; Crowe, S.M. Aging is associated with chronic innate immune activation and dysregulation of monocyte phenotype and function. Aging Cell 2012, 11, 867–875. [Google Scholar] [CrossRef] [PubMed]
  14. Franceschi, C.; Garagnani, P.; Parini, P.; Giuliani, C.; Santoro, A. Inflammaging: A new immune–metabolic viewpoint for age-related diseases. Nat. Rev. Endocrinol. 2018, 14, 576–590. [Google Scholar] [CrossRef] [PubMed]
  15. Saare, M.; Tserel, L.; Haljasmägi, L.; Taalberg, E.; Peet, N.; Eimre, M.; Vetik, R.; Kingo, K.; Saks, K.; Tamm, R.; et al. Monocytes present age-related changes in phospholipid concentration and decreased energy metabolism. Aging Cell 2020, 19, e13127. [Google Scholar] [CrossRef] [PubMed]
  16. Scheiblich, H.; Trombly, M.; Ramirez, A.; Heneka, M.T. Neuroimmune connections in aging and neurodegenerative diseases. Trends Immunol. 2020, 41, 300–312. [Google Scholar] [CrossRef]
  17. Dantzer, R.; O’connor, J.C.; Freund, G.G.; Johnson, R.W.; Kelley, K.W. From inflammation to sickness and depression: When the immune system subjugates the brain. Nat. Rev. Neurosci. 2008, 9, 46–56. [Google Scholar] [CrossRef]
  18. Tian, L.; Ma, L.; Kaarela, T.; Li, Z. Neuroimmune crosstalk in the central nervous system and its significance for neurological diseases. J. Neuroinflamm. 2012, 9, 155. [Google Scholar] [CrossRef]
  19. Montagne, A.; Barnes, S.R.; Sweeney, M.D.; Halliday, M.R.; Sagare, A.P.; Zhao, Z.; Toga, A.W.; Jacobs, R.E.; Liu, C.Y.; Amezcua, L.; et al. Blood-brain barrier breakdown in the aging human hippocampus. Neuron 2015, 85, 296–302. [Google Scholar] [CrossRef]
  20. Varatharaj, A.; Galea, I. The blood-brain barrier in systemic inflammation. Brain, Behav. Immun. 2017, 60, 1–12. [Google Scholar] [CrossRef]
  21. Hampel, H.; Caraci, F.; Cuello, A.C.; Caruso, G.; Nisticò, R.; Corbo, M.; Baldacci, F.; Toschi, N.; Garaci, F.; Chiesa, P.A.; et al. A path toward precision medicine for neuroinflammatory mechanisms in Alzheimer’s disease. Front. Immunol. 2020, 11, 456. [Google Scholar] [CrossRef]
  22. DiSabato, D.J.; Quan, N.; Godbout, J.P. Neuroinflammation: The devil is in the details. J. Neurochem. 2016, 139, 136–153. [Google Scholar] [CrossRef] [PubMed]
  23. Llano, D.A.; Devanarayan, V.; Simon, A.J.; Alzheimer’s Disease Neuroimaging Initiative (ADNI). Evaluation of plasma proteomic data for Alzheimer disease state classification and for the prediction of progression from mild cognitive impairment to Alzheimer disease. Alzheimer Dis. Assoc. Disord. 2013, 27, 233–243. [Google Scholar] [CrossRef]
  24. Ray, S.; Britschgi, M.; Herbert, C.; Takeda-Uchimura, Y.; Boxer, A.; Blennow, K.; Friedman, L.F.; Galasko, D.R.; Jutel, M.; Karydas, A.; et al. Classification and prediction of clinical Alzheimer’s diagnosis based on plasma signaling proteins. Nat. Med. 2007, 13, 1359–1362. [Google Scholar] [CrossRef]
  25. Liao, P.C.; Yu, L.; Kuo, C.C.; Lin, C.; Kuo, Y.M. Proteomics analysis of plasma for potential biomarkers in the diagnosis of Alzheimer’s disease. PROTEOMICS Clin. Appl. 2007, 1, 506–512. [Google Scholar] [CrossRef]
  26. Jammeh, E.; Zhao, P.; Carroll, C.; Pearson, S.; Ifeachor, E. Identification of blood biomarkers for use in point of care diagnosis tool for Alzheimer’s disease. In Proceedings of the 2016 38th Annual International Conference of the IEEE Engineering in Medicine and Biology Society (EMBC), Orlando, FL, USA, 16–20 August 2016; IEEE: New York, NY, USA, 2016; pp. 2415–2418. [Google Scholar]
  27. Mathur, S.; Glogowska, A.; McAvoy, E.; Righolt, C.; Rutherford, J.; Willing, C.; Banik, U.; Ruthirakuhan, M.; Mai, S.; Garcia, A. Three-dimensional quantitative imaging of telomeres in buccal cells identifies mild, moderate, and severe Alzheimer’s disease patients. J. Alzheimer’s Dis. 2014, 39, 35–48. [Google Scholar] [CrossRef] [PubMed]
  28. Thomas, P.; Hecker, J.; Faunt, J.; Fenech, M. Buccal micronucleus cytome biomarkers may be associated with Alzheimer’s disease. Mutagenesis 2007, 22, 371–379. [Google Scholar] [CrossRef]
  29. Thomas, P.; Holland, N.; Bolognesi, C.; Kirsch-Volders, M.; Bonassi, S.; Zeiger, E.; Knasmueller, S.; Fenech, M. Buccal micronucleus cytome assay. Nat. Protoc. 2009, 4, 825–837. [Google Scholar] [CrossRef] [PubMed]
  30. Kinney, J.W.; Bemiller, S.M.; Murtishaw, A.S.; Leisgang, A.M.; Salazar, A.M.; Lamb, B.T. Inflammation as a central mechanism in Alzheimer’s disease. Alzheimer’s Dementia: Transl. Res. Clin. Interv. 2018, 4, 575–590. [Google Scholar] [CrossRef]
  31. Tuppo, E.E.; Arias, H.R. The role of inflammation in Alzheimer’s disease. Int. J. Biochem. Cell Biol. 2005, 37, 289–305. [Google Scholar] [CrossRef]
  32. Walters, A.; Phillips, E.; Zheng, R.; Biju, M.; Kuruvilla, T. Evidence for neuroinflammation in Alzheimer’s disease. Prog. Neurol. Psychiatry 2016, 20, 25–31. [Google Scholar] [CrossRef]
  33. Cribbs, D.H.; Berchtold, N.C.; Perreau, V.; Coleman, P.D.; Rogers, J.; Tenner, A.J.; Cotman, C.W. Extensive innate immune gene activation accompanies brain aging, increasing vulnerability to cognitive decline and neurodegeneration: A microarray study. J. Neuroinflamm. 2012, 9, 179. [Google Scholar] [CrossRef] [PubMed]
  34. Bermejo, P.; Martín-Aragón, S.; Benedí, J.; Susín, C.; Felici, E.; Gil, P.; Ribera, J.M.; Villar, Á.M. Differences of peripheral inflammatory markers between mild cognitive impairment and Alzheimer’s disease. Immunol. Lett. 2008, 117, 198–202. [Google Scholar] [CrossRef] [PubMed]
  35. Swardfager, W.; Lanctôt, K.; Rothenburg, L.; Wong, A.; Cappell, J.; Herrmann, N. A meta-analysis of cytokines in Alzheimer’s disease. Biol. Psychiatry 2010, 68, 930–941. [Google Scholar] [CrossRef] [PubMed]
  36. McKinney, W. pandas: A foundational Python library for data analysis and statistics. Python High Perform. Sci. Comput. 2011, 14, 1–9. [Google Scholar]
  37. Ari, N.; Ustazhanov, M. Matplotlib in python. In Proceedings of the 2014 11th International Conference on Electronics, Computer and Computation (ICECCO), Abuja, Nigeria, 29 September–1 October 2014; IEEE: New York, NY, USA, 2014; pp. 1–6. [Google Scholar]
  38. Waskom, M.L. Seaborn: Statistical data visualization. J. Open Source Softw. 2021, 6, 3021. [Google Scholar] [CrossRef]
  39. Ivosev, G.; Burton, L.; Bonner, R. Dimensionality reduction and visualization in principal component analysis. Anal. Chem. 2008, 80, 4933–4944. [Google Scholar] [CrossRef]
  40. McInnes, L.; Healy, J.; Melville, J. Umap: Uniform manifold approximation and projection for dimension reduction. arXiv 2018, arXiv:1802.03426. [Google Scholar]
  41. Van der Maaten, L.; Hinton, G. Visualizing data using t-SNE. J. Mach. Learn. Res. 2008, 9, 2579–2605. [Google Scholar]
  42. Lazaros, K.; Tasoulis, S.; Vrahatis, A.; Plagianakos, V. Feature selection for high dimensional data using supervised machine learning techniques. In Proceedings of the 2022 IEEE International Conference on Big Data (Big Data), Osaka, Japan, 17–20 December 2022; IEEE: New York, NY, USA, 2022; pp. 3891–3894. [Google Scholar]
  43. Chen, T.; Guestrin, C. Xgboost: A scalable tree boosting system. In Proceedings of the 22nd Acm Sigkdd International Conference on Knowledge Discovery and Data Mining, San Francisco, CA, USA, 13–17 August 2016; pp. 785–794. [Google Scholar]
  44. Prokhorenkova, L.; Gusev, G.; Vorobev, A.; Dorogush, A.V.; Gulin, A. CatBoost: Unbiased boosting with categorical features. Adv. Neural Inf. Process. Syst. 2018, 31. [Google Scholar] [CrossRef]
  45. Ke, G.; Meng, Q.; Finley, T.; Wang, T.; Chen, W.; Ma, W.; Ye, Q.; Liu, T.Y. Lightgbm: A highly efficient gradient boosting decision tree. In Proceedings of the 31st Conference on Neural Information Processing Systems (NIPS 2017), Long Beach, CA, USA, 4–9 December 2017. [Google Scholar]
  46. Pal, M. Random forest classifier for remote sensing classification. Int. J. Remote Sens. 2005, 26, 217–222. [Google Scholar] [CrossRef]
  47. Du, W.; Zhan, Z. Building decision tree classifier on private data. In Proceedings of the CRPIT ’14: Privacy, Security and Data Mining, Maebashi City, Japan, 1 December 2002. [Google Scholar]
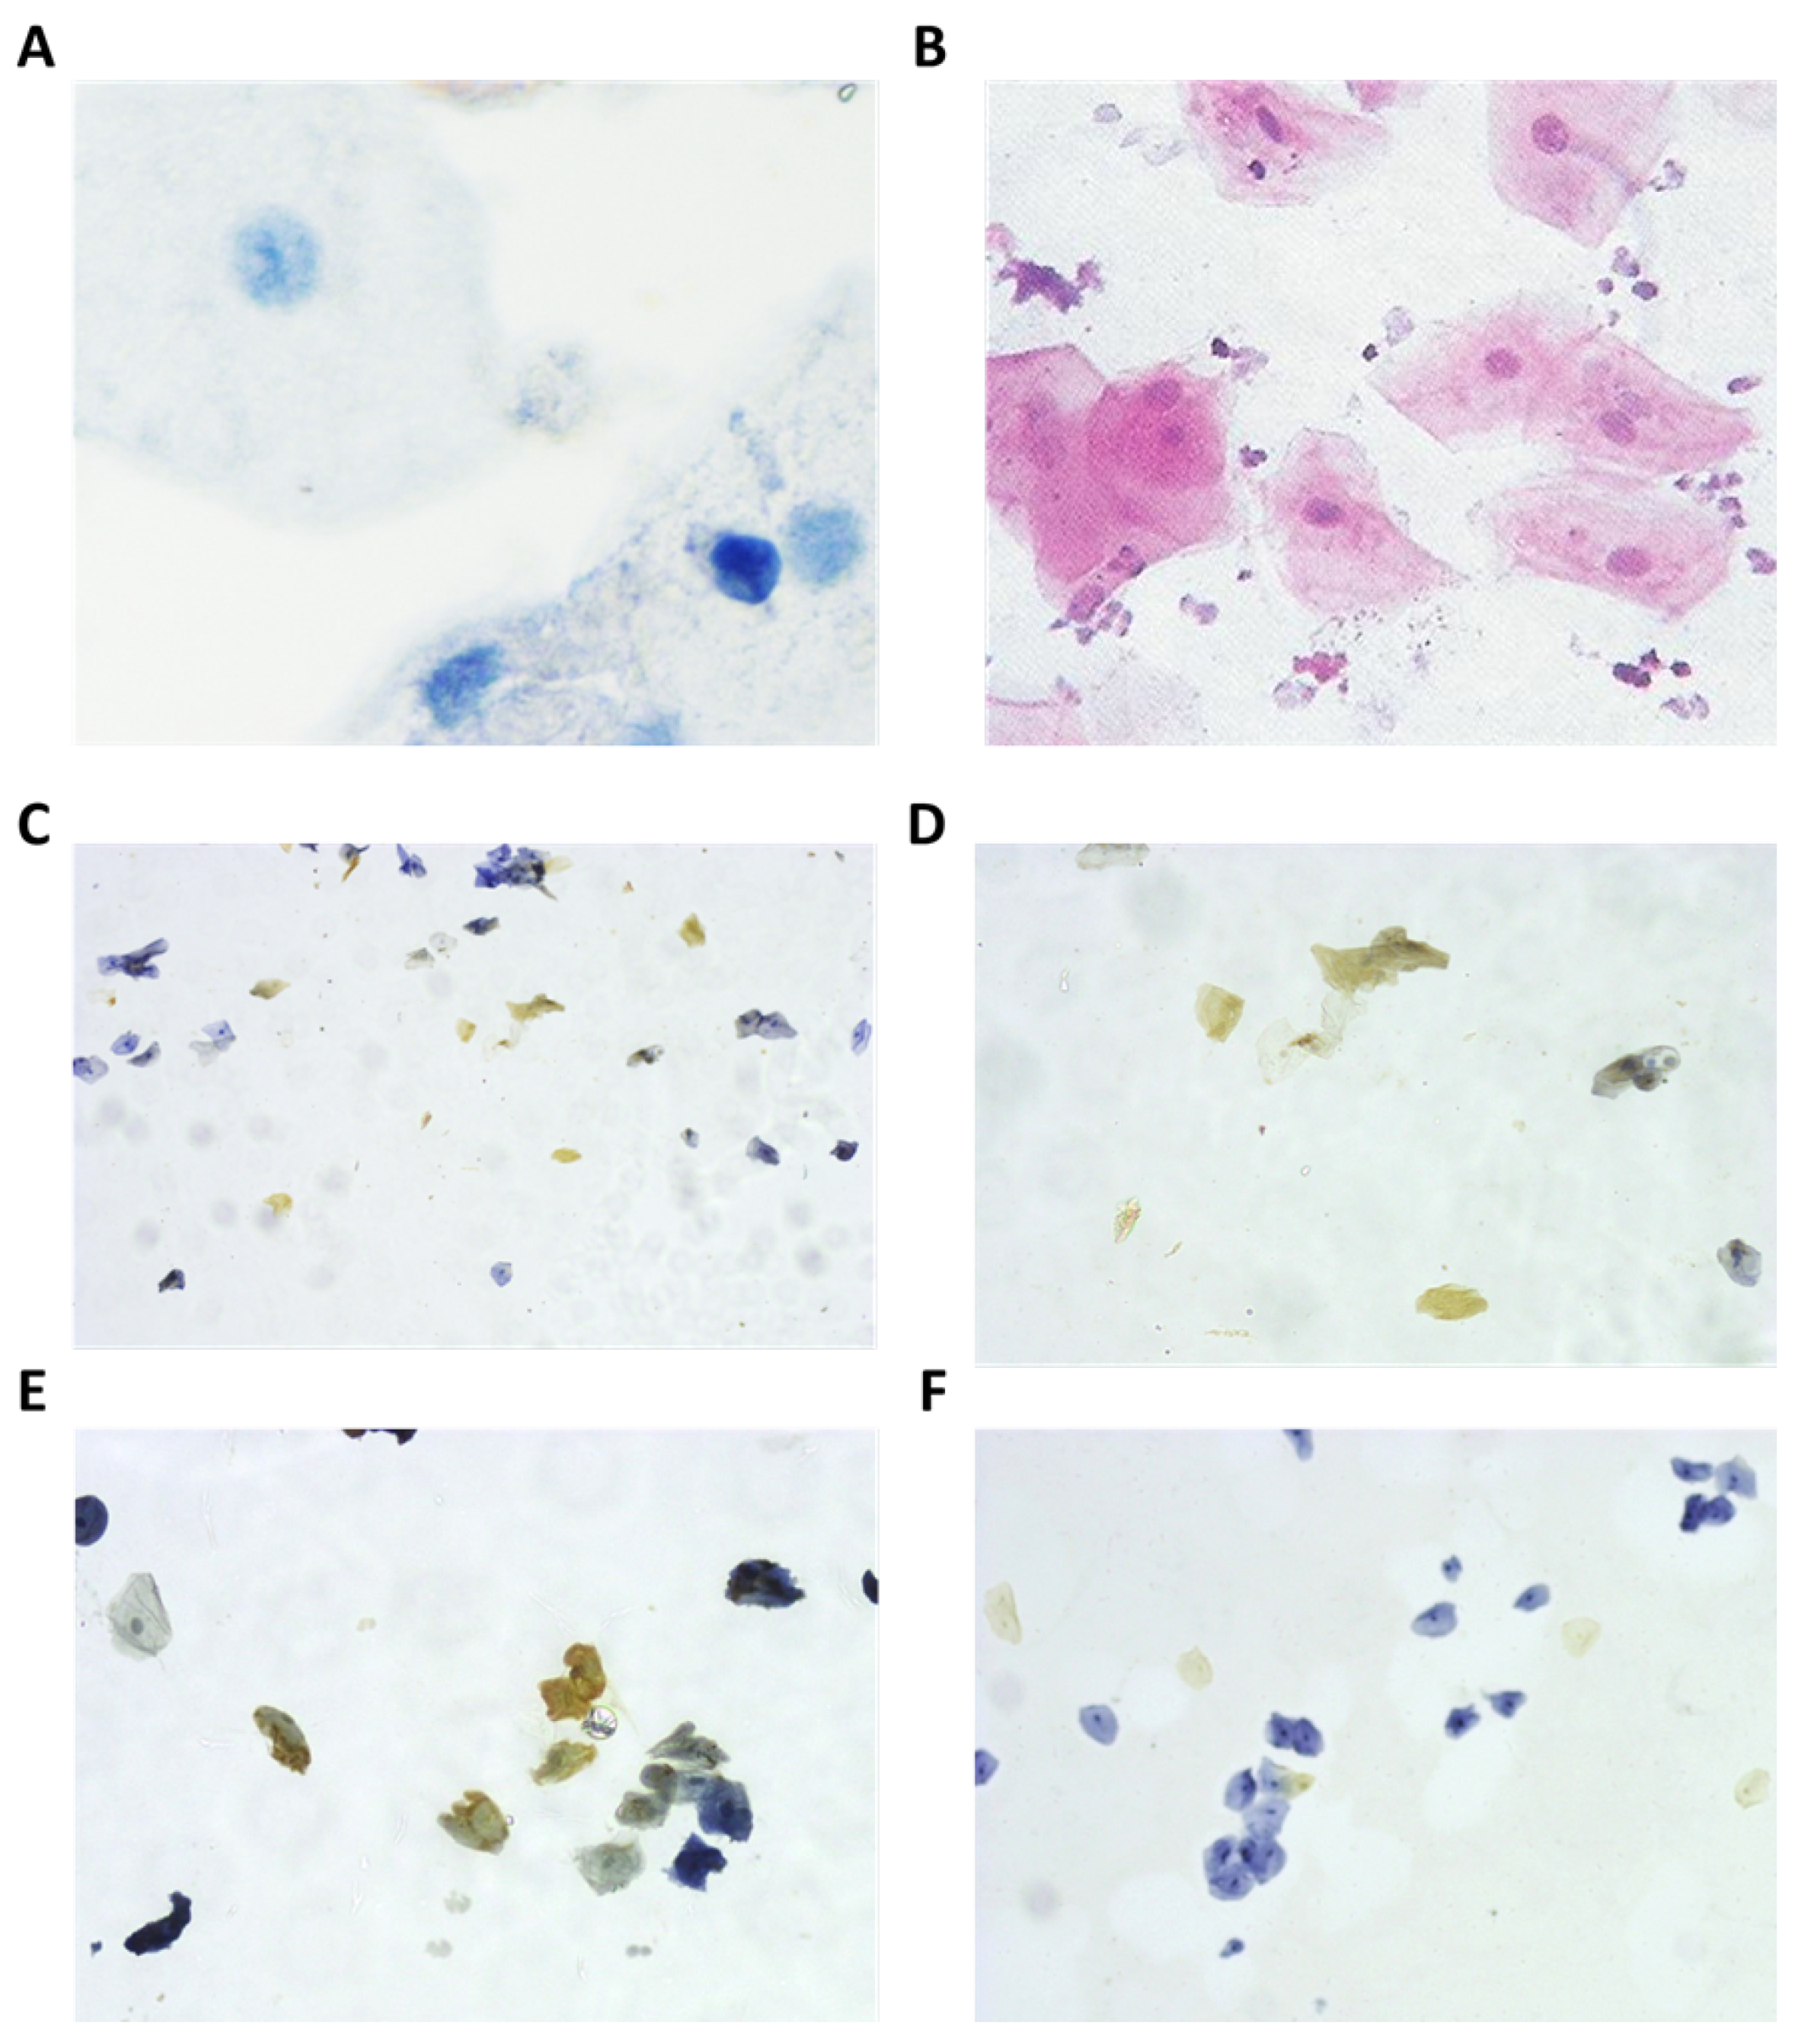
Figure 1. Microscopic views of buccal cells. (A). Buccal intermediated squamous cells using Pap stain observed in healthy individuals under ×40 magnification. (B). Pap stain observed in AD patients superficial buccal cells ×20 magnification. Pink are superficial cells, blue are intermediate cells. (C). Immunocytochemistry analysis of buccal cells indicating extensive cytoplasmic expression. IL-6 ×10 medium expression of buccal squamous cells of AD patients. (D). IL-6 ×20 medium cytoplasmic expression of squamous buccal cells of AD patients. (E). TNF- α ×20 strong cytoplasmic expression of buccal cells squamous of AD patients. (F). IL-1 β ×10 mild expression of squamous buccal cells observed in healthy individuals. TNFα, IL-6, IL-1 β have exactly the same cytoplasmic expression. The stainer recognizes their presence due to the different barcodes on different marked rails.
Applsci 14 08372 g001
Figure 2. Correlation heatmap that encompasses the nine variables selected for the scope of this investigation. Each cell within the heatmap is color-coded to represent the corresponding correlation value, which spans from −1 for variables exhibiting a negative correlation (indicated by white color) to 1 for variables demonstrating a positive correlation (signified by purple color). As anticipated, all elements situated on the principal diagonal of the plot are rendered in deep purple, denoting the correlation of a variable with itself. Notably, the target variable of the dataset (profile) manifests a significant positive correlation with the constructed age range and, to a lesser extent, with the TNF, IL-6, and IL-1β variables.
Applsci 14 08372 g002
Figure 3. Dimensionality reduction visualizations employing PCA, UMAP, and t-SNE have been generated in both two-dimensional (2D) and three-dimensional (3D) formats. In these visualizations, each data point, representing an individual sample, is distinguished by colors corresponding to its profile value (‘health’, ‘other’, ‘neuro’), as denoted in the legends of the figures. Across all three dimensionality reduction techniques, it is observable that the data points cluster together, with UMAP’s 2D visualization offering the most defined grouping among all configurations examined. Specifically, in the UMAP 2D plot, four distinct clusters are identifiable; one of these clusters comprises samples characterized by both ‘neuro’ and ‘other’ profiles, while the remaining three clusters encompass samples with ‘neuro’ and/or ‘other’ profiles. The key features were consistently emphasized across all dimensionality reduction techniques, as determined by the established feature selection scheme. As previously noted, a comprehensive evaluation was conducted using the top four features across various dimensionality reduction algorithms, including both PCA and UMAP. The results from these analyses indicated no significant differences when compared to those obtained using the full set of features. Consequently, the conclusions regarding cluster separation remain unchanged, irrespective of the number of features utilized.
Applsci 14 08372 g003
Figure 4. A line/dot plot has been constructed to display the outcomes derived via the Borda feature importance consensus methodology. On this plot, the y-axis enumerates the names of the features present in the dataset, while the x-axis quantifies the importance values ascertained through the Borda rank-based count. The examination of this plot reveals the concordance between the outcomes of the consensus feature importance scheme and the patterns observed in the preceding correlation heatmap; specifically, the age range emerges as the predominant factor in differentiating among the three categories of the output variable (profile), mirroring its position as the most significantly positively correlated feature in the heatmap. A similar relationship is observed for the features IL-6, IL-1β, and TNF, underscoring their relevance in accordance with both the consensus feature importance scheme and the correlation heatmap.
Applsci 14 08372 g004
Figure 5. The confusion matrix, derived from multi-class classification after 10-fold cross-validation using the random forest algorithm, illustrates the model’s performance. Notably, random forest exhibits its highest accuracy in correctly identifying samples from the ’other’ category, while also demonstrating moderate effectiveness for the remaining two categories within the target variable. Specifically, of the 55 samples labeled as healthy, the algorithm accurately classified 37. For the neuro category, it correctly identified 16 out of 21 samples. Remarkably, in the other category, the algorithm achieved the accurate classification of 60 out of a total of 85 samples, underscoring its particular strength in recognizing this class.
Applsci 14 08372 g005
Figure 6. Decision tree visualization with depth control and sample constraints. This figure presents a decision tree classifier that has been trained on the dataset. The tree has been prudently initialized with a maximum depth of 10 to prevent excessive complexity, a minimum sample requirement of 15 for any internal node split to avoid overfitting to noise, and a minimum of 5 samples for each leaf node to ensure sufficient data support for terminal decisions. Each node represents a decision point based on the value of a particular feature, with branches leading to outcomes or further decisions. The leaves, denoted by their unique colors, correspond to the final classification outcomes. The depth parameter ensures that the tree remains manageable and interpretable, while the constraints on the splits and leaf samples guide the tree to capture essential data patterns and avoid spurious correlations. This strategic configuration facilitates a transparent and interpretable model, allowing for the clear visualization of the feature space’s segmentation according to the predictive model’s learned logic.
Applsci 14 08372 g006
Disclaimer/Publisher’s Note: The statements, opinions and data contained in all publications are solely those of the individual author(s) and contributor(s) and not of MDPI and/or the editor(s). MDPI and/or the editor(s) disclaim responsibility for any injury to people or property resulting from any ideas, methods, instructions or products referred to in the content.