Article

Identifying Key Factors for Securing a Champions League Position in French Ligue 1 Using Explainable Machine Learning Techniques

by
Spyridon Plakias
1,
Christos Kokkotis
2,
Michalis Mitrotasios
3,
Vasileios Armatas
3,
Themistoklis Tsatalas
1 and
Giannis Giakas
1,*
1
Department of Physical Education and Sport Science, University of Thessaly, 42150 Trikala, Greece
2
Department of Physical Education and Sport Science, Democritus University of Thrace, 69100 Komotini, Greece
3
School of Physical Education and Sport Science, National and Kapodistrian University of Athens, 10679 Athens, Greece
*
Author to whom correspondence should be addressed.
Appl. Sci. 2024, 14(18), 8375; https://doi.org/10.3390/app14188375
Submission received: 12 August 2024 / Revised: 26 August 2024 / Accepted: 3 September 2024 / Published: 18 September 2024

Abstract

:

Featured Application

The information obtained from this study can be useful for coaches and performance analysts of teams. By taking into account the factors that contribute to securing one of the top positions in the league standings, coaches are encouraged to adopt ball possession strategies with patience and short passes to create gaps in the opponent’s defense and, at the right moment, execute through balls aiming to enter the attacking third and create goal opportunities. On the other hand, teams are advised to avoid long passes, as these may lead to a loss of team cohesion and create large distances between the lines. Finally, this information is also useful for team scouts in identifying players who are suitable for implementing the aforementioned strategies.

Abstract

Introduction: Performance analysis is essential for coaches and a topic of extensive research. The advancement of technology and Artificial Intelligence (AI) techniques has revolutionized sports analytics. Aim: The primary aim of this article is to present a robust, explainable machine learning (ML) model that identifies the key factors that contribute to securing one of the top three positions in the standings of the French Ligue 1, ensuring participation in the UEFA Champions League for the following season. Materials and Methods: This retrospective observational study analyzed data from all 380 matches of the 2022–23 French Ligue 1 season. The data were obtained from the publicly-accessed website “whoscored” and included 34 performance indicators. This study employed Sequential Forward Feature Selection (SFFS) and various ML algorithms, including XGBoost, Support Vector Machine (SVM), and Logistic Regression (LR), to create a robust, explainable model. The SHAP (SHapley Additive Explanations) model was used to enhance model interpretability. Results: The K-means Cluster Analysis categorized teams into groups (TOP TEAMS, 3 teams/REST TEAMS, 17 teams), and the ML models provided significant insights into the factors influencing league standings. The LR classifier was the best-performing classifier, achieving an accuracy of 75.13%, a recall of 76.32%, an F1-score of 48.03%, and a precision of 35.17%. “SHORT PASSES” and “THROUGH BALLS” were features found to positively influence the model’s predictions, while “TACKLES ATTEMPTED” and “LONG BALLS” had a negative impact. Conclusions: Our model provided satisfactory predictive accuracy and clear interpretability of results, which gave useful information to stakeholders. Specifically, our model suggests adopting a strategy during the ball possession phase that relies on short passes (avoiding long ones) and aiming to enter the attacking third and the opponent’s penalty area with through balls.

1. Introduction

Performance analysis, i.e., the recording and exploring of events occurring during competitions, is not only an important tool for coaches but also a subject of extensive research [1,2]. The goal of performance analysis is to provide feedback, create new knowledge, and assist in decision-making, with the ultimate aim of improving the performance of athletes and teams [3]. In recent years, the advancement of technology has offered researchers a large volume of data, while Artificial Intelligence (AI) techniques have provided new possibilities for handling these data [4,5,6,7]. These developments have helped investigate complex questions. For example, securing a top position in the French football championship (Ligue 1), which is one of the positions that qualify for the UEFA Champions League (UCL), is a very strong motivation for the teams, as the UCL brings prestige and financial rewards to clubs [8]. Each season, UCL brings together the best teams from across Europe in a highly competitive tournament, which is considered to be the crown jewel of club football [9]. Additionally, UEFA distributes huge amounts of money to the teams participating in UCL [10]. The factors that contribute to such high rankings in various leagues remain complex and multifaceted.
The literature on football analytics is extensive, with numerous studies attempting to decode the elements of successful team performance [11]. Most researchers have employed various statistical techniques to predict teams’ rankings. For instance, most authors have used analyses of variance (ANOVA, MANOVA) to find differences in performance indicators between predefined clusters of teams based on their position in the ranking table [12,13,14]. Additionally, some combined analyses of variance with correlation analyses (Pearson or Spearman) found correlations between the points collected by the team in the final ranking and the performance indicators [15,16,17,18]. However, some authors used more complex multivariate statistical analyses to also check for the interactions between various performance indicators. For example, Pappalardo and Cintia [19] used ordinary least squares (OLS); Hoppe et al. [20] used multiple linear regression, and González-Rodenas et al. [21] used a generalized linear model.
From the above studies, it is seen that several factors can lead a team to success by occupying one of the first positions in the standings of a league. For example, Fernández-Cortés et al. [13], Andrzejewski et al. [16], and González-Rodenas et al. [21] found a high ball possession percentage to be one of the most important, while Yang et al. [14] dug deeper and found that when possession was in the opponent’s half, then the chances of success were even greater. Additionally, an element necessary for ball possession, i.e., passing, has been found important for success by many researchers [13,16,19,21]. However, the number of long passes has the opposite effect [22]. Other research has shown that crosses [12,21] and through balls [21] could increase a team’s probability of success since they could increase the number of entry passes in the penalty area [14]. Finally, regarding the effect of running variables, most research shows that only runs in possession of the ball are associated with success and not total runs during the match [15,18,20].
On the other hand, in recent years, machine learning (ML) techniques have increasingly been used to solve problems that concern researchers in the field of sports, especially football [23,24,25]. Additionally, many researchers have used ML methods that could also provide interpretability of the results [26]. For example, the SHapley Additive Explanations (SHAP) model has been used in many studies in the field of football. Specifically, most researchers have used it in outcome prediction studies [27,28,29] as well as in injury risk prediction [30,31,32]. It has also been used in more specific topics, such as the prediction of defensive success [33] or entry into the attack zone [34]. However, it has never been used in studies that correlated performance indicators with team rankings in the final standings of a championship. To the best of our knowledge, there is only one study that applied ML techniques to predict the position of teams in the final standings [35], but this study neither used interpretable learning techniques, such as the SHAP model, nor did the predictive ability of the model proved to be more than moderate (R2 = 0.26–0.60).
Therefore, from the literature review, it appears that despite the significant progress observed with the application of ML methods, a gap remains in the literature regarding the integration of explainable models in predicting team standings in the final league table. This shortfall limits the practical application of these findings, as stakeholders require clear, actionable insights to implement changes effectively. Our research aims to bridge this gap by developing an explainable ML framework that not only predicts league standings with high accuracy but also provides a transparent understanding of the factors driving these predictions.
We hypothesized that by utilizing a combination of advanced ML algorithms and explainable AI techniques, we could uncover the key factors influencing league standings in a manner that is both accurate and interpretable. Therefore, the primary aim of this article is to present a robust, explainable ML model that identifies and elucidates the key factors influencing the attainment of top positions in the standings of the French Ligue 1. The French League 1 was chosen as it is one of the five best domestic leagues in Europe [36]. By offering both predictive power and clear interpretability, our research seeks to provide a valuable tool for football analysts, coaches, and club management, enabling them to make data-driven decisions that can improve team performance and achieve higher league standings.

2. Materials and Methods

2.1. Dataset

This retrospective observational study analyzed match-related data from all 380 matches of the 2022–23 French Ligue 1 season. The league spanned from 5 August 2022 to 3 June 2023, with a winter break from 13 November 2022 to 27 December 2022 due to the FIFA World Cup. The competition involved 20 teams playing each other twice, once at home and once away (double round robin), resulting in 38 matchdays. The top five teams qualified for UEFA competitions: the first two for the UCL group stage, the third for the UCL third qualifying round, the fourth for the Europa League group stage, and the fifth for the Europa Conference League play-off round. Additionally, the team, which finished in 13th place, qualified for the Europa League group stage as the 2022–23 Coupe de France winners. As the league transitioned to an 18-team format for the 2023–24 season, four clubs were relegated without play-offs at the conclusion of the 2022–23 campaign.
Match data were obtained from a public-accessed football statistics website, “whoscored.com” [37], which utilizes data resources provided by Opta Stats Perform Company (London, UK). A study by Liu et al. [38] assessed the inter-operator reliability of this company’s tracking system and found it acceptable. Their research demonstrated very good agreement (weighted kappa values of 0.92 and 0.94) between independent operators coding team match events with an average difference in event timing of 0.06 ± 0.04 s.
After a rigorous screening process considering data availability and alignment with previous research [39,40], the following 33 technical performance-related match actions and events were selected for each match and team: total match goals; total shots count; shots on target; shots off target; shots blocked; attempts in open play; attempts in counterattack; attempts in set pieces; shot directions (left/middle/right); shot zones in the 6-yard box; shot zones in the 18-yard box; shot zones out of the box; ball possession (%); touches; crosses; long balls; total passes; total successful passes; pass success (%); short passes; through balls; dribbles attempted; dribble success (%); total aerial duels; aerial duels success (%); aerial duels offensive; aerial duels defensive; tackles attempted; tackle success (%); corners; attack from the corridor (left/middle/right). Definitions of these variables can be found in previous studies [38,40] as well as in the glossaries of whoscored and Opta [41,42]. Additionally, the variable “LOCATION” (home/away) of the match was added to the tabular dataset.

2.2. Problem Definition

In this research, our primary objective was to create an explainable ML method that could identify key factors affecting the table rankings of French teams. Additionally, we examined how these factors influenced the model’s results, emphasizing post hoc explainability. We approached the task of predicting match outcomes as a binary classification problem. Specifically, we categorized the observations into two classes: (i) the “TOP TEAMS” class and (ii) the “REST TEAMS” class.

2.3. K-Means Cluster Analysis

K-means Cluster Analysis was applied using the points as the variable, and a division into 3 classes was requested (i.e., to classify the teams into three clusters). The analysis was performed using SPSS version 29.00 (SPSS, Chicago, IL, USA).

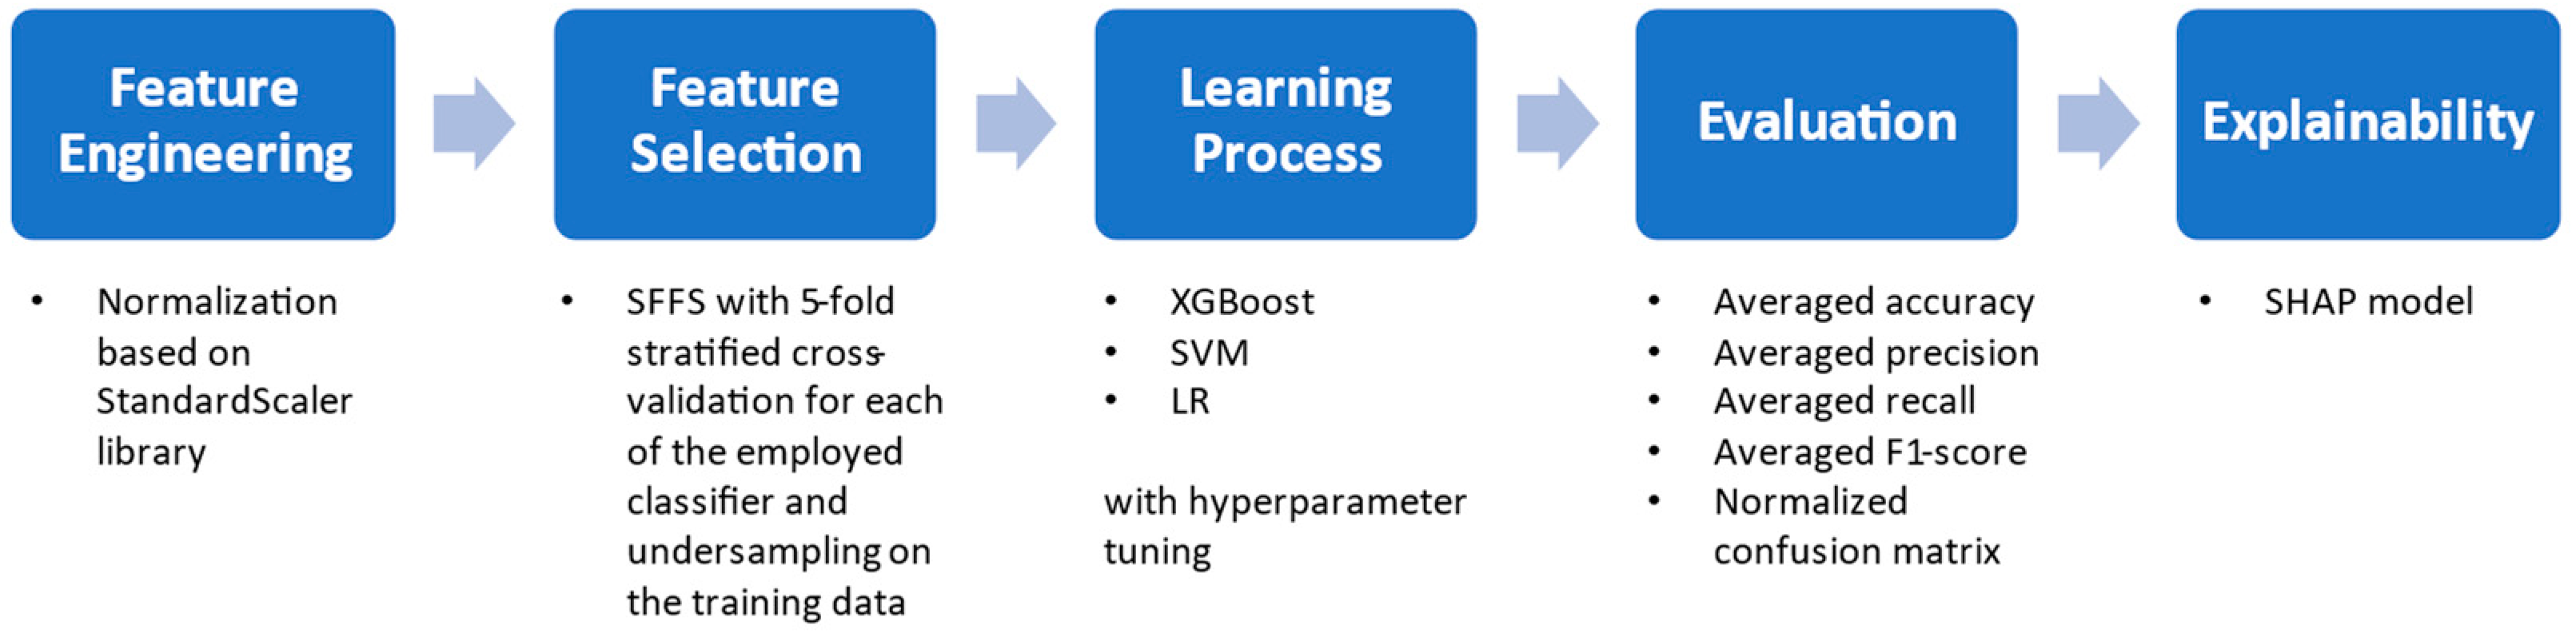
2.4. Machine Learning Workflow

To ensure data consistency, all variables were normalized using the StandardScaler library during both the feature selection (FS) and ML estimation phases. For feature selection, we employed Sequential Forward Feature Selection (SFFS) with 5-fold stratified cross-validation. SFFS is particularly advantageous because it offers a dynamic approach to feature selection, allowing for both inclusion and exclusion of features during the search process, which helps in identifying an optimal subset that improves the model’s performance. This flexibility is crucial in explainable machine learning studies where the interpretability of selected features is as important as predictive accuracy. Additionally, SFFS tends to yield more reliable and robust feature sets compared to standard forward selection methods, which is essential for building models that not only perform well but also provide meaningful insights into the underlying data patterns. Specifically, this robust technique iteratively constructs a feature subset by adding one feature at a time, selecting those that optimally enhance model performance while maintaining balanced class distributions. Additionally, we performed undersampling during each run on the training data for both ML and FS to address class imbalance. The advantages of SFFS include improved predictive accuracy, as it ensures that the model not only improves in accuracy but also maintains robustness through stratified cross-validation, which is vital for handling imbalanced datasets. Additionally, the sequential addition of features helps identify the most relevant variables, reducing model complexity and the risk of overfitting. Furthermore, SFFS provides a comprehensive method tailored to the specific problem, leading to better model generalization and interpretability.
For our binary classification task, we leveraged several advanced ML classifiers, including XGBoost, Support Vector Machine (SVM), and Logistic Regression (LR), combined with the SFFS FS algorithm. Specifically, XGBoost is chosen for its high performance, handling of non-linear relationships, and robustness against overfitting, making it excellent for complex datasets. SVM is selected for its effectiveness in high-dimensional spaces and its ability to model both linear and non-linear relationships through various kernels, offering flexibility. LR is used for its simplicity, interpretability, and ability to provide probabilistic outputs, serving as a strong baseline model. Hence, this multi-algorithm approach was chosen for several reasons. Firstly, it allows for robustness assessment by comparing results across different algorithms to ensure consistency. Secondly, it helps mitigate the algorithmic biases inherent in any single method. Thirdly, it assists in understanding the task’s sensitivity to different features, which is crucial for the SFFS FS algorithm. Lastly, testing multiple algorithms increases the credibility and generalizability of our findings. Each classifier underwent the FS process separately. To ensure robust performance and minimize overfitting, we applied 5-fold stratified cross-validation for validation. Additionally, hyperparameter tuning was performed within the training set using 5-fold stratified cross-validation, optimizing the models for the best configurations. Specifically, hyperparameter tuning for each ML model was conducted using a grid search approach to identify the optimal set of parameters that maximized model performance. For LR, a grid was defined over the hyperparameters C (regularization strength) and solver, exploring combinations such as C = [0.1, 1, 10, 100] and solvers including “newton-cg”, “lbfgs”, and “liblinear”. For XGBoost, the tuning involved varying n_estimators (number of trees), max_depth (maximum tree depth), learning_rate, and min_child_weight, with grids set to [50, 100, 200], [3, 4, 5], [0.01, 0.1, 0.2], and [1, 2, 3], respectively. Similarly, for SVM, the grid search was performed over different values of C (penalty parameter) and kernel types (“linear”, “poly”, “rbf”, “sigmoid”), with C = [0.1, 1, 3, 5, 8, 10]. The grid search process involved evaluating each combination of hyperparameters using cross-validation to select the best-performing model for each algorithm. This thorough approach, including the application of undersampling, enabled us to derive meaningful insights and achieve high predictive accuracy in our complex task, showcasing the versatility and adaptability of these ML techniques.
To rigorously assess the performance of our ML models, we employed a suite of comprehensive metrics. Averaged accuracy was used to represent the proportion of true results (both true positives and true negatives) among the total number of cases. Averaged precision was calculated to reflect the proportion of true positive identifications out of all positive identifications made by the model, indicating prediction reliability. Averaged recall, or sensitivity, measured the model’s ability to identify all relevant instances, representing the proportion of actual positives correctly identified. The Averaged F1-score was computed as the harmonic mean of precision and recall, providing a single performance metric that considered both aspects. Additionally, we utilized the normalized confusion matrix to visualize the testing performance, showing false positives, false negatives, true positives, and true negatives, facilitating easy identification of class confusion.
For model interpretability, we utilized the SHAP model, a pivotal tool in understanding ML predictions. SHAP quantifies the contribution of each feature to a model’s prediction, revealing the intricate relationships within the dataset. By using SHAP, we can dissect the significance of each factor influencing the model’s outcomes. Originating from game theory, SHAP provides a clear and powerful way to understand how different features impact predictions, uncovering the underlying rules of ML models. Furthermore, SHAP provides a unified framework that consistently interprets predictions across different models, ensuring that feature importance is calculated fairly and is theoretically grounded in game theory. It attributes the contribution of each feature to the model’s prediction in a way that is both local (explaining individual predictions) and global (understanding overall model behavior). Unlike simpler methods, SHAP values ensure that the sum of the contributions of all features matches the model’s output, offering a clear, consistent, and accurate understanding of how each feature impacts predictions.
All code was implemented in Python, utilizing the Scikit-learn library (https://scikit-learn.org/, accessed on 30 June 2024) for model development, training, and evaluation. This ensured the consistent application of ML algorithms and methods throughout this study. Figure 1 depicts the proposed ML workflow.

3. Results

3.1. K-Means Cluster’s Results

The K-means Cluster Analysis categorized the teams into three groups. The first group included only the first three teams; the second group included the teams ranked 4th to 10th, and the third group included the teams ranked 11th to 20th (Table 1). For the purposes of the current study, which aimed to examine the factors leading to the top three positions in the standings (and, thus, ensuring participation in the UCL for the following season), all observations of the top three teams were classified into the “TOP TEAMS” class, while the observations of the remaining teams were classified into the “REST TEAMS” class. Therefore, the first class included 114 observations, and the second 646.

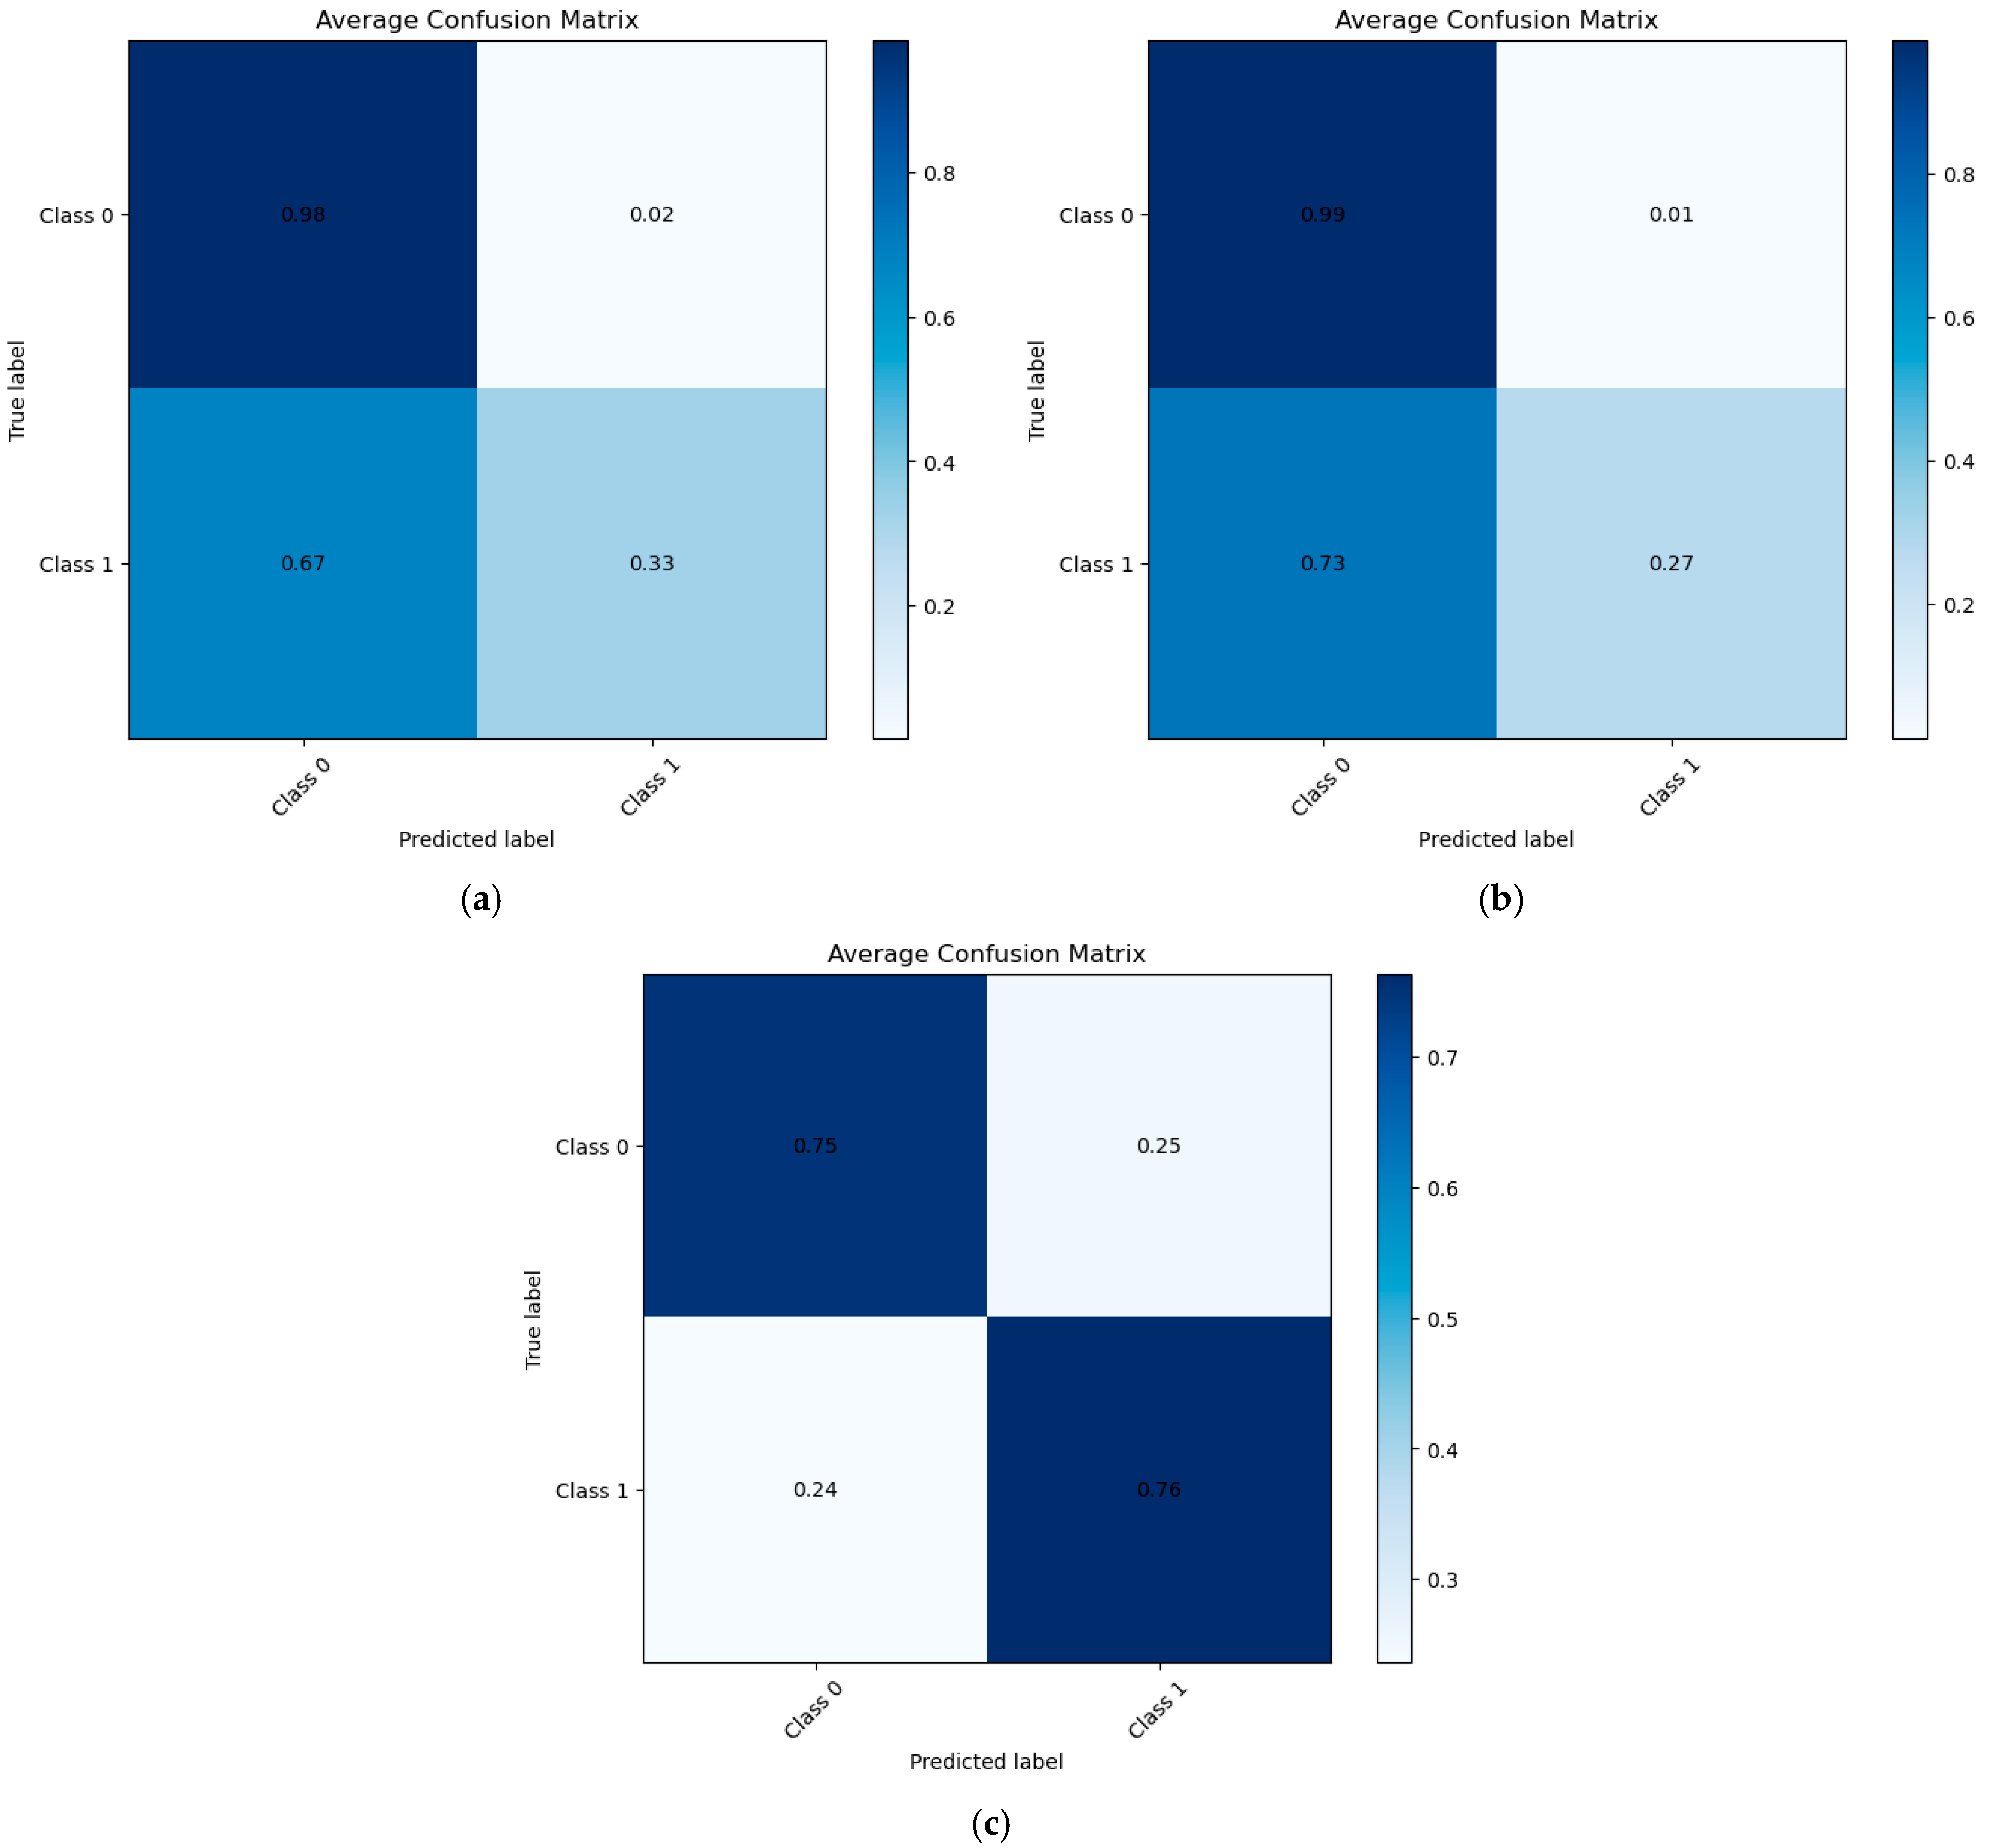
3.2. Testing Performance Metrics

The application of various ML models, coupled with the SFFS method, yielded significant insights into the factors influencing the table rankings of French teams. The performance metrics for XGBoost, SVM, and LR models are summarized below.
The XGBoost classifier achieved an accuracy of 88.42%, with a recall of 32.53%, an F1-score of 45.43%, and a precision of 77.51%, using 18 selected features (Table 2). Although the precision was high, indicating that the positive predictions were reliable, the recall was relatively low, suggesting that the model missed a substantial number of positive cases. The F1-score reflects a balance between precision and recall but shows room for improvement in model performance.
The SVM classifier demonstrated an accuracy of 87.89%, with a recall of 27.19%, an F1-score of 39.54%, and a precision of 78.79%, using 10 features (Table 2). The high precision indicates that when the SVM model predicted a positive case, it was usually correct. However, similar to XGBoost, the recall was low, indicating that many positive cases were not identified. The F1-score suggests that while precision is strong, the model’s overall effectiveness in balancing precision and recall needs enhancement.
The LR classifier, identified as the best-performing model, achieved an accuracy of 75.13%, with a recall of 76.32%, an F1-score of 48.03%, and a precision of 35.17%, using only six features (Table 2). Despite having a slightly lower accuracy than XGBoost and SVM, the LR model excelled in recall, capturing a higher proportion of true positives based only on six features. The superiority of the LR classifier is also shown below by observing the specificity and sensitivity in the confusion matrices.
The normalized confusion matrices for the three classifiers (XGBoost, SVM, and LR) are illustrated in Figure 2, providing a visual representation of the classification performance and highlighting areas where each model struggles with class confusion. Specifically, the sensitivity and specificity for the best-performing ML classifier (LR) are 0.76 and 0.75, respectively.

3.3. Feature Selection
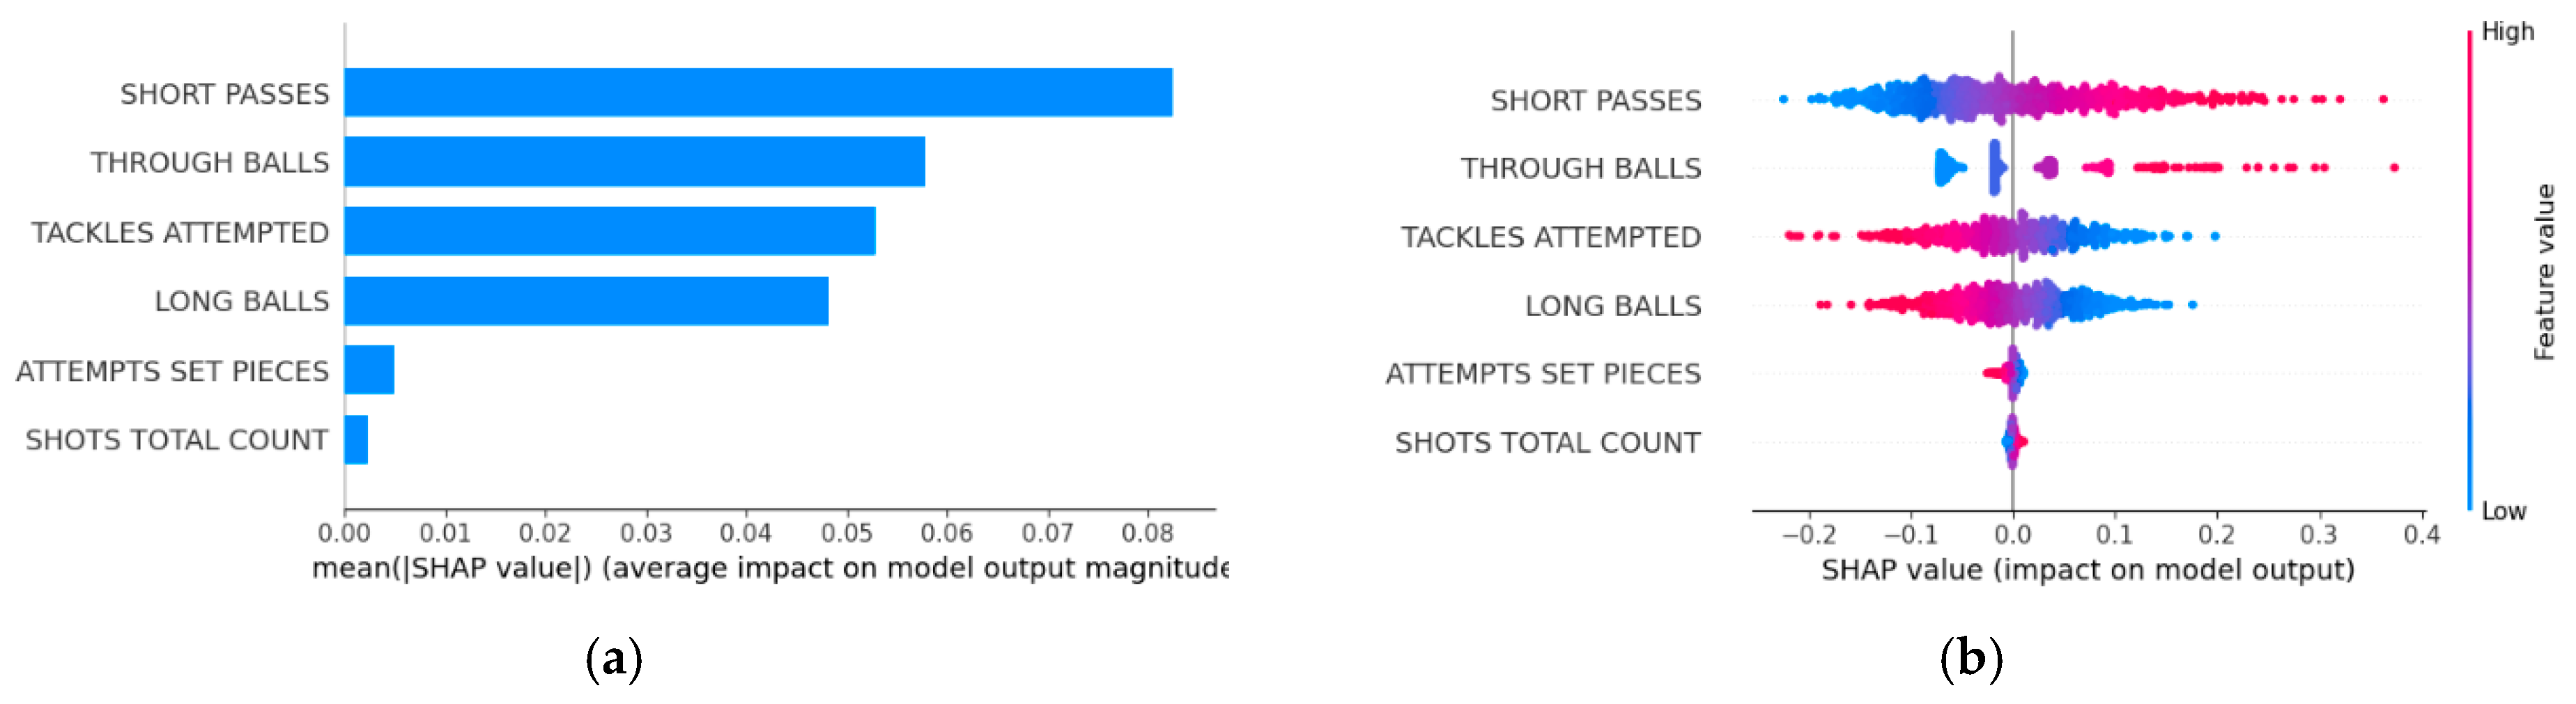
The FS process identified several key factors for the best-performing LR classifier. The selected features and their descriptions are detailed in Table 3. Table 3 also provides the relative feature importance. The coefficients of the LR model are extracted after each iteration where the model is trained on the selected features. These coefficients represent the importance of each feature.

3.4. Explainability

To enhance the interpretability of our ML models, we employed the SHAP method on the best-performing classifier. SHAP values offer a comprehensive understanding of how each feature impacts the model’s predictions, making it easier to interpret complex machine learning models. The SHAP summary plots presented in the images provide insights into the most influential features and their contributions to the model’s output.
The first SHAP summary plot displays the mean SHAP value for each feature, indicating the average impact of each feature on the model’s predictions (Figure 3a). In this plot, “SHORT PASSES” emerged as the most significant feature, having the highest mean SHAP value. This indicates that the number of short passes has the greatest influence on the model’s output. Other important features include “THROUGH BALLS”, “TACKLES ATTEMPTED”, and “LONG BALLS”, all of which significantly impact the model’s predictions. These features are essential in determining the ranking of teams, highlighting the importance of both offensive and defensive play metrics.
The second SHAP summary plot provides a more detailed view, showing the distribution of SHAP values for each feature along with their respective feature values (Figure 3b). In this plot, each point represents a SHAP value for a specific feature in a single instance. The color of the points corresponds to the feature value (with red indicating high values and blue indicating low values). For instance, higher values of “SHORT PASSES” generally have a positive impact on the model’s output, pushing predictions toward higher rankings. Conversely, lower values of “SHORT PASSES” have a negative impact. A similar pattern can be observed for “THROUGH BALLS”, where higher values tend to positively influence the model’s predictions. Furthermore, we can also observe that higher values of “TACKELS ATTEMPTED” and “LONG BALLS” have a negative impact on the model’s output, pushing predictions toward medium to lower rankings.
This detailed SHAP analysis elucidates how specific features contribute to the likelihood of higher or lower rankings. For example, the positive impact of high “SHORT PASSES” and “THROUGH BALLS” values indicates that effective passing strategies are crucial for achieving higher rankings. Conversely, features like “ATTEMPTS SET PIECES” and “ SHOTS TOTAL COUNT “ show a neutral relationship with the model’s predictions.
By employing SHAP, we can unravel the significance of each identified factor, providing clear insights into how different aspects of team performance influence the model’s predictions. This level of interpretability is invaluable for understanding the underlying mechanisms driving the model’s decisions, ensuring that the predictions are not only accurate but also transparent and explainable.

4. Discussion

4.1. Passes

Two of the variables with the greatest impact on our model are related to the distance of the passes. The results show that top teams prefer short passes, whereas other teams prefer long passes. These findings agree with existing research. Specifically, Lopez-Valenciano et al. [22] found that a lower rate of long passes is associated with more points and a better ranking position, whereas Reis et al. [43] found that teams with the highest number of long pass attempts lose ball possession more frequently and that only less than 1% of long passes resulted in shots on goal. Additionally, Kapsalis et al. [44] found that teams that make more short passes score more goals, while teams that make more long passes score fewer goals, a finding that was also confirmed in the study by Rahimian et al. [45], who found that teams increased the likelihood of a possession ending in a goal if they increased short passes and decreased long passes. It is worth noting that much earlier, Adams et al. [46] had found that the greatest contribution to distinguishing between teams that finish at the top versus teams that finish at the bottom of the English Premier League was made by the total successful short passes completed by defenders. This preference for short passes is linked to better ball retention, reduced risk of turnovers, and the ability to build attacks gradually, leading to more high-quality scoring opportunities.
A way in which a player can transfer the ball to a teammate is through balls. Our research shows that top teams perform through balls more frequently, which agrees with the existing literature. Specifically, research has shown that there was a correlation between through balls and goals succeeded by a team [47]. As a result, through balls can increase a team’s probability of success [21]. The frequent use of through balls by top teams highlights their tactical approach focused on breaking defensive lines and creating goal-scoring opportunities in the final third, which is a critical aspect of modern attacking strategies [48].

4.2. Defensive Actions

Regarding the defensive actions, we found that the top teams have fewer attempts at tackling. The review of defensive performance conducted by Freitas et al. [49] showed that the connection between tackling actions and match outcomes was inconsistent. Some papers report that the number of successful or total attempted tackles did not vary with the match outcome, while others report small to trivial associations between tackles and the team’s competitive success. It appears, therefore, that the impact of tackling varies among competitions. In our research conducted in League 1, it seems that top teams perform fewer tackles. Additionally, in our research, attempted tackles are among the four variables that have the greatest impact on predicting a successful or unsuccessful team. This contrasts with two other studies [50,51], which found that tackles, out of a series of actions that included clearances and interceptions, are variable, with the least relevance to the prediction of match outcomes.

4.3. Other Factors

An interesting aspect of the results is the role of the variables “SHOTS TOTAL COUNT” and “ATTEMPTS SET PIECES” in the classification model. Despite their inclusion as important features, these variables do not display a clear positive or negative correlation with team success, unlike the features we have already discussed.
This ambiguous relationship might be due to the multifaceted nature of these variables. For instance, while a high number of total shots might generally suggest offensive prowess [52,53], it could also indicate inefficiency if a large proportion of these shots are off-target or blocked [54]. For example, Yue et al. [55] found that although total shots were important for the result of a match, the most significant factor was goal efficiency (defined by the number of goals divided by the number of shots). Similarly, a high percentage of attempts from set pieces could reflect a team’s reliance on set plays, but this might indicate that the team struggles to create enough scoring opportunities from open play.
These findings suggest that the effectiveness of “SHOTS TOTAL COUNT” and “ATTEMPTS SET PIECES” is context-dependent, varying based on factors such as shot quality, game context, and the team’s overall strategy. This highlights the complexity of interpreting these variables and underscores the value of explainable ML techniques, which can identify important features without relying solely on linear relationships [56,57].

4.4. Strengths of This Study

This study exhibits several strengths. First, it builds on an extensive review of the existing literature, providing a robust theoretical foundation. Additionally, the use of advanced methodological approaches, such as SFFS and SHAP, for interpretability demonstrates a sophisticated level of analysis, which enhances the reliability and depth of the findings. The use of multiple evaluation metrics (accuracy, precision, recall, F1-score) and confusion matrices ensures a thorough assessment of the ML models’ performance. The practical relevance of this study cannot be overstated, as it addresses the crucial problem of identifying factors that contribute to securing top positions in the French Ligue 1. This is valuable for football analysts, coaches, and club management seeking data-driven insights to improve team performance.
In particular, the findings of our study offer valuable insights that can significantly influence team strategies and player recruitment. The identification of short passes and through balls as critical factors for securing a top position in Ligue 1 suggests that teams should prioritize possession-based strategies that emphasize quick, precise passing in offensive play. This insight can guide coaches to adopt tactics that foster high ball retention and efficient penetration of the opposition’s defense [44,47]. Additionally, recognizing the negative impact of frequent long balls highlights the importance of maintaining composure because long balls can disrupt team cohesion. From a recruitment perspective, these findings indicate that clubs should focus on acquiring players who excel in short, accurate passing and have the vision to execute through balls effectively. Players who can perform well under pressure and contribute to a possession-based style of play will be essential in building a team capable of consistently competing at the top level [1,58]. Thus, aligning team strategies and recruitment with these identified factors can enhance overall performance and increase the likelihood of achieving Champions League qualification.

4.5. Limitations

However, this study is not without its limitations. One notable limitation is the reliance on data from a statistics website. Although the data are considered reliable, any inherent biases or inaccuracies in the source data could potentially affect this study’s outcomes. Additionally, the analysis is based on data from a single season of one country (2022–2023, Ligue 1), which may limit the generalizability of the findings across different seasons or other leagues. Furthermore, football’s inherent complexity, characterized by numerous unpredictable factors, such as injuries, weather conditions, and player morale, presents another limitation. These factors are not captured in the dataset, which may constrain the predictive accuracy of the models. Finally, this study was conducted using the static method rather than the dynamic method, meaning that it did not account for changes that occurred during or between matches (e.g., match status, players’ transfers) [59]. However, the static method is widely used in performance analysis in sports, offering valuable information to stakeholders [60]. In addition, from the perspective of the ML, the selected models have some limitations that we need to point out. In particular, XGBoost is computationally intensive and prone to overfitting on small, noisy datasets; SVM struggles with scalability and interpretability, while LR is limited by its linear assumption and sensitivity to multicollinearity.
Future research should consider a longitudinal approach by analyzing data from multiple seasons and different European leagues to enhance the generalizability of our findings. Additionally, incorporating dynamic in-game factors, such as match status or player substitutions, can provide a deeper understanding of how tactical adjustments impact team performance. Finally, future studies can focus on individual player contributions within the team context, using our findings to guide recruitment and development strategies that align with the identified key performance factors.

5. Conclusions

In conclusion, this study has successfully identified key factors contributing to securing one of the top positions in the French Ligue 1, thereby qualifying for the UCL. By employing advanced ML techniques and explainable methods, particularly SHAP, this research provides both high predictive accuracy and clear interpretability of the results. The findings underscore the significance of possession play with short passes and efficiency through balls as critical determinants of team success, aligning with the existing literature. Conversely, factors such as frequent long balls and attempted tackles were found to negatively impact team performance. It is worth noting the role of factors such as total shots or the percentage of final attempts generated from set pieces or open play. Such context-dependent factors seem to contribute to classification, though they do not have a clearly positive or negative relationship. While this study’s reliance on data from a single season and the use of the static method present limitations, it nonetheless offers valuable insights for football analysts, coaches, and club management as the integration of machine learning with explainable ML techniques marks a significant advancement in football analytics.

Author Contributions

Conceptualization, S.P., C.K., M.M. and V.A.; methodology, C.K. and V.A.; software, C.K. and T.T.; validation, V.A. and C.K.; formal analysis, S.P., M.M. and C.K.; investigation, M.M.; data curation, C.K., V.A. and S.P.; writing—original draft preparation, S.P., C.K. and V.A.; writing—review and editing, S.P., M.M., C.K., V.A. and G.G.; visualization, T.T. and V.A.; supervision, G.G. and M.M.; project administration, G.G. and M.M. All authors have read and agreed to the published version of the manuscript.

Funding

This research received no external funding.

Institutional Review Board Statement

Not applicable.

Informed Consent Statement

Not applicable.

Data Availability Statement

Data are available upon request from the corresponding author due to privacy restrictions.

Conflicts of Interest

The authors declare no conflicts of interest.

References

  1. Plakias, S.; Moustakidis, S.; Kokkotis, C.; Papalexi, M.; Tsatalas, T.; Giakas, G.; Tsaopoulos, D. Identifying Soccer Players’ Playing Styles: A Systematic Review. J. Funct. Morphol. Kinesiol. 2023, 8, 104. [Google Scholar] [CrossRef]
  2. Plakias, S.; Moustakidis, S.; Kokkotis, C.; Tsatalas, T.; Papalexi, M.; Plakias, D.; Giakas, G.; Tsaopoulos, D. Identifying soccer teams’ styles of play: A scoping and critical review. J. Funct. Morphol. Kinesiol. 2023, 8, 39. [Google Scholar] [CrossRef]
  3. Martin, D.; Donoghue, P.G.O.; Bradley, J.; McGrath, D. Developing a framework for professional practice in applied performance analysis. Int. J. Perform. Anal. Sport 2021, 21, 845–888. [Google Scholar] [CrossRef]
  4. Memmert, D.; Rein, R. Match analysis, big data and tactics: Current trends in elite soccer. Ger. J. Sports Med./Deutsch. Z. Fur Sportmed. 2018, 69, 65–72. [Google Scholar] [CrossRef]
  5. Rein, R.; Memmert, D. Big data and tactical analysis in elite soccer: Future challenges and opportunities for sports science. SpringerPlus 2016, 5, 1–13. [Google Scholar] [CrossRef]
  6. Xu, D.; Zhou, H.; Quan, W.; Jiang, X.; Liang, M.; Li, S.; Ugbolue, U.C.; Baker, J.S.; Gusztav, F.; Ma, X. A new method proposed for realizing human gait pattern recognition: Inspirations for the application of sports and clinical gait analysis. Gait Posture 2024, 107, 293–305. [Google Scholar] [CrossRef]
  7. Xu, D.; Zhou, H.; Quan, W.; Gusztav, F.; Wang, M.; Baker, J.S.; Gu, Y. Accurately and effectively predict the ACL force: Utilizing biomechanical landing pattern before and after-fatigue. Comput. Methods Programs Biomed. 2023, 241, 107761. [Google Scholar] [CrossRef]
  8. Bullough, S. UEFA champions league revenues, performance and participation 2003–2004 to 2016–2017. Manag. Sport Leis. 2018, 23, 139–156. [Google Scholar] [CrossRef]
  9. Güner, İ.; Hamidi Sahneh, M. Dancing with the stars: Does playing in elite tournaments affect performance? Oxf. Bull. Econ. Stat. 2023, 85, 1–34. [Google Scholar] [CrossRef]
  10. Soana, M.G.; Lippi, A.; Rossi, S. Do financial markets price UEFA Champions League competition events? EuroMed J. Bus. 2024, 19, 208–228. [Google Scholar] [CrossRef]
  11. Lepschy, H.; Wäsche, H.; Woll, A. How to be successful in football: A systematic review. Open Sports Sci. J. 2018, 11, 3–13. [Google Scholar] [CrossRef]
  12. Bekris, E.; Mylonis, E.; Sarakinos, A.; Gissis, I.; Gioldasis, A.; Sotiropoulos, A. Offense and defense statistical indicators that determine the Greek Superleague teams placement on the Table 2011-12. J. Phys. Educ. Sport 2013, 13, 338–347. [Google Scholar] [CrossRef]
  13. Fernández-Cortés, J.; García-Ceberino, J.M.; García-Rubio, J.; Ibáñez, S.J. Influence of game indicators on the ranking of teams in the Spanish soccer league. Appl. Sci. 2023, 13, 8097. [Google Scholar] [CrossRef]
  14. Yang, G.; Leicht, A.S.; Lago, C.; Gómez, M.-Á. Key team physical and technical performance indicators indicative of team quality in the soccer Chinese super league. Res. Sports Med. 2018, 26, 158–167. [Google Scholar] [CrossRef]
  15. Chmura, P.; Oliva-Lozano, J.M.; Muyor, J.M.; Andrzejewski, M.; Chmura, J.; Czarniecki, S.; Kowalczuk, E.; Rokita, A.; Konefał, M. Physical Performance Indicators and Team Success in the German Soccer League. J. Hum. Kinet. 2022, 83, 257–265. [Google Scholar] [CrossRef]
  16. Andrzejewski, M.; Oliva-Lozano, J.M.; Chmura, P.; Chmura, J.; Czarniecki, S.; Kowalczuk, E.; Rokita, A.; Muyor, J.M.; Konefał, M. Analysis of team success based on match technical and running performance in a professional soccer league. BMC Sports Sci. Med. Rehabil. 2022, 14, 82. [Google Scholar] [CrossRef]
  17. Longo, U.G.; Sofi, F.; Candela, V.; Risi Ambrogioni, L.; Pagliai, G.; Massaroni, C.; Schena, E.; Cimmino, M.; D’Ancona, F.; Denaro, V. The influence of athletic performance on the highest positions of the final ranking during 2017/2018 Serie A season. BMC Sports Sci. Med. Rehabil. 2021, 13, 32. [Google Scholar] [CrossRef]
  18. Coso, J.D.; Brito, D.d.S.; Moreno-Perez, V.; Buldú, J.M.; Nevado, F.; Resta, R.; López-Del Campo, R. Influence of players’ maximum running speed on the team’s ranking position at the end of the Spanish LaLiga. Int. J. Environ. Res. Public Health 2020, 17, 8815. [Google Scholar] [CrossRef]
  19. Pappalardo, L.; Cintia, P. Quantifying the relation between performance and success in soccer. Adv. Complex Syst. 2018, 21, 1750014. [Google Scholar] [CrossRef]
  20. Hoppe, M.; Slomka, M.; Baumgart, C.; Weber, H.; Freiwald, J. Match running performance and success across a season in German Bundesliga soccer teams. Int. J. Sports Med. 2015, 36, 563–566. [Google Scholar] [CrossRef]
  21. González-Rodenas, J.; Ferrandis, J.; Moreno-Pérez, V.; López-Del Campo, R.; Resta, R.; Del Coso, J. Differences in playing style and technical performance according to the team ranking in the Spanish football LaLiga. A thirteen seasons study. PLoS ONE 2023, 18, e0293095. [Google Scholar] [CrossRef]
  22. Lopez-Valenciano, A.; Garcia-Gómez, J.A.; López-Del Campo, R.; Resta, R.; Moreno-Perez, V.; Blanco-Pita, H.; Valés-Vázquez, Á.; Del Coso, J. Association between offensive and defensive playing style variables and ranking position in a national football league. J. Sports Sci. 2022, 40, 50–58. [Google Scholar] [CrossRef]
  23. Rico-González, M.; Pino-Ortega, J.; Méndez, A.; Clemente, F.; Baca, A. Machine learning application in soccer: A systematic review. Biol. Sport 2023, 40, 249–263. [Google Scholar] [CrossRef]
  24. Nassis, G.; Stylianides, G.; Verhagen, E.; Brito, J.; Figueiredo, P.; Krustrup, P. A review of machine learning applications in soccer with an emphasis on injury risk. Biol. Sport 2023, 40, 233–239. [Google Scholar] [CrossRef]
  25. Rossi, A.; Pappalardo, L.; Cintia, P. A narrative review for a machine learning application in sports: An example based on injury forecasting in soccer. Sports 2021, 10, 5. [Google Scholar] [CrossRef]
  26. Xu, D.; Quan, W.; Zhou, H.; Sun, D.; Baker, J.S.; Gu, Y. Explaining the differences of gait patterns between high and low-mileage runners with machine learning. Sci. Rep. 2022, 12, 2981. [Google Scholar] [CrossRef]
  27. Settembre, M.; Buchheit, M.; Hader, K.; Hamill, R.; Tarascon, A.; Verheijen, R.; McHugh, D. Factors associated with match outcomes in elite European football–insights from machine learning models. J. Sports Anal. 2024, 10, 1–16. [Google Scholar] [CrossRef]
  28. Moustakidis, S.; Plakias, S.; Kokkotis, C.; Tsatalas, T.; Tsaopoulos, D. Predicting Football Team Performance with Explainable AI: Leveraging SHAP to Identify Key Team-Level Performance Metrics. Future Internet 2023, 15, 174. [Google Scholar] [CrossRef]
  29. Geurkink, Y.; Boone, J.; Verstockt, S.; Bourgois, J.G. Machine learning-based identification of the strongest predictive variables of winning and losing in Belgian professional soccer. Appl. Sci. 2021, 11, 2378. [Google Scholar] [CrossRef]
  30. Robles-Palazón, F.J.; Puerta-Callejón, J.M.; Gámez, J.A.; Croix, M.D.S.; Cejudo, A.; Santonja, F.; de Baranda, P.S.; Ayala, F. Predicting injury risk using machine learning in male youth soccer players. Chaos Solitons Fractals 2023, 167, 113079. [Google Scholar] [CrossRef]
  31. Majumdar, A.; Bakirov, R.; Hodges, D.; McCullagh, S.; Rees, T. A multi-season machine learning approach to examine the training load and injury relationship in professional soccer. J. Sports Anal. 2024, 10, 47–65. [Google Scholar] [CrossRef]
  32. Majumdar, A.; Bakirov, R.; Hodges, D.; Scott, S.; Rees, T. Machine learning for understanding and predicting injuries in soccer. Sports Med.-Open 2022, 8, 49. [Google Scholar] [CrossRef]
  33. Forcher, L.; Beckmann, T.; Wohak, O.; Romeike, C.; Graf, F.; Altmann, S. Prediction of defensive success in elite soccer using machine learning-Tactical analysis of defensive play using tracking data and explainable AI. Sci. Med. Footb. 2023, in press. [CrossRef]
  34. Stival, L.; Pinto, A.; Andrade, F.d.S.P.d.; Santiago, P.R.P.; Biermann, H.; Torres, R.d.S.; Dias, U. Using machine learning pipeline to predict entry into the attack zone in football. PLoS ONE 2023, 18, e0265372. [Google Scholar] [CrossRef]
  35. Tümer, A.E.; Akyıldız, Z.; Güler, A.H.; Saka, E.K.; Ievoli, R.; Palazzo, L.; Clemente, F.M. Prediction of soccer clubs’ league rankings by machine learning methods: The case of Turkish Super League. Proc. Inst. Mech. Eng. Part P J. Sports Eng. Technol. 2022; in press. [Google Scholar] [CrossRef]
  36. Li, C.; Zhao, Y. Comparison of goal scoring patterns in “The Big Five” European football leagues. Front. Psychol. 2021, 11, 619304. [Google Scholar] [CrossRef]
  37. Whoscored. Statistics. Available online: https://www.whoscored.com/Statistics (accessed on 20 July 2023).
  38. Liu, H.; Hopkins, W.; Gómez, A.M.; Molinuevo, S.J. Inter-operator reliability of live football match statistics from OPTA Sportsdata. Int. J. Perform. Anal. Sport 2013, 13, 803–821. [Google Scholar] [CrossRef]
  39. Kessouri, O. Match performance difference between African and Top Five teams in the group stage of the 2022 World Cup. Trends Sport Sci. 2023, 30, 5–11. [Google Scholar] [CrossRef]
  40. Yi, Q.; Groom, R.; Dai, C.; Liu, H.; Gómez Ruano, M.Á. Differences in technical performance of players from ‘the big five’European football leagues in the UEFA Champions League. Front. Psychol. 2019, 10, 2738. [Google Scholar] [CrossRef]
  41. Whoscored. Glossary. Available online: https://www.whoscored.com/Glossary?fbclid=IwY2xjawEhuvZleHRuA2FlbQIxMAABHY0BGSX-n2SvqNFQAXM8fe1YrepDyQLyggXI6N5Gcwuyitw-OMQlRP45DQ_aem_RkdOv8VmWvsHjpUArenZLg (accessed on 30 July 2024).
  42. Opta. Opta Event Definitions. Available online: https://www.statsperform.com/opta-event-definitions/?fbclid=IwY2xjawEhuvpleHRuA2FlbQIxMAABHTT4_KxCgegjiu1-EetYNDfx94A--zoxUjiH8k5GoGGOj4JOddAI0ywFQg_aem_ULv1_JcQQUkT30bFLaoOlA (accessed on 30 July 2024).
  43. Reis, M.A.M.D.; Vasconcellos, F.V.D.A.; Almeida, M.B.D. Analysis of the effectiveness of long distance passes in 2014 Brazil FIFA World Cup. Rev. Bras. Cineantropometria Desempenho Hum. 2017, 19, 676–685. [Google Scholar] [CrossRef]
  44. Kapsalis, M.; Plakias, S.; Kyranoudis, A.; Zarkadoula, A.; Lathoura, A.; Tsatalas, T. Exploring the impact of possession-based performance indicators on goal scoring in elite football leagues. J. Phys. Educ. Sport 2023, 23, 2004–2015. [Google Scholar] [CrossRef]
  45. Rahimian, P.; Van Haaren, J.; Toka, L. Towards maximizing expected possession outcome in soccer. Int. J. Sports Sci. Coach. 2024, 19, 230–244. [Google Scholar] [CrossRef]
  46. Adams, D.; Morgans, R.; Sacramento, J.; Morgan, S.; Williams, M.D. Successful short passing frequency of defenders differentiates between top and bottom four English Premier League teams. Int. J. Perform. Anal. Sport 2013, 13, 653–668. [Google Scholar] [CrossRef]
  47. Plakias, S.; Mandroukas, A.; Kokkotis, C.; Michailidis, Y.; Mavromatis, G.; Metaxas, T. The correlation of the penetrative pass on offensive third with the possession of the ball in high level soccer. Gazzetta Med. Ital.-Arch. Sci. Med. 2022, 181, 633–638. [Google Scholar] [CrossRef]
  48. Gonzalez-Rodenas, J.; Lopez-Bondia, I.; Calabuig, F.; Pérez-Turpin, J.A.; Aranda, R. Creation of goal scoring opportunities by means of different types of offensive actions in US major league soccer. Hum. Mov. Spec. Issues 2017, 2017, 106–116. [Google Scholar] [CrossRef]
  49. Freitas, R.; Volossovitch, A.; Almeida, C.H.; Vleck, V. Elite-level defensive performance in football: A systematic review. Ger. J. Exerc. Sport Res. 2023, 53, 458–470. [Google Scholar] [CrossRef]
  50. Hassan, A.; Akl, A.-R.; Hassan, I.; Sunderland, C. Predicting wins, losses and attributes’ sensitivities in the soccer world cup 2018 using neural network analysis. Sensors 2020, 20, 3213. [Google Scholar] [CrossRef]
  51. Li, Y.; Ma, R.; Gonçalves, B.; Gong, B.; Cui, Y.; Shen, Y. Data-driven team ranking and match performance analysis in Chinese Football Super League. Chaos Solitons Fractals 2020, 141, 110330. [Google Scholar] [CrossRef]
  52. Castellano, J.; Casamichana, D.; Lago, C. The use of match statistics that discriminate between successful and unsuccessful soccer teams. J. Hum. Kinet. 2012, 31, 139. [Google Scholar] [CrossRef]
  53. Lago-Ballesteros, J.; Lago-Peñas, C. Performance in team sports: Identifying the keys to success in soccer. J. Hum. Kinet. 2010, 25, 85–91. [Google Scholar] [CrossRef]
  54. Engler, F.; Hohmann, A.; Siener, M. Validation of a New Soccer Shooting Test Based on Speed Radar Measurement and Shooting Accuracy. Children 2023, 10, 199. [Google Scholar] [CrossRef] [PubMed]
  55. Yue, Z.; Broich, H.; Mester, J. Statistical analysis for the soccer matches of the first Bundesliga. Int. J. Sports Sci. Coach. 2014, 9, 553–560. [Google Scholar] [CrossRef]
  56. Swathi, Y.; Challa, M. A Comparative Analysis of Explainable AI Techniques for Enhanced Model Interpretability. In Proceedings of the 2023 3rd International Conference on Pervasive Computing and Social Networking (ICPCSN), Salem, India, 19–20 June 2023; pp. 229–234. [Google Scholar]
  57. Klimo, M.; Kopčan, J.; Králik, L.u. Explainability as a Method for Learning From Computers. IEEE Access 2023, 11, 35853–35865. [Google Scholar] [CrossRef]
  58. Plakias, S.; Tsatalas, T.; Armatas, V.; Tsaopoulos, D.; Giakas, G. Tactical Situations and Playing Styles as Key Performance Indicators in Soccer. J. Funct. Morphol. Kinesiol. 2024, 9, 88. [Google Scholar] [CrossRef] [PubMed]
  59. Prieto, J.; Gómez, M.-Á.; Sampaio, J. From a static to a dynamic perspective in handball match analysis: A systematic review. Open Sports Sci. J. 2015, 8, 25–34. [Google Scholar] [CrossRef]
  60. Pratas, J.M.; Volossovitch, A.; Carita, A.I. Goal scoring in elite male football: A systematic review. J. Hum. Sport Exerc. 2018, 13, 218–230. [Google Scholar] [CrossRef]
Figure 1. Workflow of the proposed ML methodology.
Applsci 14 08375 g001
Figure 2. Normalized confusion matrixes for (a) XGBoost, (b) SVM, and (c) LR classifiers.
Applsci 14 08375 g002
Figure 3. This figure depicts (a) the SHAP feature importance and (b) the distribution of SHAP values for the LR best performing ML classifier across the testing instances.
Applsci 14 08375 g003
Table 1. Distribution of teams in each cluster.
PositionTeamPointsCluster
1PSG851
2Lens841
3Marseille731
4Rennes682
5Lille672
6Monaco652
7Lyon622
8Clermont592
9Nice582
10Lorient552
11Reims513
12Montpellier503
13Toulouse483
14Brest443
15Strasbourg403
16Nantes363
17Auxerre 353
18Ajaccio 263
19Troyes 243
20Angers 183
Table 2. Testing performance metrics of the employed ML classifiers.
ML ModelsAccuracyRecallF1-ScorePrecisionNum of Features
XGBoost88.42%32.53%45.43%77.51%18
SVM87.89%27.19%39.54%78.79%10
LR75.13%76.32%48.03%35.15%6
Table 3. Selected features of best-performing classifier (LR).
FeaturesRelative ImportanceDescriptionVariable’s Type
SHORT PASSES0.71Passes shorter than 15 yardsNumeric
THROUGH BALLS0.48An attempted/accurate pass between opposition players in their defensive line to find an onrushing teammateNumeric
LONG BALLS−0.58Passes longer than 25 yardsNumeric
TACKLES ATTEMPTED−0.46Dispossessing an opponent, whether the tackling player comes away with the ball or notNumeric
SHOTS TOTAL COUNT0.12All attempts to score a goal made with any (legal) part of the body, either on or off targetNumeric
ATTEMPTS SET PIECES−0.06The percentage of attempts that have been made via a set piece situation (in relation to the total attempts from set pieces and open play).Numeric
Disclaimer/Publisher’s Note: The statements, opinions and data contained in all publications are solely those of the individual author(s) and contributor(s) and not of MDPI and/or the editor(s). MDPI and/or the editor(s) disclaim responsibility for any injury to people or property resulting from any ideas, methods, instructions or products referred to in the content.

