
Microzonation Approach for Analyzing Regional Seismic Response: A Case Study of the Dune Deposit in Concón, Chile


Abstract
:1. Introduction
2. Materials and Methods
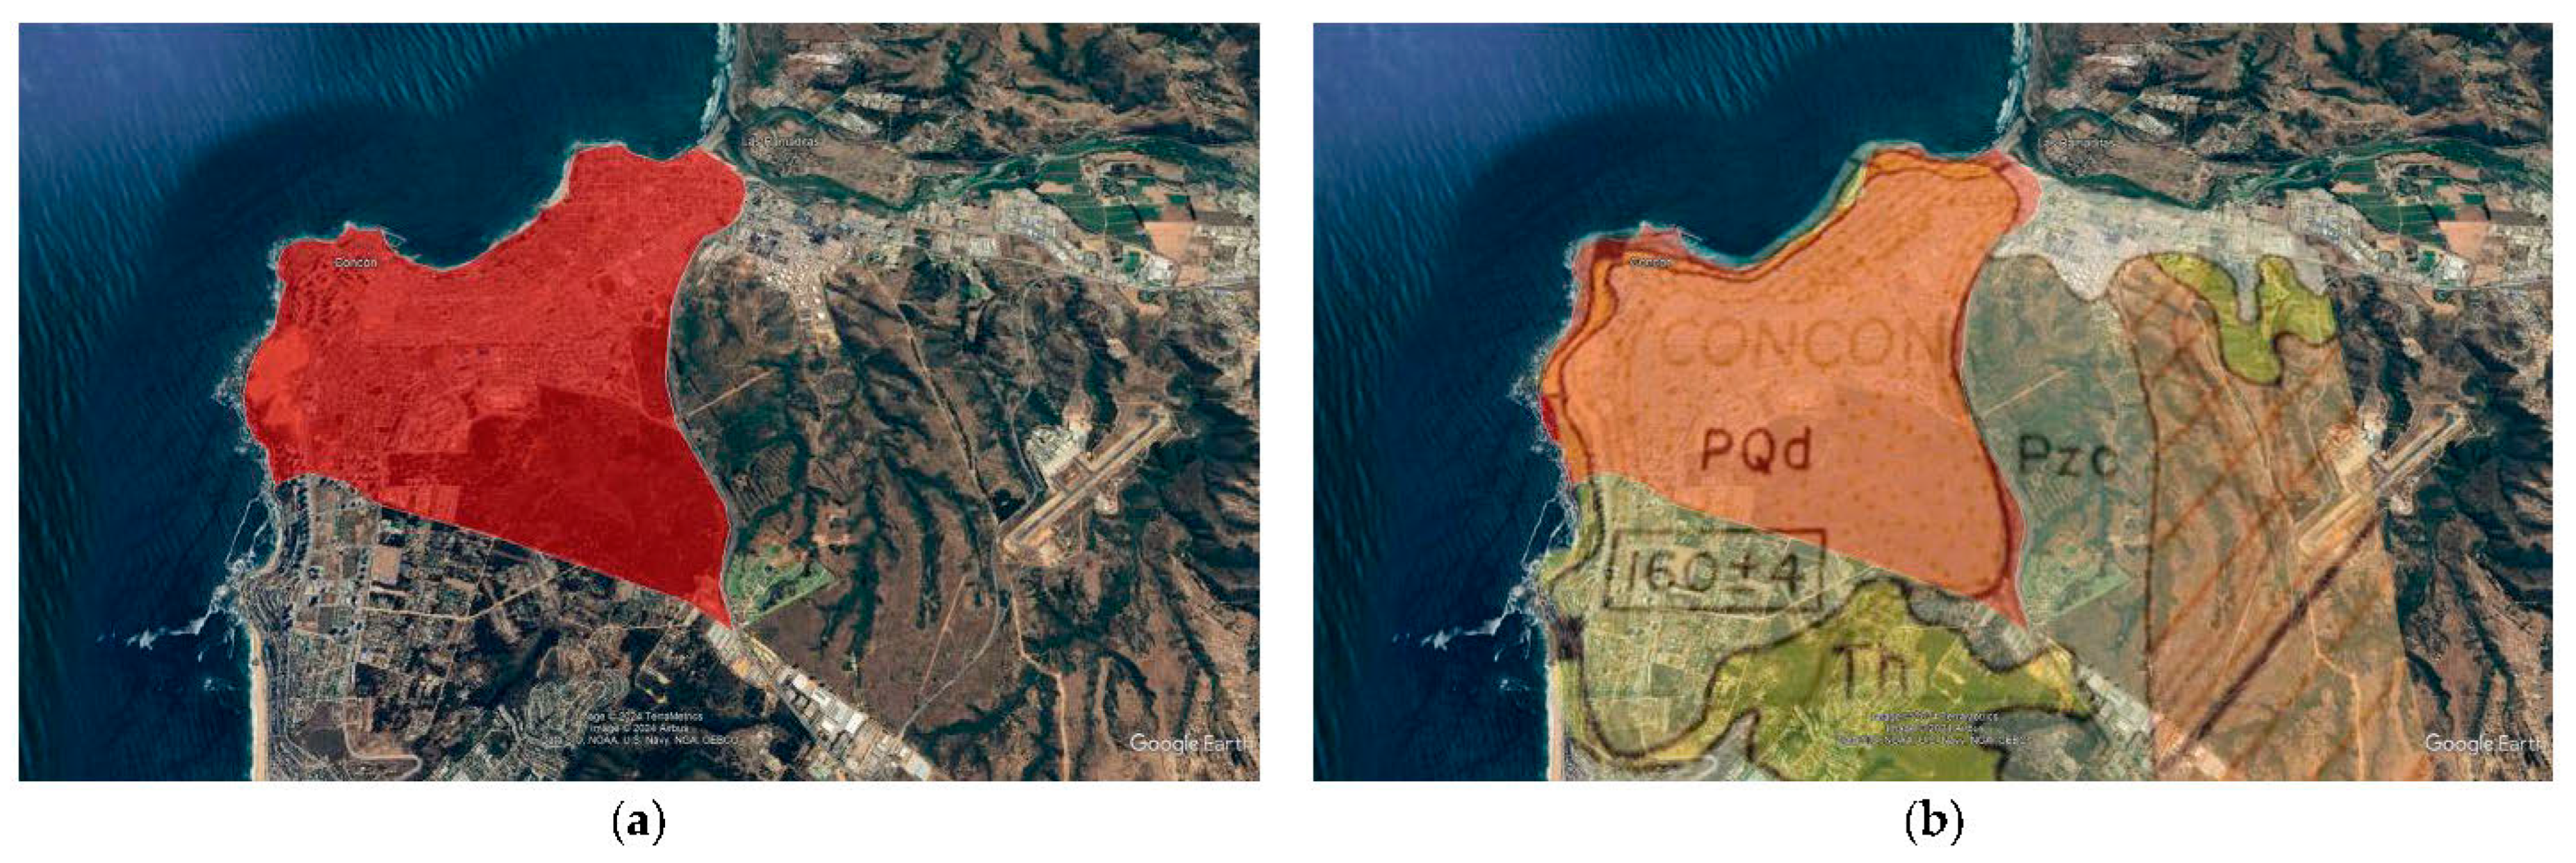
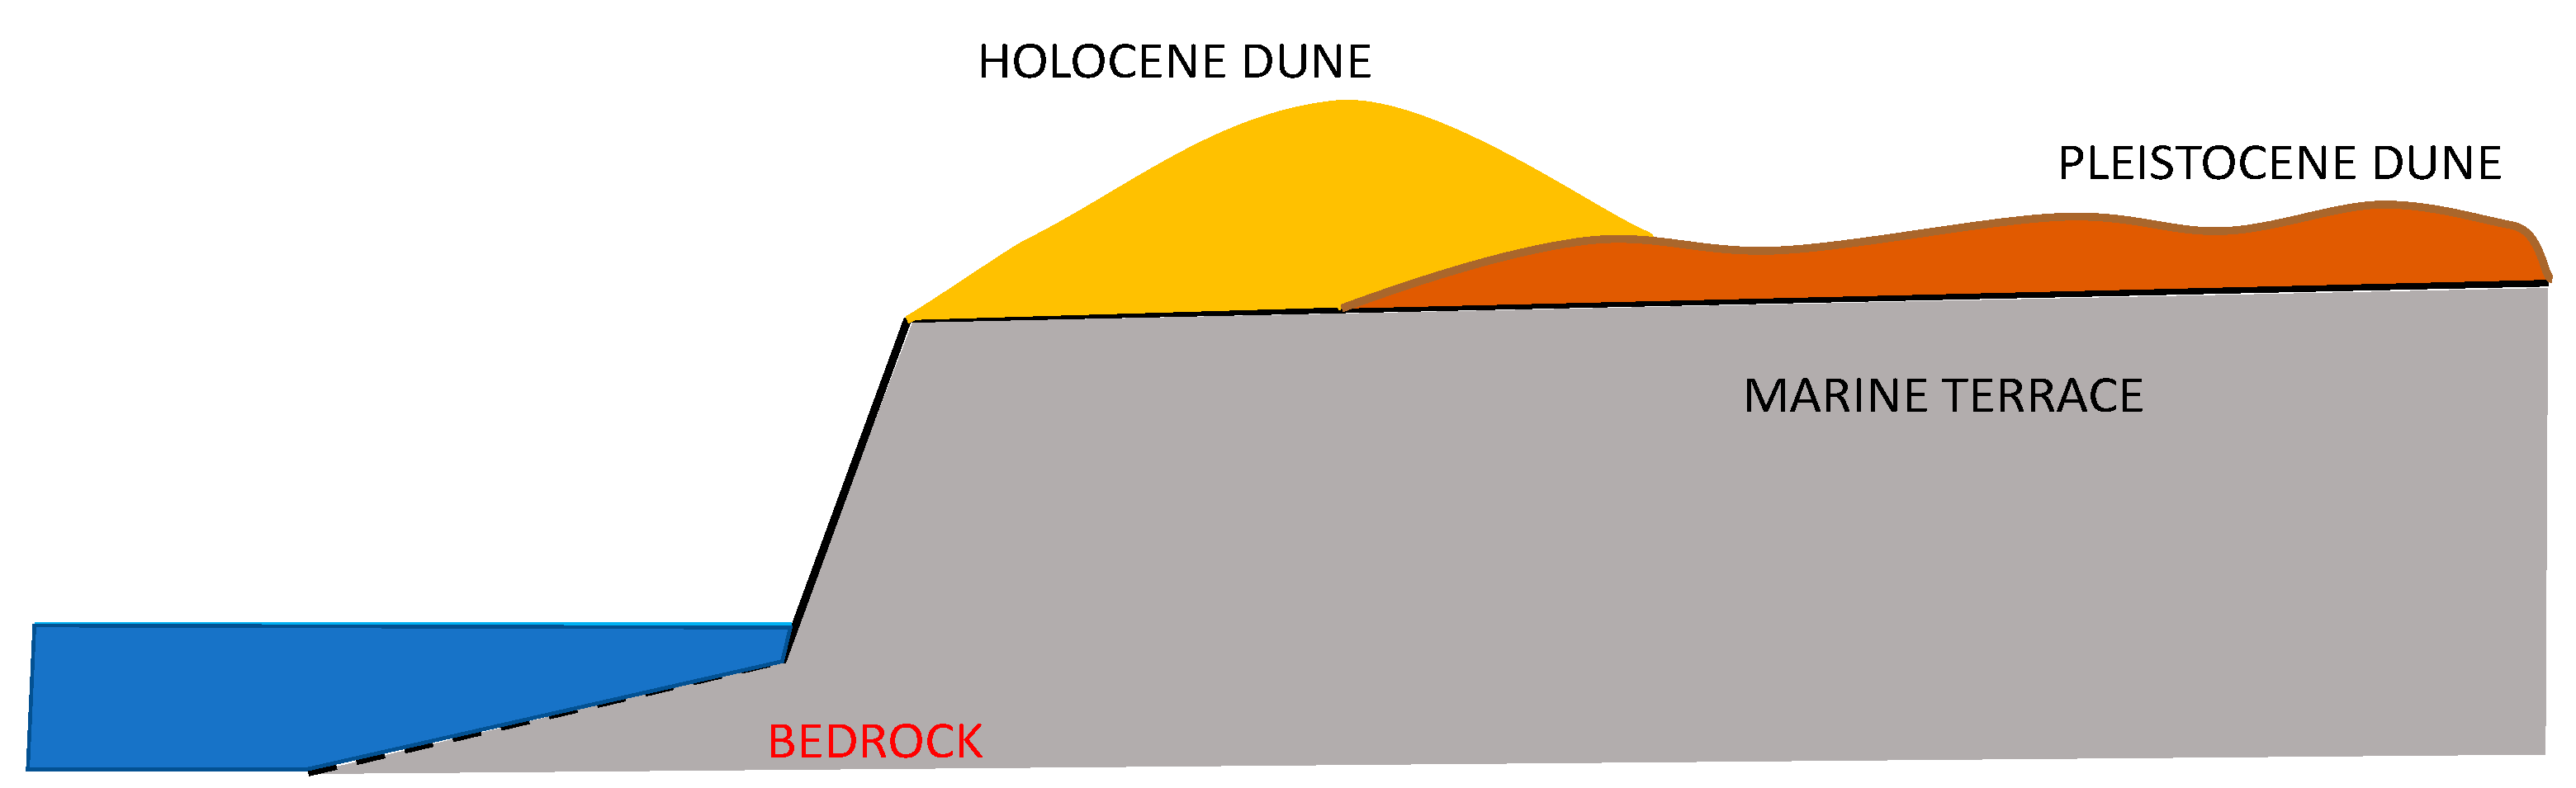
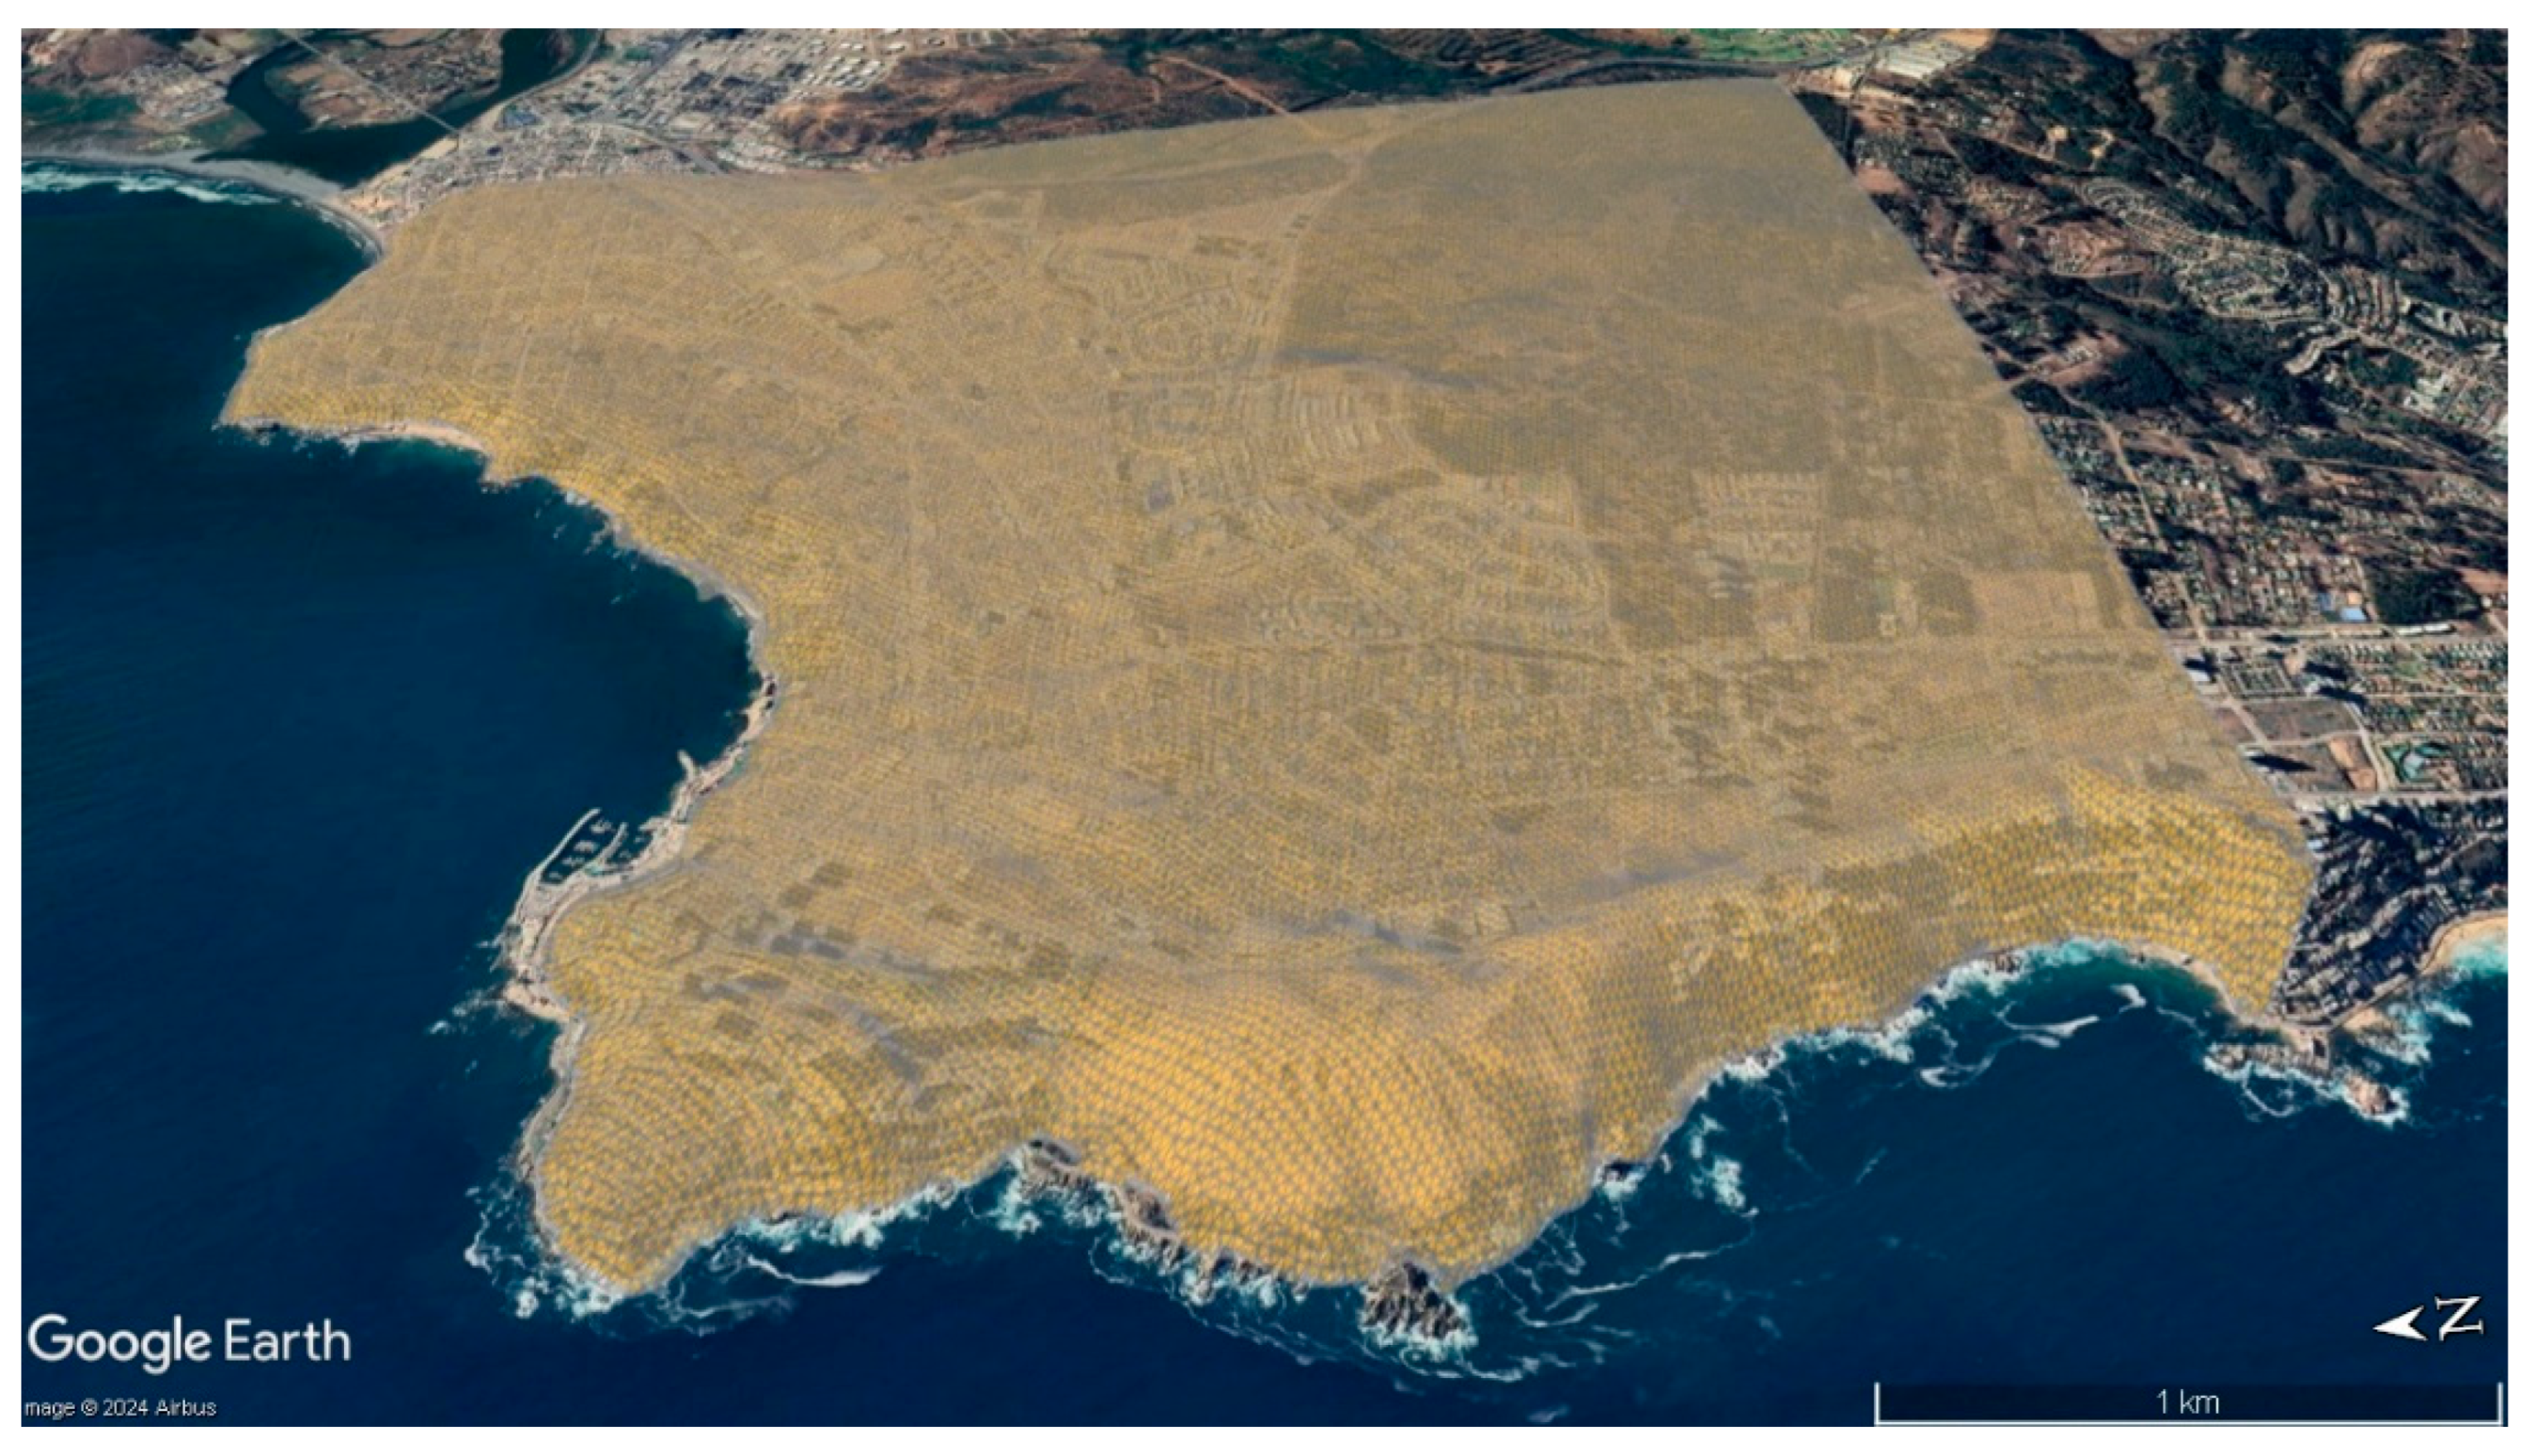
2.1. Geological Characteristics of the Study Area: Urban Zone of Concón
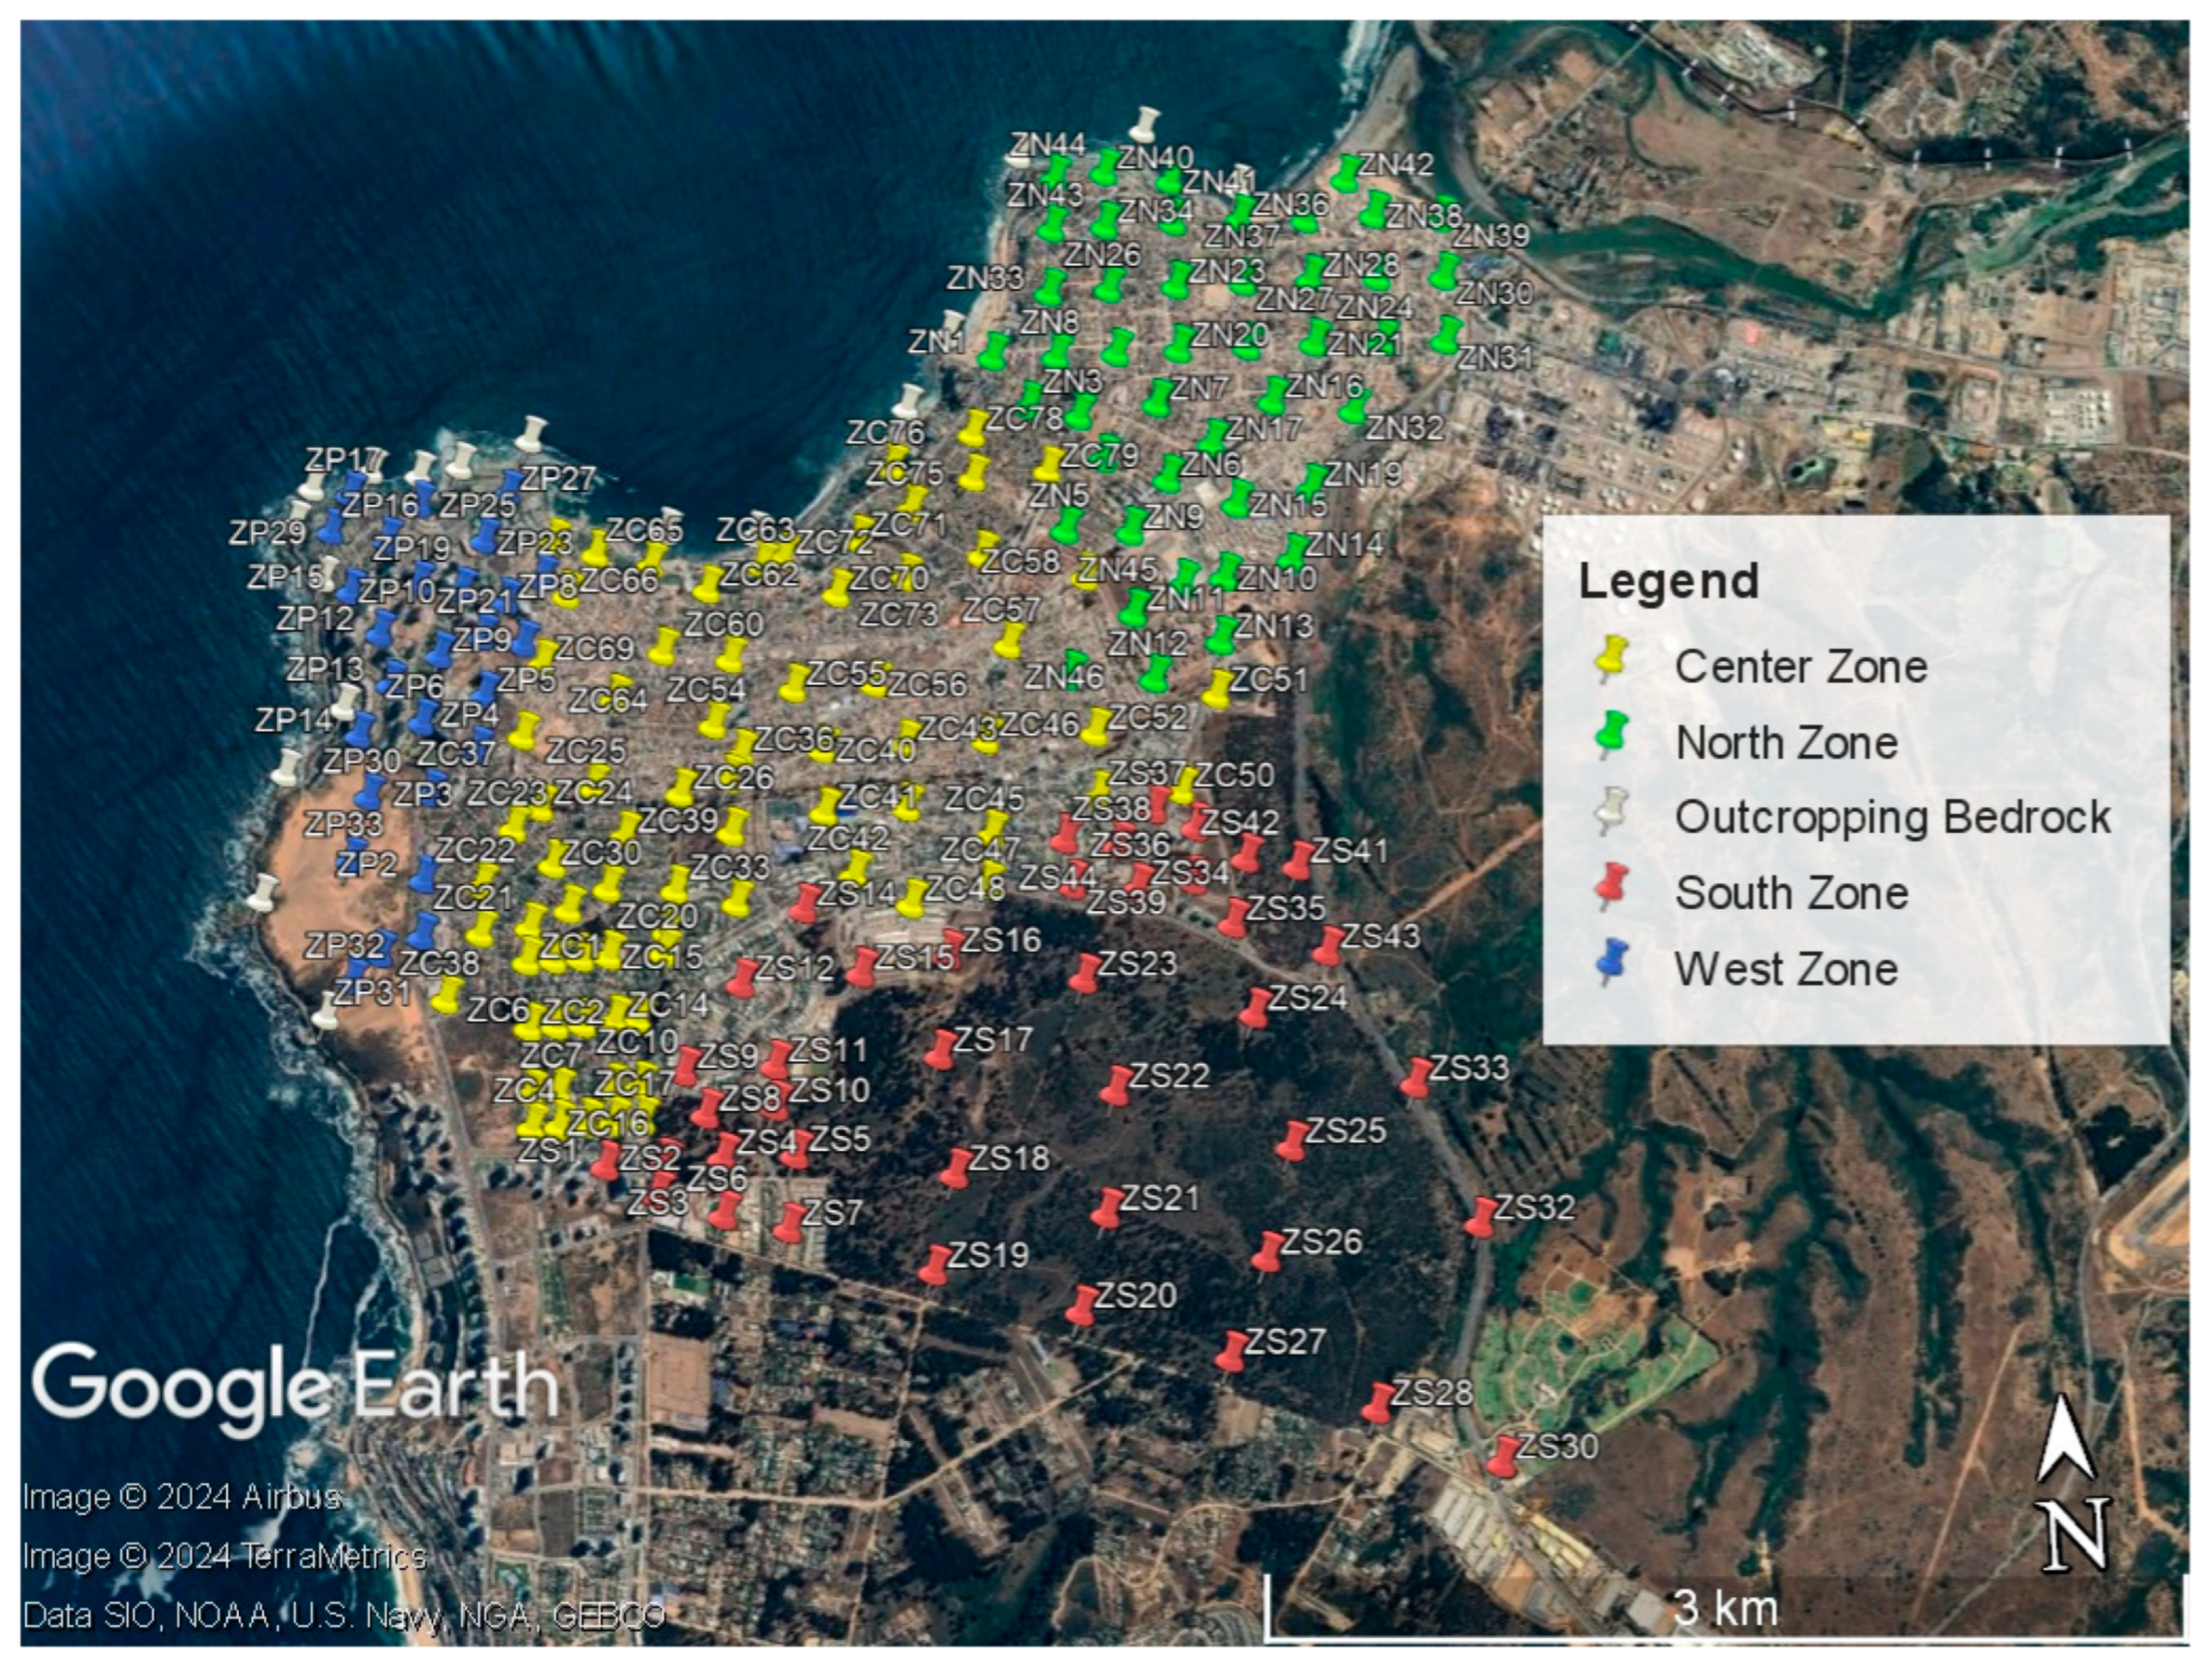
2.2. Field Measurement Procedures and Methods
2.3. Analysis Methodology for Approach for Analyzing Regional Seismic Response
3. Results
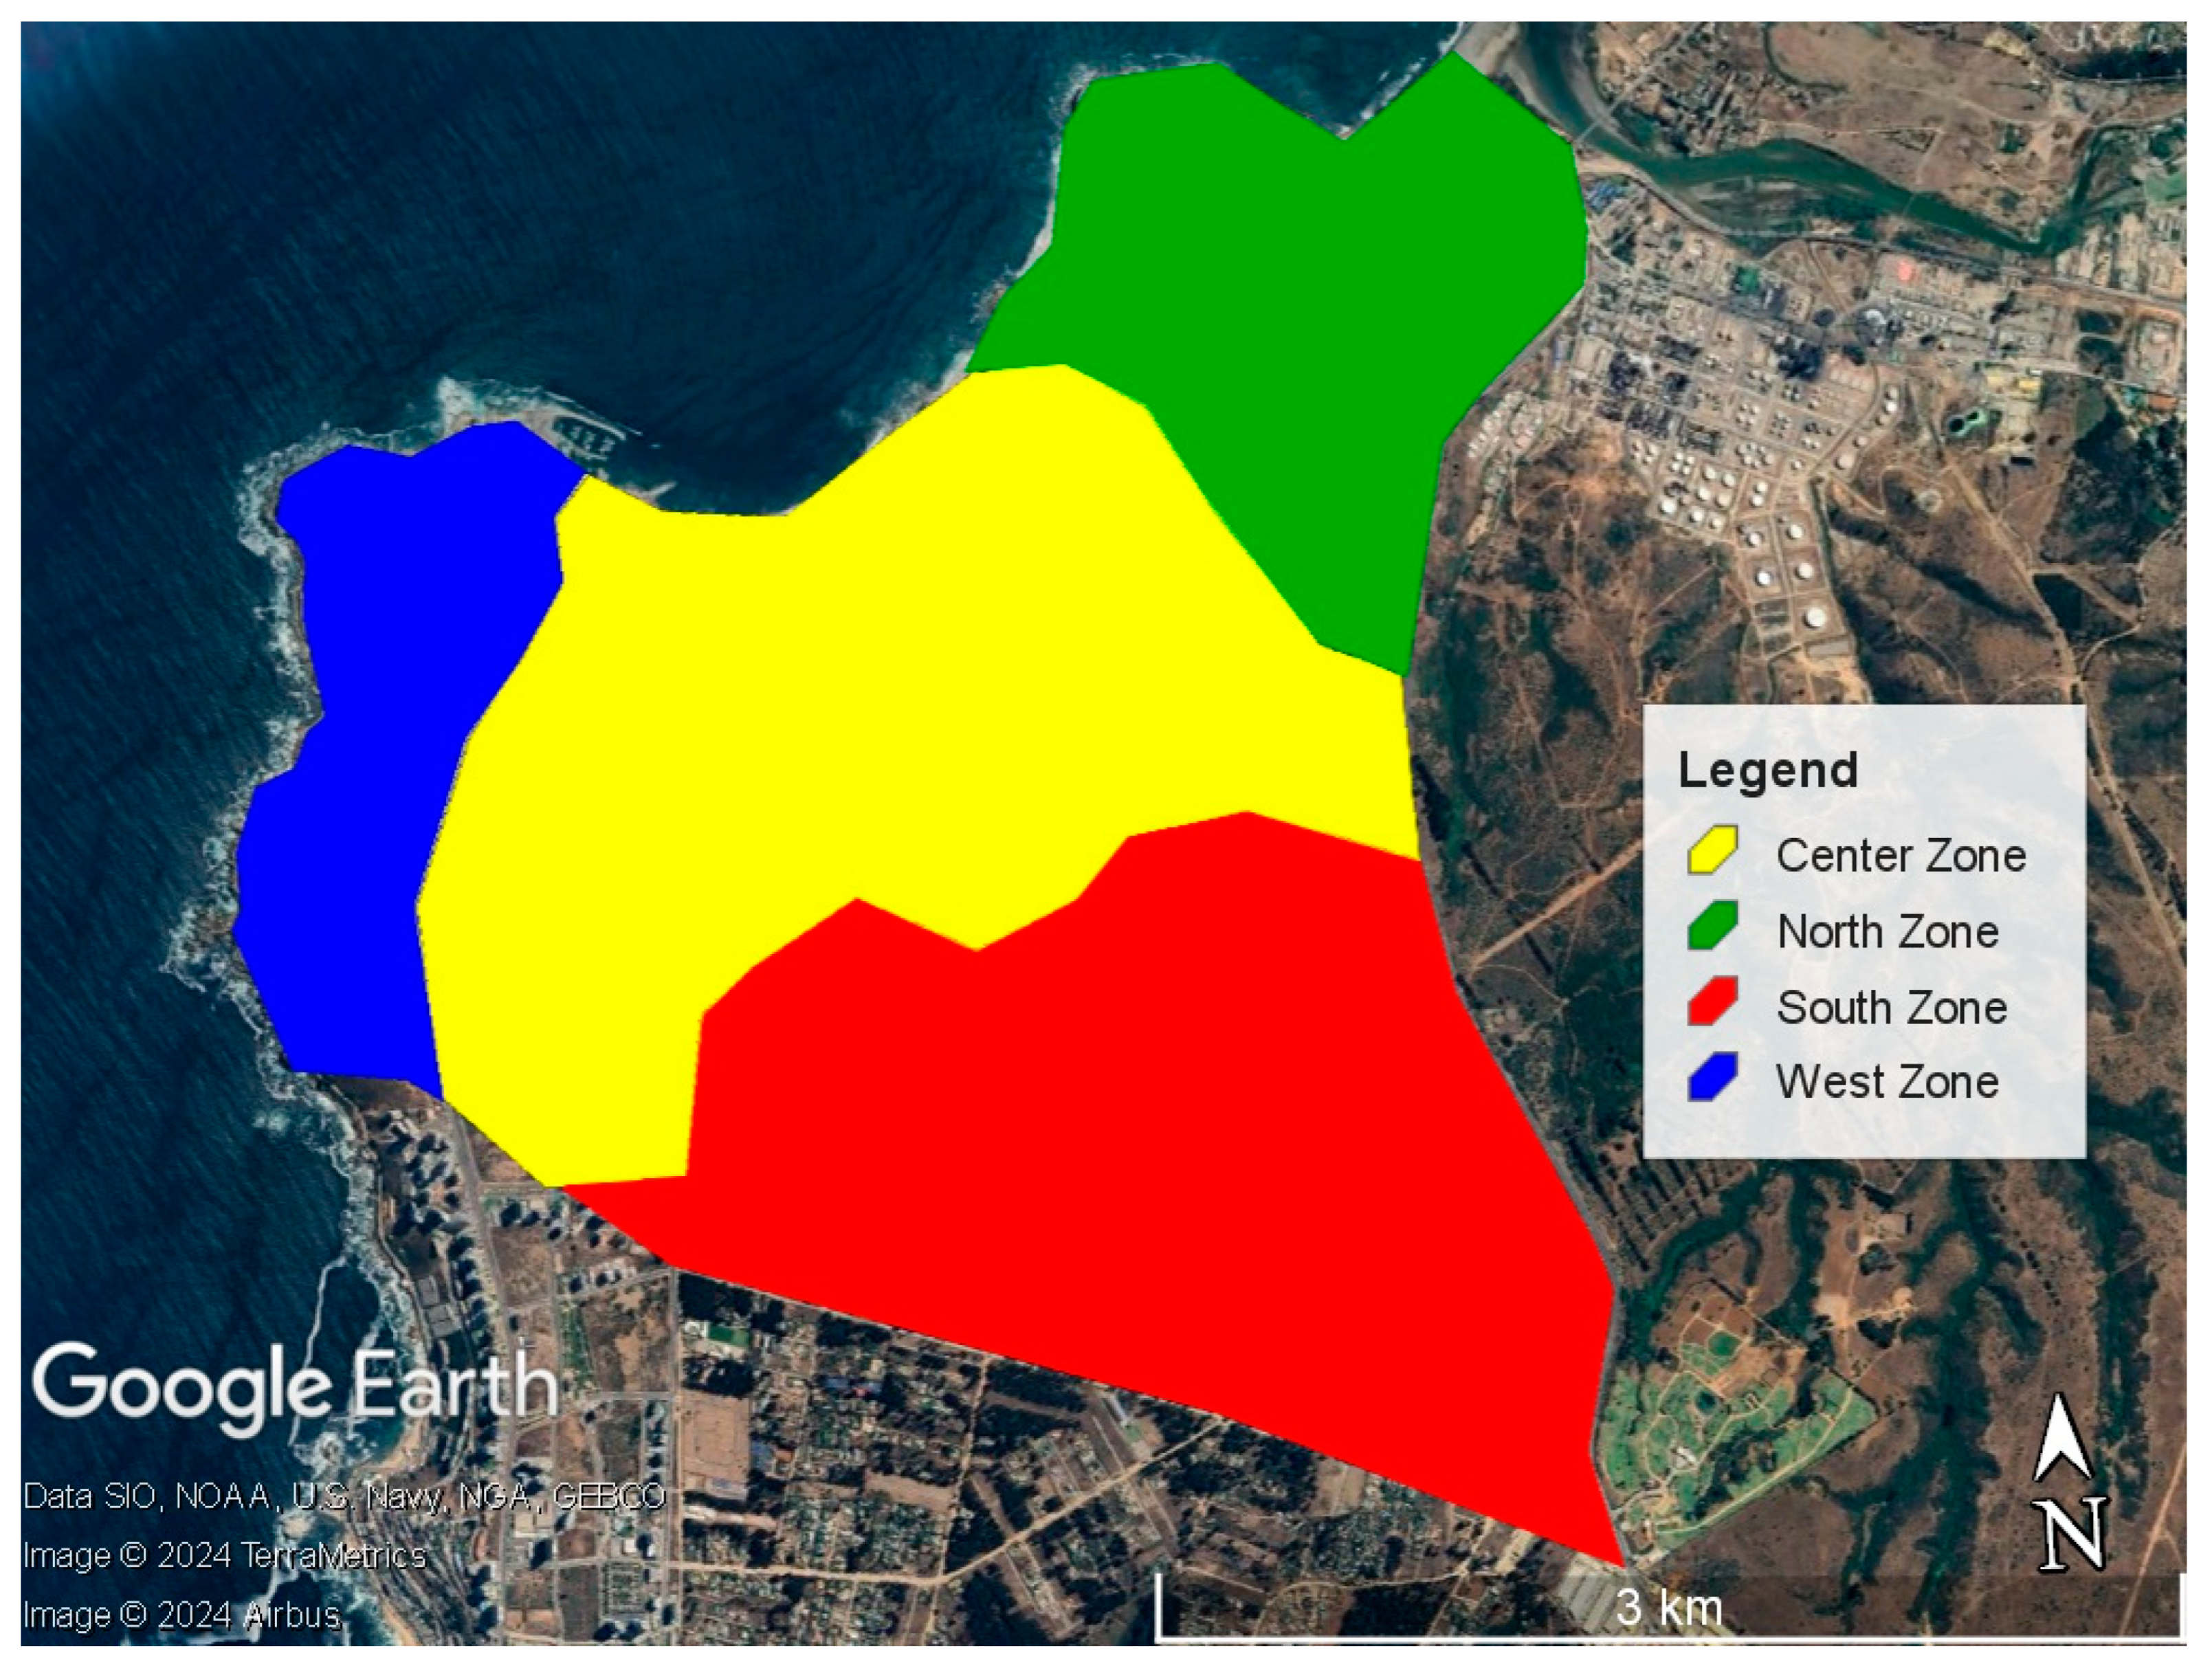
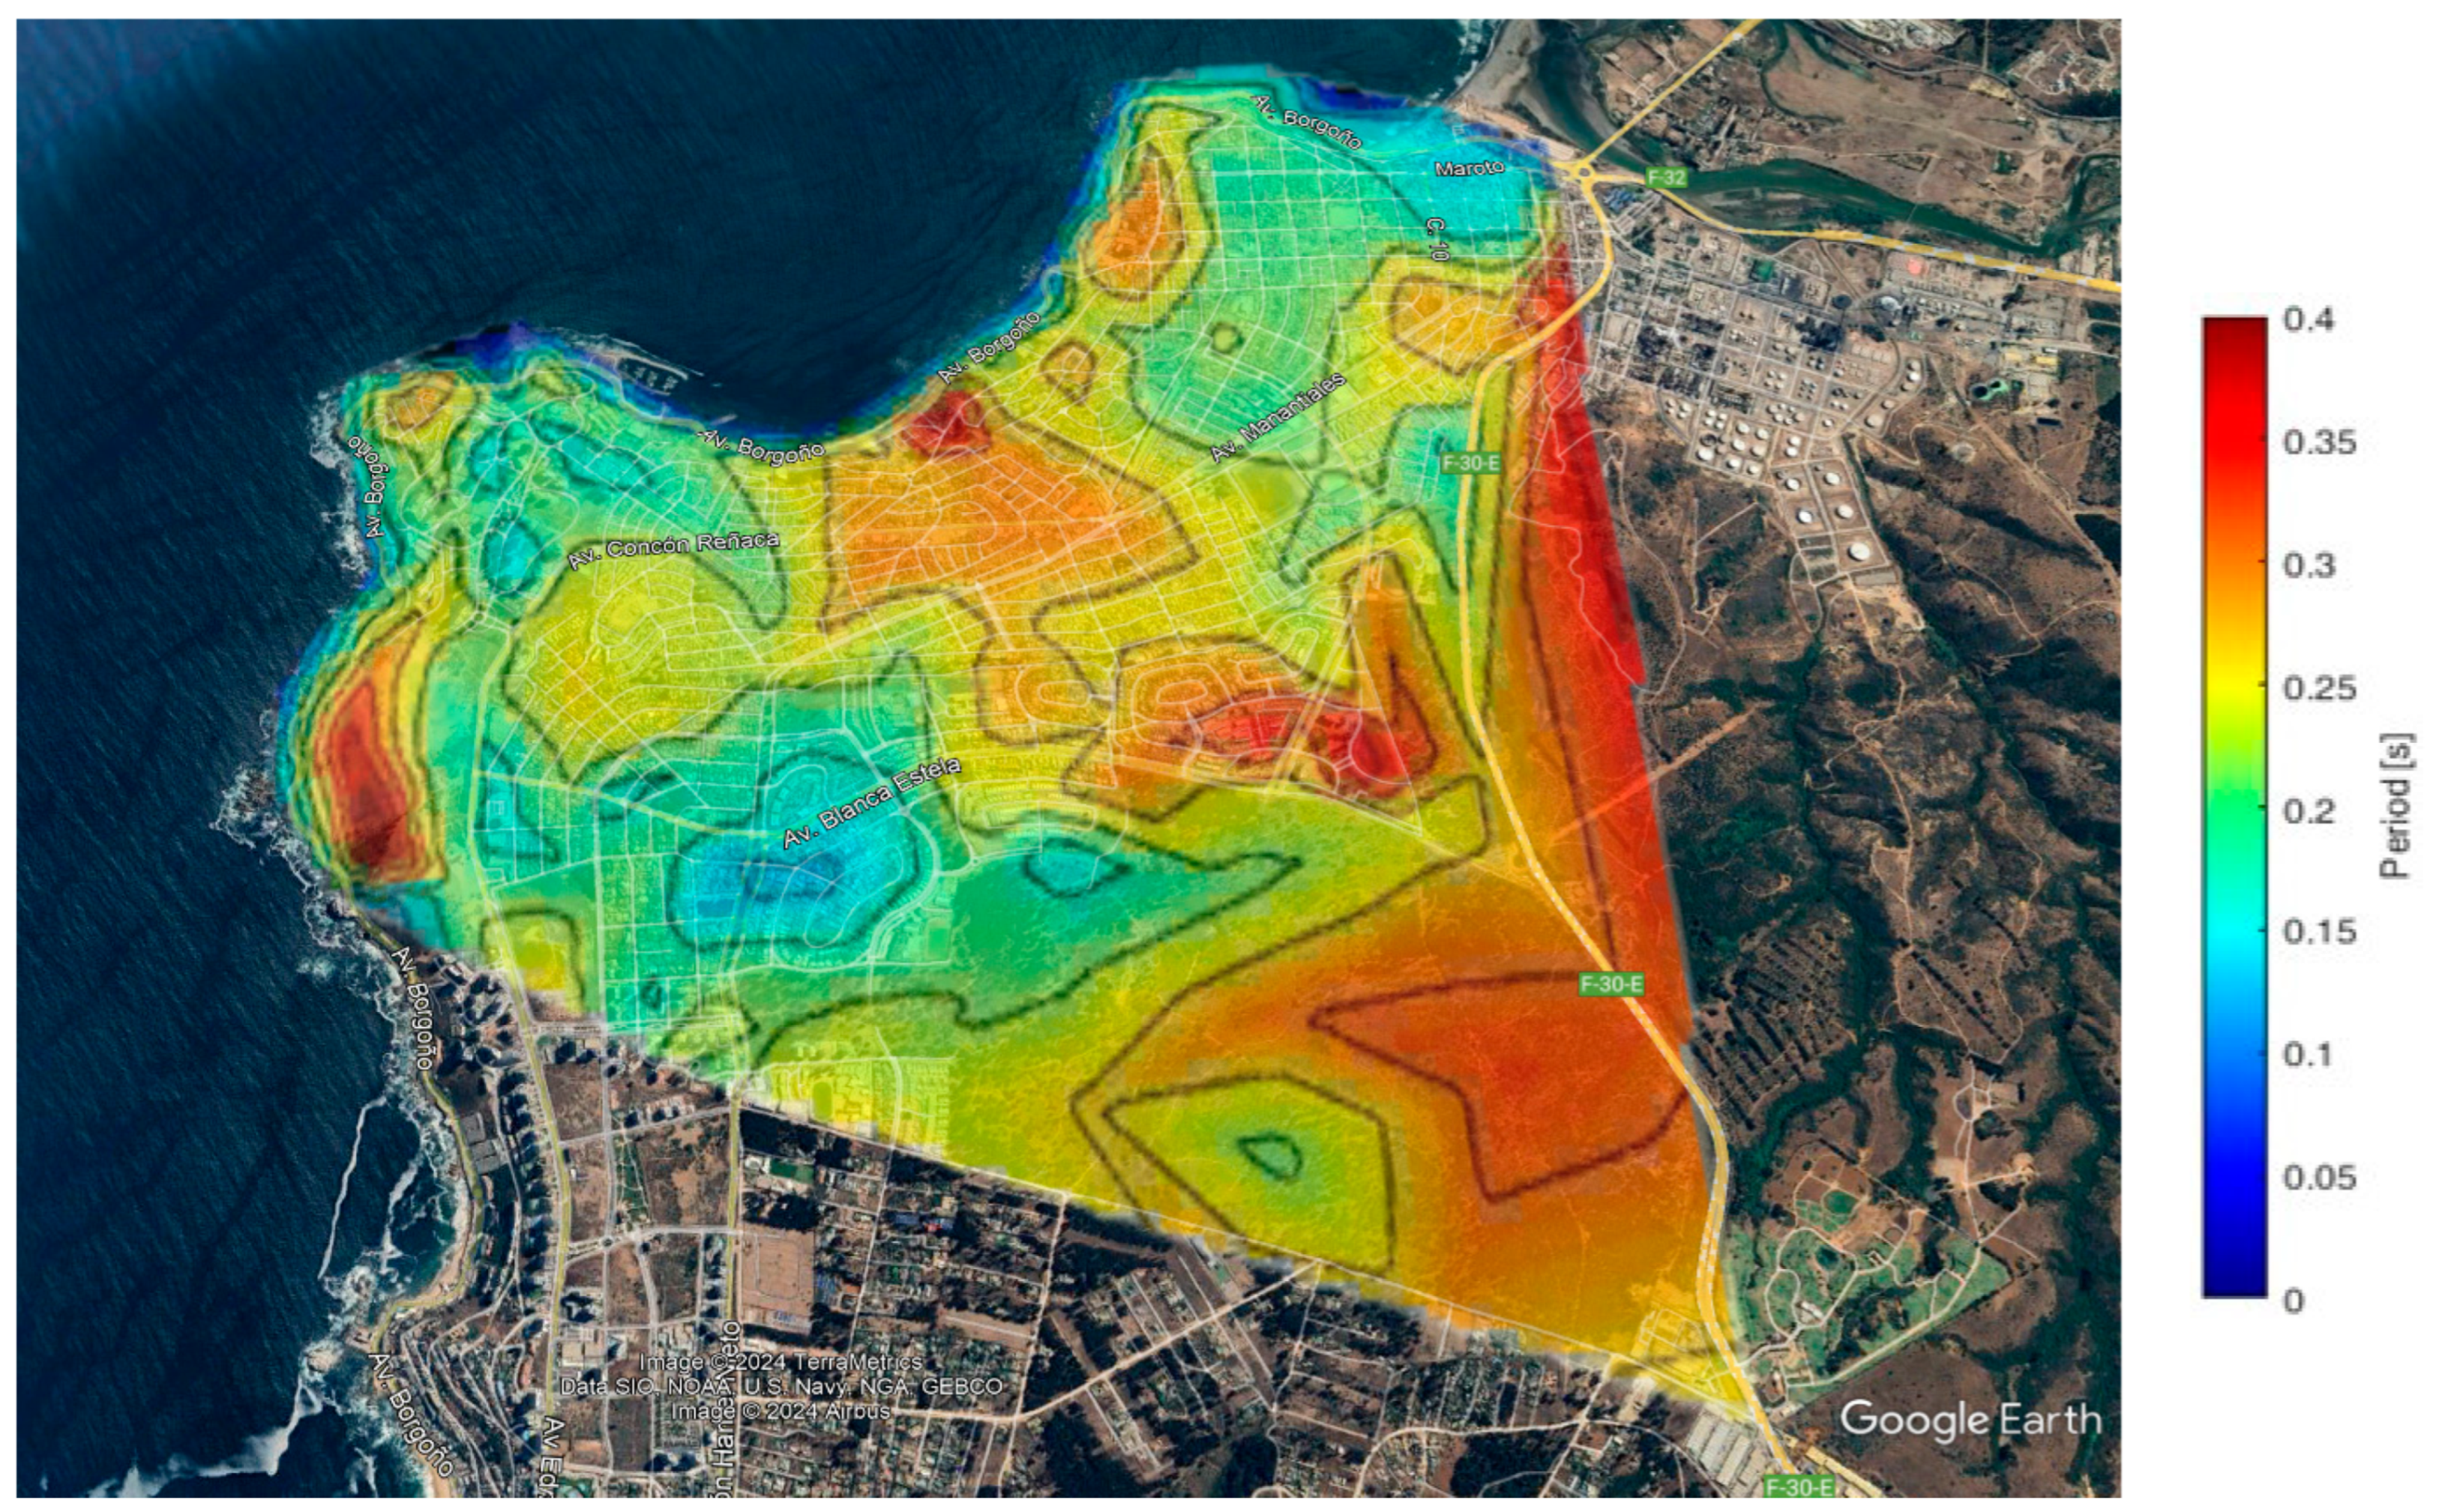
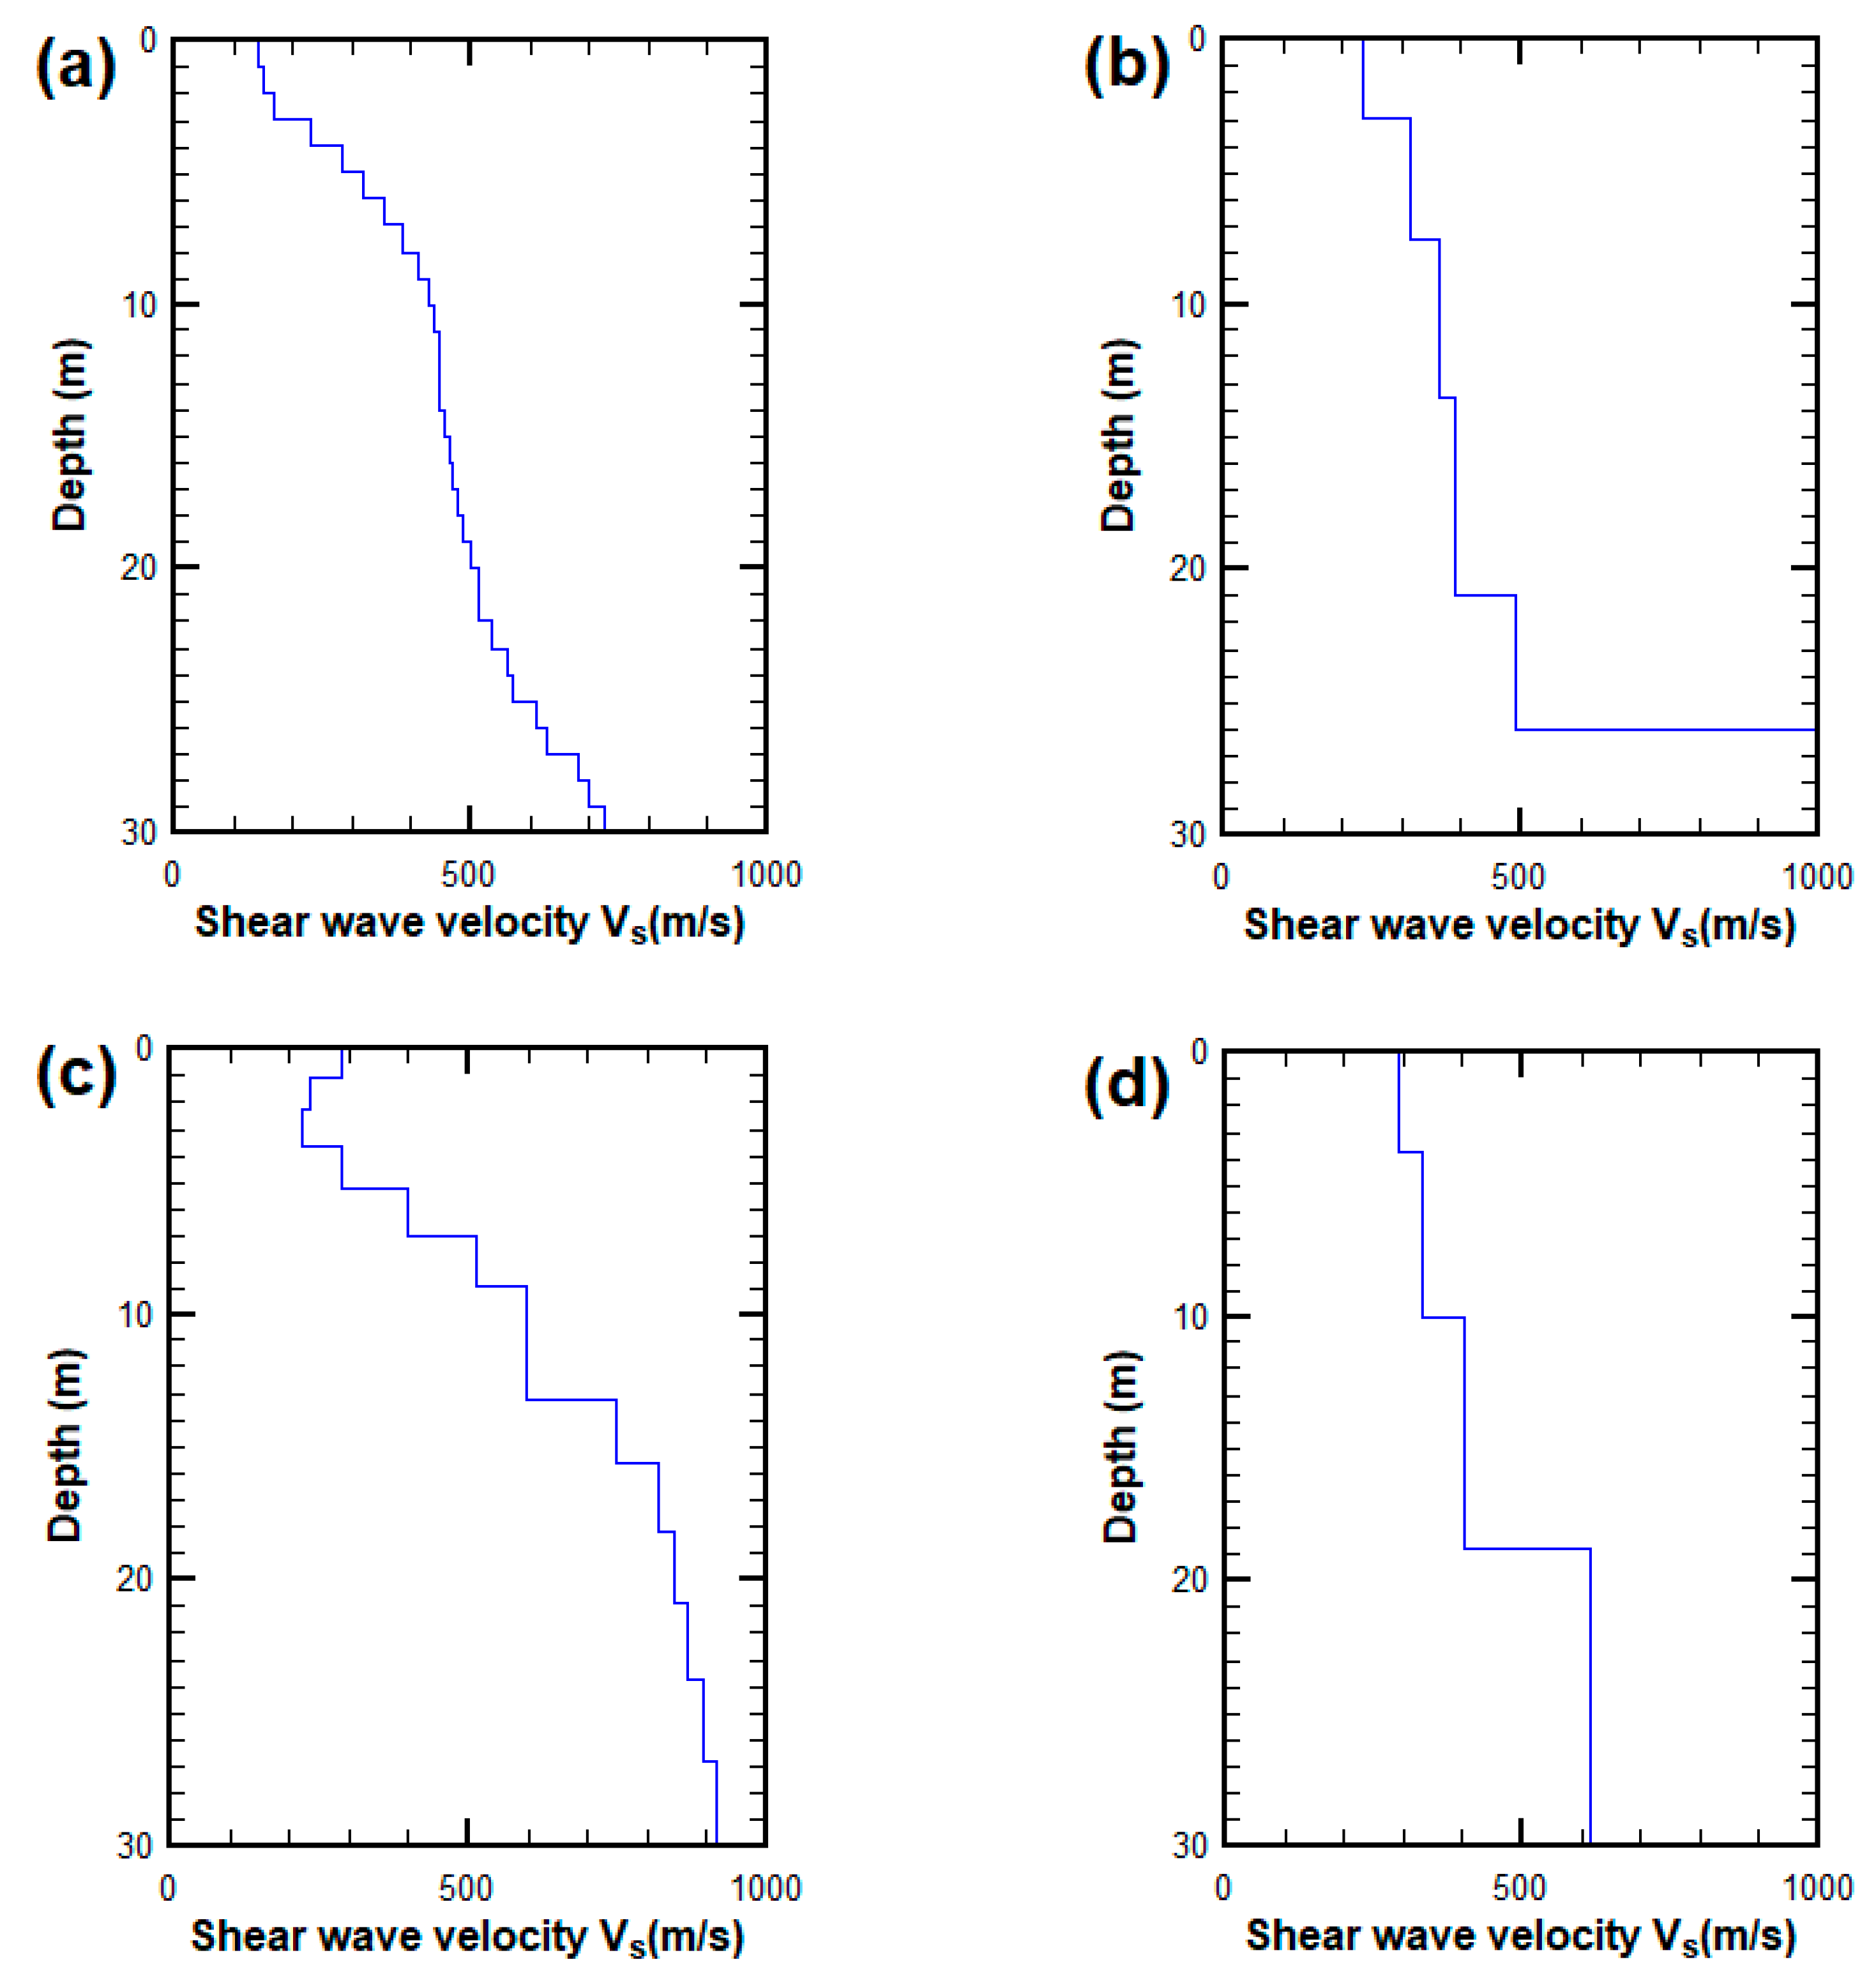
3.1. Zonation Map and Estimation of Bedrock Depth
3.2. Development of the Three-Dimensional Finite Element Model, 3D FEM
3.3. Evaluation of Regional Seismic Response
4. Discussion
5. Conclusions
- Highlighting the need for public education programs and professional training in the interpretation and application of microzonation maps to ensure that risks are adequately integrated into planning and construction.
- Concluding on how the integration of seismic microzonation into urban planning and disaster risk management can significantly improve safety and resilience in seismically active areas. This is particularly relevant, as highlighted in recent studies that emphasize the role of resilience in geotechnical engineering and urban infrastructure [54].
Author Contributions
Funding
Institutional Review Board Statement
Informed Consent Statement
Data Availability Statement
Acknowledgments
Conflicts of Interest
References
- Marino, E.M.; Nakashima, M.; Mosalam, K.M. Comparison of European and Japanese seismic design of steel building structures. Eng. Struct. 2005, 27, 827–840. [Google Scholar] [CrossRef]
- Diaz-Segura, E.G. Evolution of Seismic Site Classification According to the Criteria in Chilean Design Codes. Appl. Sci. 2021, 11, 10754. [Google Scholar] [CrossRef]
- Lai, C.G.; Bozzoni, F.; Conca, D.; Famà, A.; Özcebe, A.G.; Zuccolo, E.; Meisina, C.; Bonì, R.; Bordoni, M.; Cosentini, R.M.; et al. Technical Guidelines for the Assessment of Earthquake Induced Liquefaction Hazard at Urban Scale. Bull. Earthq. Eng. 2021, 19, 4013–4057. [Google Scholar] [CrossRef]
- Mittal, K. Seismic Microzonation: A Case Study. Civ. Eng. Res. J. 2017, 1, 555565. [Google Scholar] [CrossRef]
- Anbazhagan, P. Method for Seismic Microzonation with Geotechnical Aspects. Disaster Adv. 2013, 6, 66–85. [Google Scholar]
- Cardona, O.D.; Yamín, L.E. Seismic Microzonation and Estimation of Earthquake Loss Scenarios: Integrated Risk Mitigation Project of Bogotá, Colombia. Earthq. Spectra 1997, 13, 795–814. [Google Scholar] [CrossRef]
- Calderon, D.; Aguilar, Z.; Lazares, F.; Alarcon, S.; Quispe, S. Development of a Seismic Microzoning Map for Lima City and Callao, Peru. J. Disaster Res. 2014, 9, 939–945. [Google Scholar] [CrossRef]
- Ansal, A.; Kurtuluş, A.; Tönük, G. Seismic Microzonation and Earthquake Damage Scenarios for Urban Areas. Soil Dyn. Earthq. Eng. 2010, 30, 1319–1328. [Google Scholar] [CrossRef]
- James, N.; Sitharam, T.G.; Padmanabhan, G.; Pillai, C.S. Seismic Microzonation of a Nuclear Power Plant Site with Detailed Geotechnical, Geophysical and Site Effect Studies. Nat. Hazards 2014, 71, 419–462. [Google Scholar] [CrossRef]
- Moscatelli, M.; Albarello, D.; Scarascia Mugnozza, G.; Dolce, M. The Italian Approach to Seismic Microzonation. Bull. Earthq. Eng. 2020, 18, 5425–5440. [Google Scholar] [CrossRef]
- Lee, V.W.; Trifunac, M.D.; Bulajić, B.D.; Manić, M.I.; Herak, D.; Herak, M.; Dimov, G. Seismic Microzoning in Skopje, Macedonia. Soil Dyn. Earthq. Eng. 2017, 98, 166–182. [Google Scholar] [CrossRef]
- di Lernia, A.; Papadimitriou, A.G.; Elia, G. Approximate Decoupling of Topographic, Stratigraphic and Valley Effects on the Peak Seismic Acceleration. Soil Dyn. Earthq. Eng. 2024, 183, 108758. [Google Scholar] [CrossRef]
- Assimaki, D.; Pecker, A.; Popescu, R.; Prevost, J. Effects of spatial variability of soil properties on surface ground motion. J. Earthq. Eng. 2003, 7, 1–44. [Google Scholar] [CrossRef]
- Bour, M.; Fouissac, D.; Dominique, P.; Martin, C. On the Use of Microtremor Recordings in Seismic Microzonation. Soil Dyn. Earthq. Eng. 1998, 17, 465–474. [Google Scholar] [CrossRef]
- Lai, C.G.; Poggi, V.; Famà, A.; Zuccolo, E.; Bozzoni, F.; Meisina, C.; Bonì, R.; Martelli, L.; Massa, M.; Mascandola, C.; et al. An Inter-Disciplinary and Multi-Scale Approach to Assess the Spatial Variability of Ground Motion for Seismic Microzonation: The Case Study of Cavezzo Municipality in Northern Italy. Eng. Geol. 2020, 274, 105722. [Google Scholar] [CrossRef]
- Mohanty, W.K.; Walling, M.Y.; Nath, S.K.; Pal, I. First Order Seismic Microzonation of Delhi, India Using Geographic Information System (GIS). Nat. Hazards 2007, 40, 245–260. [Google Scholar] [CrossRef]
- Régnier, J.; Bertrand, E.; Cadet, H. Repeatable Process for Seismic Microzonation Using 1-D Site-Specific Response Spectra Assessment Approaches. Application to the City of Nice, France. Eng. Geol. 2020, 270, 105569. [Google Scholar] [CrossRef]
- Salsabili, M.; Saeidi, A.; Rouleau, A.; Nastev, M. Seismic Microzonation of a Region with Complex Surficial Geology Based on Different Site Classification Approaches. Geoenvironmental Disasters 2021, 8, 27. [Google Scholar] [CrossRef]
- Molnar, S.; Assaf, J.; Sirohey, A.; Adhikari, S.R. Overview of Local Site Effects and Seismic Microzonation Mapping in Metropolitan Vancouver, British Columbia, Canada. Eng. Geol. 2020, 270, 105568. [Google Scholar] [CrossRef]
- Licata, V.; Forte, G.; d’Onofrio, A.; Santo, A.; Silvestri, F. A Multi-Level Study for the Seismic Microzonation of the Western Area of Naples (Italy). Bull. Earthq. Eng. 2019, 17, 4711–4741. [Google Scholar] [CrossRef]
- Becerra, A.; Podestá, L.; Monetta, R.; Sáez, E.; Leyton, F.; Yañez, G. Seismic Microzoning of Arica and Iquique, Chile. Nat. Hazards 2015, 79, 567–586. [Google Scholar] [CrossRef]
- Leyton, F.; Ruiz, S.; Sepúlveda, S.A.; Contreras, J.P.; Rebolledo, S.; Astroza, M. Microtremors’ HVSR and Its Correlation with Surface Geology and Damage Observed after the 2010 Maule Earthquake (Mw 8.8) at Talca and Curicó, Central Chile. Eng. Geol. 2013, 161, 26–33. [Google Scholar] [CrossRef]
- Podestá, L.; Sáez, E.; Yáñez, G.; Leyton, F. Geophysical Study and 3-D Modeling of Site Effects in Viña Del Mar, Chile. Earthq. Spectra 2019, 35, 1329–1349. [Google Scholar] [CrossRef]
- Kramer, S.L. Geotechnical Earthquake Engineering; Prentice-Hall: Upper Saddle River, NJ, USA, 1996; p. 653. [Google Scholar]
- Building Research Institute; Japan Society of Construction Engineering. Development of Earthquake Disaster Prevention in Urban Area; Building Research Center: Tokyo, Japan, 1997; p. 381. (In Japanese) [Google Scholar]
- CEN EuroCode 8; Design of Structure for Earthquake Resistance–Part 1: General Rules for Buildings; European Committee for Standardization: Bruxelles, Belgium, 2003.
- INN. NCh 433: Diseño Sísmico de Edificios; Instituto Nacional de Normalización: Santiago, Chile, 2009. [Google Scholar]
- Nakamura, Y. A Method for Dynamic Characteristics Estimation of Subsurface Using Microtremor on the Ground Surface. Q. Rep. RTRI 1989, 30, 25–33. [Google Scholar]
- Nogoshi, M.; Igarashi, T. On the Amplitude Characteristics of Microtremor (Part 2). J. Seismol. Soc. Jpn. 2nd Ser. 1971, 24, 26–40. [Google Scholar] [CrossRef]
- Bard, P.-Y.; Riepl-Thomas, J. Wave Propagation in Complex Geological Structures and Their Effects on Strong Ground Motion; WIT Press: Southampton, UK, 1999; Chapter 2; pp. 38–95. [Google Scholar]
- Grimme, K.; Álvarez, L. El suelo de fundación de Valparaíso y Viña del Mar: Geología del área Valparaíso-Viña del Mar; Instituto de Investigaciones Geológicas: Santiago, Chile, 1964; Boletín 16. [Google Scholar]
- Manriquez, H. Dunas de Concón, un Recurso Escaso y Milenario. Ciencia para la Ciudad. Available online: https://cienciaparalaciudad.cl/medioambiente/dunas-de-concon-un-recurso-escaso-y-milenario/ (accessed on 1 February 2024).
- Rivano, G.S.; Sepúlveda, H.P.; Boric, P.R.; Espiñeira, T.D. Hojas Quillota y Portillo; SERNAGEOMIN: Santiago, Chile, 1993. [Google Scholar]
- Foti, S.; Lai, C.G.; Rix, G.J.; Strobbia, C. Surface Wave Methods for Near-Surface Site Characterization; CRC Press: London, UK, 2014; pp. 1–460. [Google Scholar] [CrossRef]
- Arai, H.; Tokimatsu, K. Evaluation of Local Site Effects Based on Microtremor H/V Spectra. In Proceedings of the 2nd International Symposium on The Effects of Surface Geology on Seismic Motion, Yokohama, Japan, 1–3 December 1998. [Google Scholar]
- Lermo, J.; Chavez-Garcia, F.J. Site Effect Evaluation Using Spectral Ratios with Only One Station. Bull. Seismol. Soc. Am 1993, 83, 1574–1594. [Google Scholar] [CrossRef]
- Chávez-García, F.J.; Sánchez, L.R.; Hatzfeld, D. Topographic Site Effects and HVSR. A Comparison between Observations and Theory. Bull. Seismol. Soc. Am. 1996, 86, 1559–1573. [Google Scholar] [CrossRef]
- Matsushima, S.; Hirokawa, T.; De Martin, F.; Kawase, H.; Sánchez-Sesma, F.J. The Effect of Lateral Heterogeneity on Horizontal-to-Vertical Spectral Ratio of Microtremors Inferred from Observation and Synthetics. Bull. Seismol. Soc. Am. 2014, 104, 381–393. [Google Scholar] [CrossRef]
- Diaz-Segura, E.G. Numerical Estimation and HVSR Measurements of Characteristic Site Period of Sloping Terrains. Geotech. Lett. 2016, 6, 176–181. [Google Scholar] [CrossRef]
- SESAME. Guidelines for the Implementation of the H/V Spectral Ratio Technique on Ambient Vibrations Measurements, Processing and Interpretation; SESAME European Research Project WP12, 2004; p. 62. Available online: https://sesame.geopsy.org/Delivrables/Del-D23-HV_User_Guidelines.pdf (accessed on 15 September 2024).
- Bard, P.Y. Microtremor Measurements: A Tool for Site Effect Estimation? Balkema: Rotterdam, The Netherlands, 1999; Volume 3, pp. 1251–1279. [Google Scholar]
- Bentley Systems. PLAXIS 3D 2024.2: 2—Reference Manual; Bentley Systems: Dublin, Ireland, 2024. [Google Scholar]
- Bentley Systems. PLAXIS 3D 2024.2: 3—Material Models; Bentley Systems: Dublin, Ireland, 2024. [Google Scholar]
- Center for Engineering Strong Motion. Available online: https://www.strongmotioncenter.org/ (accessed on 22 August 2024).
- Trifunac, M.D.; Brady, A.G. A Study on the Duration of Strong Earthquake Ground Motion. Bull. Seismol. Soc. Am. 1975, 65, 581–626. [Google Scholar]
- Lee, V.W.; Manić, M.I.; Bulajić, B.D.; Herak, D.; Herak, M.; Trifunac, M.D. Microzonation of Banja Luka for Performance-Based Earthquake-Resistant Design. Soil Dyn. Earthq. Eng. 2015, 78, 71–88. [Google Scholar] [CrossRef]
- Adhikari, S.R.; Molnar, S.; Wang, J. Seismic Microzonation Mapping of Greater Vancouver Based on Various Site Classification Metrics. Front. Earth Sci. 2023, 11, 1221234. [Google Scholar] [CrossRef]
- Moustafa, S.S.R.; Abdalzaher, M.S.; Naeem, M.; Fouda, M.M. Seismic Hazard and Site Suitability Evaluation Based on Multicriteria Decision Analysis. IEEE Access 2022, 10, 69511–69530. [Google Scholar] [CrossRef]
- Trifunac, M.D. A Microzonation Method Based on Uniform Risk Spectra. Soil Dyn. Earthq. Eng. 1990, 9, 34–43. [Google Scholar] [CrossRef]
- Caielli, G.; de Franco, R.; Di Fiore, V.; Albarello, D.; Catalano, S.; Pergalani, F.; Cavuoto, G.; Cercato, M.; Compagnoni, M.; Facciorusso, J.; et al. Extensive Surface Geophysical Prospecting for Seismic Microzonation. Bull. Earthq. Eng. 2020, 18, 5475–5502. [Google Scholar] [CrossRef]
- Shano, L.; Raghuvanshi, T.K.; Meten, M. Landslide Susceptibility Evaluation and Hazard Zonation Techniques—A Review. Geoenviron. Disasters 2020, 7, 18. [Google Scholar] [CrossRef]
- Meng, Q.; Li, Y.; Wang, W.; Chen, Y.; Wang, S. A Case Study Assessing the Liquefaction Hazards of Silt Sediments Based on the Horizontal-to-Vertical Spectral Ratio Method. J. Mar. Sci. Eng. 2023, 11, 104. [Google Scholar] [CrossRef]
- Stanko, D.; Sović, I.; Belić, N.; Markušić, S. Analysis of Local Site Effects in the Međimurje Region (North Croatia) and Its Consequences Related to Historical and Recent Earthquakes. Remote Sens. 2022, 14, 4831. [Google Scholar] [CrossRef]
- Huang, Z.; Cheng, Y.; Zhang, D.; Yan, D.; Shen, Y. Seismic Fragility and Resilience Assessment of Shallowly Buried Large-Section Underground Civil Defense Structure in Soft Soils: Framework and Application. Tunn. Undergr. Space Technol. 2024, 146, 105640. [Google Scholar] [CrossRef]


| Parameter | Value | Unit |
|---|---|---|
| γunsat | 18 | [kN/m3] |
| E50ref | 17,000 | [kN/m2] |
| EOEDref | 17,000 | [kN/m2] |
| EURref | 150,000 | [kN/m2] |
| υ | 0.35 | - |
| Power (m) | 0.5 | - |
| G0ref | 350,000 | [kN/m2] |
| γ0.7 | 0.000169 | - |
| c’ref | 4 | [kN/m2] |
| f | 36 | [°] |
| y | 0 | [°] |
| k0 | 0.4122 | - |
| Rayleigh α | 0.3427 | - |
| Rayleigh β | 0.000868 | - |
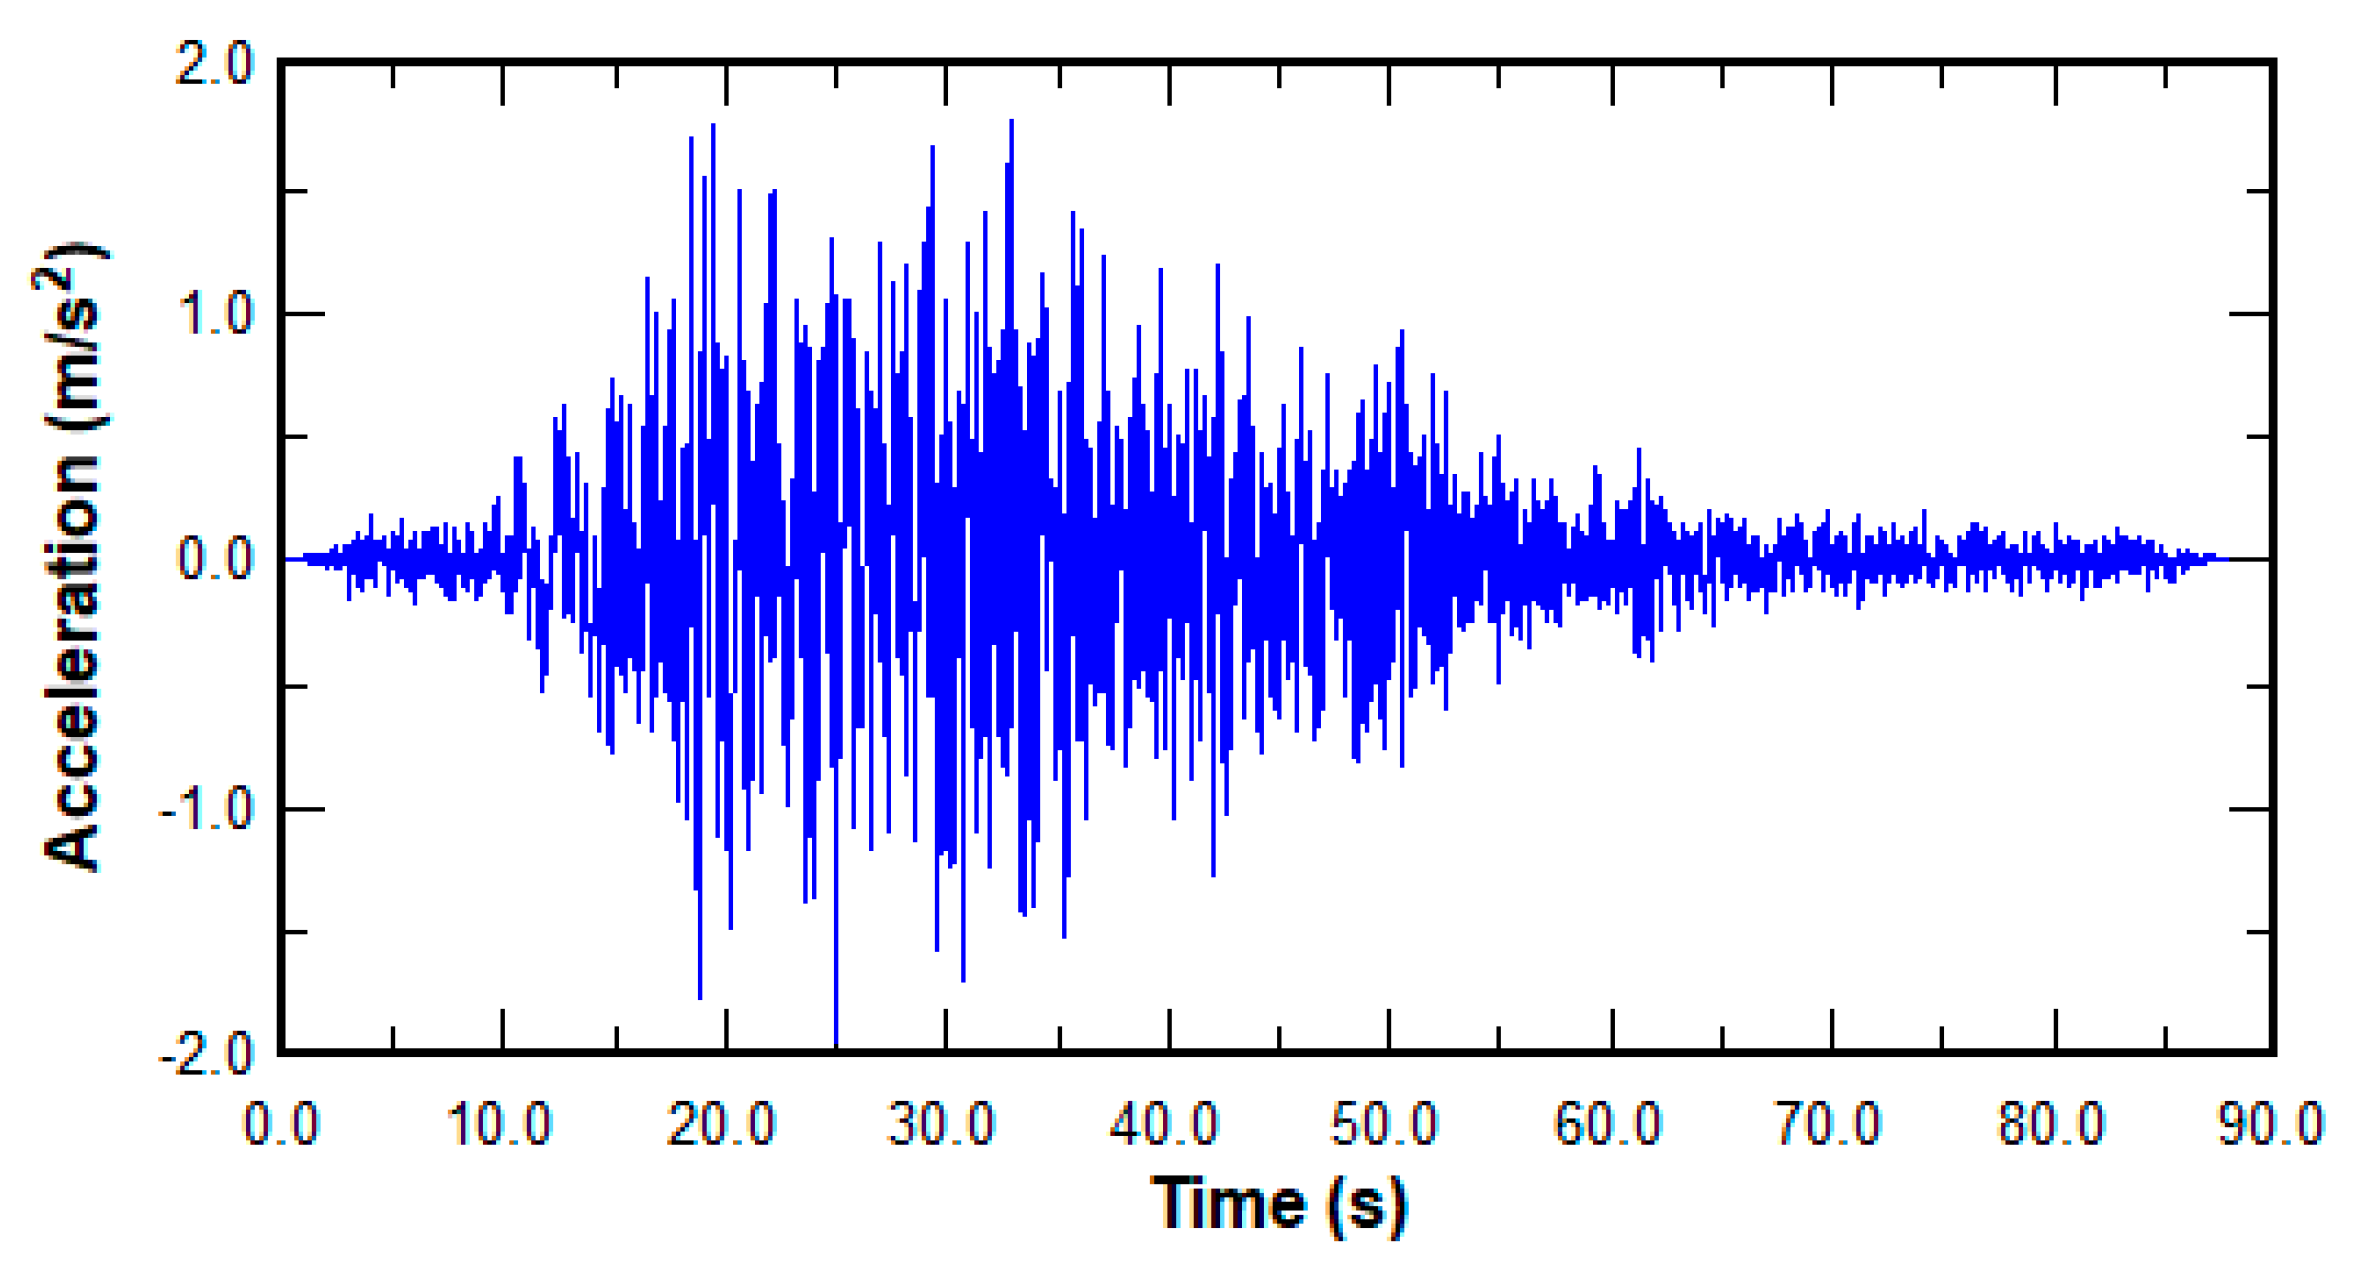
| Rapel Seismic Station (Outcropping) | PGA [g] | PGV [cm/s] | PGD [cm] | D5-95 [s] | Latitude [°] | Longitude [°] |
|---|---|---|---|---|---|---|
| Component NS Mw. 8.8 (27 February 2010) | 0.2 | 31.5 | 16.1 | 34 | 34.03 S | 71.58 |
Disclaimer/Publisher’s Note: The statements, opinions and data contained in all publications are solely those of the individual author(s) and contributor(s) and not of MDPI and/or the editor(s). MDPI and/or the editor(s) disclaim responsibility for any injury to people or property resulting from any ideas, methods, instructions or products referred to in the content. |
© 2024 by the authors. Licensee MDPI, Basel, Switzerland. This article is an open access article distributed under the terms and conditions of the Creative Commons Attribution (CC BY) license (https://creativecommons.org/licenses/by/4.0/).
Share and Cite
Diaz-Segura, E.G.; Vielma, J.C.; Oviedo-Veas, J.E. Microzonation Approach for Analyzing Regional Seismic Response: A Case Study of the Dune Deposit in Concón, Chile. Appl. Sci. 2024, 14, 8458. https://doi.org/10.3390/app14188458
Diaz-Segura EG, Vielma JC, Oviedo-Veas JE. Microzonation Approach for Analyzing Regional Seismic Response: A Case Study of the Dune Deposit in Concón, Chile. Applied Sciences. 2024; 14(18):8458. https://doi.org/10.3390/app14188458
Chicago/Turabian StyleDiaz-Segura, Edgar Giovanny, Juan Carlos Vielma, and Jorge Eduardo Oviedo-Veas. 2024. "Microzonation Approach for Analyzing Regional Seismic Response: A Case Study of the Dune Deposit in Concón, Chile" Applied Sciences 14, no. 18: 8458. https://doi.org/10.3390/app14188458