Article

Numerical and Experimental Analysis of SNCR Installation Performance in a Power Stoker Boiler

by
Piotr Krawczyk
,
Michalina Kurkus-Gruszecka
and
Aleksandra Dzido
*
Faculty of Power and Aeronautical Engineering, Institute of Heat Engineering, Warsaw University of Technology, Nowowiejska 21/25, 00-665 Warsaw, Poland
*
Author to whom correspondence should be addressed.
Appl. Sci. 2024, 14(18), 8508; https://doi.org/10.3390/app14188508
Submission received: 30 August 2024 / Revised: 16 September 2024 / Accepted: 19 September 2024 / Published: 21 September 2024
(This article belongs to the Special Issue Multiscale Modeling of Complex Fluids and Soft Matter)

Abstract

:
The correct design of effective SNCR (Selective Non-Catalytic Reduction) requires solving several technological challenges. For this purpose, CFD modeling and bench tests were used. This study investigated various parameters affecting the NOx reduction rate in a WR-25 stoker boiler. The first parameter analyzed was the NSR (normalized stoichiometric ratio), with a constant urea concentration of 12.5% in the solution injected into the boiler. CFD modeling indicated that increasing the NSR significantly enhances reduction efficiency, especially between NSR 1 and 2, where the efficiency more than doubles. Bench tests confirmed this trend across all boiler power levels, showing deeper reagent penetration in the chamber at higher NSR levels. However, further doubling of NSR did not yield significant efficiency improvements, likely due to limitations in chemical mixing under reagent excess conditions. Further, it was revealed that NOx reduction efficiency decreases as boiler power increases, probably due to reduced reagent residence time at the required thermodynamic conditions. Additionally, different nozzle tip designs were tested, with multi-hole nozzles (two-hole and three-hole), showing better NOx reduction than single-hole nozzles due to improved reagent distribution. Finally, a lower urea concentration in the reagent (12%) led to better NOx reduction compared to a 32.5% concentration, likely due to improved droplet penetration and mixing with flue gases.

1. Introduction

The effectiveness of SNCR (Selective Non-Catalytic Reduction) technology depends on various process parameters, such as the type of reagent, reaction temperature, contact time between the reagent and flue gases, chemical composition of the flue gases, and degree of mixing between the reagent and the flue gases [1,2,3].
The literature contains numerous studies presenting selected issues related to the development of SNCR technology dedicated to power boilers. For instance, publications [3,4] considered the impact of modifying the reagent used in the system with chemical additives on increasing the efficiency of the process in a biomass boiler. In [5], the possibilities of optimizing the SNCR process in a grate-fired boiler dedicated to burning challenging fuels, such as sewage sludge and waste, were analyzed. Meanwhile, in [6], the authors conducted several studies related to a coal-fired grate boiler. However, most available studies present the results of computational and simulation analyses. Data from field tests, which provide verified knowledge about the actual performance of installations, are rarely presented.
Moreover, the wide variety of sizes and designs of combustion chambers (even within a single boiler type), as well as the combustion technologies used, means that when implementing SNCR, process optimization requires a tailored approach to design. The implementation of SNCR technology in different types of boilers necessitates performing model calculations to adapt the technology to the actual geometric and operational parameters of the boilers, as well as selecting or designing nozzles and lances that ensure proper reagent distribution within the combustion chamber [7].
In light of the above information, it should be stated that the correct design of installations for reducing nitrogen oxide concentrations in flue gases requires solving several technological challenges (research problems). The most important of these include determining:
  • The method of reagent distribution, specifically the design and operational parameters of the reagent injection lances;
  • The levels at which the reagent is introduced into the boiler furnace chamber;
  • The number of installed lances and their spacing on the boiler walls;
  • The molar ratio of the reagent to the incoming NOx;
  • The concentration of the reagent solution.
The key parameters of the injection nozzles, influencing the system’s efficient operation, are as follows: the mean droplet diameter, the diameter distribution, and the injection velocity. The typical mean diameters (Sauter mean diameter, SMD [8]) are in the range of 50–150 µm [7], while the typical injection velocity is 150–200 m/s. These parameters can be ensured using two-flow nozzles (liquid and pressurized gas as an atomizing medium [8]). Such nozzles are characterized by an additional parameter: the Air to Liquid Ratio (ALR), taking values of 0.1–2 [7]. Detail parameters are highly dependent on the installation type. The set of selected parameters of installations available in the literature are summarized in Table 1.
In addition to establishing the design and operational parameters of the injection lances, one of the fundamental technological challenges in designing SNCR installations is their proper placement on the walls of the furnace chamber. In this regard, the first priority is to identify the optimal levels for reagent injection.
As an initial condition for determining the desired levels for placing injection lances, the necessity of introducing the reagent into flue gases with temperatures within the so-called temperature window is assumed. Therefore, the search for the desired locations of the injection lances largely involves identifying areas with flue gas temperatures of a specific value.
This condition must be met not only for the boiler’s nominal load but also for any other load under which the analyzed boiler operates under normal conditions. As the load changes, the flue gas temperature distribution in the boiler’s furnace chamber varies widely. For this reason, to “track” the appropriate temperature window for the non-catalytic-reduction process of NOx in the flue gases, more than one injection level is necessary.
Often, to determine the flue gas temperature distribution in the boiler’s furnace chamber, tools from the field of Computational Fluid Dynamics (CFD) are used [9,10]. In the presented work, commercial software Ansys Fluent v.14 was utilized for this purpose. The main difficulty in this approach is determining the boundary conditions for the fluid domain, particularly in grate-fired boilers, where conditions arise from processes occurring on the grate.
Table 1. SNCR installation parameters.
Installation TypeMain ParametersAim of the StudyRef.
Stoker boiler, coal, compressed urea-air injectionInjection velocity: 70 m/sInnovative injector assesment[6]
Cement industry, ammonia-based SNCR0.265 kg/s of ammonia water (concentration not given)Ammonia slip assesment[11]
16 t/h waste incineration plantGranular urea (1.5–2.2 mm), 3–6 injection points, 25 m/sInnovative injection device testing[12]
Circulating fluidized bed boiler, 140–200 MW, urea solution SNCRReagent concentration: 40%, mass flow rate: 310–330 kg/hParticle swarm optimization algorithm development to model the SNCR[13]
Circulating fluidized bed boiler, ammonia-based SNCRReduction rate: 30–75%, liquid pressure: 39.7–46.8 psi, flow rate: 0.14–0.25 gpm, air flow rate: 5.5–6.7 scfmSpraying system optimization[14]
Mathematical modeling of the reagent-injection process beyond the range of the droplet stream in a direction perpendicular to the boiler wall, from which the injection occurs, allows for determining the width of this stream. This parameter, in turn, allows for conclusions regarding the required spacing of the injection lances, which, for a given lance design, will provide the most complete coverage of the furnace chamber cross-section with the reagent.
All modeling work that leads to the installation of a given boiler is ultimately verified through field tests. The final stage of the flue gas denitrification system design process is, therefore, its tuning and calibration on the object for which it was designed.
There are numerous literature reports on the operation of SNCR installations in pulverized coal and fluidized bed boilers. Designs for SNCR installations in grate-fired boilers are primarily based on modeling these systems. This study presents unique field study results across a wide range of boiler and SNCR installation operating parameters. A technological challenge in conducting the presented research was the installation of an SNCR system capable of achieving a broad range of injection parameters in a real facility. Commercially installed systems do not have the regulatory flexibility of the research installation. The system described in this study allowed for, among other things, individual control of the injection parameters for each lance (typically, they are grouped by levels).
The goal of this work is the final verification of the correctness of the assumed design parameters of the system and the optimization of its operational parameters, including:
  • The molar ratio of the reagent to the incoming NOx;
  • The concentration of the reagent solution.
The full scope of the work mentioned above, concerning a selected grate boiler, is presented in this article. The field test results, which allow final conclusions to be drawn about the impact of selected operational parameters on the operation of the SNCR installation, are particularly valuable.

2. Methods

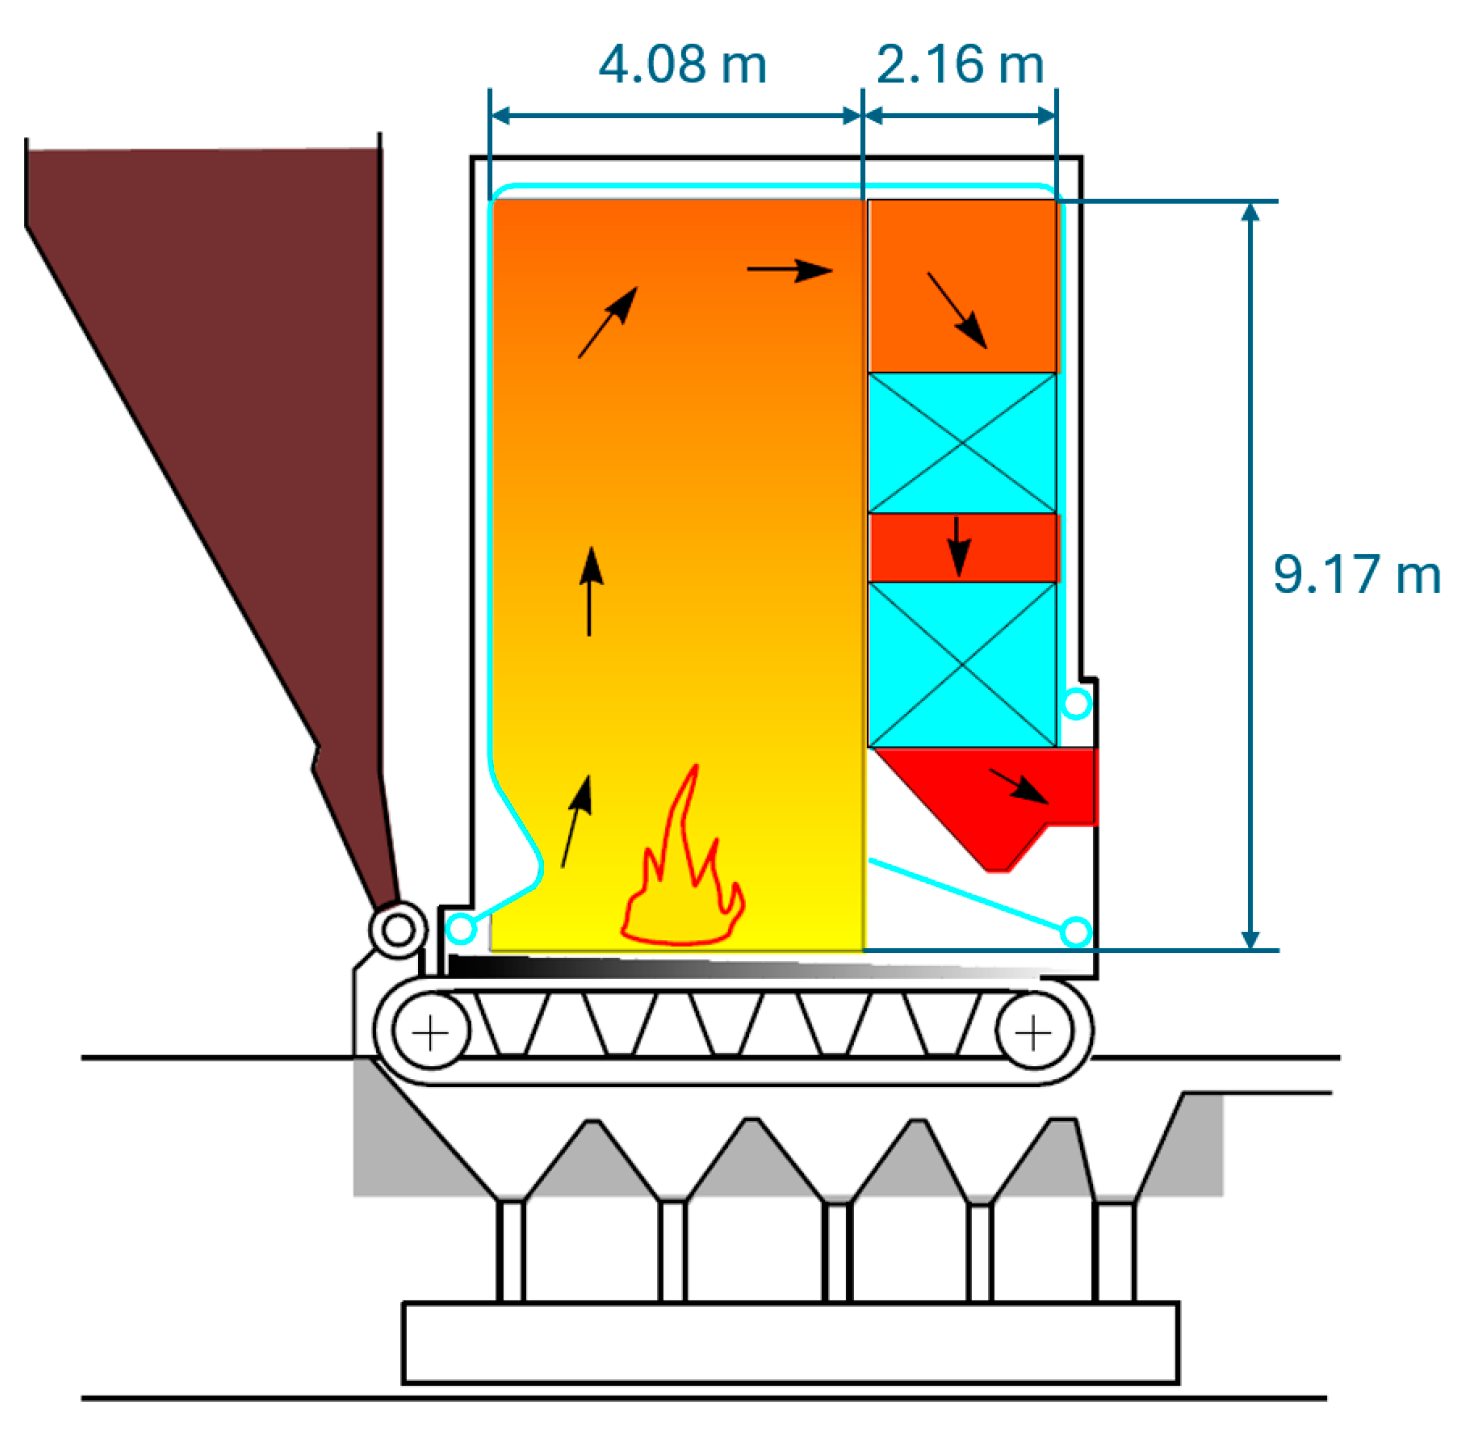
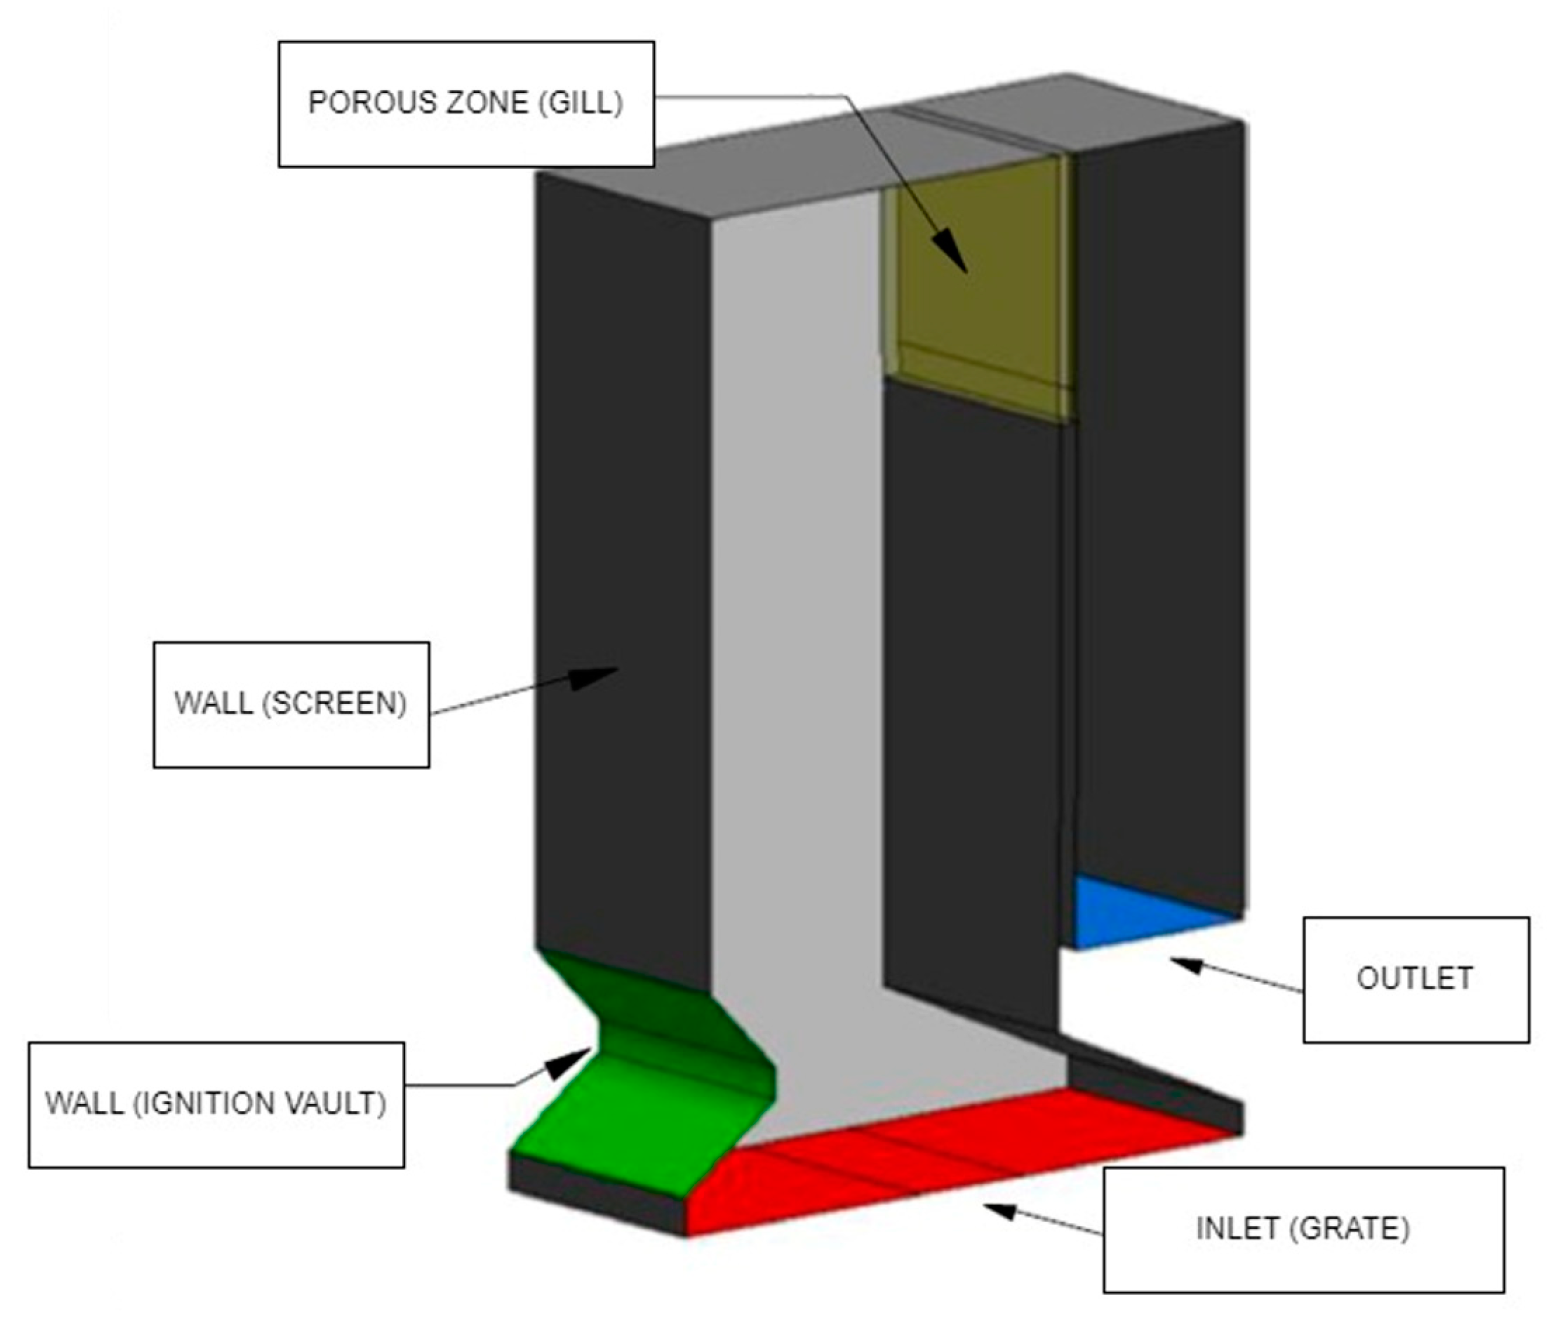
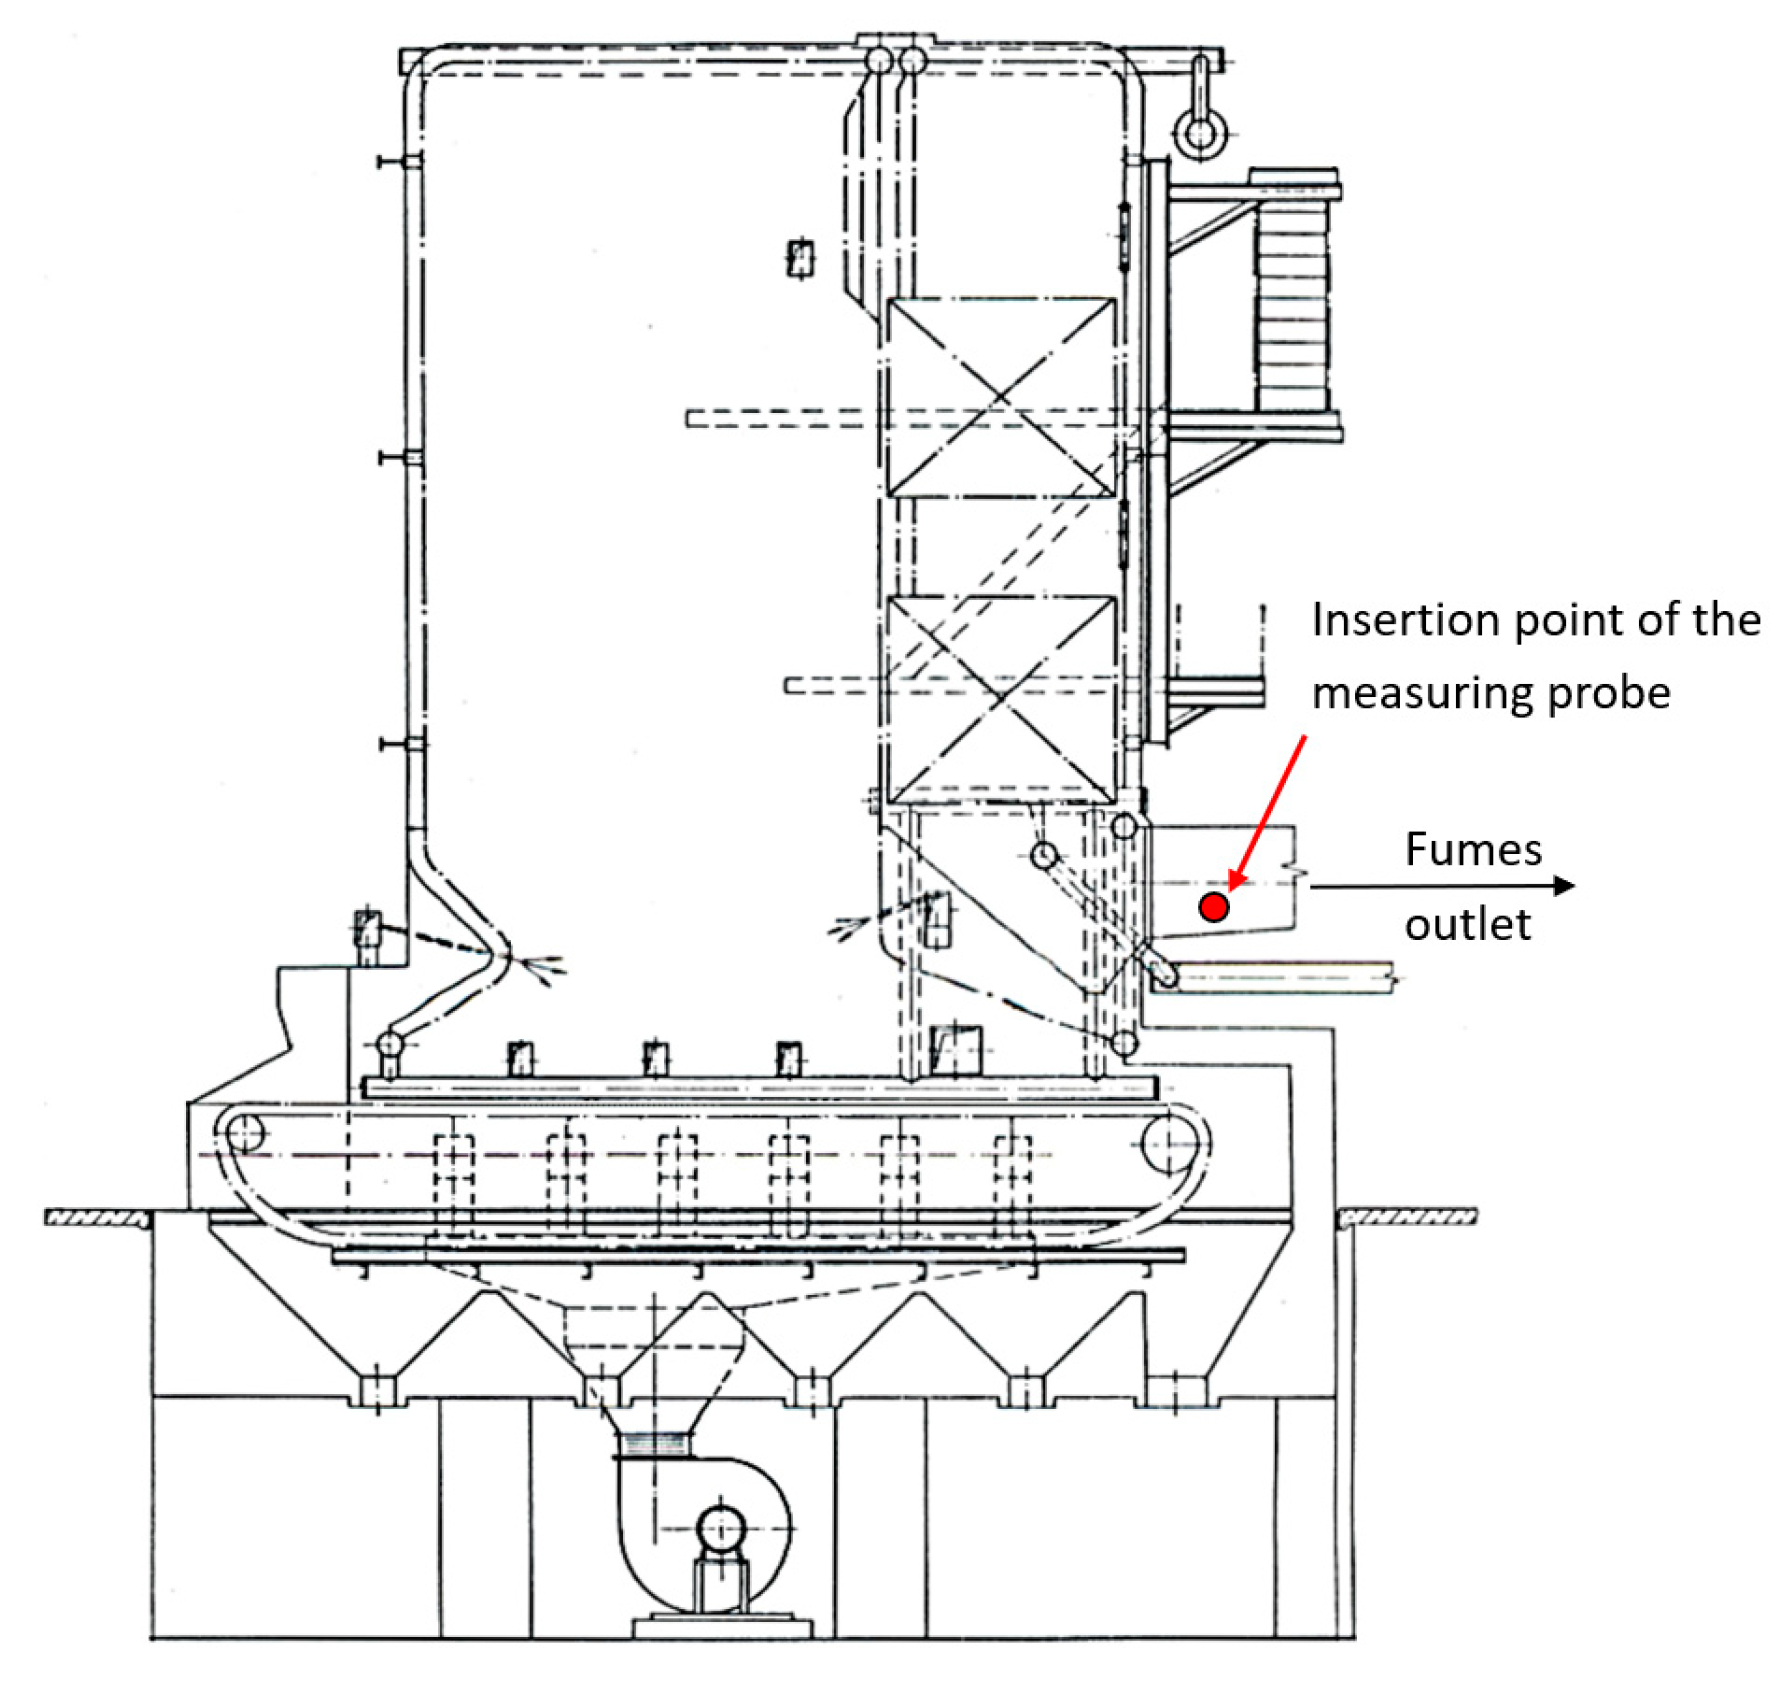
2.1. Boiler Characteristics

The WR-25 grate boiler is a type of water-tube boiler (WR) with a nominal power of 29 MW, primarily used in heating and industrial applications. The general scheme of the boiler is shown in Figure 1. These boilers are designed for burning solid fuels such as coal, biomass, and sometimes other alternative fuels. Fuel is supplied to the combustion chamber by moving grate of 6.5 m length and 2.5 m width. In this study, fuel was coal of Lover Heating Value (LHV) of 20.5 MJ/kg, and the composition is presented in Table 2. Analyzed boiler’s efficiency is 83%.

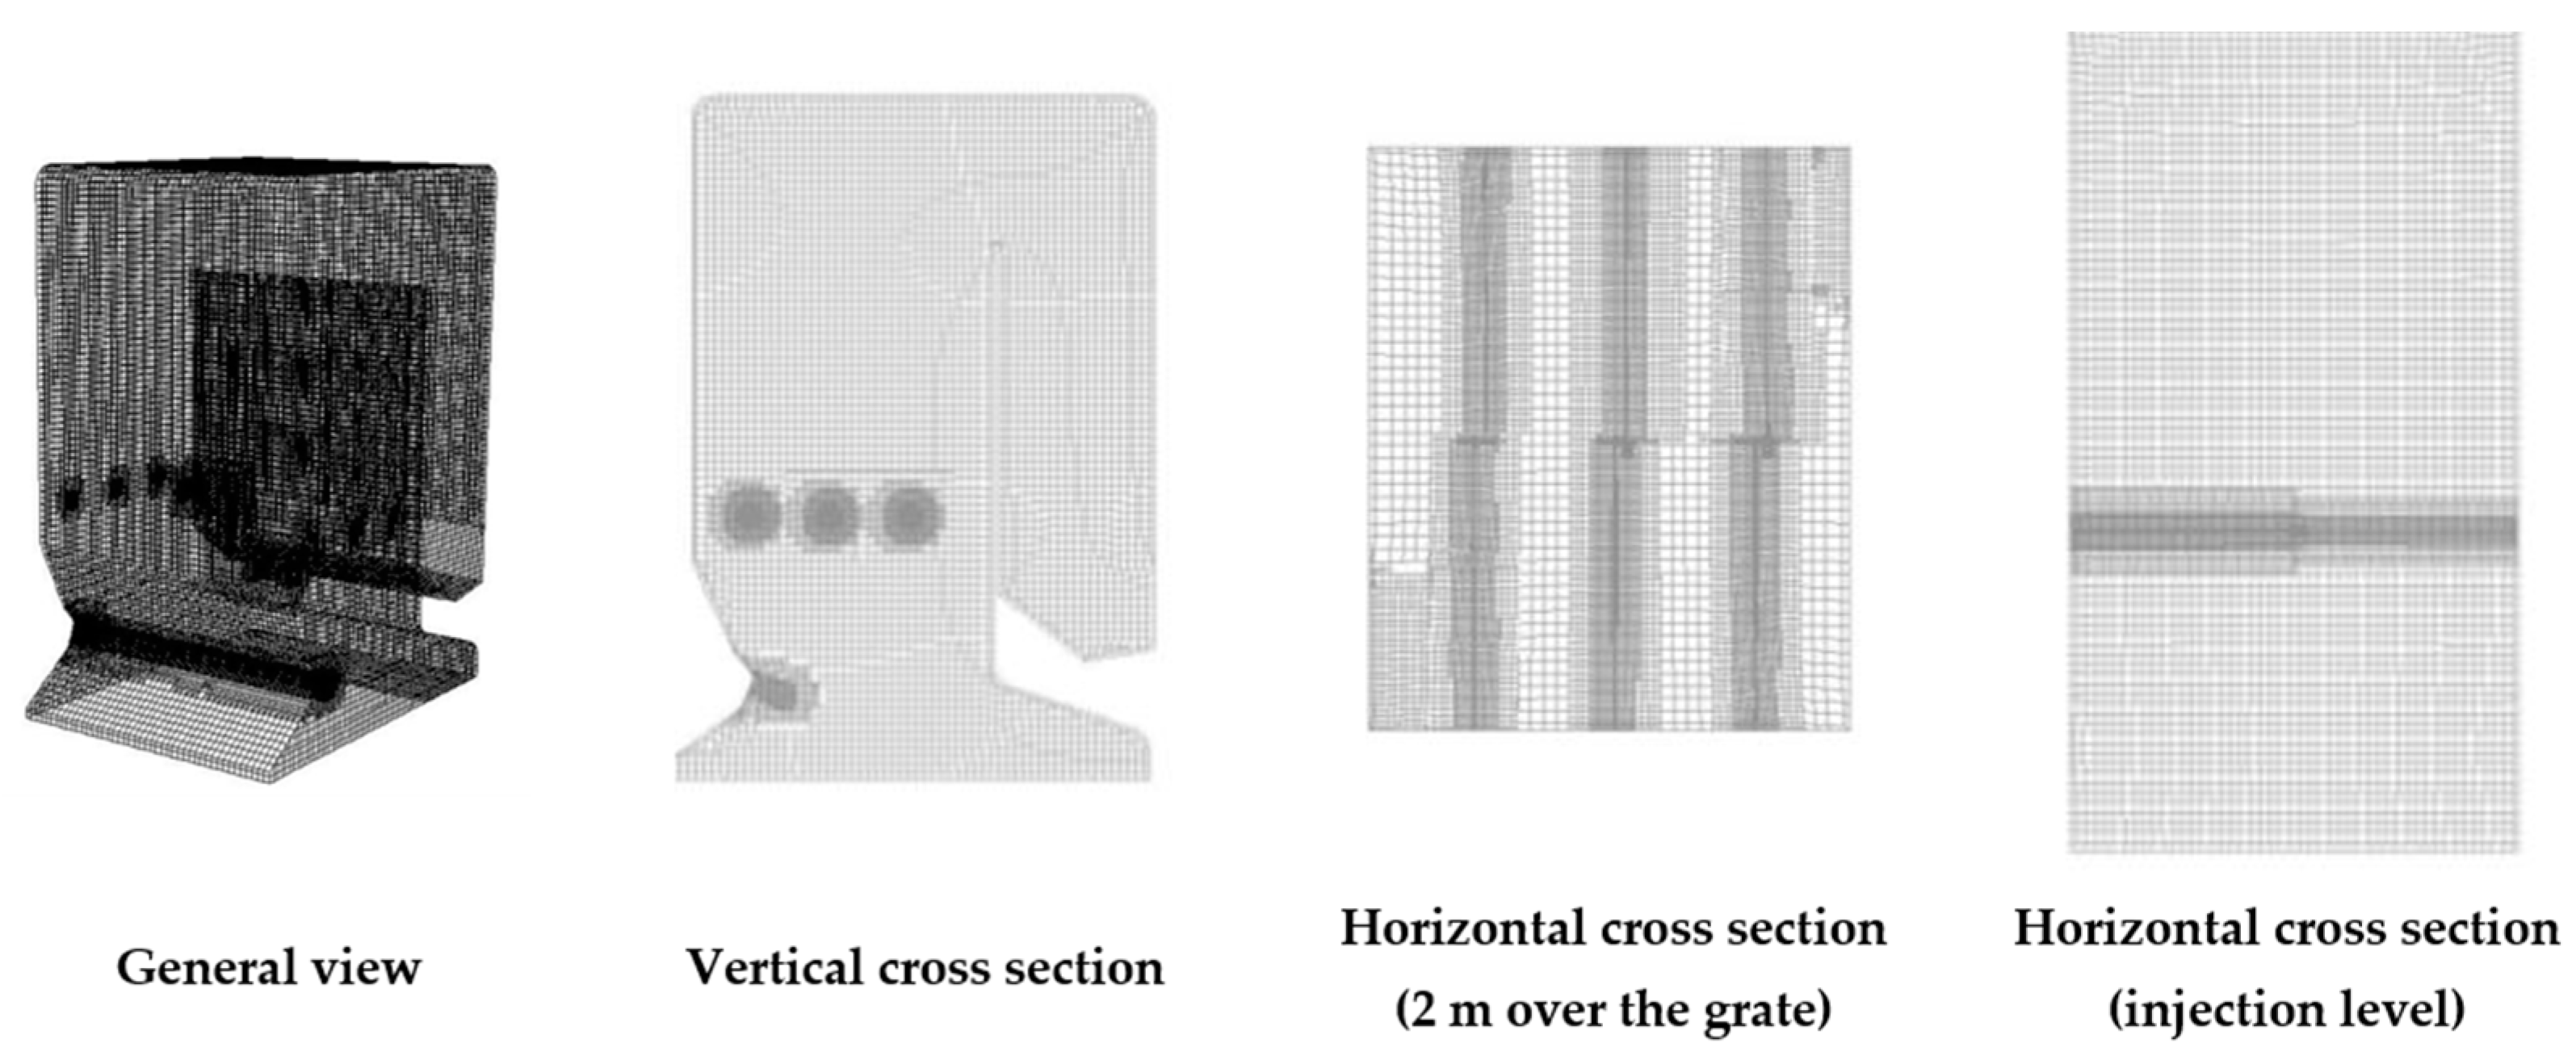
2.2. Mathematical Model

Mathematical model of the main processes occurring in WR-25 stoke boiler was built and implemented in the numerical software Ansys Fluent v.14. Models details can be found in [15]. The aim of this study was to assess the SNCR reagent behavior in real conditions. The summary of mathematical models used are shown in Table 3.
The model-implementation process covered geometry preparation, grid development, refinement, and tests, as well as boundary conditions determination. The fluid domain geometry is presented in Figure 2. Inlet was a 7-zone grate. Gil was modeled as porous zone, like in [16]. Excess air coefficient was 1.26. Main boundary conditions are presented in Table 4. Assumed values are derived from measurements taken in the boiler for 25 MW load.
Droplet diameters distribution was assumed using Rossin–Ramler function [17], with a range of 40–140 µm and mean diameter of 70 µm. Injection velocity was 200 m/s. Droplets were injected in the normal direction to the wall. The urea concentration in the solution introduced was 12%. Three mass flow rates were analyzed: 0.01213 kg/s (stoichiometric amount), 0.02426 kg/s (reagent excess ratio: 2), and 0.04832 kg/s (reagent excess ratio: 4).
Mesh tests covered 10 grids with various mesh refinement, equal in the whole domain and denser mesh in the injection zones. Due to the computational costs, grid was refined in the potential regions of high-parameter gradients:—reagent injection zones. The mesh used is presented in Figure 3.
Table 3. Mathematical model details.
Solver TypePressure-Based
Solver settingsCoupled, Pseudo Transient
Spatial Discretization SchemesGradient: Least Squares Cell-Based, Pressure: Standard; Density, Momentum, Turbulence: First Order Upwind, Species, Energy, DO: Second Order Upwind
Simulation typeSteady state
General modelsMass, heat, and momentum balance equations and energy equation
Turbulence modelRNG k-ε, Scalable Wall Functions, Differential Viscosity Model, Swirl Dominated Flow [16]
Radiation modelDiscrete Ordinates, Theta Divisions 2, Phi Divisions 2, Theta Pixels 5, Phi Pixels 5 [18]
Gas modelMixture Species: N2, O2, CO2, H2O; density: ideal gas; Cp: mixing law; thermal conductivity: ideal gas mixing law; Viscosity: Sutherland; Absorption Coefficient: WSGGM-user-specified; Scattering Coefficient: 0; Refractive Index: 1 [7,19].
Droplets modelDPM, SSD breakup model [20,21], heat transfer between droplet and flue gases, evaporation
NOx reductionUrea, 2-step decomposition, 7-step mechanism for SNCR [6]
Table 4. Boundary conditions.
Grate Zone1234567
Emitted flue gases mass flow [kg/s]0.601.794.184.181.190.000.00
Temperature [K]16201620162016201620773773
Mass fraction of O20.1870.000.0070.0220.0660.0000.000
Mass fraction of CO20.0000.1560.2570.2630.2080.0000.000
Mass fraction of H2O0.1880.1800.0300.0000.0000.0000.000
Mass fraction of NOx0.0001340.001460.0014150.0007080.0001140.0000000.000000
Overfire air mass flow [kg/s]; temperature [K]OFA1/OFA2—0.75/0.75; 300
Ignition vault temperature [K]970
Ignition vault emissivity0.9
Grate emissivity0.9
Screen temperature [K]373
Screen emissivity0.9
Developed model was verified against measurement data in the field of key parameters, i.e., temperature distribution over the combustion chamber for two selected boiler loads (15 MW and 29 MW). Temperature profile was calculated using analytical model (1 D), CFD calculations, and measured during the bench tests. As can be concluded from the obtained results (Figure 4 and Figure 5), for both analyzed loads, data correlations are fine, so the model can be treated as verified.

2.3. Bench Tests

2.3.1. Equipment Specification

Choosing the insertion levels for the ports to install injection lances later was a key moment in the research. This decision was based on the modeling results presented in [7,21]. As a result, 12 injection lances were installed symmetrically on the boiler sidewalls in the target boiler. The application ports were installed three at each of two levels, i.e., approximately 1.5 m and 4 m above the grate. The distribution scheme and application port photography are shown in Figure 6.
The work was led using the SNCR test facility, consisting of the following modules:
  • Reagent preparation unit;
  • Feed and distribution module;
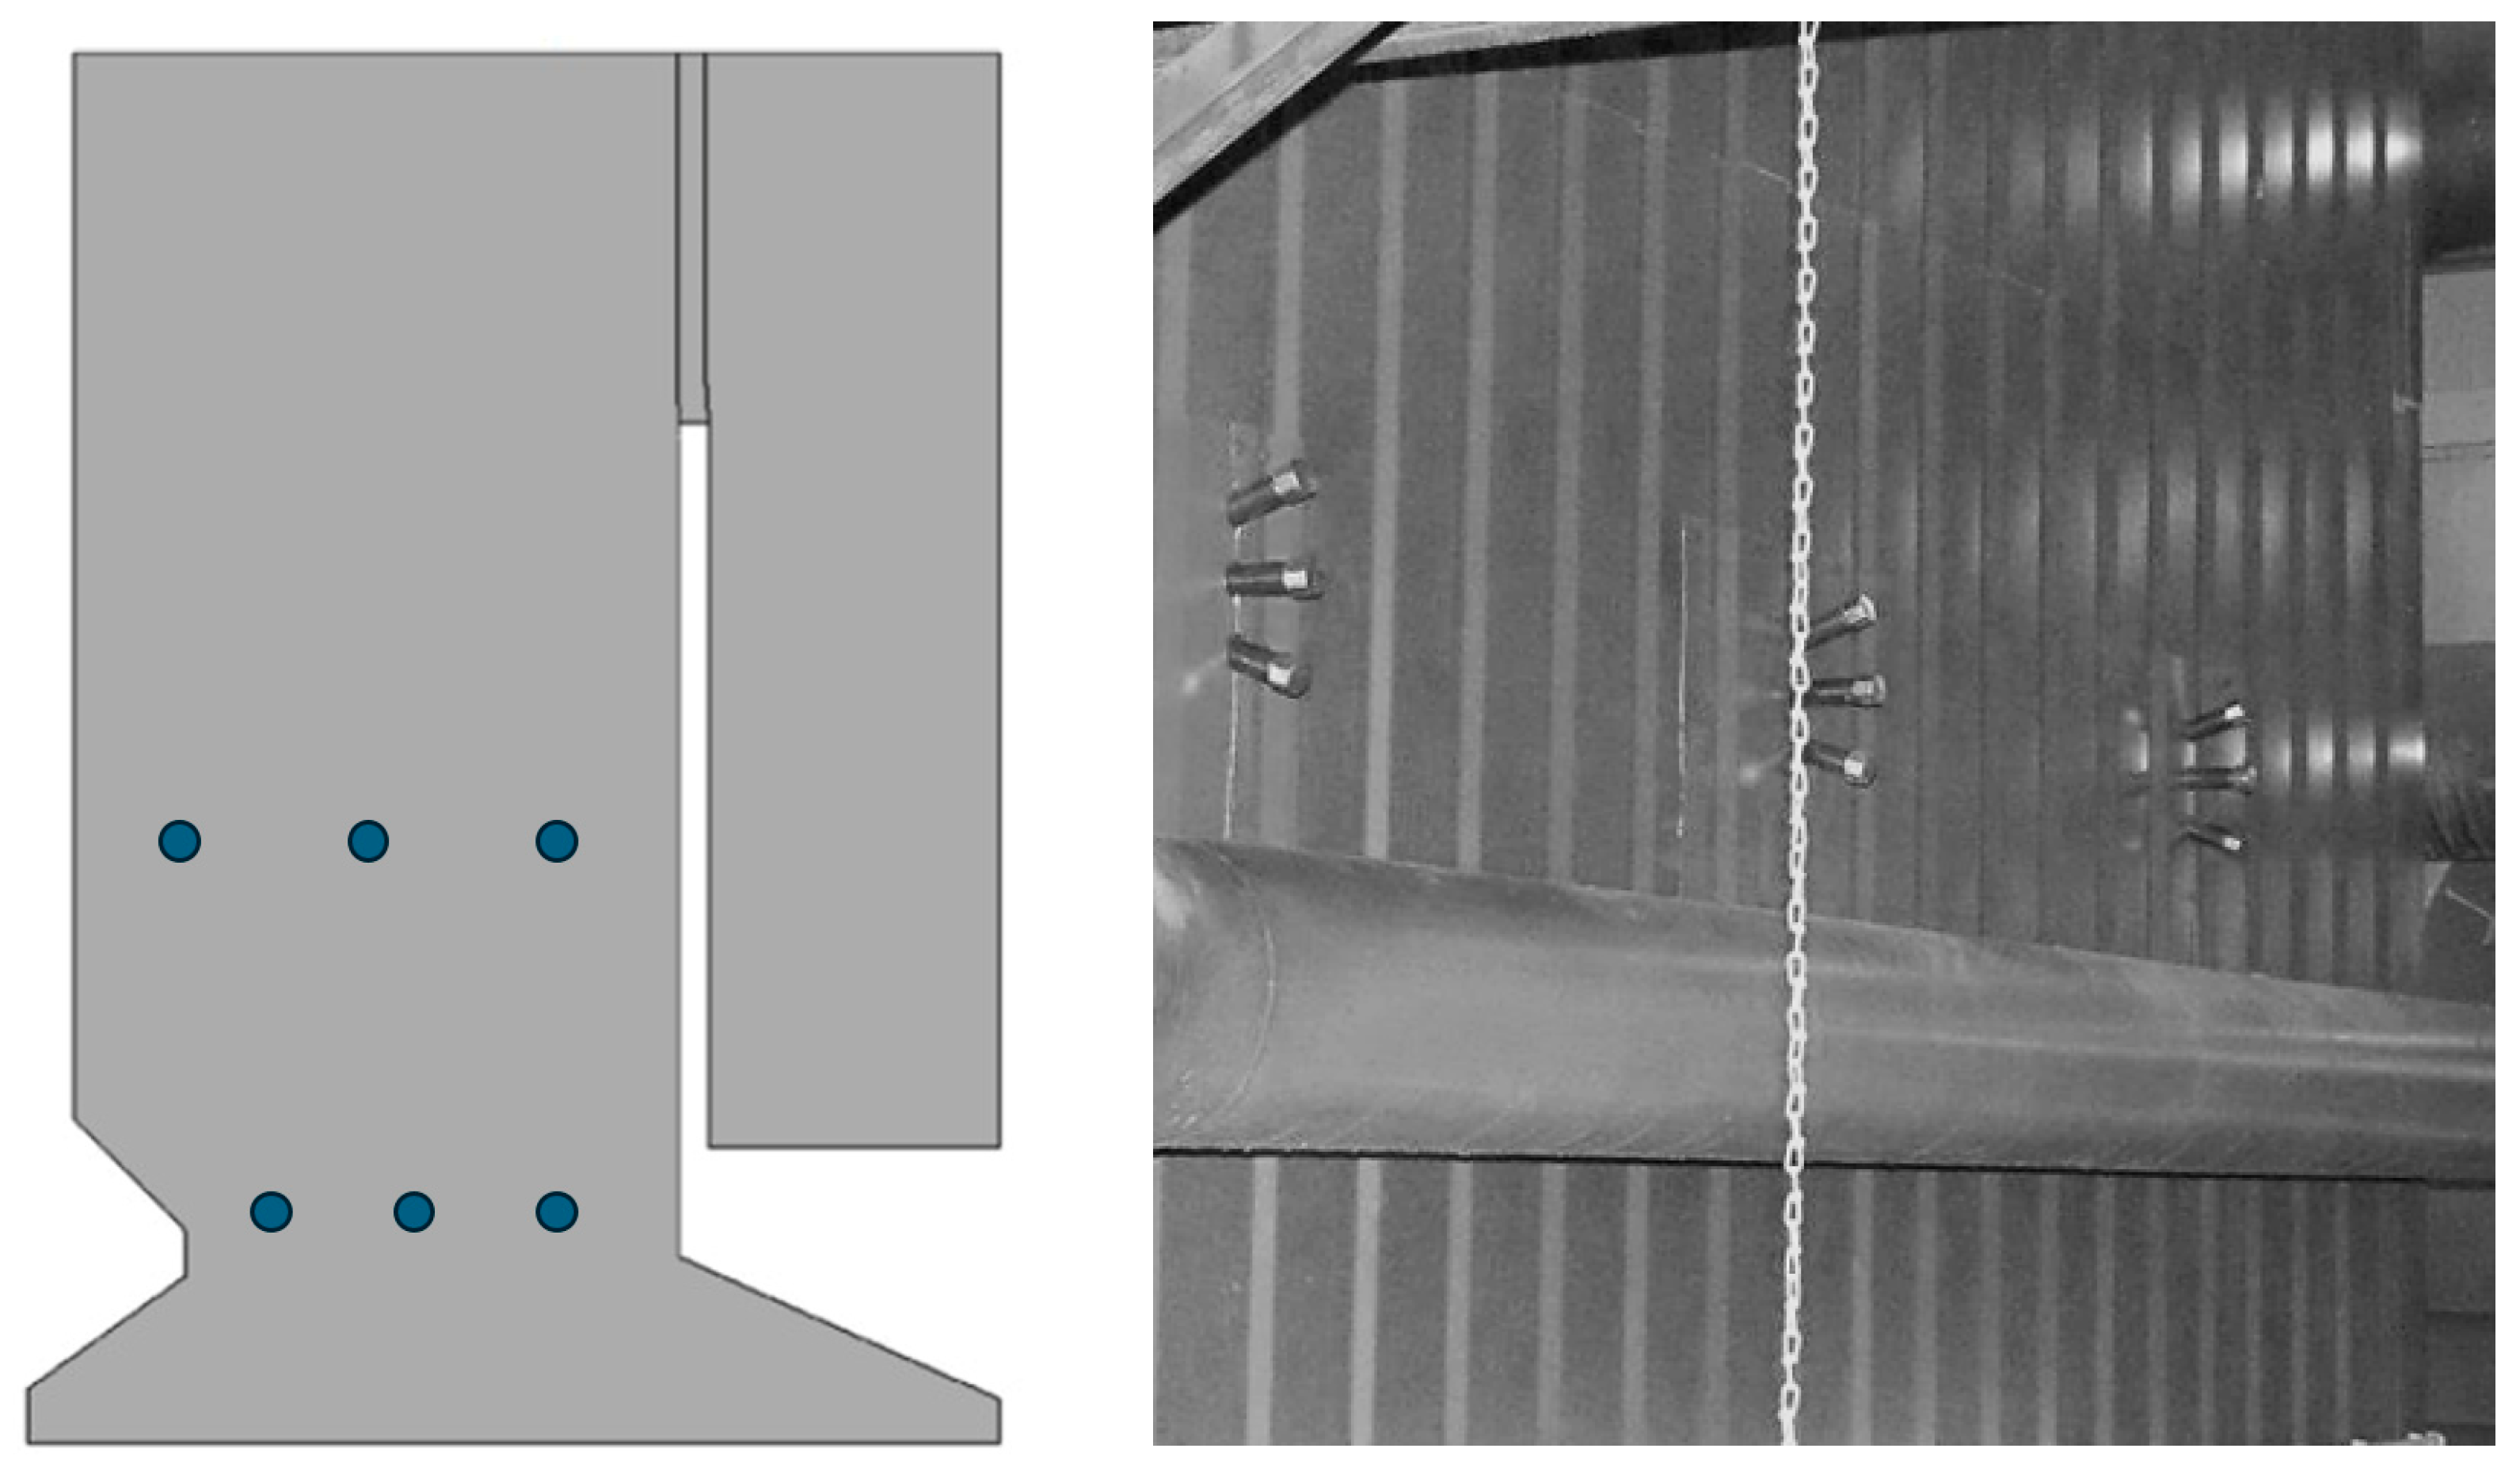
  • Injection lances.
The reagent preparation unit consisted of urea solution, demineralized water tanks, and a module to produce the reagent at the required concentration. Commercially available AdBlue® was used as the urea solution. Tests investigated the effects of solution concentrations of 32.5% and 12%.
The feed and distribution module of the test installation is shown in Figure 7. Its task was to supply selected lances with reagent and compressed air with the parameters desired by the operator. Each lance was supplied individually with urea solution, demineralized water, and compressed air.
This research utilized injection lances operating based on the two-factor atomizer principle with internal mixing. In two-factor atomizers, the energy to atomize the liquid is supplied via compressed air. This study analyzed the effect of three nozzle tip types on the nitrogen oxide reduction in the exhaust gas. One-, two-, and three-hole nozzles were tested (Figure 8). Each nozzle allowed a different shape of the reactant droplet stream to be obtained inside the boiler combustion chamber.
During the test runs, exhaust gas emissions had to be measured to assess the performance of the SNCR system. The exhaust gas components whose content was measured during each measurement series were NO, NO2, N2O, SO2, CO, CO2, H2O, and CH4. A Gasmet DX4000 analyzer (Gasmet Technologies Oy, Helsinki, Finland) was used for the measurement. This analyzer uses the FT-IR (fast Fourier transform infrared) measurement method. The insertion point for the sampling probe was the flue gas duct located downstream of all heat transfer surfaces in the boiler, upstream of the dust extraction system. The insertion point of the analyzer probe is marked on the boiler diagram shown in Figure 9.

2.3.2. Measurement Procedure

During the execution of measurements within a single measurement series, the boiler was operated at constant parameters: power, grate feed rate, fuel layer height, excess air ratio, and air partitioning under the blowdown zones. The analyzer, according to the manufacturer’s recommended procedure, was calibrated before each series of measurements at least once a day. Calibration was performed using a reference gas. The measurement procedure was as follows:
  • In the first step, the background was measured to determine the boiler’s steady operating conditions. The analyzer measured the concentration of NOx and other flue gas components for approximately half an hour. The measurement was averaged over time.
  • In the second step, reagent injection was initiated. NOx concentration measurement started after a transition period from the reagent injection start. The plant operator observed the NOx rate of change in the flue gas in response to the reagent injection and decided whether steady-state conditions had already occurred.
  • In the third step, the actual measurement period followed. The reagent injection at fixed set points (injection lance configuration, insertion points, and operating parameters) and the NOx concentration measurement in the exhaust gas took about 20–30 min.
  • In the following steps, the operational parameters of the injection lances were changed (e.g., pressure, reagent output, and urea concentration). Re-measurement with the exhaust gas analyzer started each time after a transition period in which the operator had to confirm the steady-state conditions.
  • In the final measurement stage, the background level of NOx concentration in the flue gas was again verified after stopping the reagent injection. This measurement was started when steady conditions were reached. The duration of the measurement was approximately 0.5 h.
The required calculations were made to determine the reagent flow rate for the boiler operation variant. Based on the actual flue gas flow rate and the background NO [mg/Nm3] measurement reading for a given measurement series, the stoichiometric urea requirement was calculated. The formula below shows how to determine the reagent flow rate  m ˙  with the desired urea concentration in water:
m ˙ = V r · N O 10 6 · C [ l h ]
where  V r —real exhaust gas flow rate,  N O —nitrogen oxide measurement,  C —urea solution concentration. The test was conducted at the stoichiometric reagent flow rate and with multiples of this flow rate.

3. Results

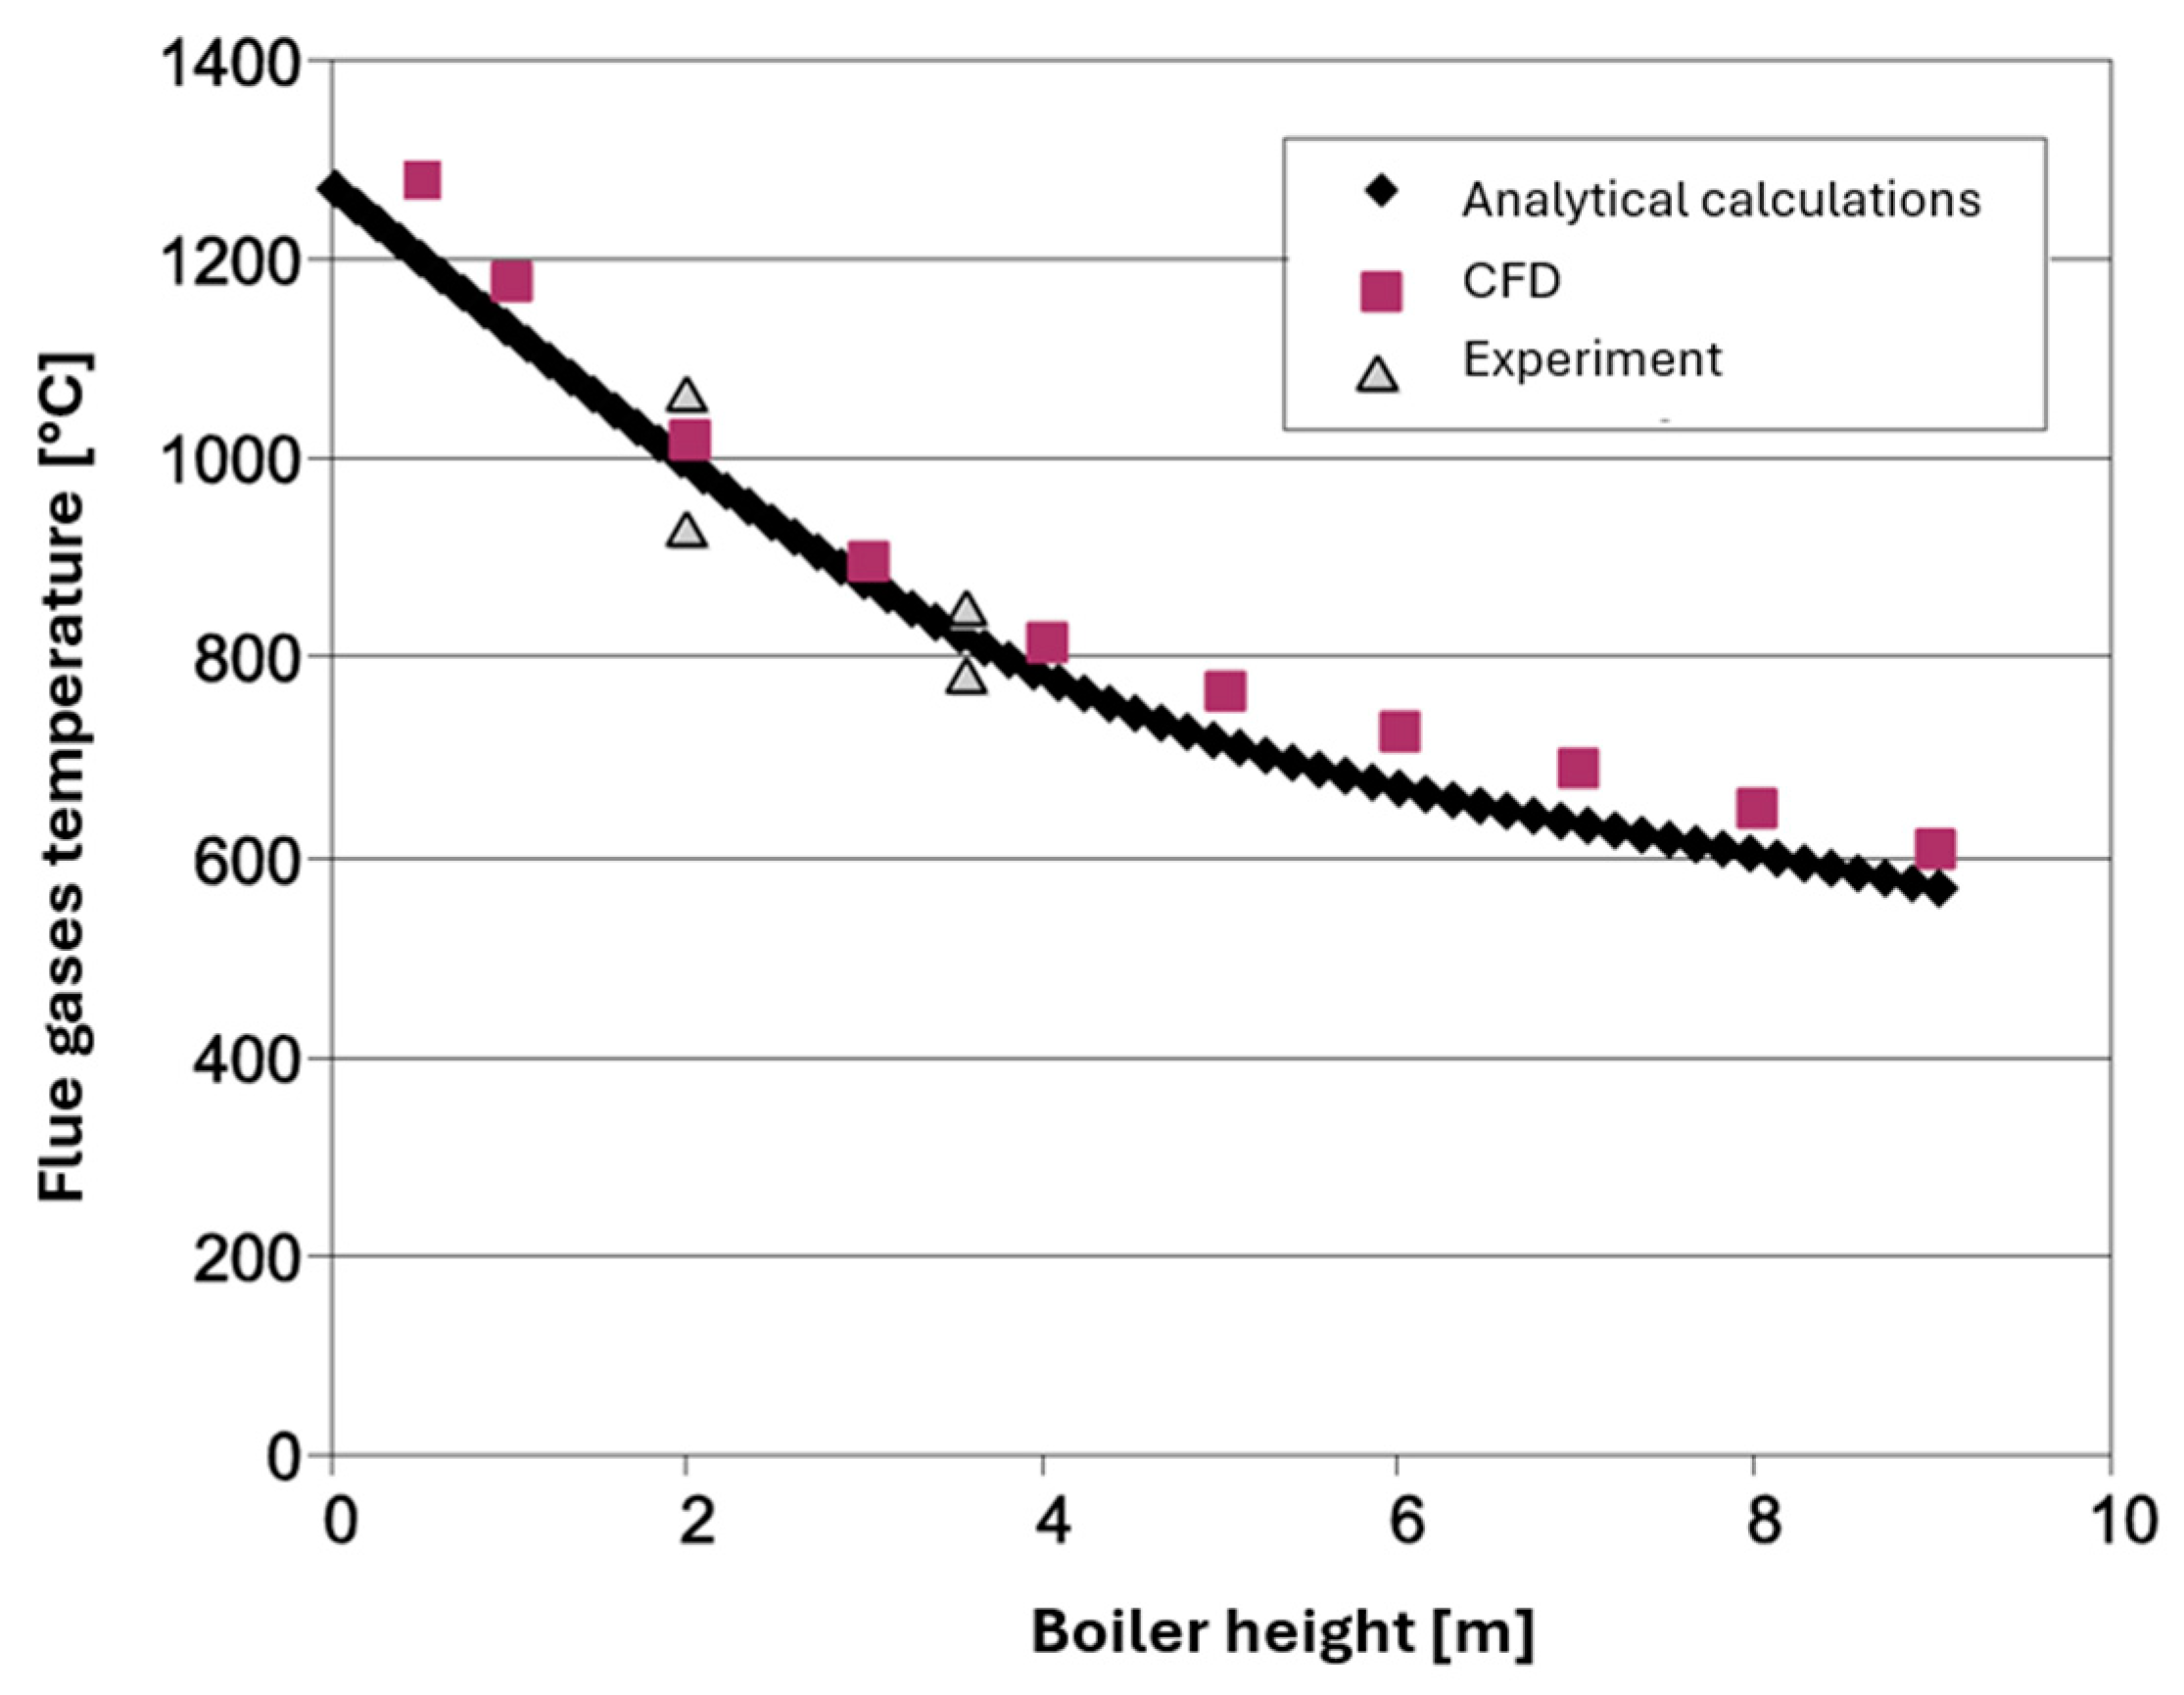
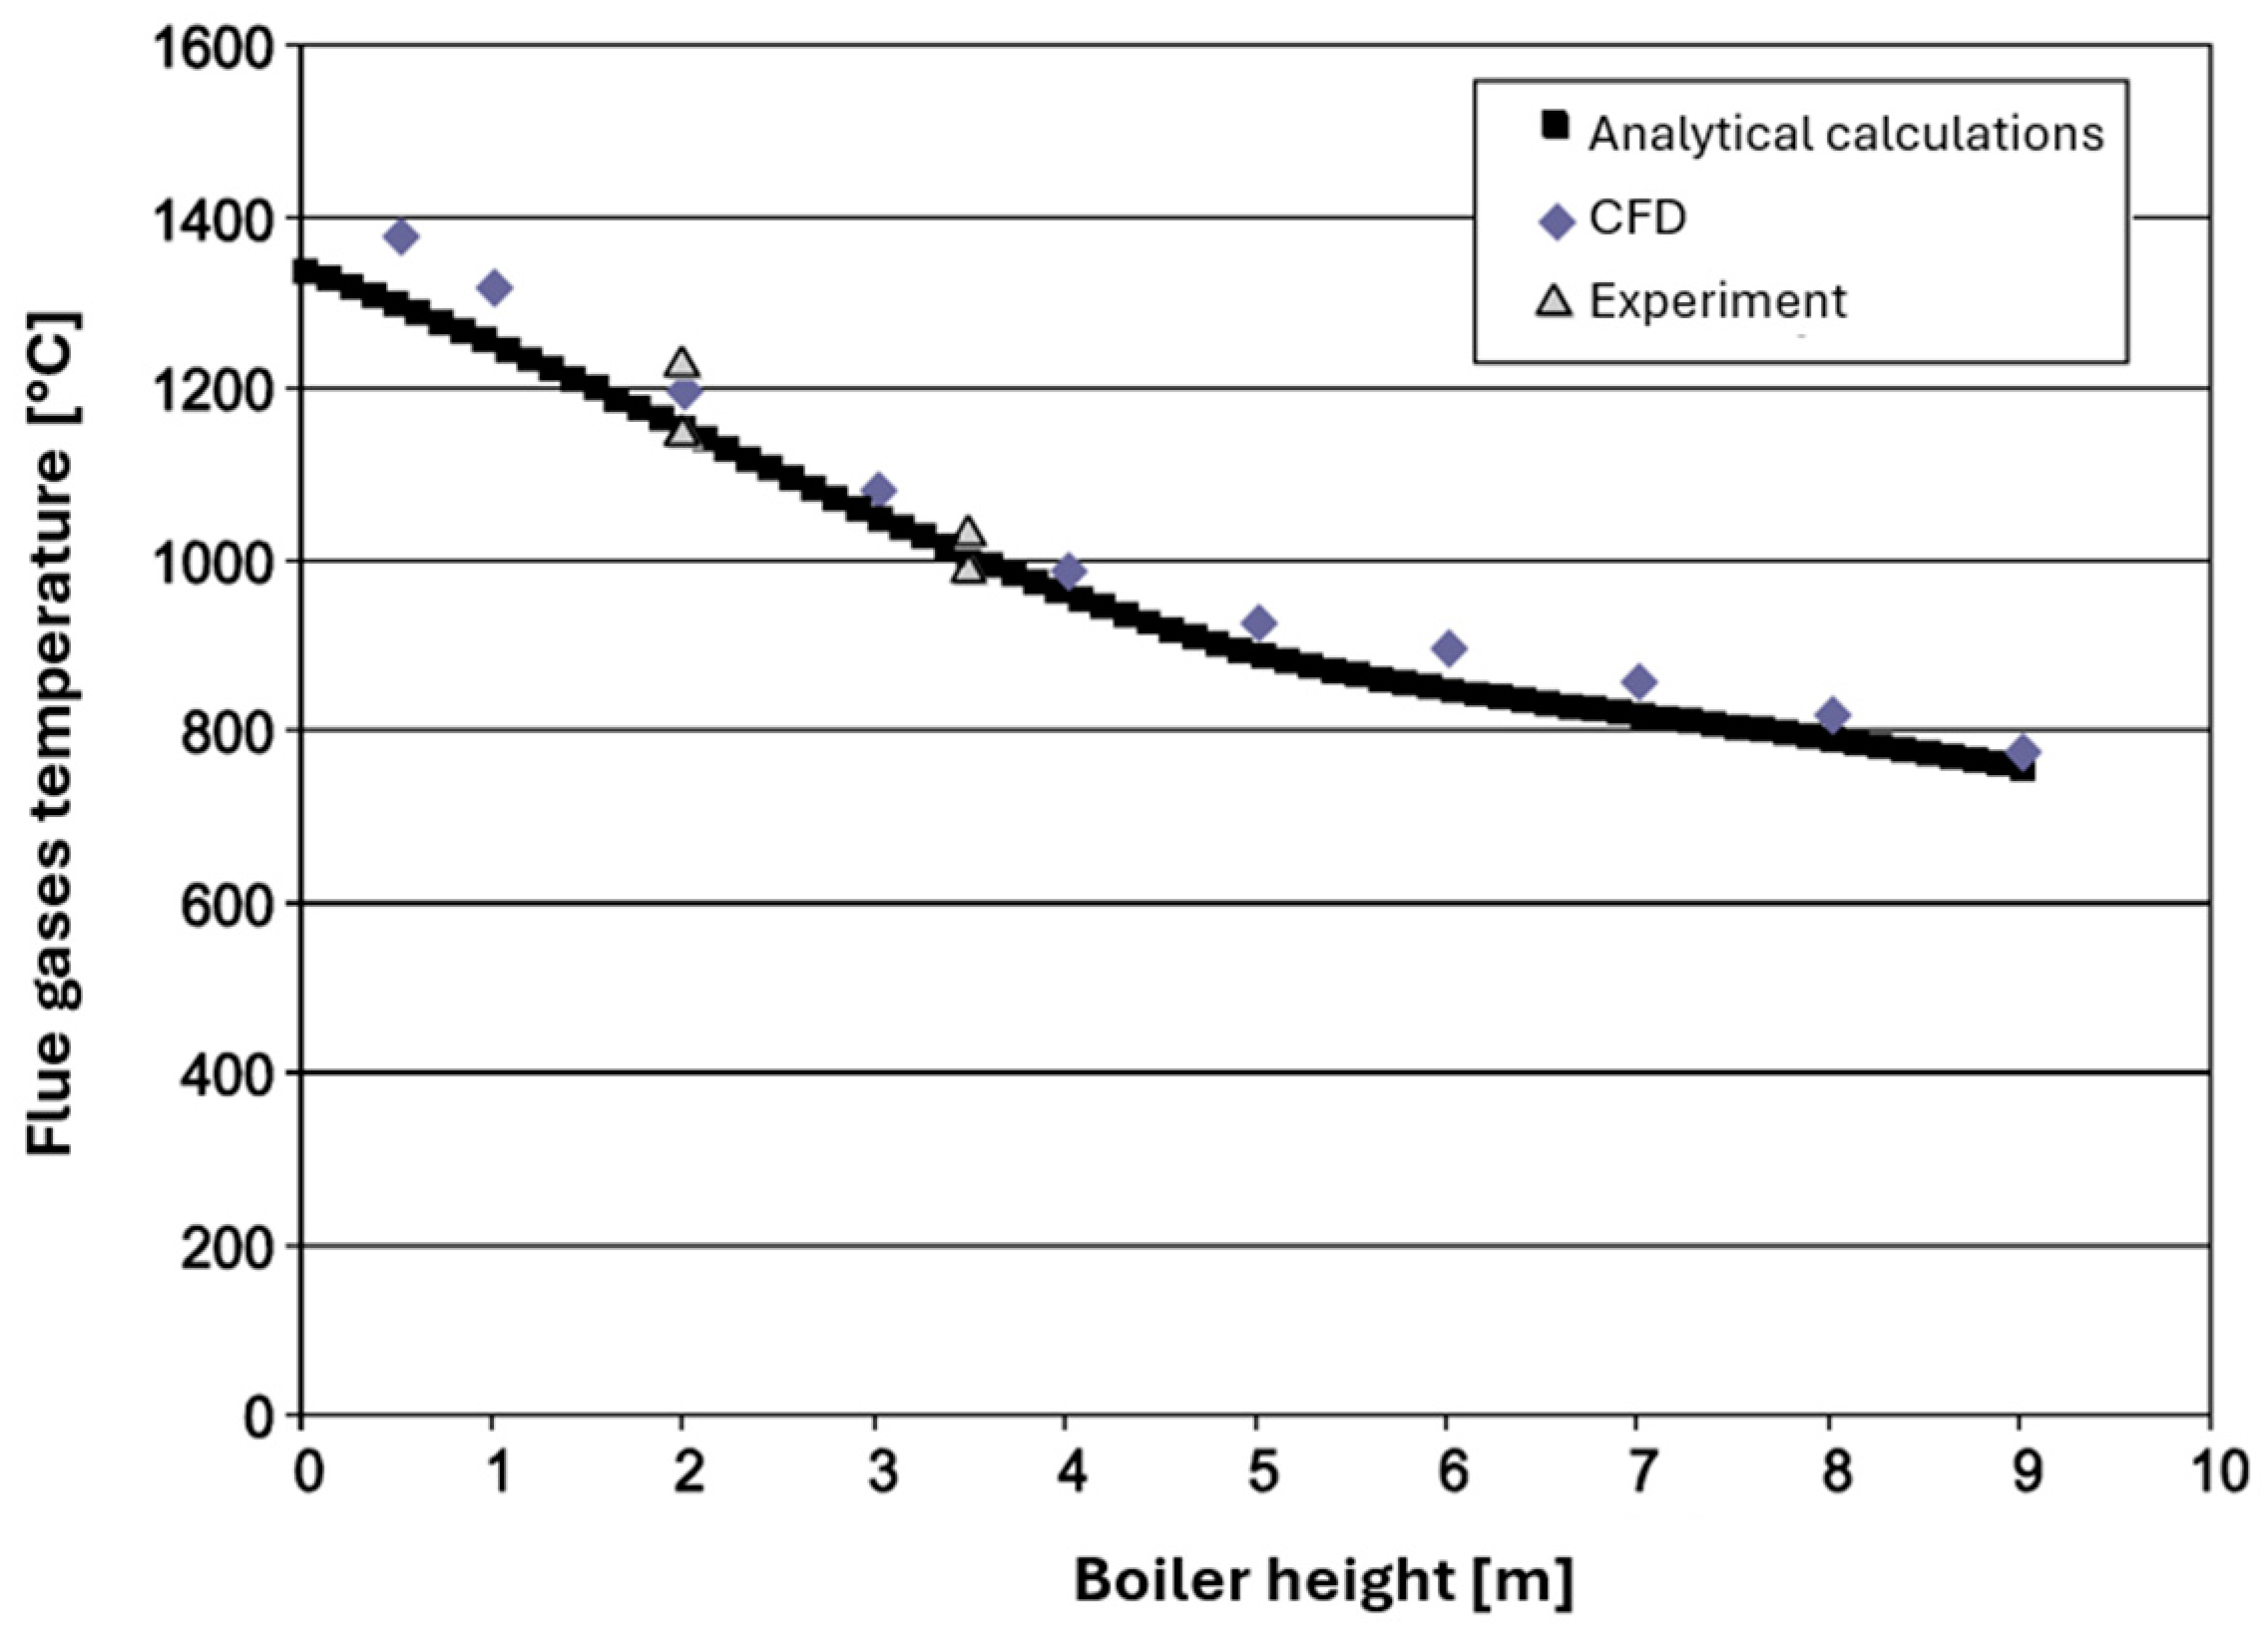
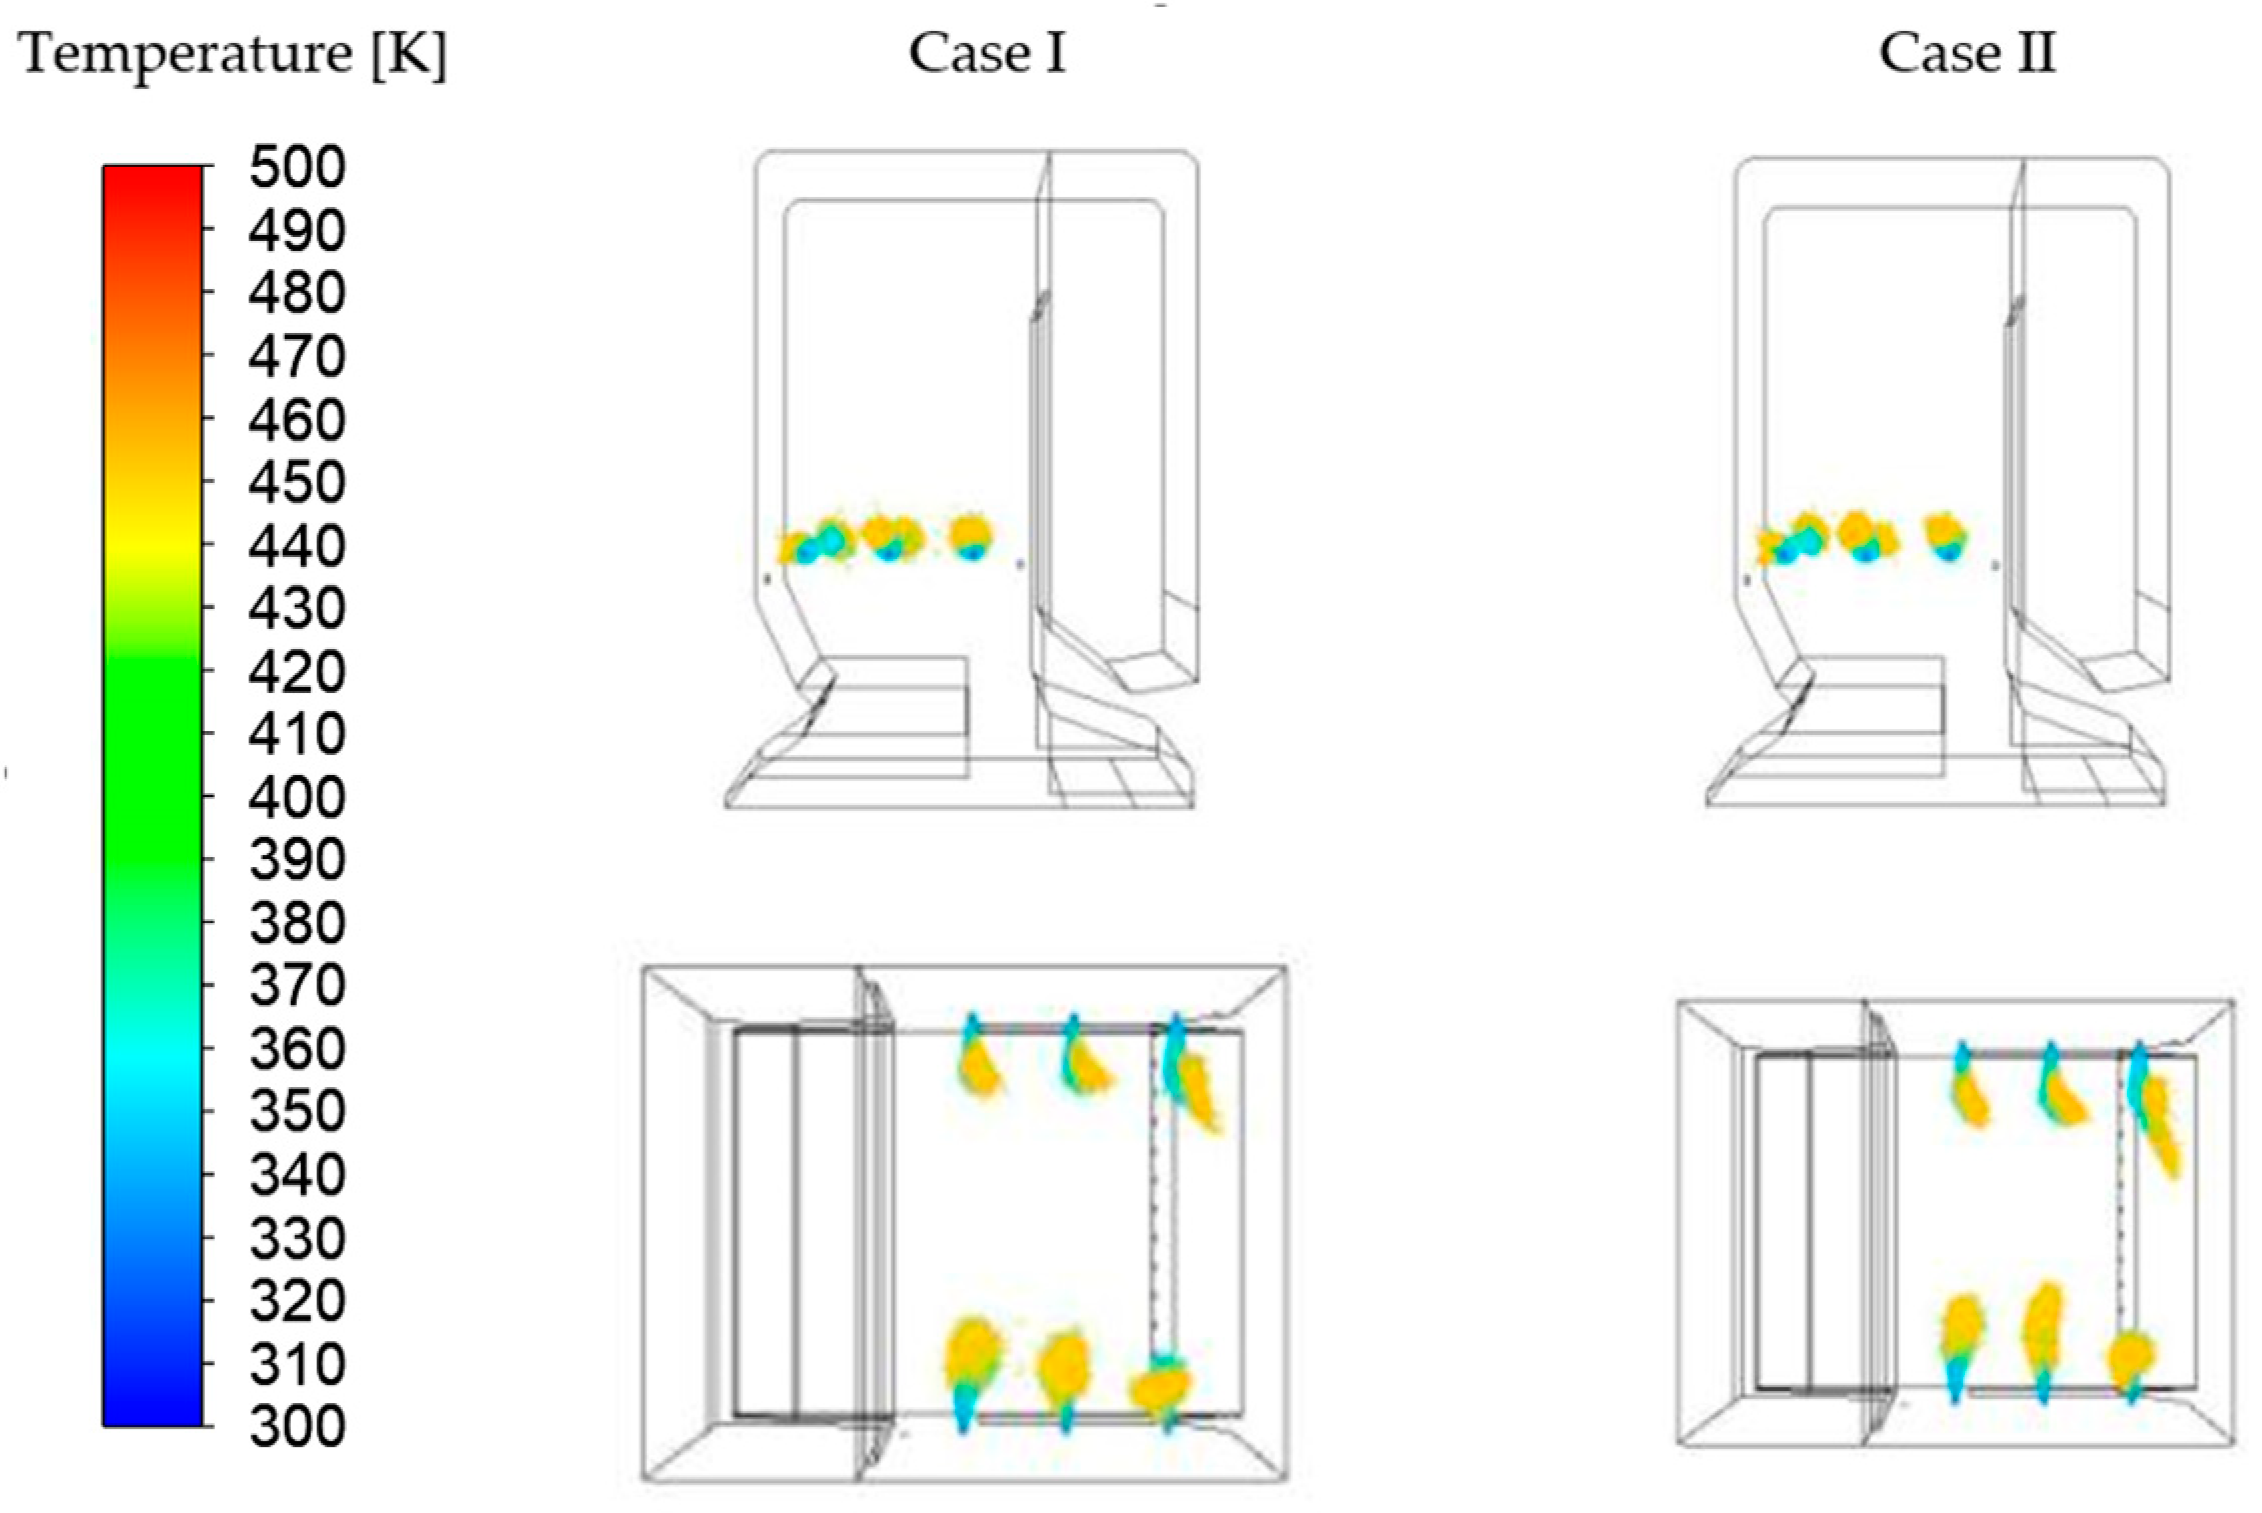
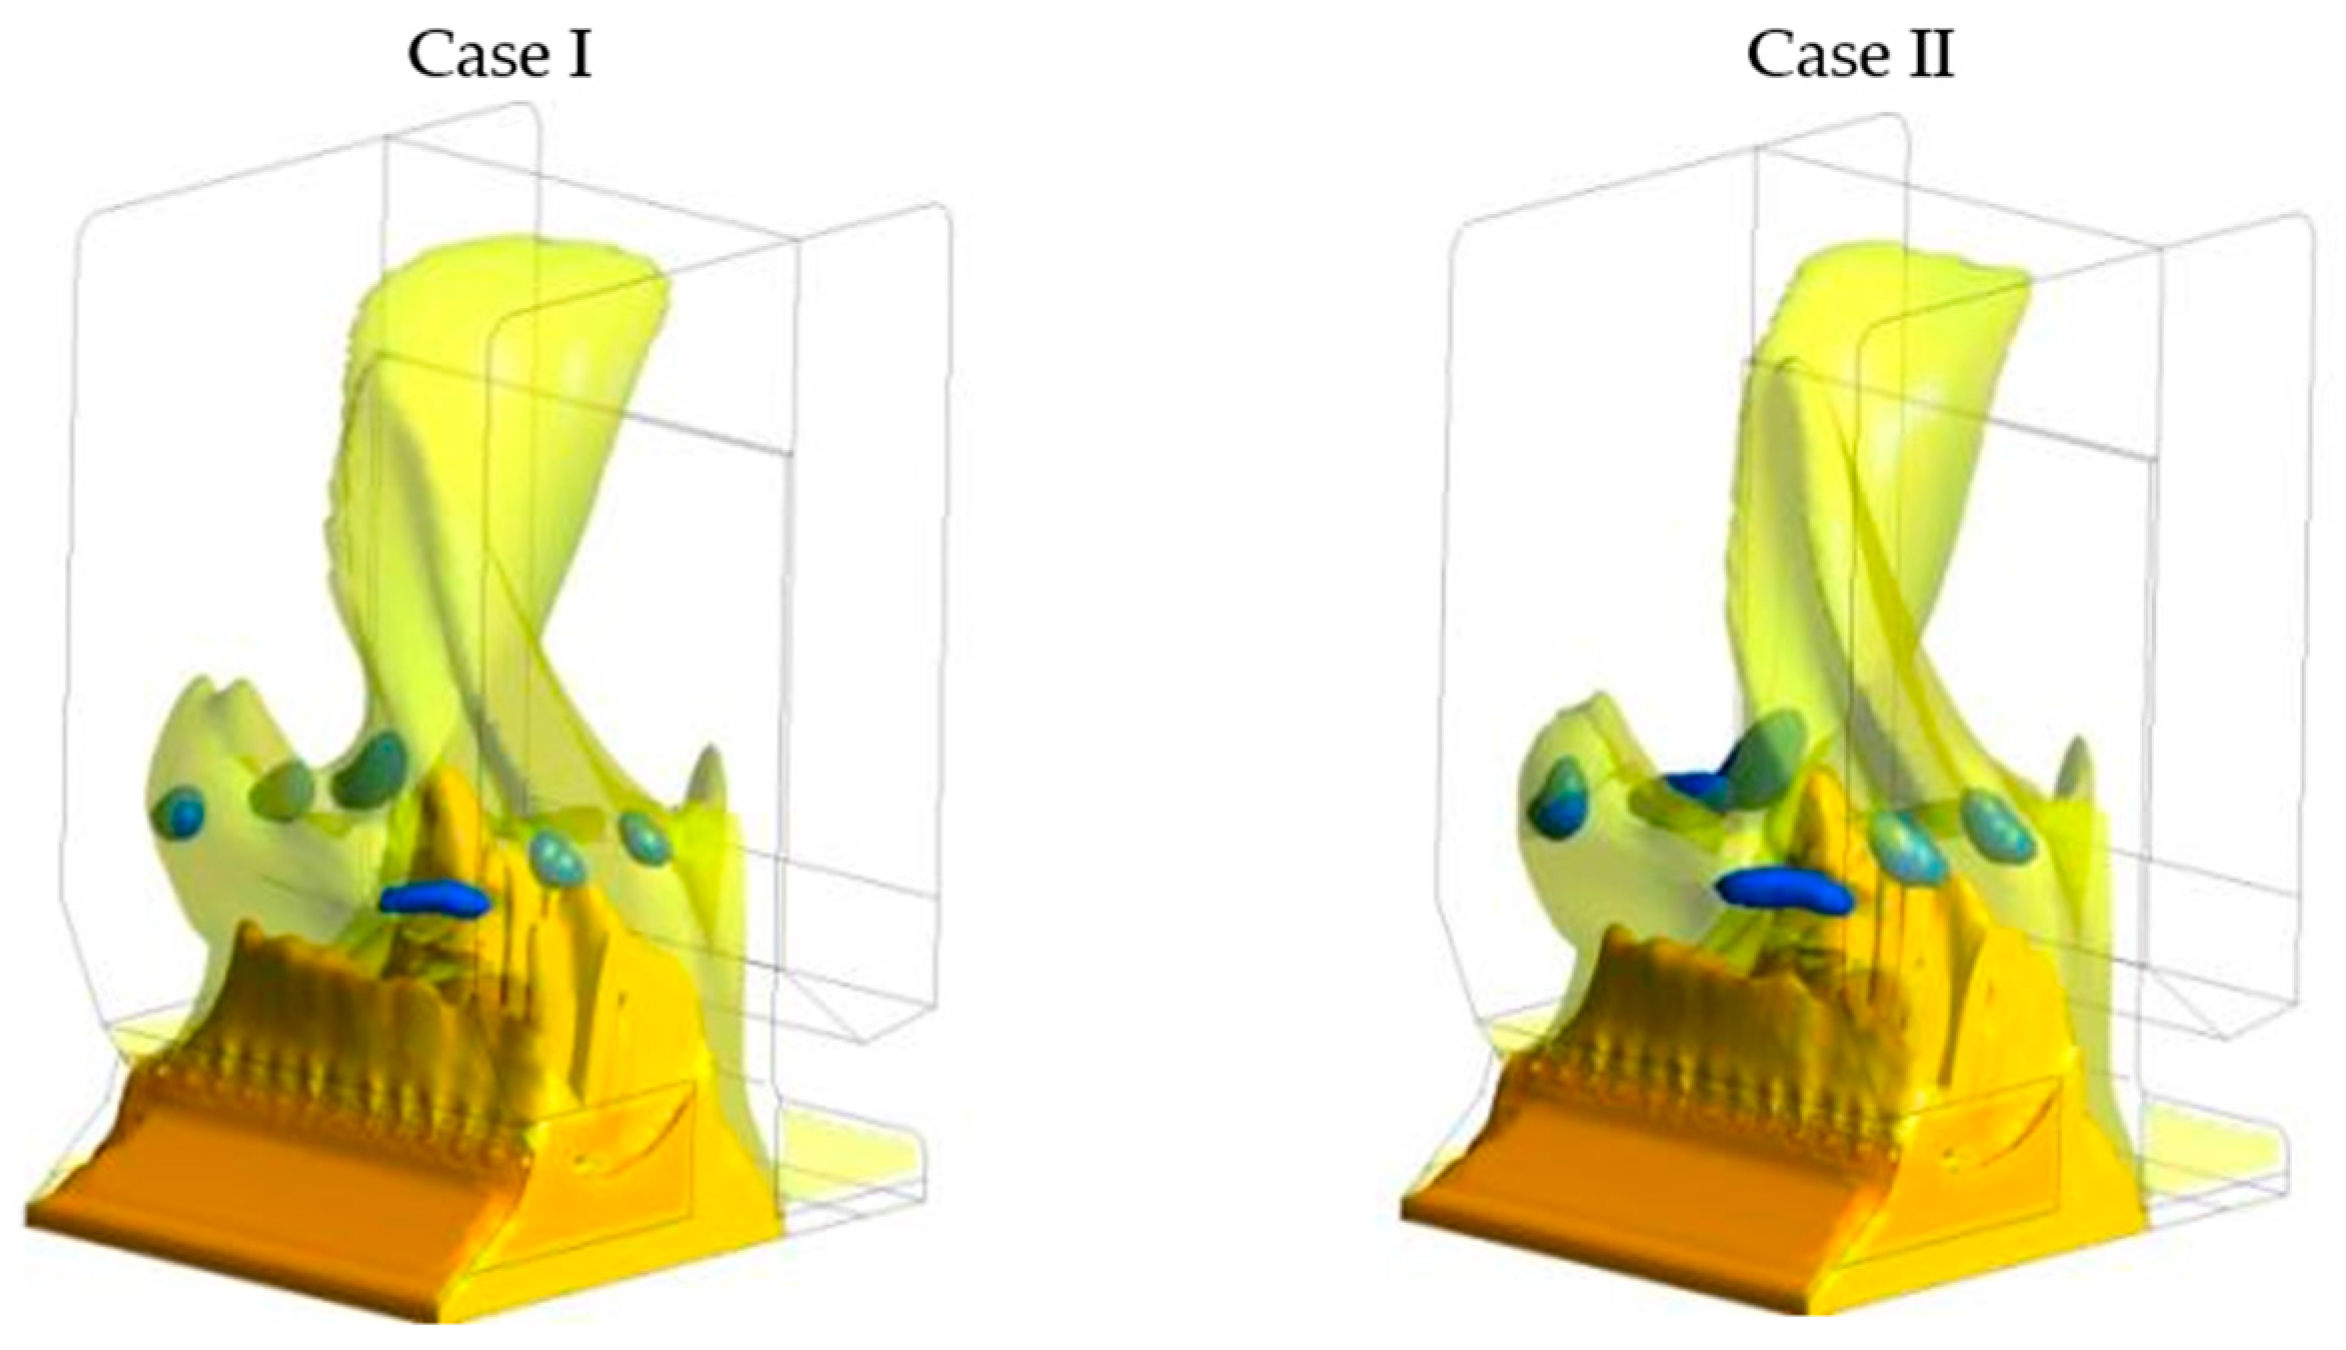
3.1. Mathematical Modeling Results

The numerical analysis covered three cases, NSR equal to 1 (case 1), 2 (case 2), and 4 (case 3). The reduction rate as a function of NSR is presented in Figure 10. An increase in NSR between cases 1 and 2 more than doubled the reduction rate (20.1% vs. 56.9%). Further reagent excess ratio growth contributes to the reduction rate increase (case 3, 53.1%), but it is not so significant as in cases 1 vs. 2. As the reagent concentration was the same in all cases (12%), the reagent excess ratio increase was realized by total injection mass flow growth. It contributed to the deeper penetration of the reagent in the combustion chamber (Figure 11).
Reagent injection was realized by six nozzles placed on one level, the zone of the temperature window for the analyzed boiler power (25 MW) (Figure 12). The CFD results confirmed the maximum concentration of urea in the temperature window zone, which is 900–1100 °C [22] (Figure 13).

3.2. Tests Results

During the reported tests, 91 measurements were taken for different configurations and parameters of reagent injection into the combustion chamber of the boiler, which operated in the power range from 15 to 30 MW. Figure 14 shows the effect of varying the NSR on the NOx reductions obtained with respect to the three boiler power ranges, while Figure 15 shows the NOx reduction values obtained as a function of the boiler power.
The measurements presented in Figure 14 indicate an increase in NOx reduction in each boiler load range as the NSR increases. Furthermore, the best NOx reduction rates for the same NSR are obtained for lower boiler loads. The total results range is relatively wide: from a reduction level of approximately 15% (NSR 0.75, load range of 25–30 MW) to a reduction level of 75% (NSR 2.15, load range of 15–20 MW). Increasing the NSR from around 0.75 to a level exceeding 2.5 results in NOx reduction levels of 20%, 30%, and 35% for the 25–30 MW, 20–30 MW, and 15–20 MW load ranges, respectively.
The measurement results are also presented in a different configuration in Figure 15. Most trials were carried out in the 20–25 MW power range due to the operating characteristics of the individual boiler. The graph shows a general trend of decreasing system efficiency with increasing boiler power, as well as a decrease in efficiency associated with a lower NSR.
During performance tests of the designed SNCR system, nozzles with different numbers and diameters of holes were used. The test results showed that better performance was obtained with multiple-hole nozzles than with single-hole nozzles. Figure 16 shows a comparison of NOx reduction as a function of the reactant excess ratio for two different injection nozzle designs. During the test, the other SNCR plant operating parameters remained constant. The boiler was operated at approximately 20 MW.
Based on the results presented in Figure 16, it can be concluded that three-hole nozzles allowed for several percentage points higher NOx reduction than single-hole nozzles. Photographs showing the reagent atomization in the cold boiler with the two-hole and three-hole nozzles taken during plant tests are shown in Figure 17.
Figure 18 illustrates the NOx-reduction comparison as a function of the NSR for three-hole and two-hole nozzles. During the test, the other SNCR plant operating parameters remained constant. The boiler operated at approximately 18–19 MW during the test runs.
The chart shows that, for the location studied, higher reductions were obtained for the two-hole nozzles. The differences reached 3–4 percentage points.
An aqueous urea solution was used as the reagent throughout the research cycle. The industrial AdBlue® product used has a concentration of 32.5%. In order to check the impact of urea concentration, the SNCR system efficiency was compared by using a 35 and 12% solution. Figure 19 compares the NOx reduction obtained for the different solution concentrations.
The results confirmed the higher NOx reduction achieved for the lower urea concentration. Differences exceed up to ten percentage points. For the same NSR values, an improvement in NOx reduction efficiency of between 10% and 13% was achieved. With an NSR of less than 1.5, the installation efficiency using the lower urea concentration was about 55%, while for NSRs above 2, it was about 65%.

4. Discussion

This study covered various parameters that impact the reduction rate of NOx in the example stoker boiler WR-25. The first analyzed parameter was NSR. The urea concentration in the solution injected into the boiler was constant at 12.5%. CFD modeling shows that an increase in NSR contributes to reduction efficiency growth. The change between NSR 1 and 2 is significant (more than 2 times higher efficiency. The same trend was confirmed in the bench tests (Figure 14) for all analyzed boiler power levels. The increased amount of reagent contributes to injected mass flow ratio growth, so the penetration of the reagent in the horizontal cross-section of the chamber is deeper (Figure 11). Similar trends were confirmed in [23] (the OP-650 boiler, with a reagent concentration of 32%, NSR 0.5–3), where the highest-efficiency growth was also observed between NSR 1 and 2. A further doubling of NSR does not contribute to such significant efficiency changes. This can be explained by the fact that in the reagent-excess conditions, chemical component mixing becomes the limitation for NOx reduction. Typical NSR values found in the literature are in the range of 0.5–3 [16,24], with an optimal value of approximately 1.5 [4,25], which remains in agreement with the obtained results.
The test results indicated decreased NOx reduction efficiency with increasing boiler power (Figure 15). The decrease in NOx reduction with increasing power is probably due to the insufficient residence time of the reagent under the required thermodynamic conditions in order to properly perform the reaction. These conditions include mixing and particle residence at the proper temperature range. If the reagent injection is directly into the flame, then reagent combustion occurs, and the reduction process does not take place. Thus, the installation works when the reagent is injected into the flue gas (but not the flame) at a specific temperature. In addition, at high power, the exhaust gases and the fuel supply increase. This results in a high flame filling of the chamber, making it more difficult to hit the right temperature range. The temperature window moves higher so that the reagent injection is implemented higher. In addition, the exhaust gas flow velocity through the chamber increases, so the reagent residence time in the respective temperature zone shortens. This mechanism results in a decrease in NOx reduction efficiency. Despite the aforementioned correlations, measurements taken show that some probes indicate significantly higher NOx-reduction values than the average determined by the trend line (Figure 14). This is probably due to the influence of the variable configuration of the injection lances used.
The impact of three types of nozzle tips was investigated within the tests: one-hole, two-hole, and three-hole. The results presented in Figure 16 and Figure 18 indicate that three-hole and two-hole nozzles allowed for several percentage points higher NOx reduction than single-hole nozzles. According to the authors, this results from the significantly higher injection angles achieved for the multi-hole nozzles, providing better reagent distribution inside the combustion chamber.
The urea concentration in the solution also affects NOx reduction, which was confirmed in tests. A reagent with a concentration of 12% showed an improvement of more than 10% in plant efficiency compared to a 32.5% reagent. The reason for this phenomenon could be that when using a lower reagent concentration, a significantly higher amount of water is introduced into the boiler. This water takes longer to evaporate. As a result, the penetration of the reagent droplets improves, and the rate of mixing with the flue gas increases, so the reduction improves. Therefore, a reagent diluted to several percent of the urea concentration is recommended for target installations.

5. Outcomes

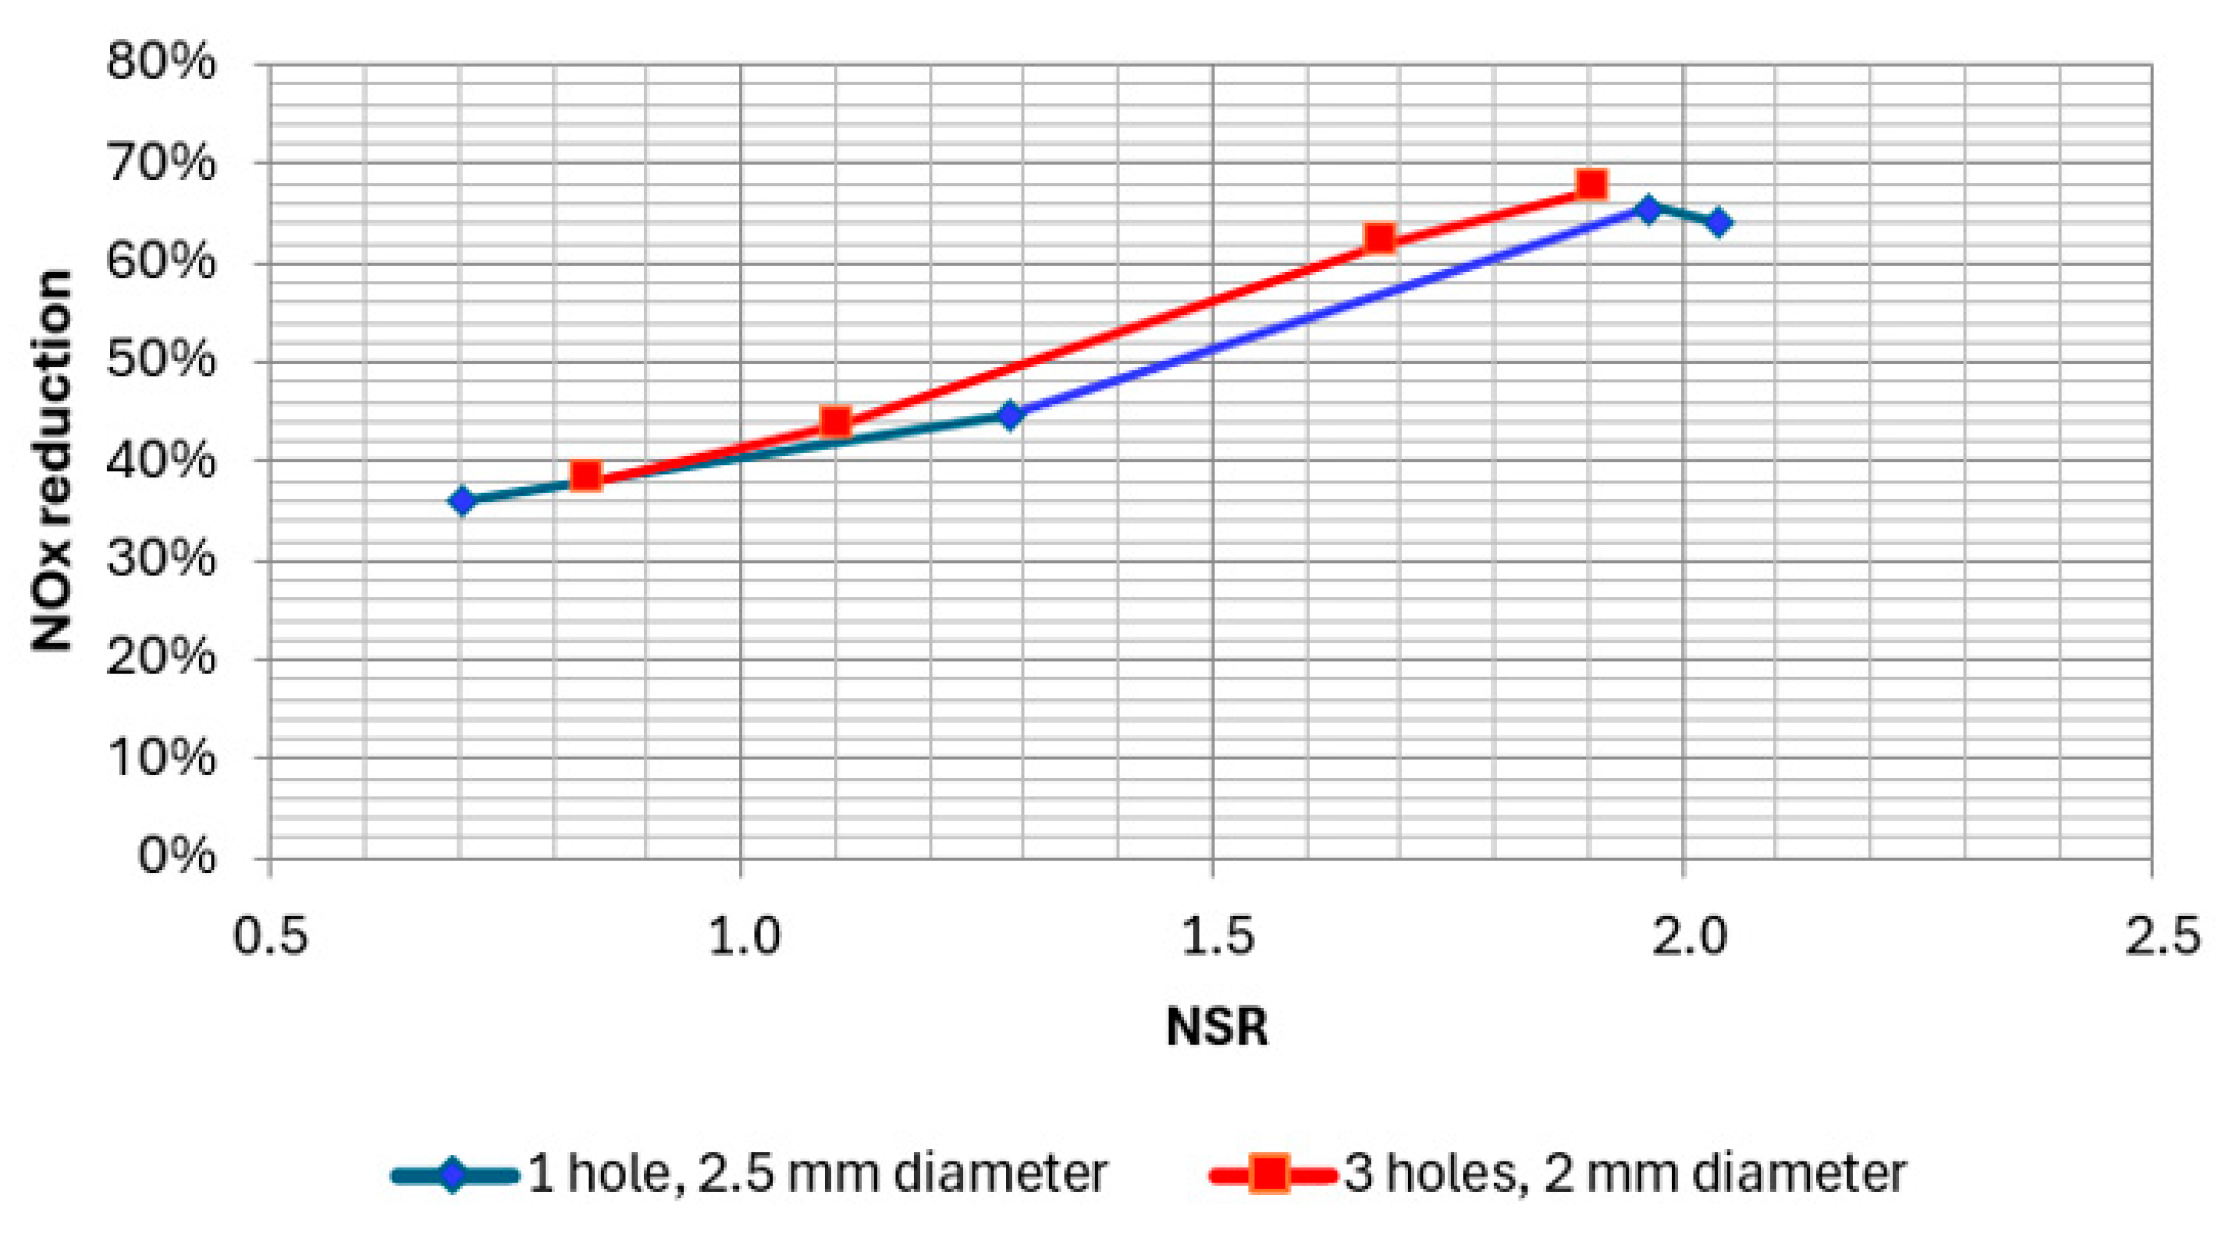
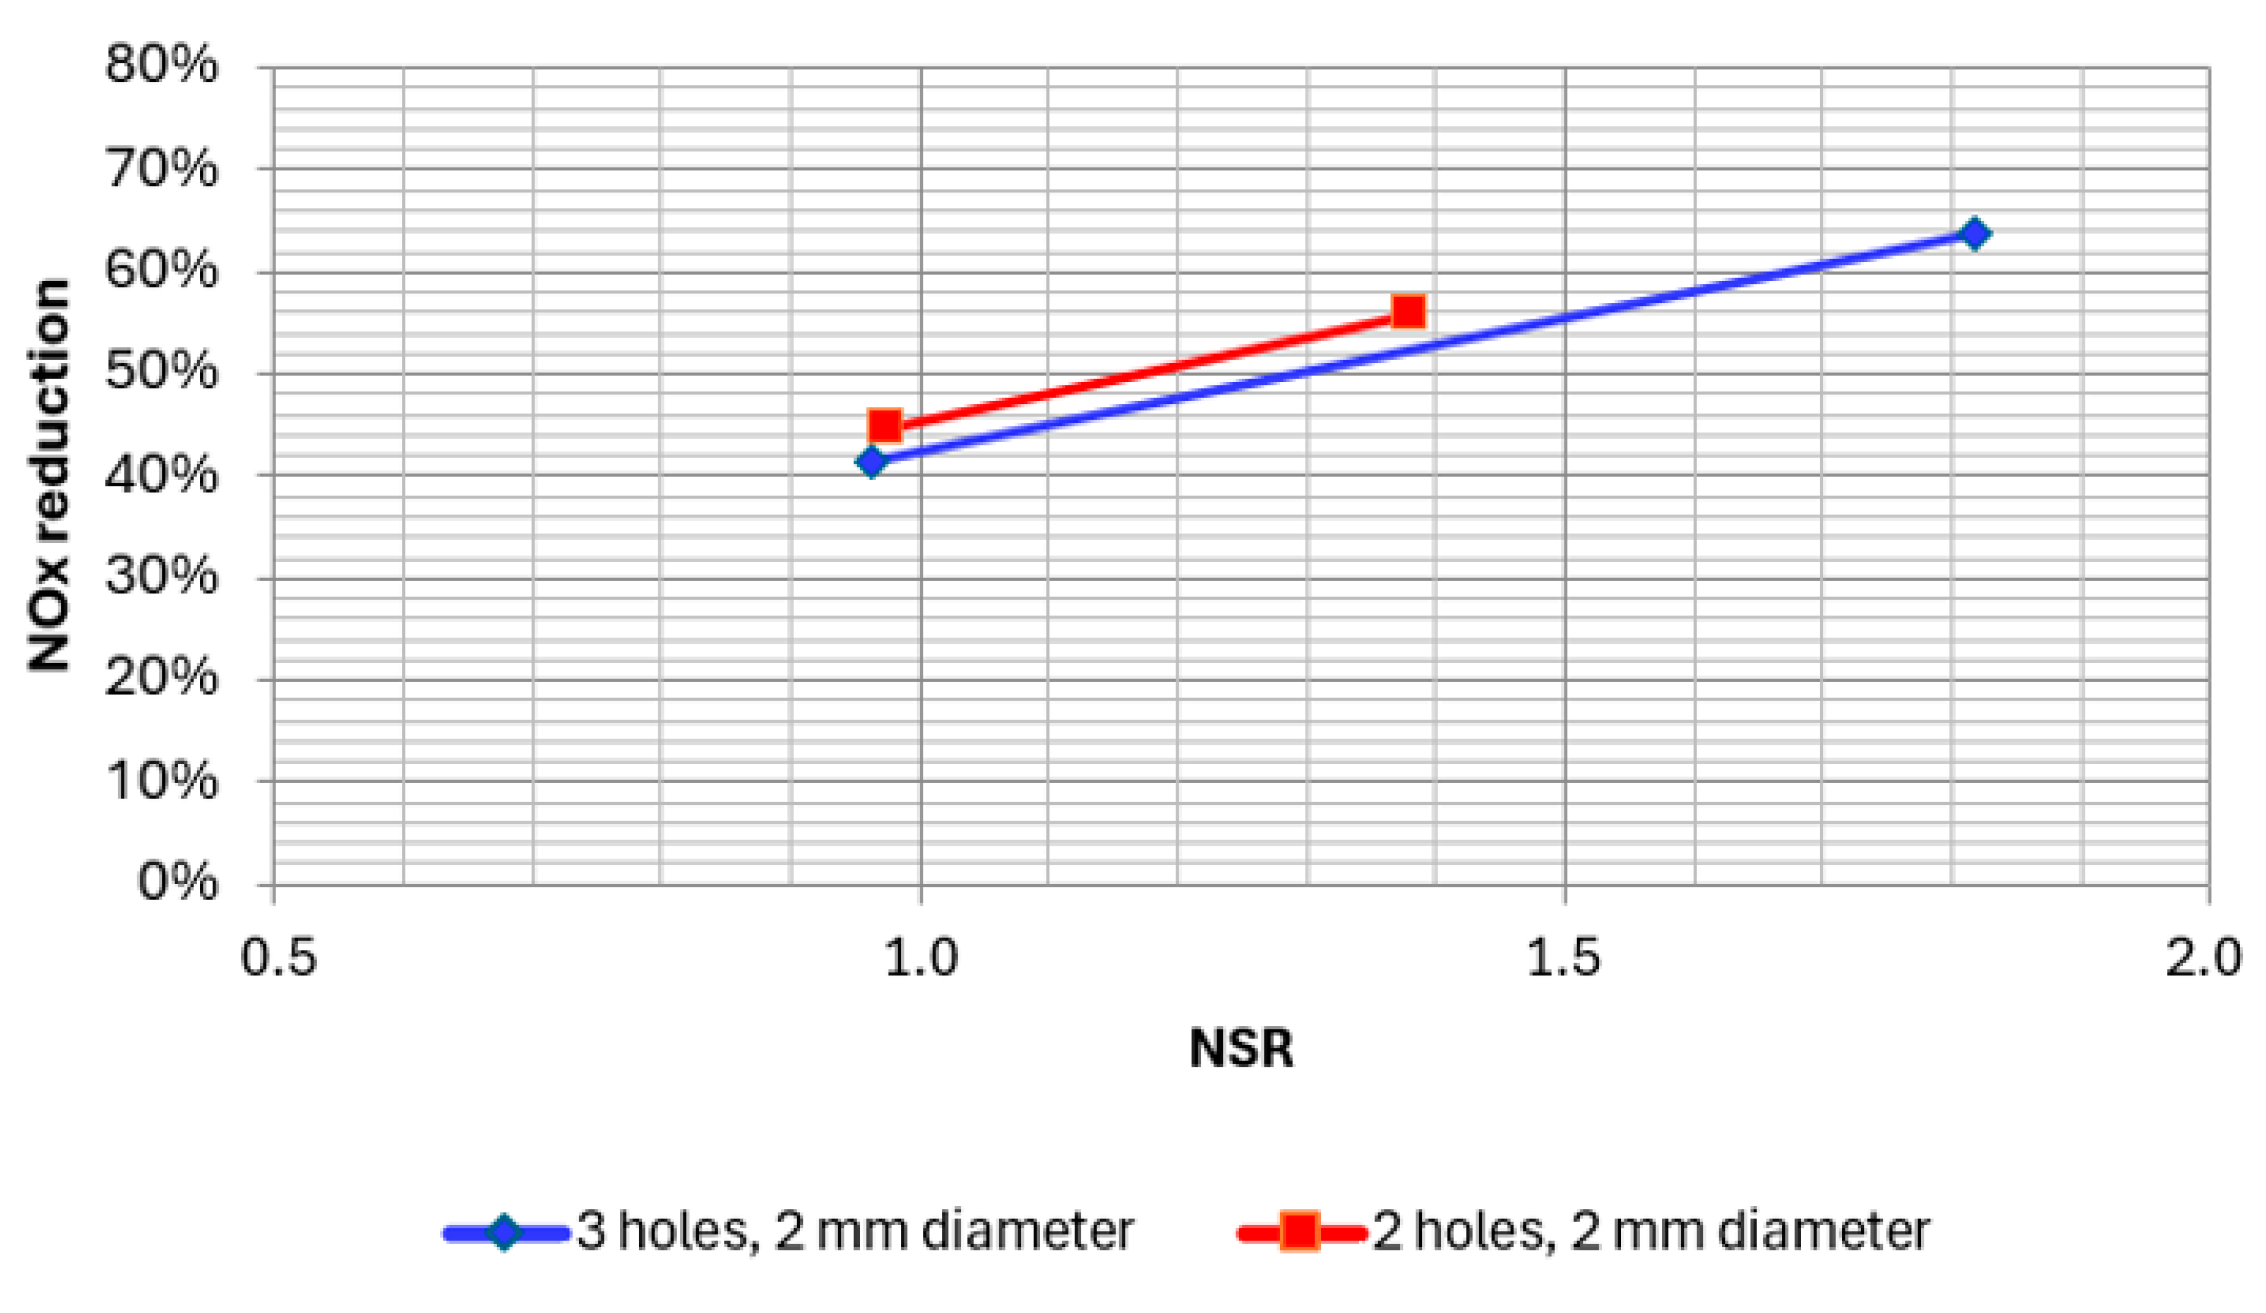
  • Increasing NSR significantly enhances NOx reduction efficiency, especially between NSR 1 and 2, but further increases show diminishing returns.
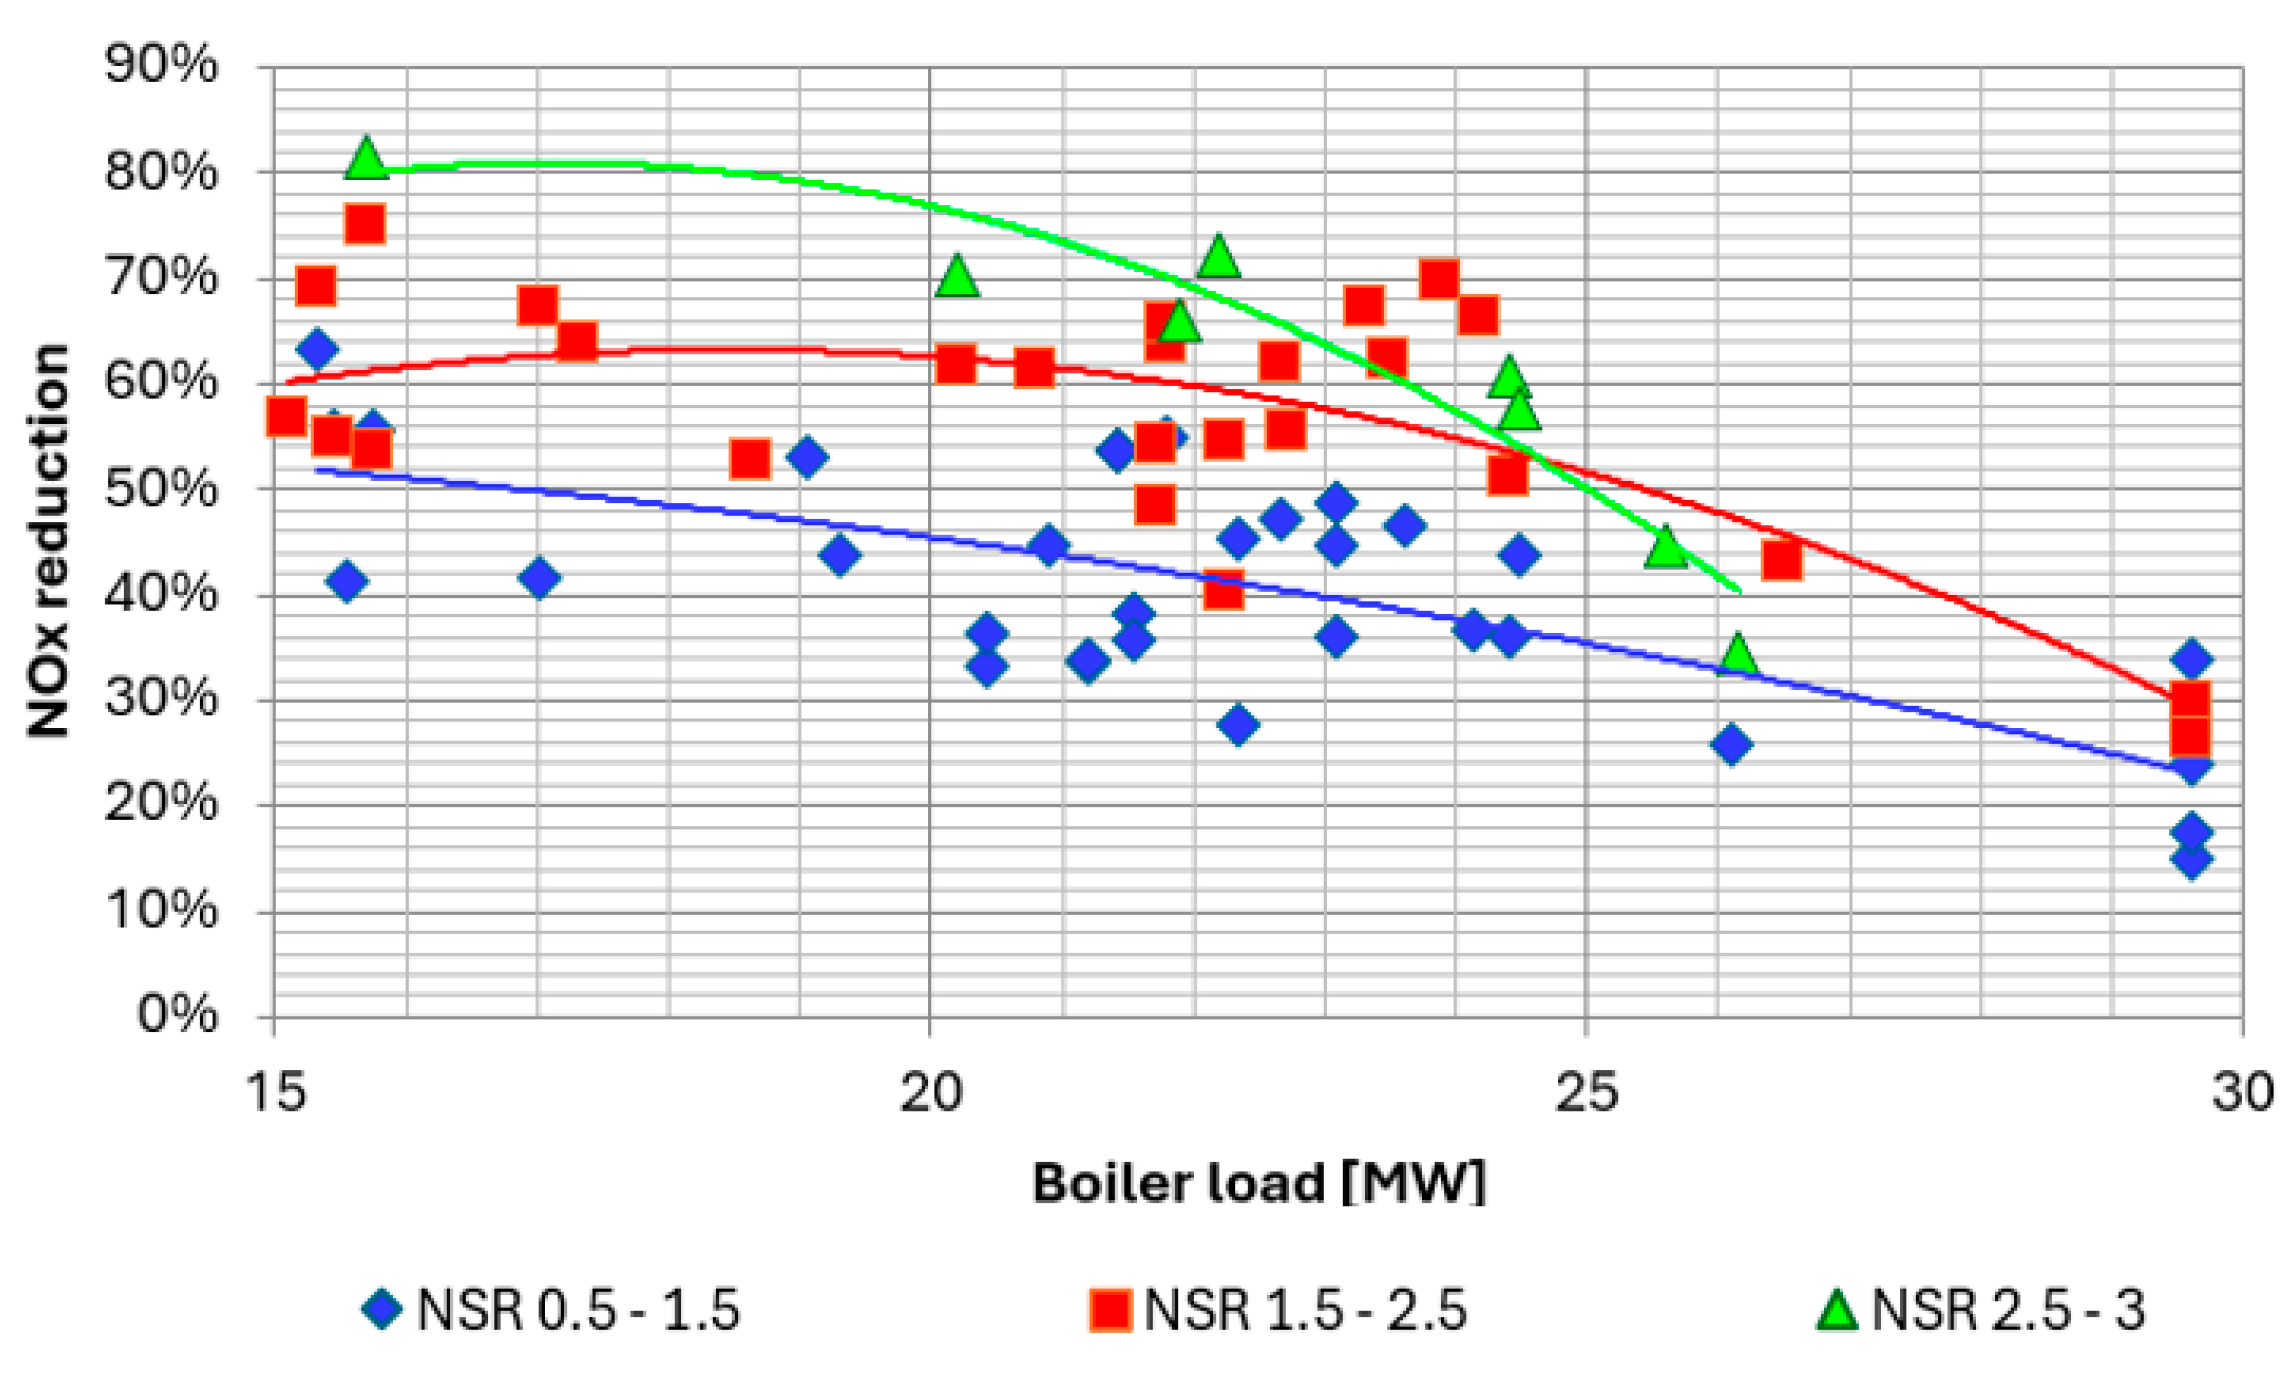
  • NOx reduction efficiency decreases with higher boiler power, likely due to shorter reagent residence time and difficulties maintaining optimal temperature conditions.
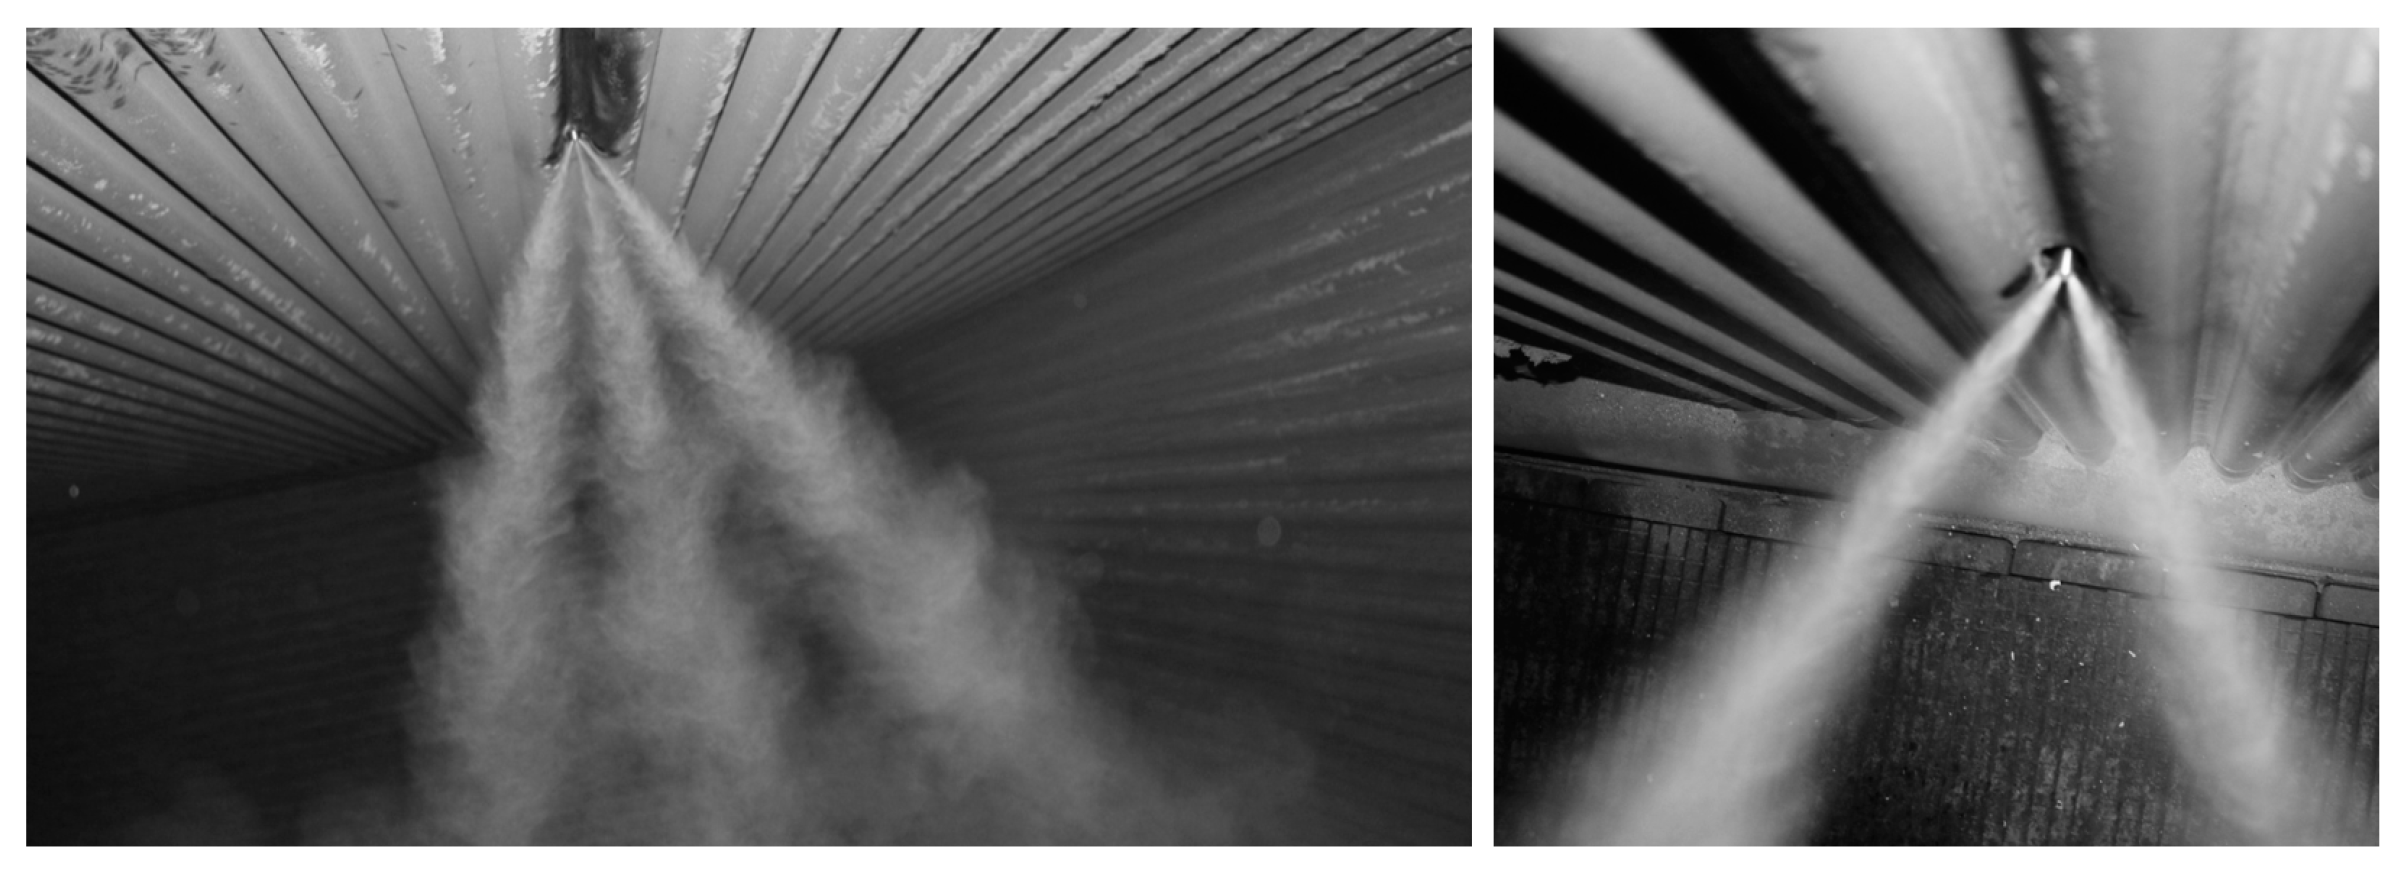
  • Multi-hole nozzles (two- and three-holes) provide better NOx reduction compared to single-hole nozzles due to improved reagent distribution.
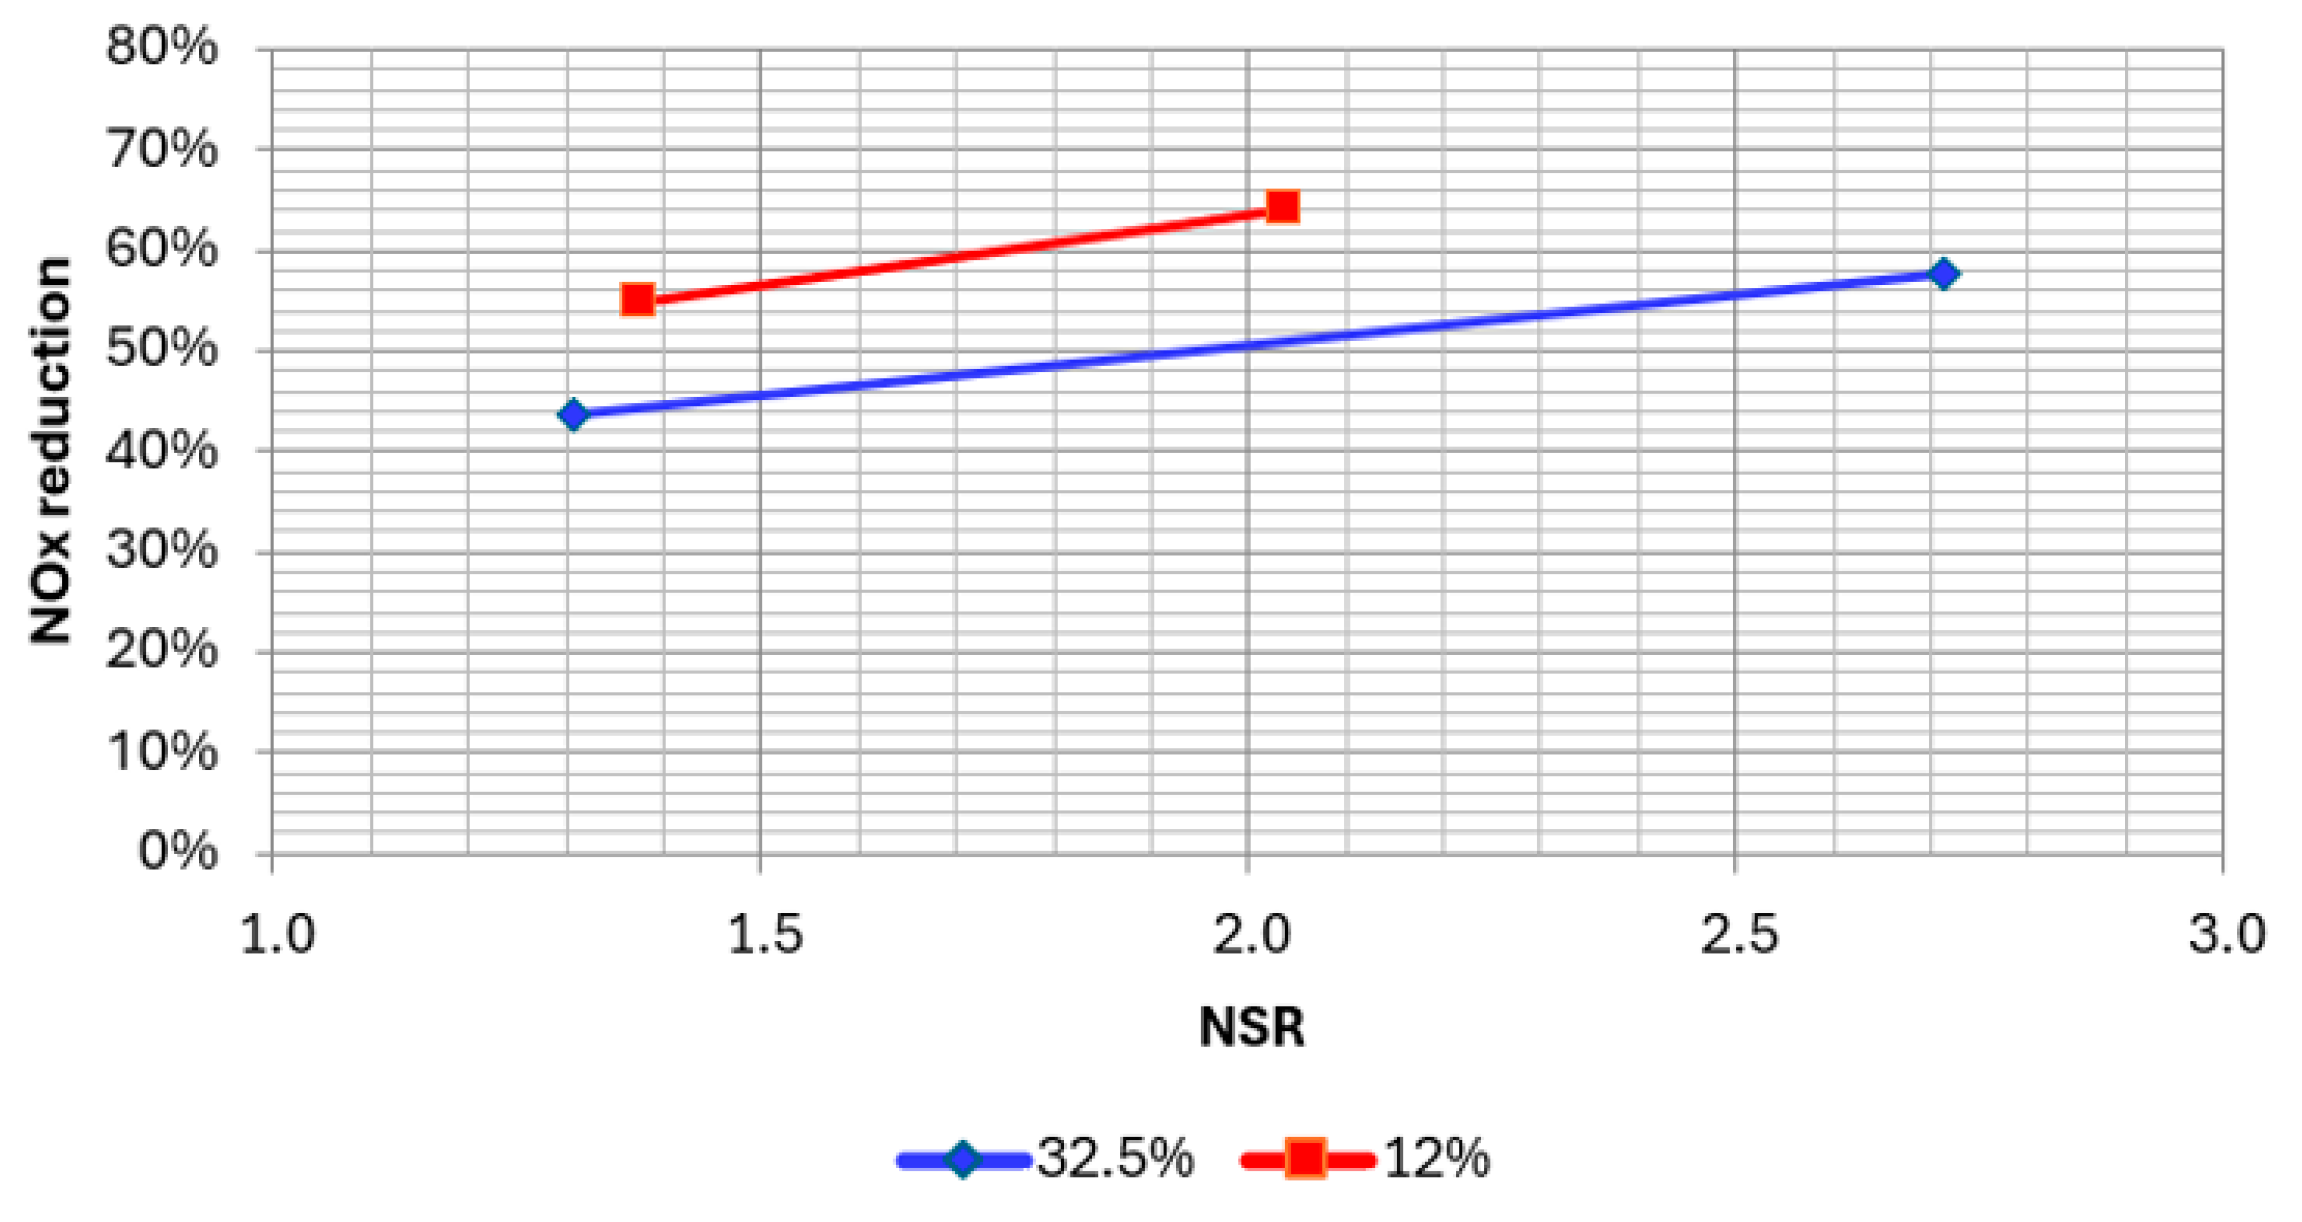
  • Lower urea concentration (12%) in the reagent improves NOx reduction efficiency compared to higher concentrations (32.5%), as better mixing and droplet penetration are achieved.
  • Optimal reagent injection should avoid the flame zone, ensuring it occurs in the correct temperature window for effective NOx reduction.

Author Contributions

Conceptualization, P.K., M.K.-G. and A.D.; methodology: P.K.; writing—original draft preparation, P.K., M.K.-G. and A.D.; writing—review and editing, A.D.; visualization, M.K.-G. and A.D.; supervision, P.K. All authors have read and agreed to the published version of the manuscript.

Funding

This research is supported by the POIG.01.03.01-14-035/12 project, which is co-financed by the European Union under the European Regional Development Fund.

Institutional Review Board Statement

Not applicable.

Informed Consent Statement

Not applicable.

Data Availability Statement

The original contributions presented in the study are included in the article, further inquiries can be directed to the corresponding author.

Conflicts of Interest

The authors declare no conflicts of interest.

References

  1. Wrzesińska, B.; Krzywda, R.; Wąsowski, T.; Krawczyk, P.; Badyda, K. A selective non-catalytic reduction of nitrogen oxides technology for application in industrial and municipal heating boilers. Przem. Chem. 2015, 1, 182–187. (In Polish) [Google Scholar]
  2. Lyon, R.K. The NH3-NO-O2 reaction. Int. J. Chem. Kinet. 1976, 8, 315–318. [Google Scholar] [CrossRef]
  3. Tayyeb Javed, M.; Nimmo, W.; Mahmood, A.; Irfan, N. Effect of oxygenated liquid additives on the urea based SNCR process. J. Environ. Manag. 2009, 90, 3429–3435. [Google Scholar] [CrossRef] [PubMed]
  4. Cai, J.; Zheng, W.; Wang, Q. Effects of hydrogen peroxide, sodium carbonate, and ethanol additives on the urea-based SNCR process. Sci. Total Environ. 2021, 772, 145551. [Google Scholar] [CrossRef] [PubMed]
  5. Lin, T.; Liao, Y.F.; Dai, T.H.; Ma, X.Q. Co-disposal technology for sludge and municipal solid waste based on SNCR optimization. Energy 2024, 292, 130582. [Google Scholar] [CrossRef]
  6. Garbacz, P.; Wejkowski, R. Numerical research on the SNCR method in a grate boiler equipped with the innovative FJBS system. Energy 2020, 207, 118240. [Google Scholar] [CrossRef]
  7. Krawczyk, P.; Kurkus-Gruszecka, M.; Dzido, A.; Badyda, K. A method of designing an SNCR installation for small pulverized coal-fired boilers on the example of OP-50 boiler. Appl. Therm. Eng. 2023, 235, 121321. [Google Scholar] [CrossRef]
  8. Krawczyk, P.; Badyda, K.; Młynarz, S. Effect of the air to water ratio on the performance of internal mixing two-fluid atomiser. Chem. Process Eng. 2016, 37, 461–471. [Google Scholar] [CrossRef]
  9. Nguyen, T.D.B.; Kang, T.H.; Lim, Y.I.; Eom, W.H.; Kim, S.J.; Yoo, K.S. Application of urea-based SNCR to a municipal incinerator: On-site test and CFD simulation. Chem. Eng. J. 2009, 152, 36–43. [Google Scholar] [CrossRef]
  10. Xia, Z.; Li, J.; Wu, T.; Chen, C.; Zhang, X. CFD simulation of MSW combustion and SNCR in a commercial incinerator. Waste Manag. 2014, 34, 1609–1618. [Google Scholar] [CrossRef]
  11. Guo, Y.; Mu, B.; Liu, P.; Luo, L.; Hao, L.; Li, Y.; Zhu, T. Ammonia emission estimation for the cement industry in northern China. Atmos. Pollut. Res. 2020, 11, 1738–1742. [Google Scholar] [CrossRef]
  12. Fraysse, G.; Venditti, D.; Durécu, S. An innovative injection device to enhance NOx abatement by SNCR in waste combustion flue-gases. High Temp. Mater. Process. 2008, 27, 383–390. [Google Scholar] [CrossRef]
  13. Bai, J.; Lei, X.; Wang, Q. Modeling of SNCR denitration system based on adaptive weight particle swarm optimization. IOP Conf. Ser. Earth Environ. Sci. 2020, 467, 012118. [Google Scholar] [CrossRef]
  14. Li, F.; Brown, K.J.; Schick, R.J.; Shen, J. SNCR Efficiency Study of Optimization of Spray Systems in CFB. In Proceedings of the ILASS Americas 27th Annual Conference on Liquid Atomization and Spray Systems, Raleigh, NC, USA, 17–20 May 2015. [Google Scholar]
  15. Więckowski, Ł.; Krawczyk, P.; Badyda, K. Numerical investigation of temperature distribution in the furnace of a coal fired grate boiler in part load conditions. J. Power Technol. 2018, 97, 359–365. [Google Scholar]
  16. Świeboda, T.; Krzyżyńska, R.; Bryszewska-Mazurek, A.; Mazurek, W.; Czapliński, T.; Przygoda, A. Advanced approach to modeling of pulverized coal boilers for SNCR process optimization—Review and recommendations. Int. J. Thermofluids 2020, 7–8, 100051. [Google Scholar] [CrossRef]
  17. Hu, Z.; Jiang, E.; Ma, X. Numerical simulation on operating parameters of SNCR process in a municipal solid waste incinerator. Fuel 2019, 245, 160–173. [Google Scholar] [CrossRef]
  18. Scharler, R.; Obernberger, I. Numerical modelling of biomass grate furnaces. In Proceedings of the 5th European Conference on Industrial Furnaces and Boilers, Porto, Portugal, 11–14 April 2000. 17p. [Google Scholar]
  19. Gómez, M.A.; Porteiro, J.; Patiño, D.; Míguez, J.L. CFD modelling of thermal conversion and packed bed compaction in biomass combustion. Fuel 2014, 117, 716–732. [Google Scholar] [CrossRef]
  20. Sonawane, U.; Agarwal, A.K. Spray Breakup Modelling for Internal Combustion Engines. In Engine Modeling and Simulation; Springer: Berlin/Heidelberg, Germany, 2022; pp. 57–85. [Google Scholar] [CrossRef]
  21. Krawczyk, P.; Badyda, K. Numerical analysis of the impact of parameters of urea solution injection on reagent penetration inside the combustion chamber of A WR 25 boiler. Rynek Energii 2014, 115, 139–145. [Google Scholar] [CrossRef]
  22. ur Rahman, Z.; Wang, X.; Zhang, J.; Baleta, J.; Vujanović, M.; Tan, H. Kinetic study and optimization on SNCR process in pressurized oxy-combustion. J. Energy Inst. 2021, 94, 263–271. [Google Scholar] [CrossRef]
  23. Hernik, B. Numerical Research of Flue Gas Denitrification Using the SNCR Method in an OP 650 Boiler. Energies 2022, 15, 3427. [Google Scholar] [CrossRef]
  24. Liu, Y.; Kao, H. Numerical simulation of urea based SNCR process in a trinal-sprayed precalciner. J. Renew. Mater. 2021, 9, 269–294. [Google Scholar] [CrossRef]
  25. Park, P.M.; Park, Y.K.; Dong, J.I. Reaction characteristics of NOx and N2O in selective non-catalytic reduction using various reducing agents and additives. Atmosphere 2021, 12, 1175. [Google Scholar] [CrossRef]
Figure 1. Scheme of the analyzed boiler—WR-25.
Applsci 14 08508 g001
Figure 2. Boiler geometry with boundary conditions.
Applsci 14 08508 g002
Figure 3. Mesh used for analyzed cases, with visible refinement in the reagent injection zones.
Applsci 14 08508 g003
Figure 4. Flue gas temperature distribution as a function of boiler height. Load: 15 MW.
Applsci 14 08508 g004
Figure 5. Flue gas temperature distribution as a function of boiler height. Load: 29 MW.
Applsci 14 08508 g005
Figure 6. Lances’ distribution scheme with locations marked in blue (left) and built-in application ports for injection lances (right).
Applsci 14 08508 g006
Figure 7. Feed and distribution module.
Applsci 14 08508 g007
Figure 8. Selected nozzle tips tested: single- and three-hole.
Applsci 14 08508 g008
Figure 9. Boiler profile with an indication of the sampling point for flue gas composition analysis.
Applsci 14 08508 g009
Figure 10. Reduction rate as a function of reagent excess ratio.
Applsci 14 08508 g010
Figure 11. Reagent droplets colored by temperature.
Applsci 14 08508 g011
Figure 12. Reagent droplets (blue) on the background of optimal temperature window and iso-surfaces of visible temperature (orange—1100 °C, yellow—900 °C).
Applsci 14 08508 g012
Figure 13. Iso-surfaces of urea concentration (blue) on the background of optimal temperature window and iso-surfaces of visible temperature (orange—1100 °C, yellow—900 °C).
Applsci 14 08508 g013
Figure 14. NOx reduction as a function of NSR for different boiler outputs.
Applsci 14 08508 g014
Figure 15. NOx reduction as a function of boiler output for different NSR values.
Applsci 14 08508 g015
Figure 16. NOx reduction as a function of NSR for different injection lance nozzle designs.
Applsci 14 08508 g016
Figure 17. Photographs of the reagent spray jet in the boiler. The 3-hole nozzle (left side) and 2-hole nozzle (right side).
Applsci 14 08508 g017
Figure 18. NOx reduction as a function of NSR for different nozzle designs in the injection lance.
Applsci 14 08508 g018
Figure 19. NOx reduction as a function of NSR for different reagent concentrations.
Applsci 14 08508 g019
Table 2. Fuel composition.
Carbon (C)0.550
Hydrogen (H)0.035
Oxygen (O)0.115
Nitrogen (N)0.020
Sulphur (S)0.010
Ash0.135
Moisture (H2O)0.135
Volatile matter0.32
Fixed carbon0.41
Disclaimer/Publisher’s Note: The statements, opinions and data contained in all publications are solely those of the individual author(s) and contributor(s) and not of MDPI and/or the editor(s). MDPI and/or the editor(s) disclaim responsibility for any injury to people or property resulting from any ideas, methods, instructions or products referred to in the content.

