
Innovating Statistics Education: The Design of a Novel App Using Design Thinking

 ,
,  , ,
, ,
Abstract
:1. Introduction
2. Theoretical Background
2.1. Teaching Statistics in Higher Education
2.2. Information Technologies in Education
- It generates greater interaction and participation from students: for example, mobile applications and video games can engage students more actively and participatively in their learning process, which can increase their motivation and commitment to the subject being taught [19].
- It fosters autonomous learning: technologies can allow students to learn at their own pace and in their own time, which can be especially useful for those with different learning styles or learning difficulties [20].
- It is possible to create simulations and visualizations: for example, mobile applications and video games can include interactive simulations and visualizations that help students understand abstract concepts more concretely and easily.
- Immediate feedback can be provided: technologies can provide immediate feedback to students on their performance, allowing them to correct errors and improve their understanding of descriptive statistics concepts.
2.3. Technology in Teaching and Learning Statistics
2.4. User-Centered Approach to Develop New Applications
- Designing for diversity. Users of a platform may have different needs and abilities. The design should be inclusive and accessible to all students, including those with disabilities [29].
- Designing for retention. Students may have difficulty retaining information in an online environment. The design should include strategies to increase information retention, such as gamification and interactivity [29].
- Improving user motivation. Motivation is essential for effective learning. The design should include features that increase user motivation, such as immediate feedback and personalization of the learning experience [29].
2.5. Related Work
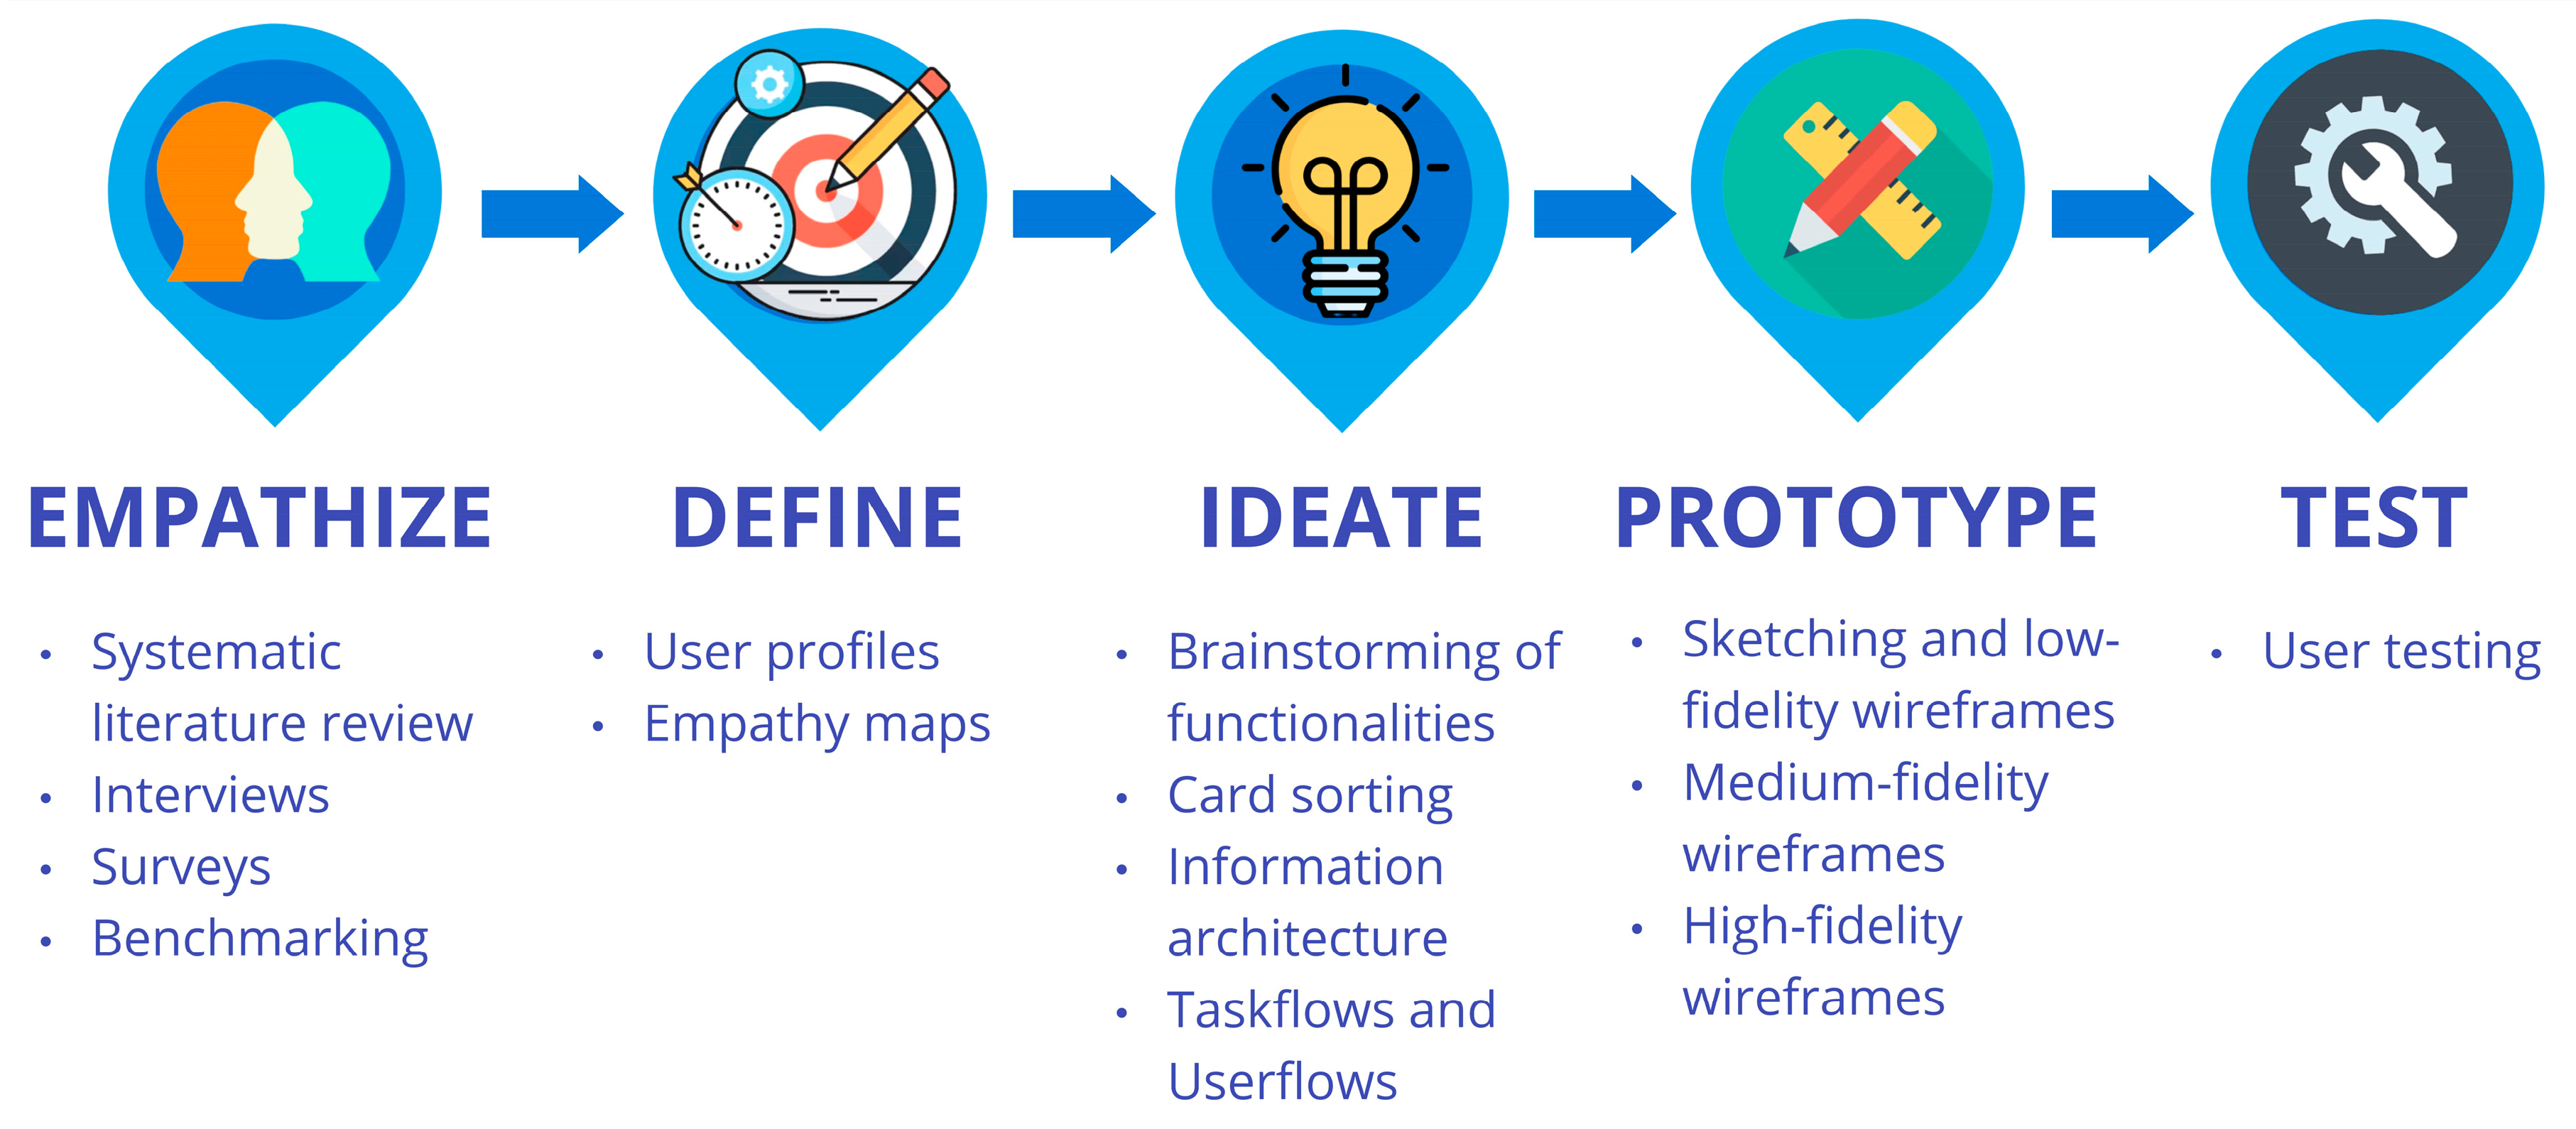
3. Methodology
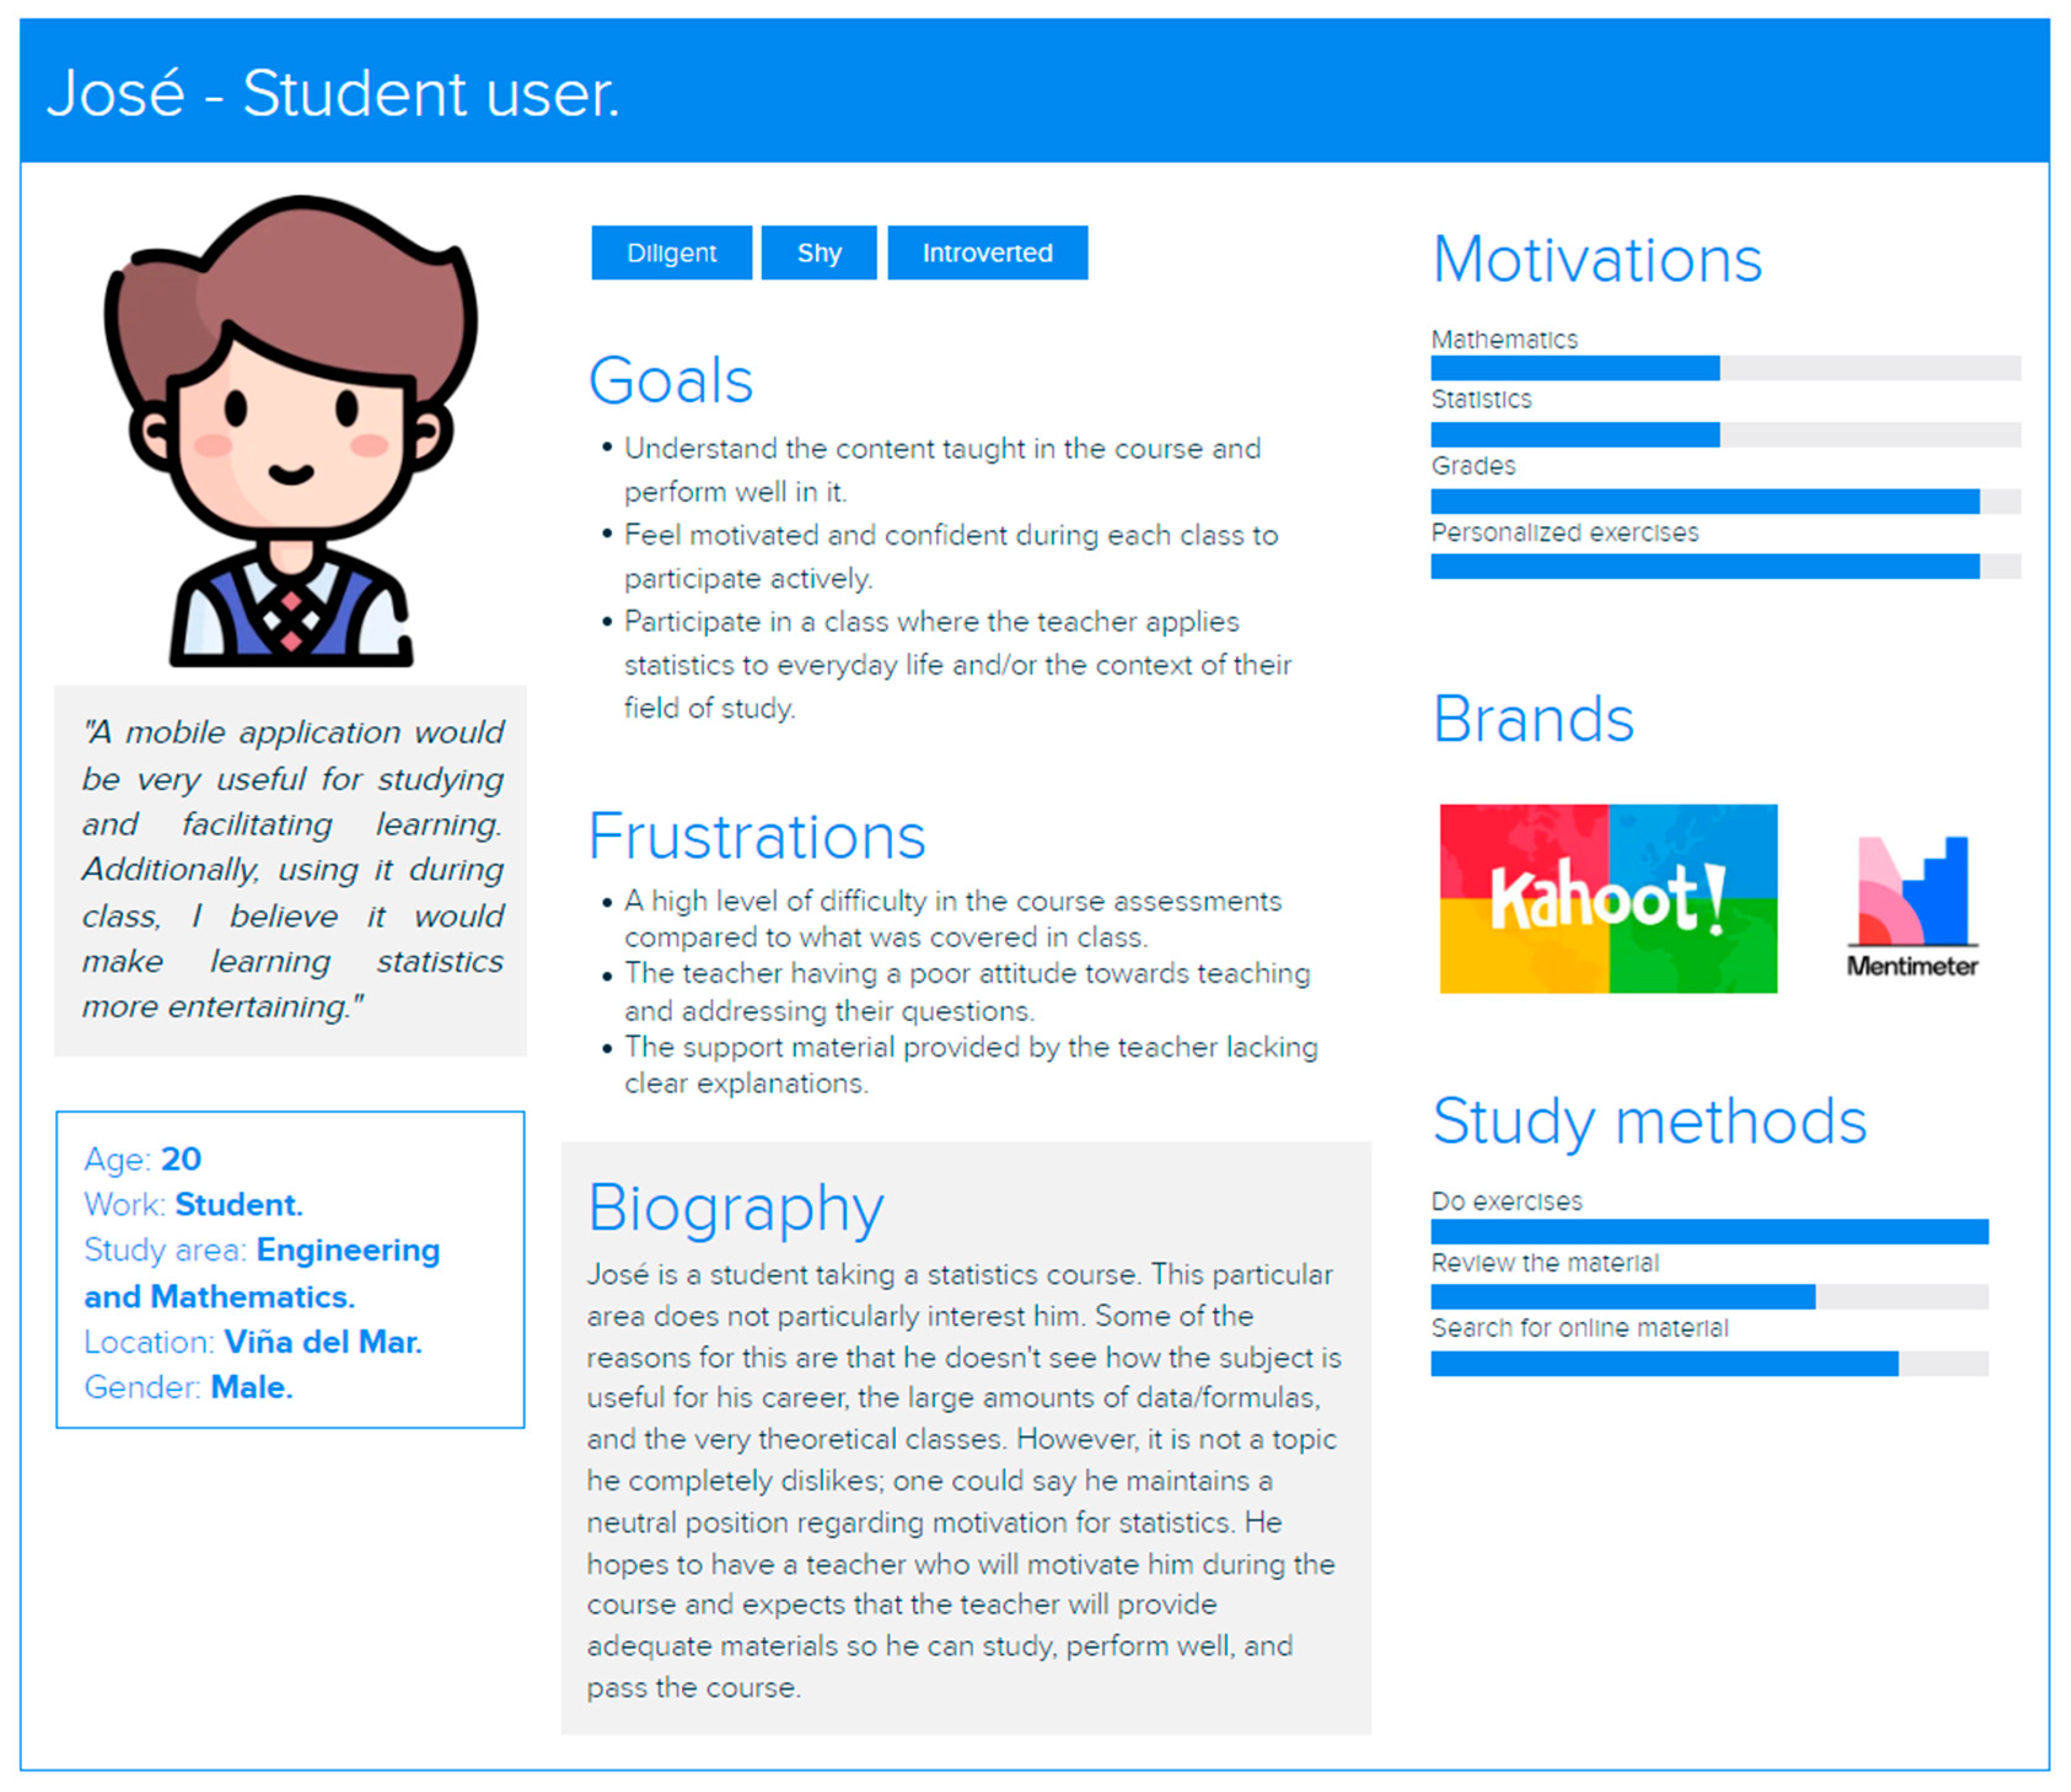
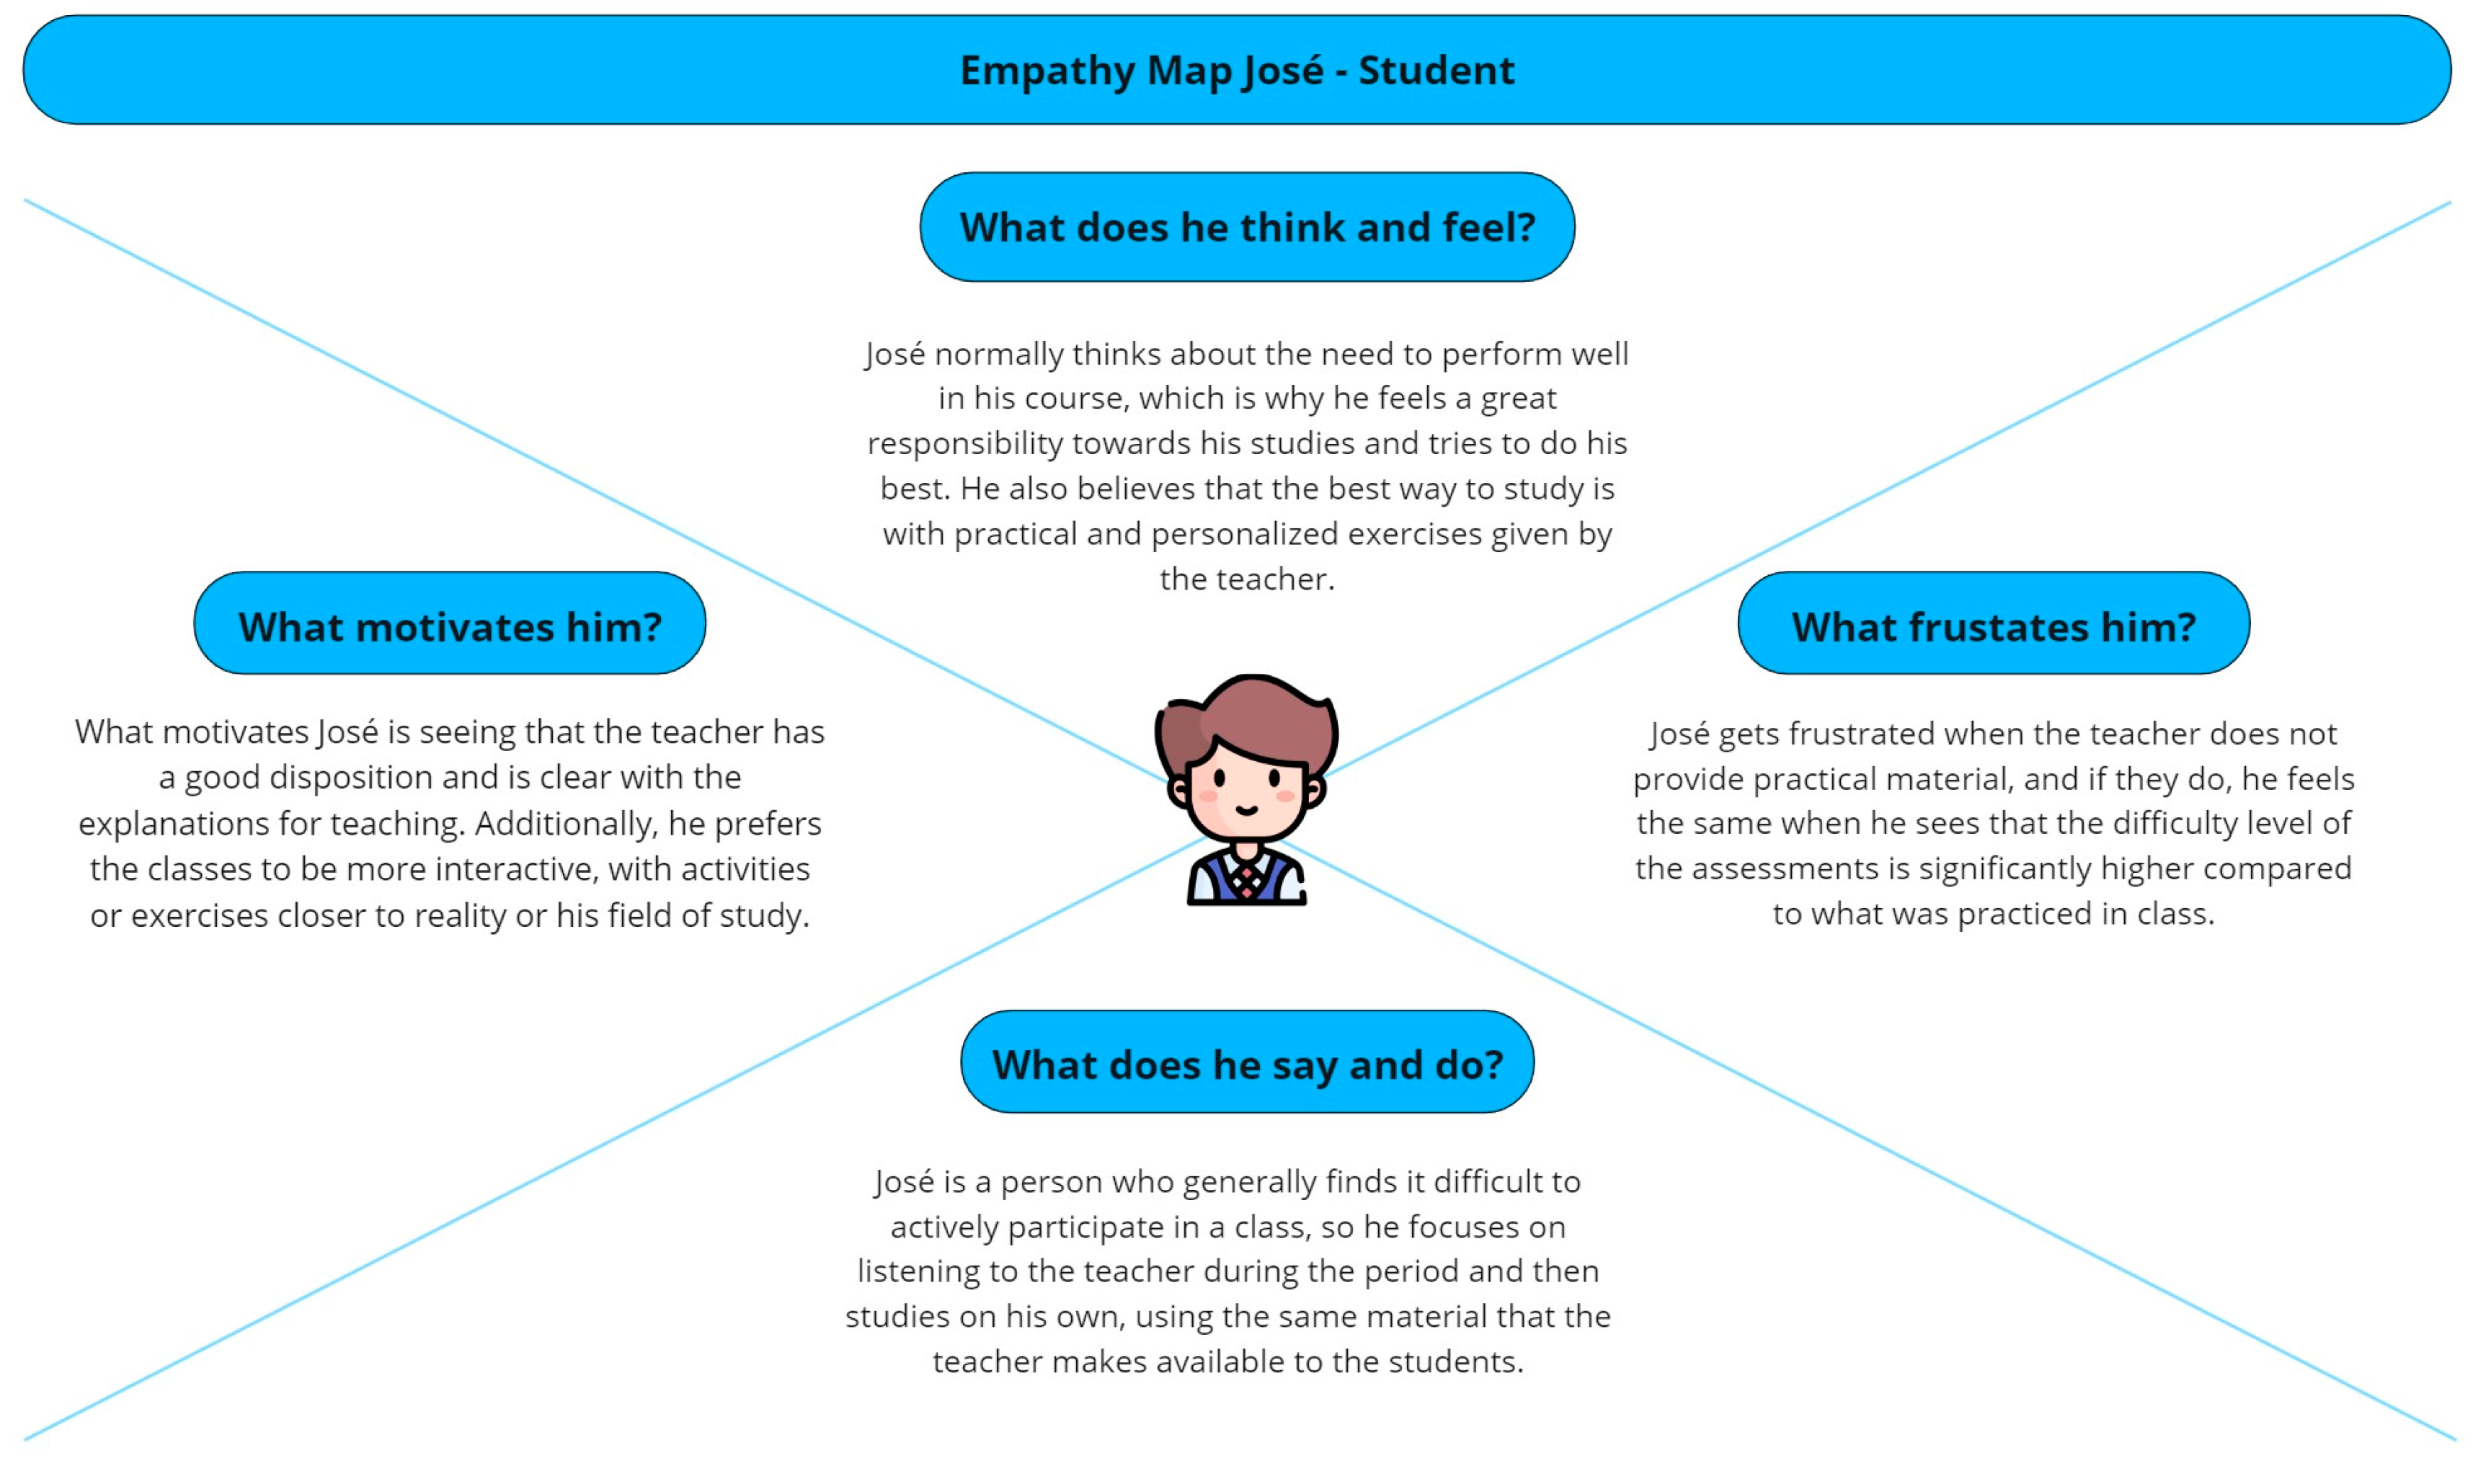
- Empathize: This stage involves researching end users to identify their characteristics, expectations, needs, and difficulties in performing their tasks. The goal is to deeply understand the people for whom the product is developed, including their objectives, problems, limitations, desires, and emotions, as well as the context in which their actions occur, to design solutions that adequately respond to their needs.
- Define: This stage involves analyzing previously collected data to identify patterns and issues, which allows for a clear detailing of the difficulties and frustrations users face when trying to achieve their goals. The aim is to establish a detailed panorama of the problems, needs, and expectations of the users, providing a solid basis for defining the design requirements of the software product.
- Ideate: This stage focuses on generating a wide range of ideas and potential solutions to previously identified problems. The team promotes dynamics to create innovative ideas about the software product and its interaction, exploring various options without initially judging them. Then, the best proposal is selected, or a solution is developed that integrates the best features of the ideas developed.
- Prototype: This stage involves building tangible and simplified versions of the selected ideas, such as sketches or wireframes, to explore how they might work in practice. These prototypes allow for identifying design issues and making modifications before reaching the final solution, ensuring that the interfaces are usable, attractive, and aligned with user objectives. This facilitates the correction of design aspects without significantly affecting the project’s development.
- Test: This stage focuses on evaluating the designed prototypes to obtain feedback and verify if they meet the needs and expectations of the users. Through these tests, the team gathers valuable information to correct and refine the prototypes until they reach the final proposal. Tests are conducted both with initial sketches and more elaborate prototypes, allowing for the fidelity to be raised and adjustments to be made efficiently and economically before the final implementation.
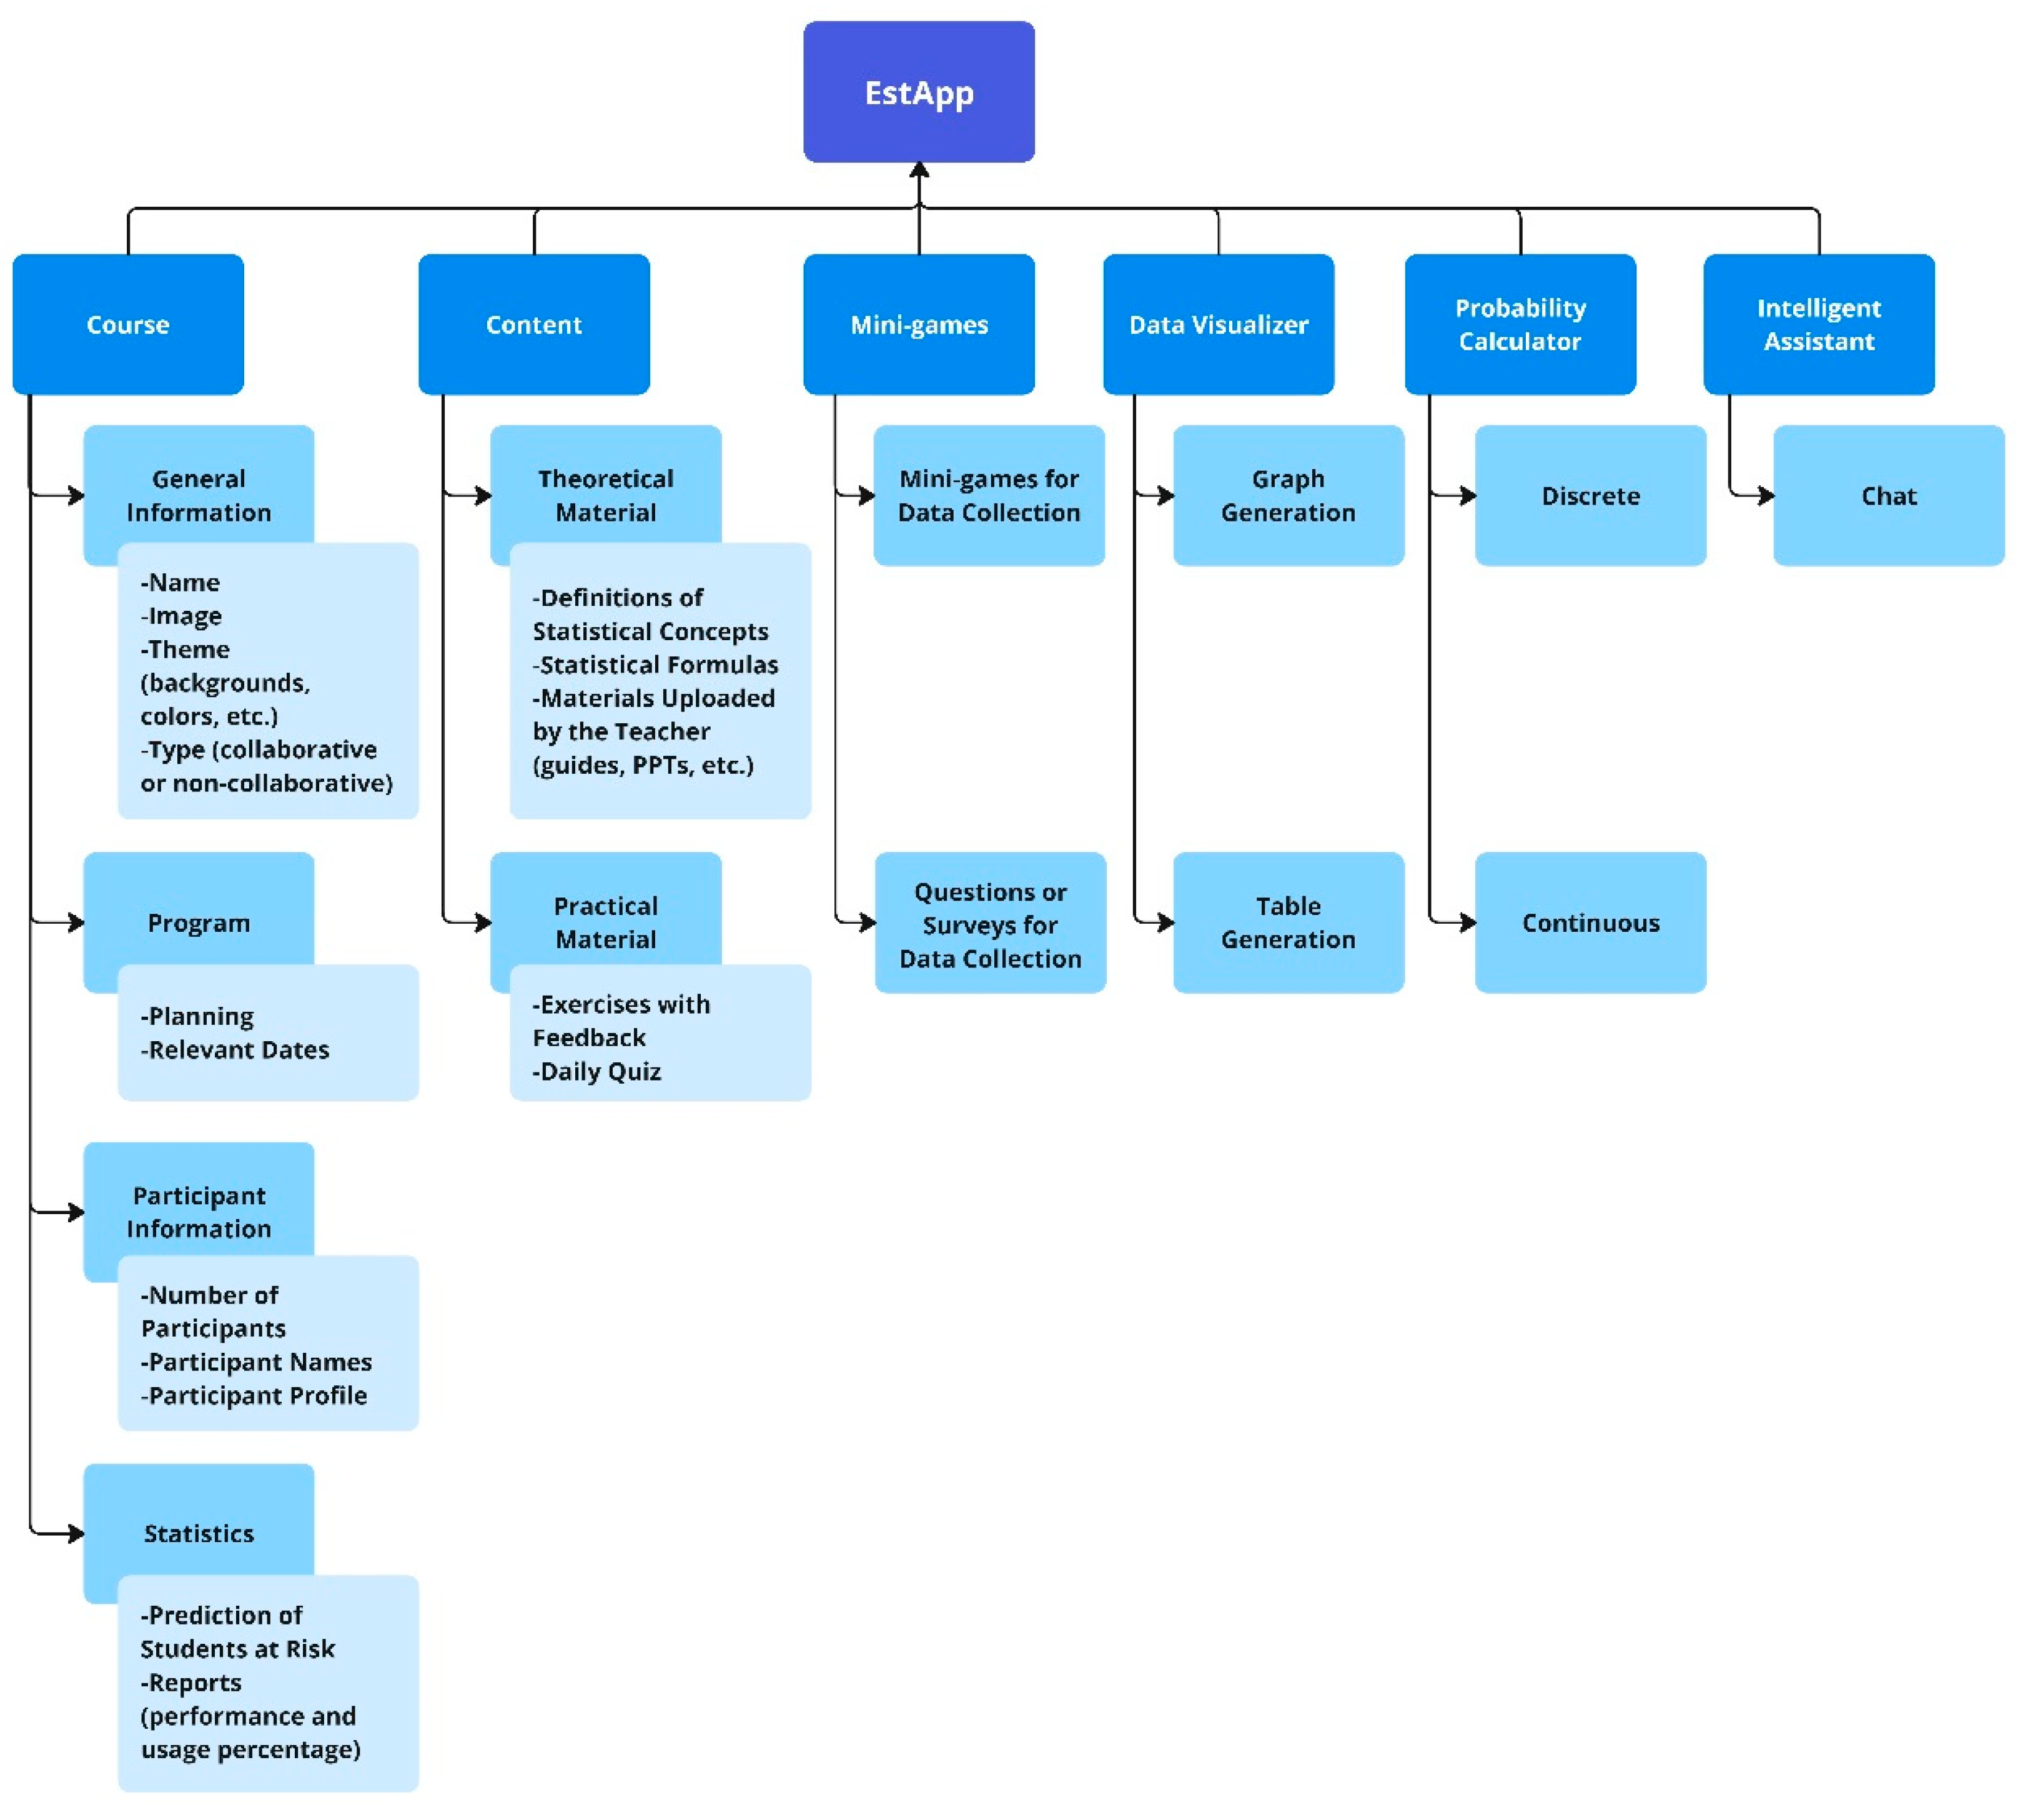
4. EstApp Design Process
4.1. Empathize Phase: Activities and Results
- Usability: high level (intuitive and easy-to-use interface), medium level (slightly confusing interface), low level (non-intuitive interface, difficult to use).
- Language: high level (use of non-technical language that is easy to understand for non-experts), medium level (use of some technical concepts to explain), low level (use of technical and specific language, difficult to understand for those who do not know statistics).
- Design: high level (pleasant and aesthetic interface), medium level (interface with some visually annoying elements), low level (unattractive and unfriendly interface for the user).
4.2. Define Phase: Activities and Results
4.3. Ideate Phase: Activities and Results
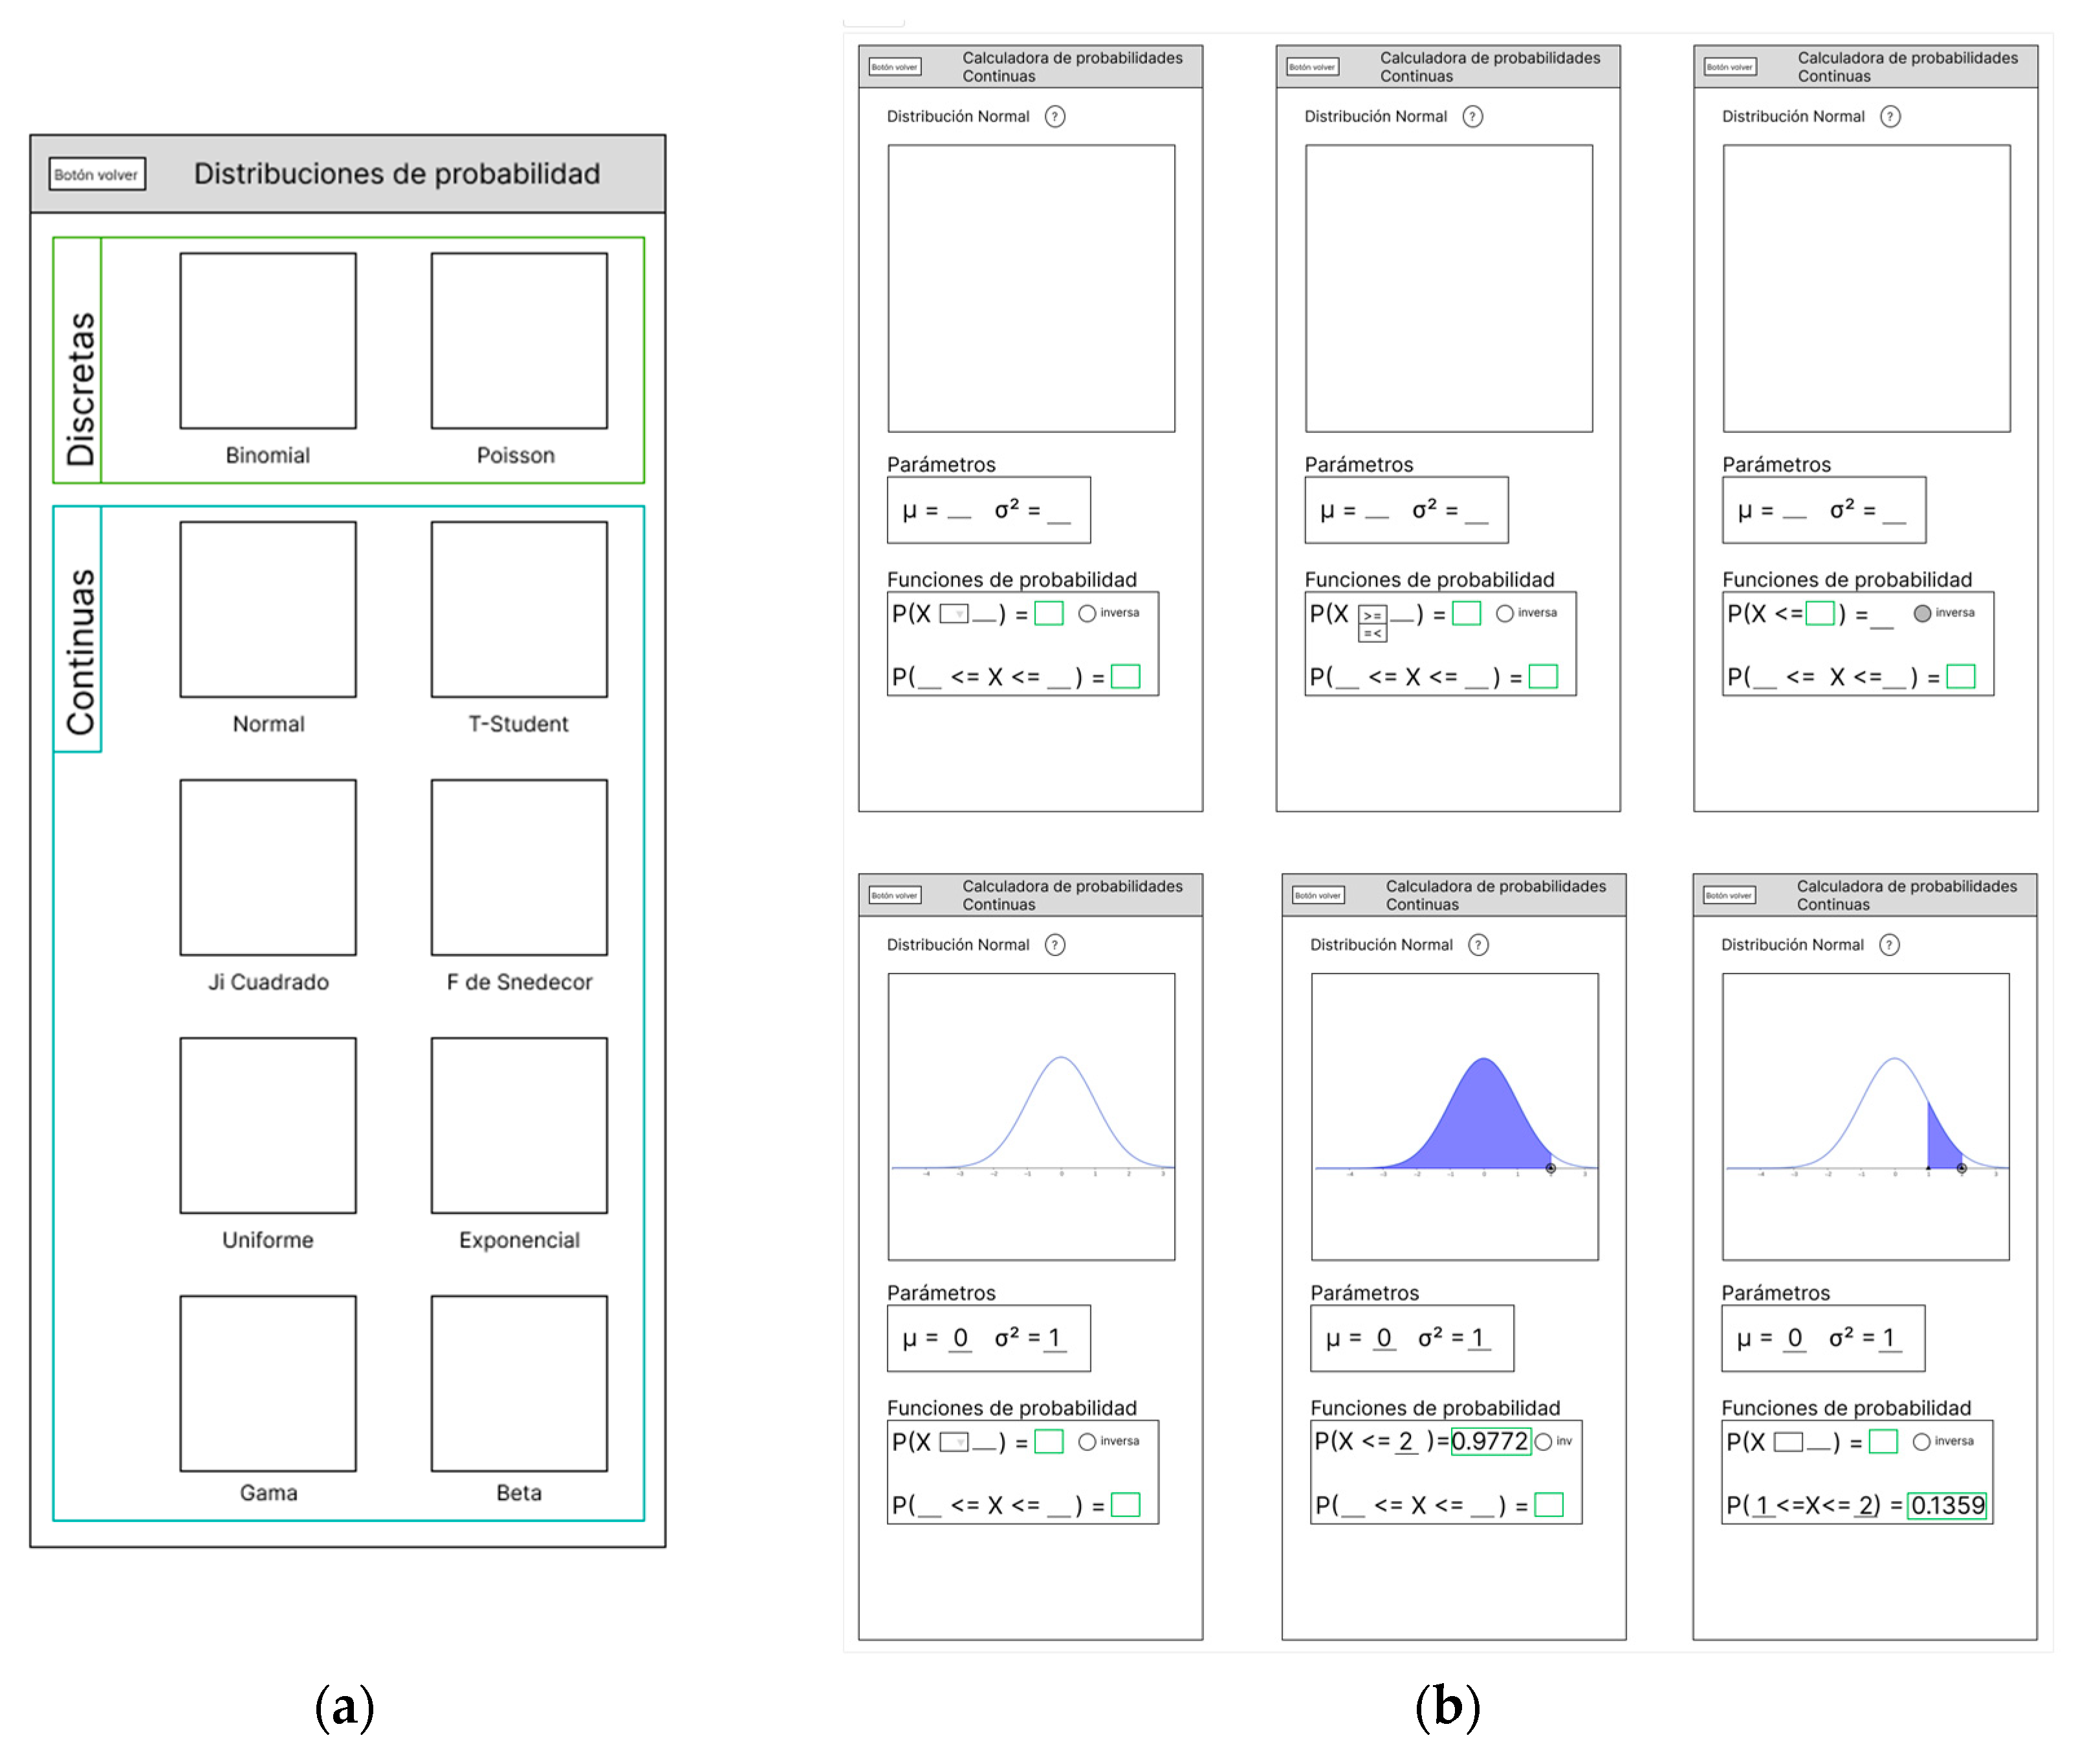
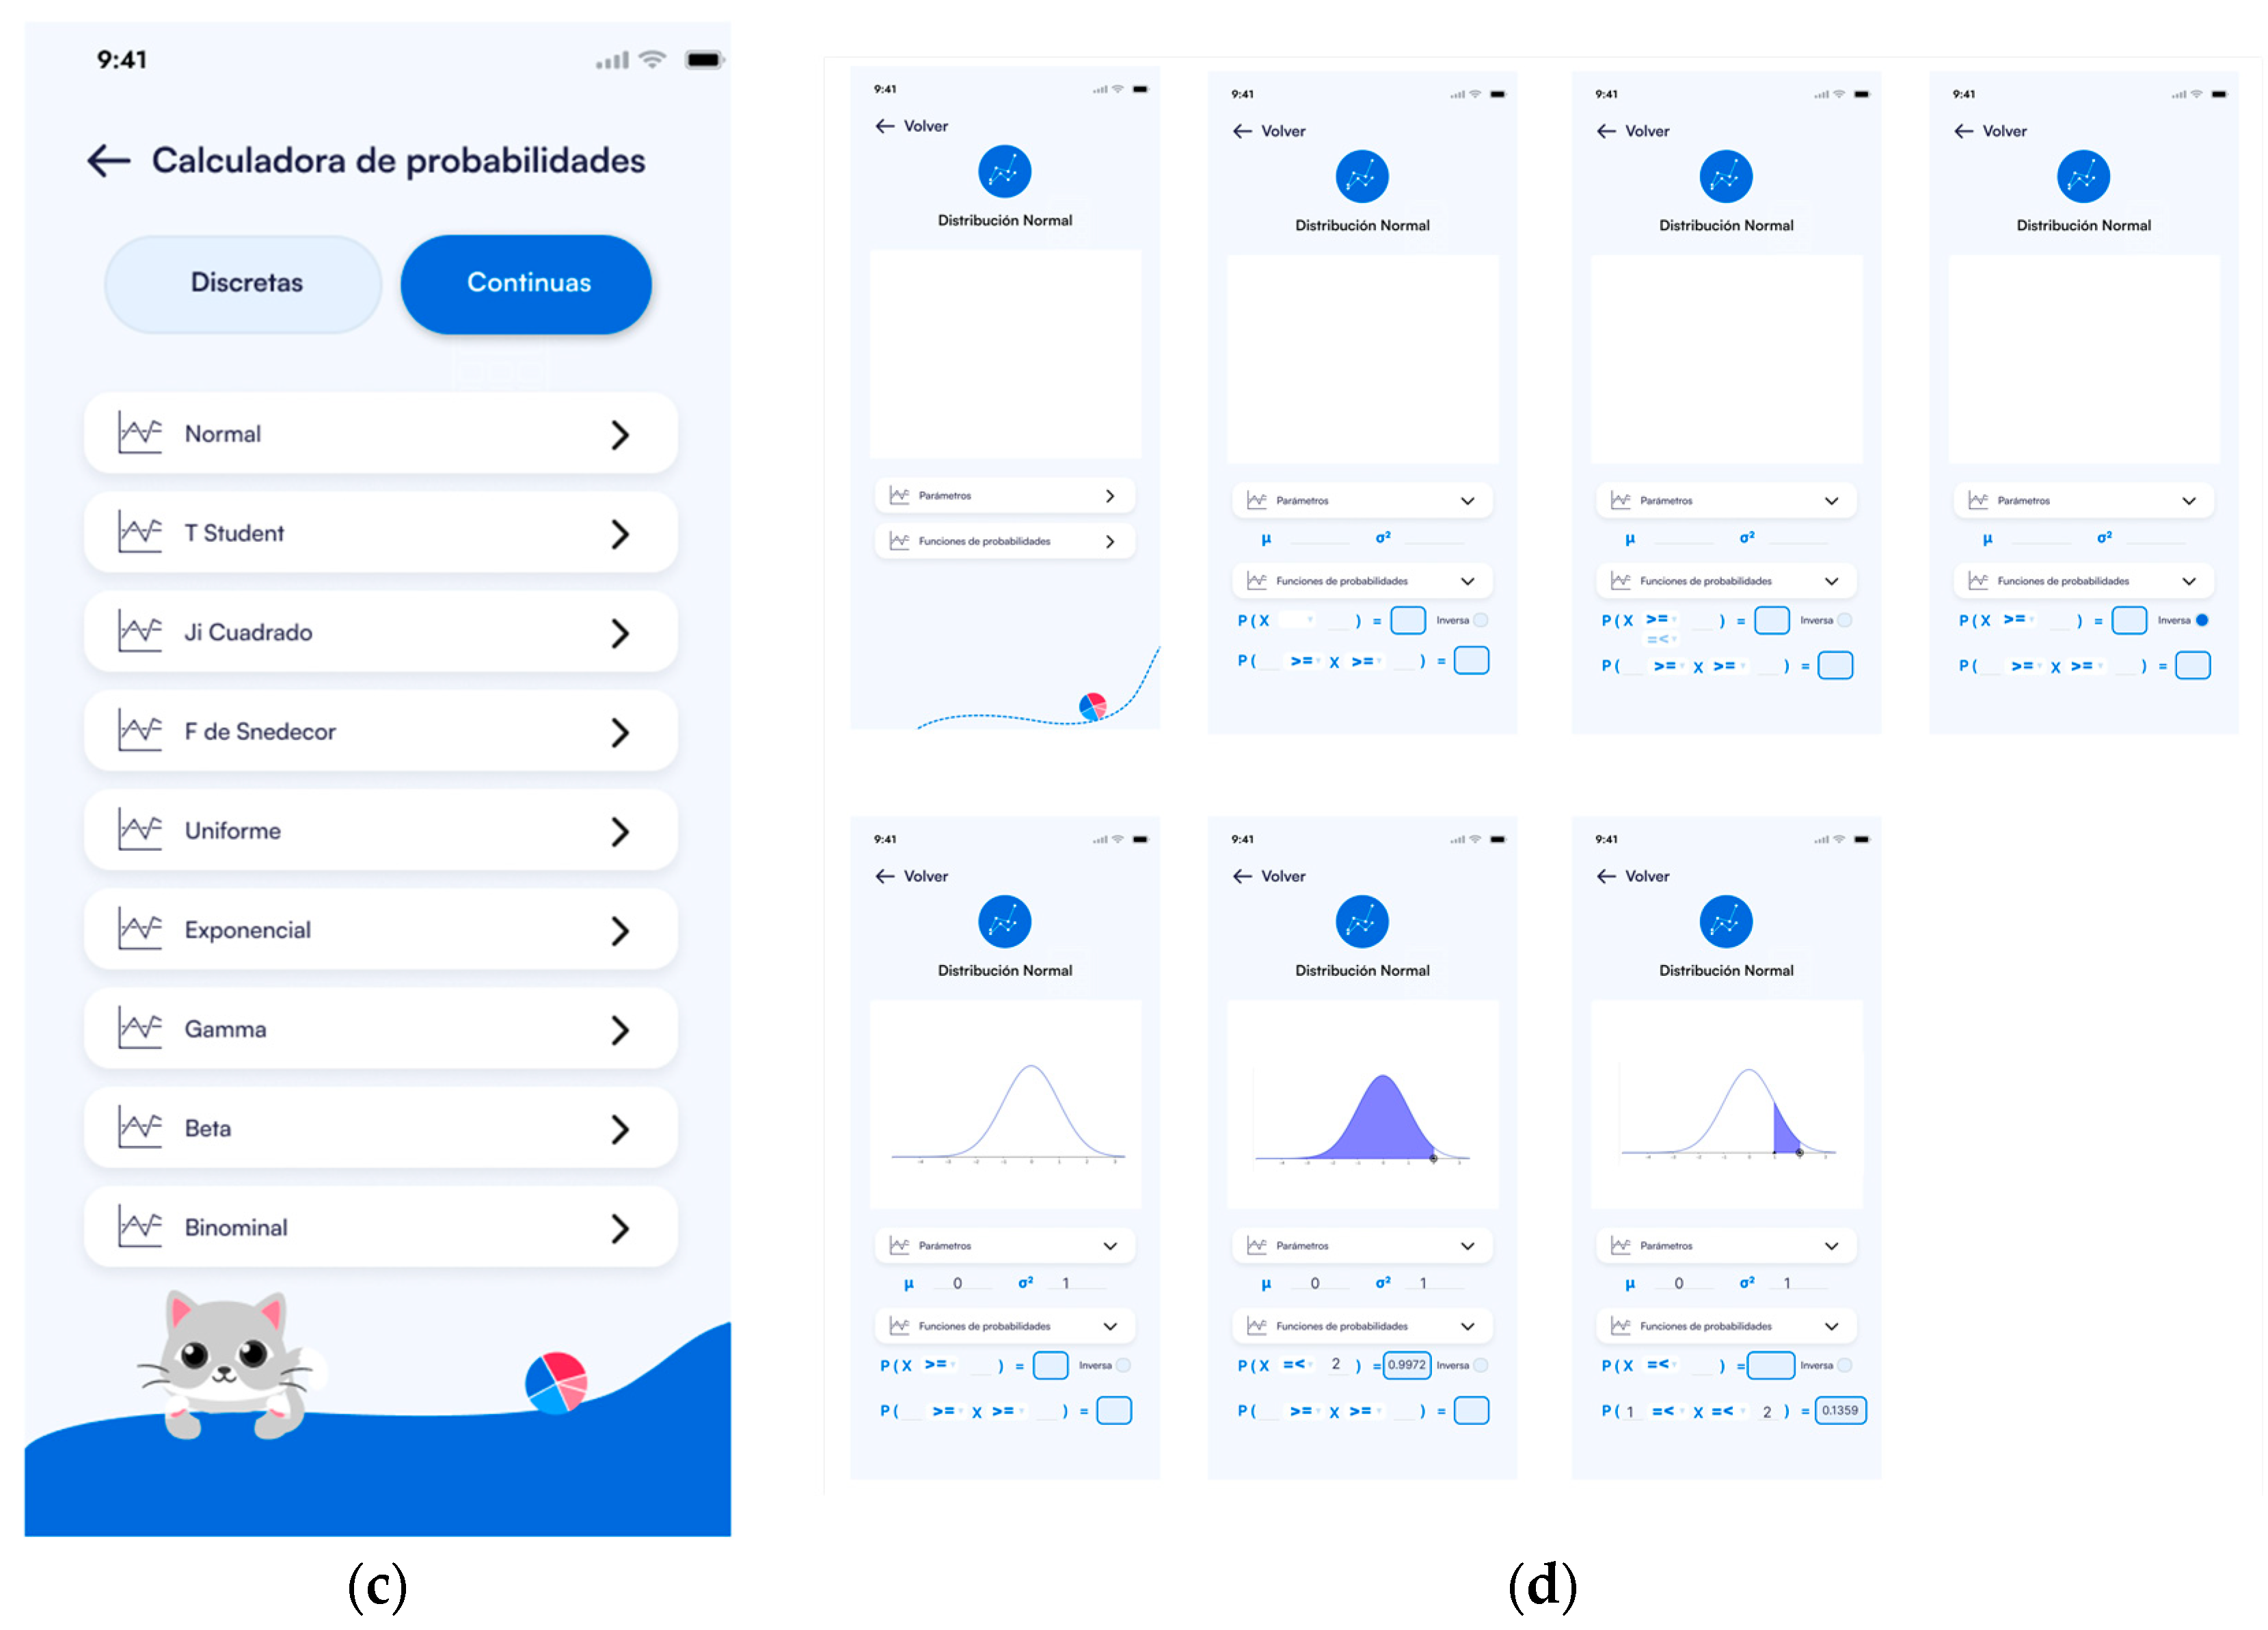
4.4. Prototype Phase: Activities and Results
4.5. Test Phase: Activities and Results
- P1: Do you think the functionalities of the application are easy to use? (Likert-type question, scale from 1: very difficult to 7: very easy.)
- P2: Do you think the functionalities of the application are useful? (Likert-type question, scale from 1: very useless to 7: very useful.)
- P3: How do you feel about the amount of information displayed on each view/screen? (Open-ended question.)
- P4: What would you suggest improving the application? (Open-ended question.)
- P5: Do you think the application could be useful for probability and statistics subjects? Why? (Open-ended question.)
5. Results: EstApp
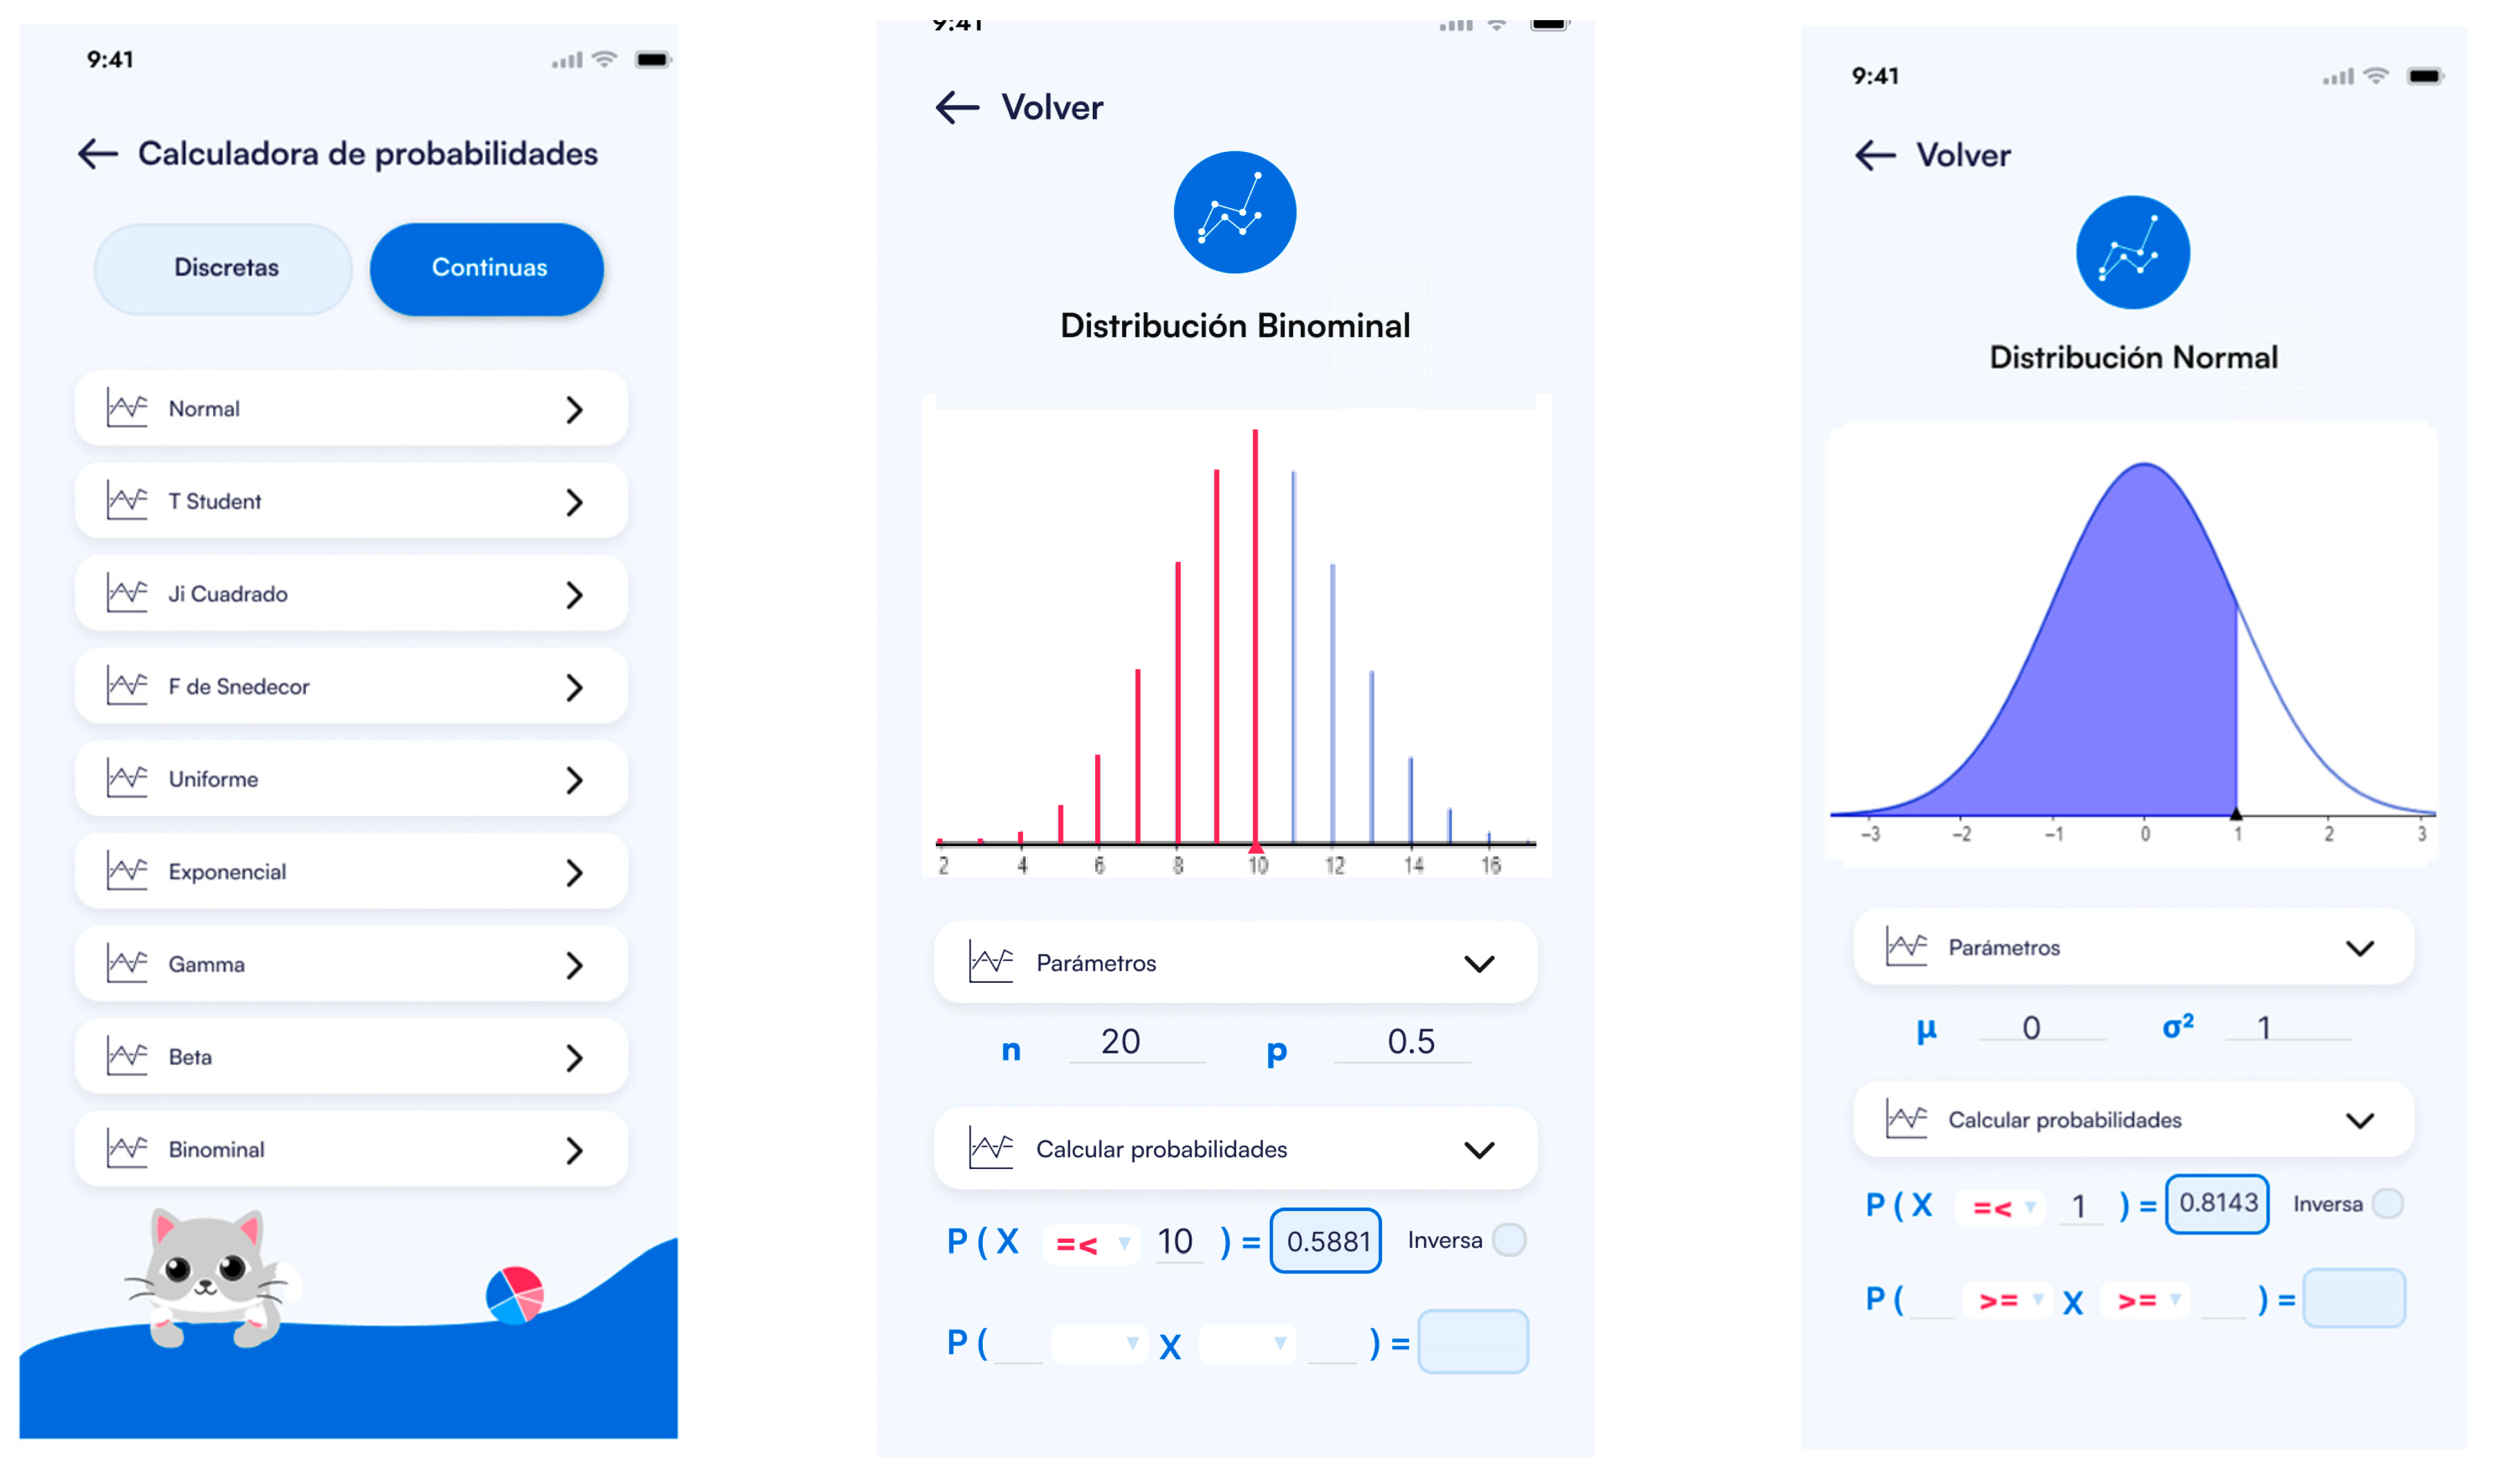
5.1. Probability Calculator
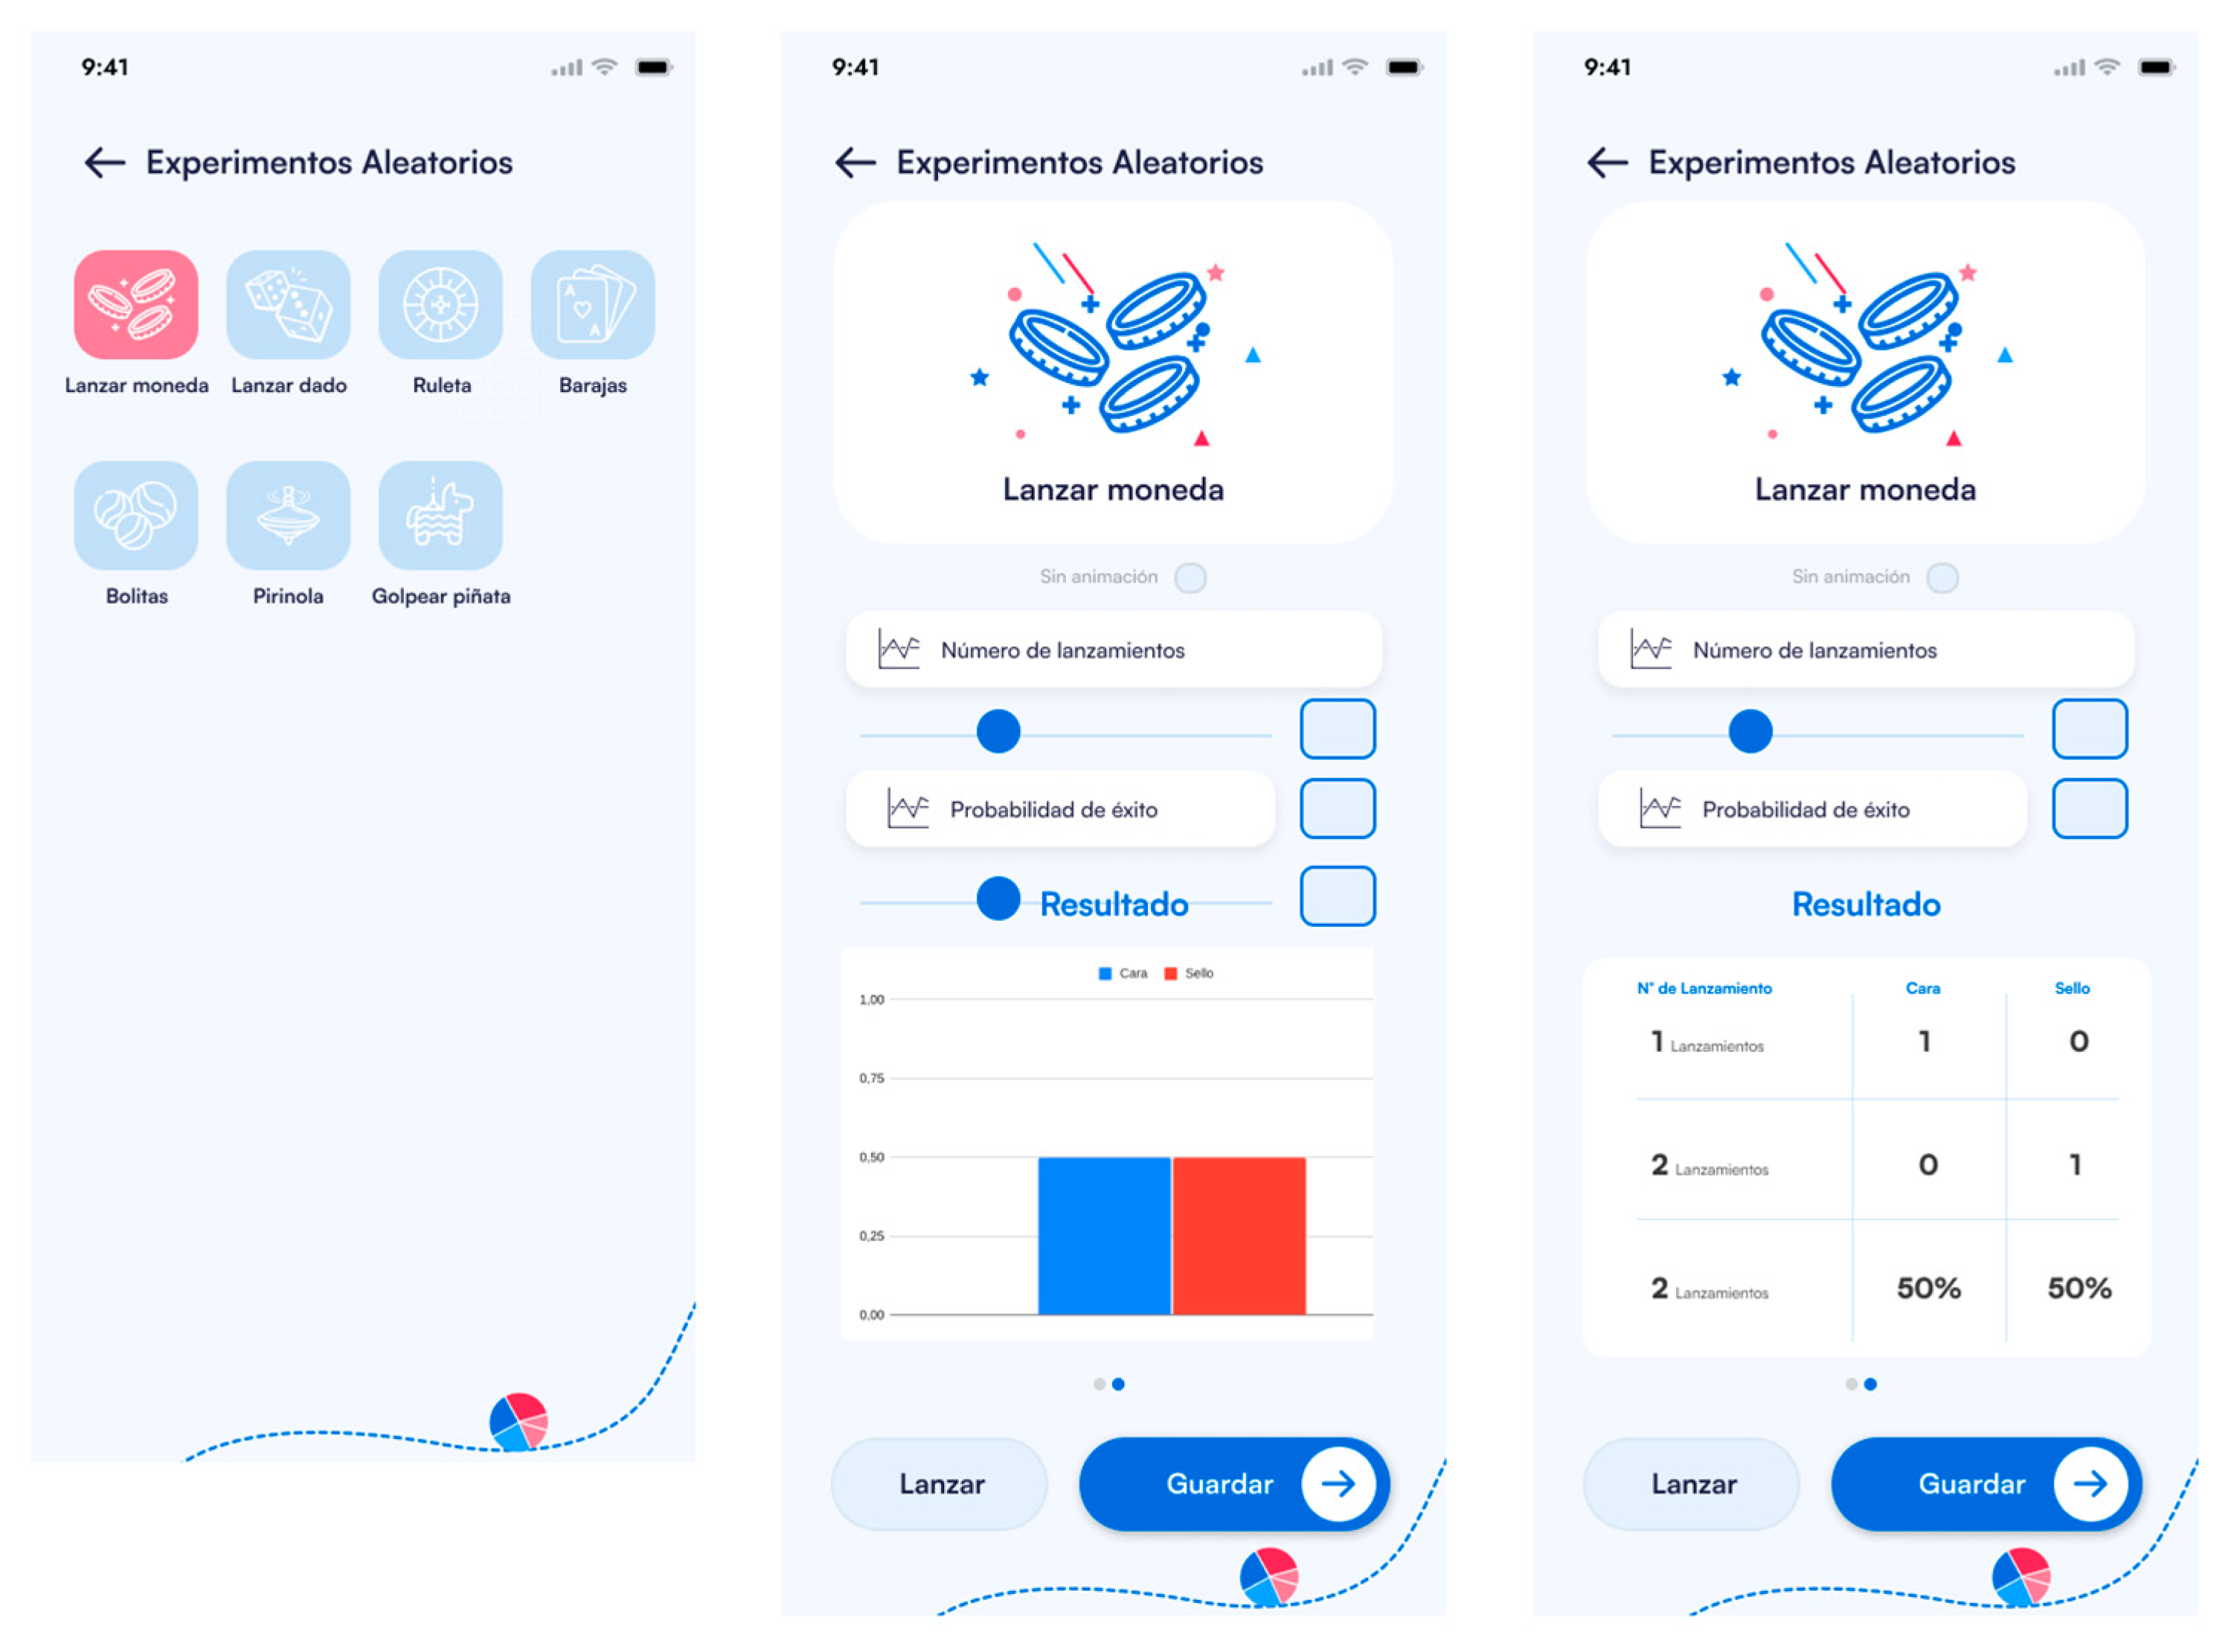
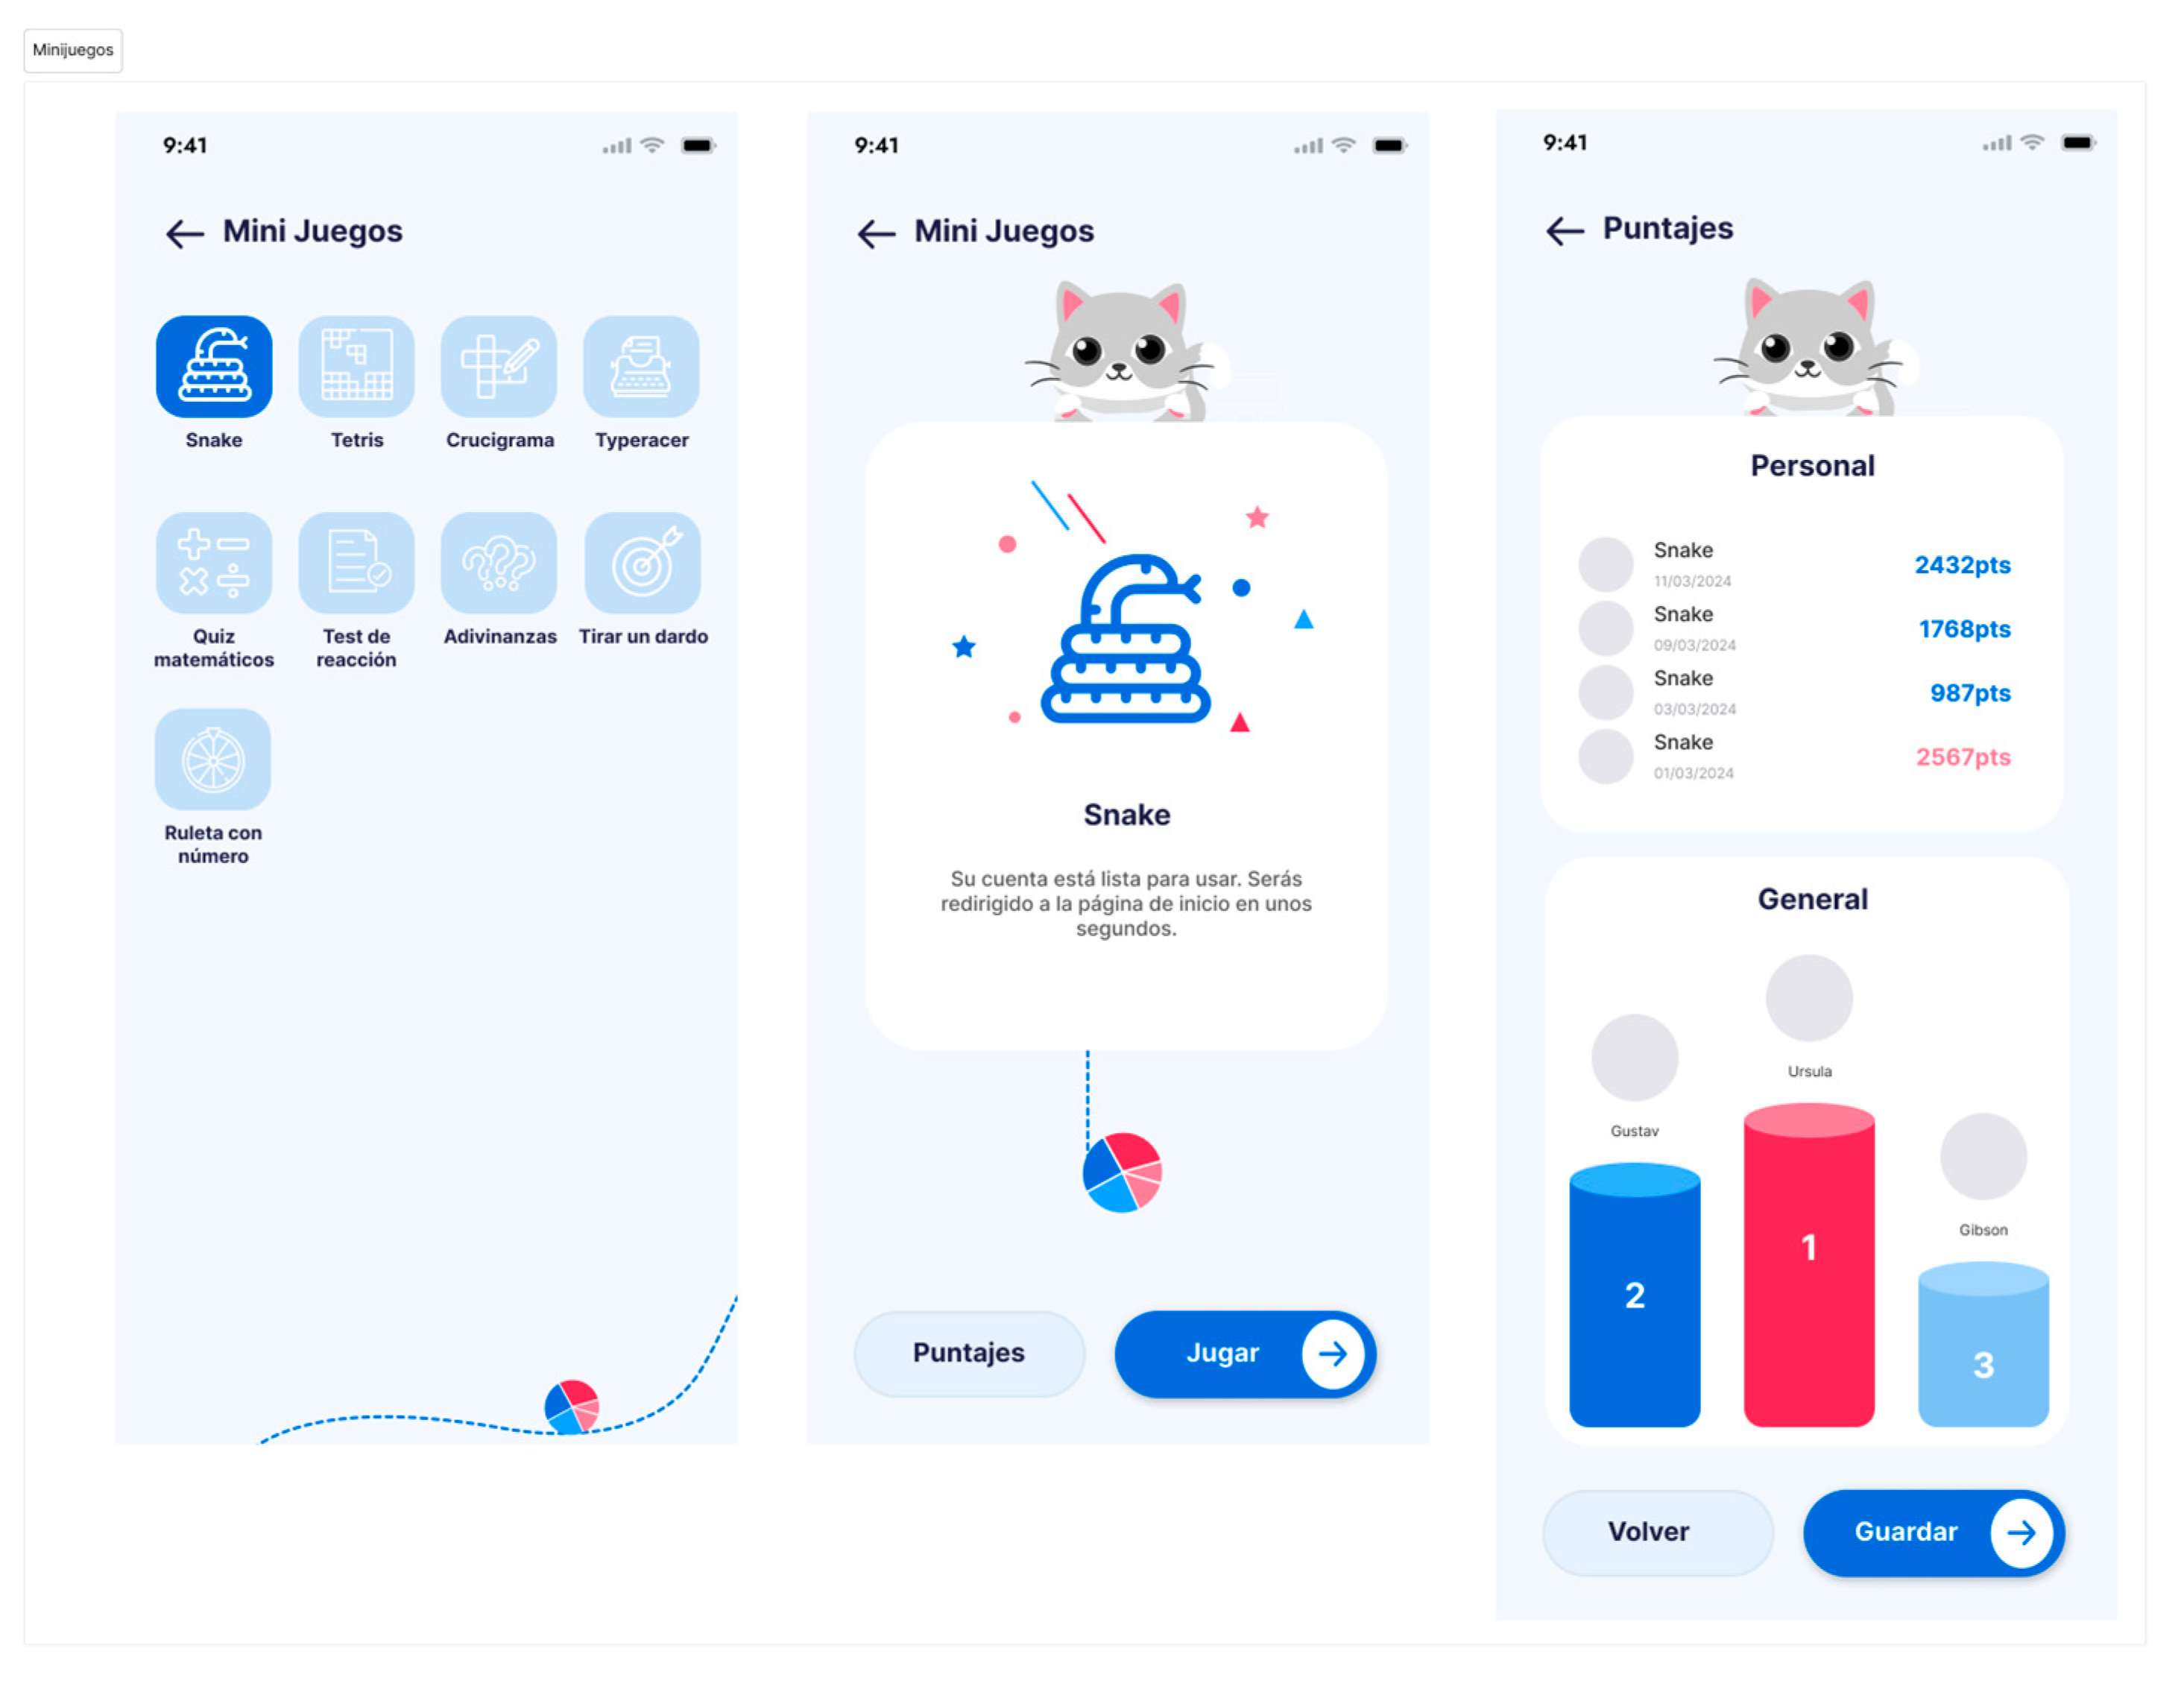
5.2. Data Generator
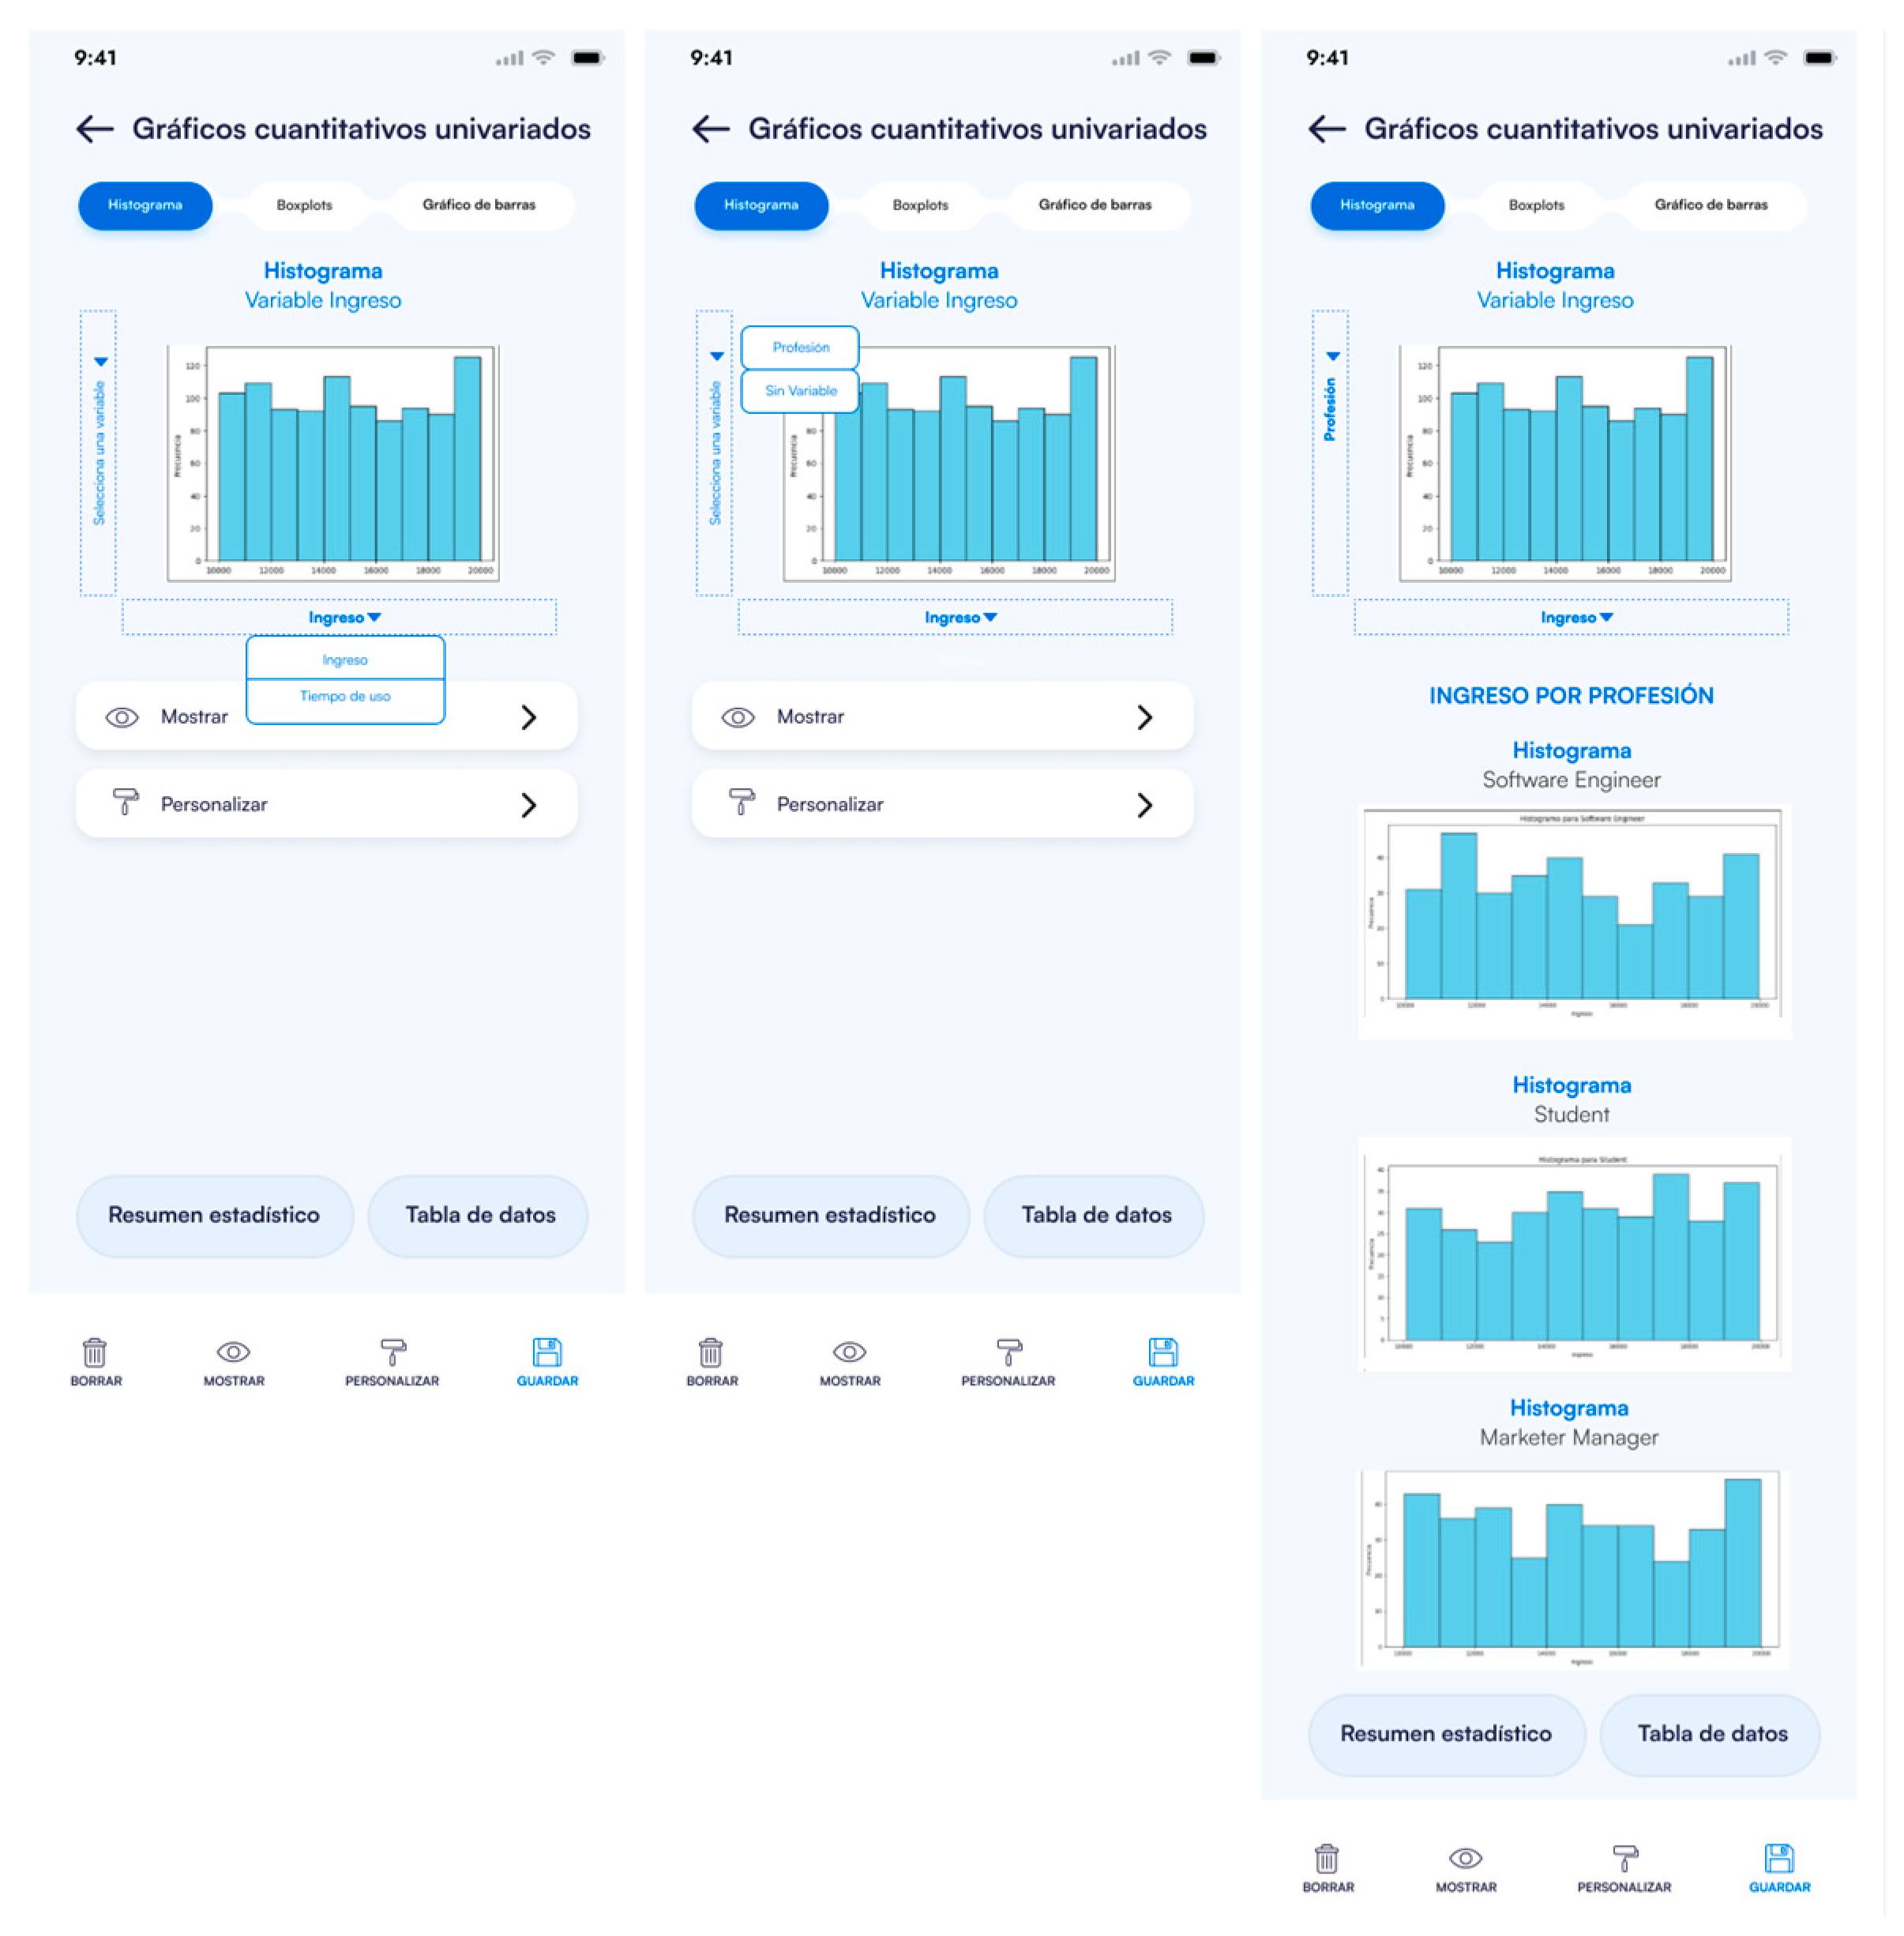
5.3. Data Visualizer
5.4. AI Tutor and Report Generation
6. Discussions
6.1. EstApp’s Functionalities and Their Impact on Education
6.2. The Iterative Process for Designing “EstApp”
6.3. Lessons Learned and Challenges Encountered
6.4. Limitations and Opportunities for Improvement
7. Conclusions and Future Work
Author Contributions
Funding
Institutional Review Board Statement
Informed Consent Statement
Data Availability Statement
Acknowledgments
Conflicts of Interest
Appendix A. Empathize Phase—Interview

| User Profile | Background Questions | “About Experience” Questions |
|---|---|---|
| Students |
|
|
| Professors |
|
|
Appendix B. Ideation Phase—Brainstorming
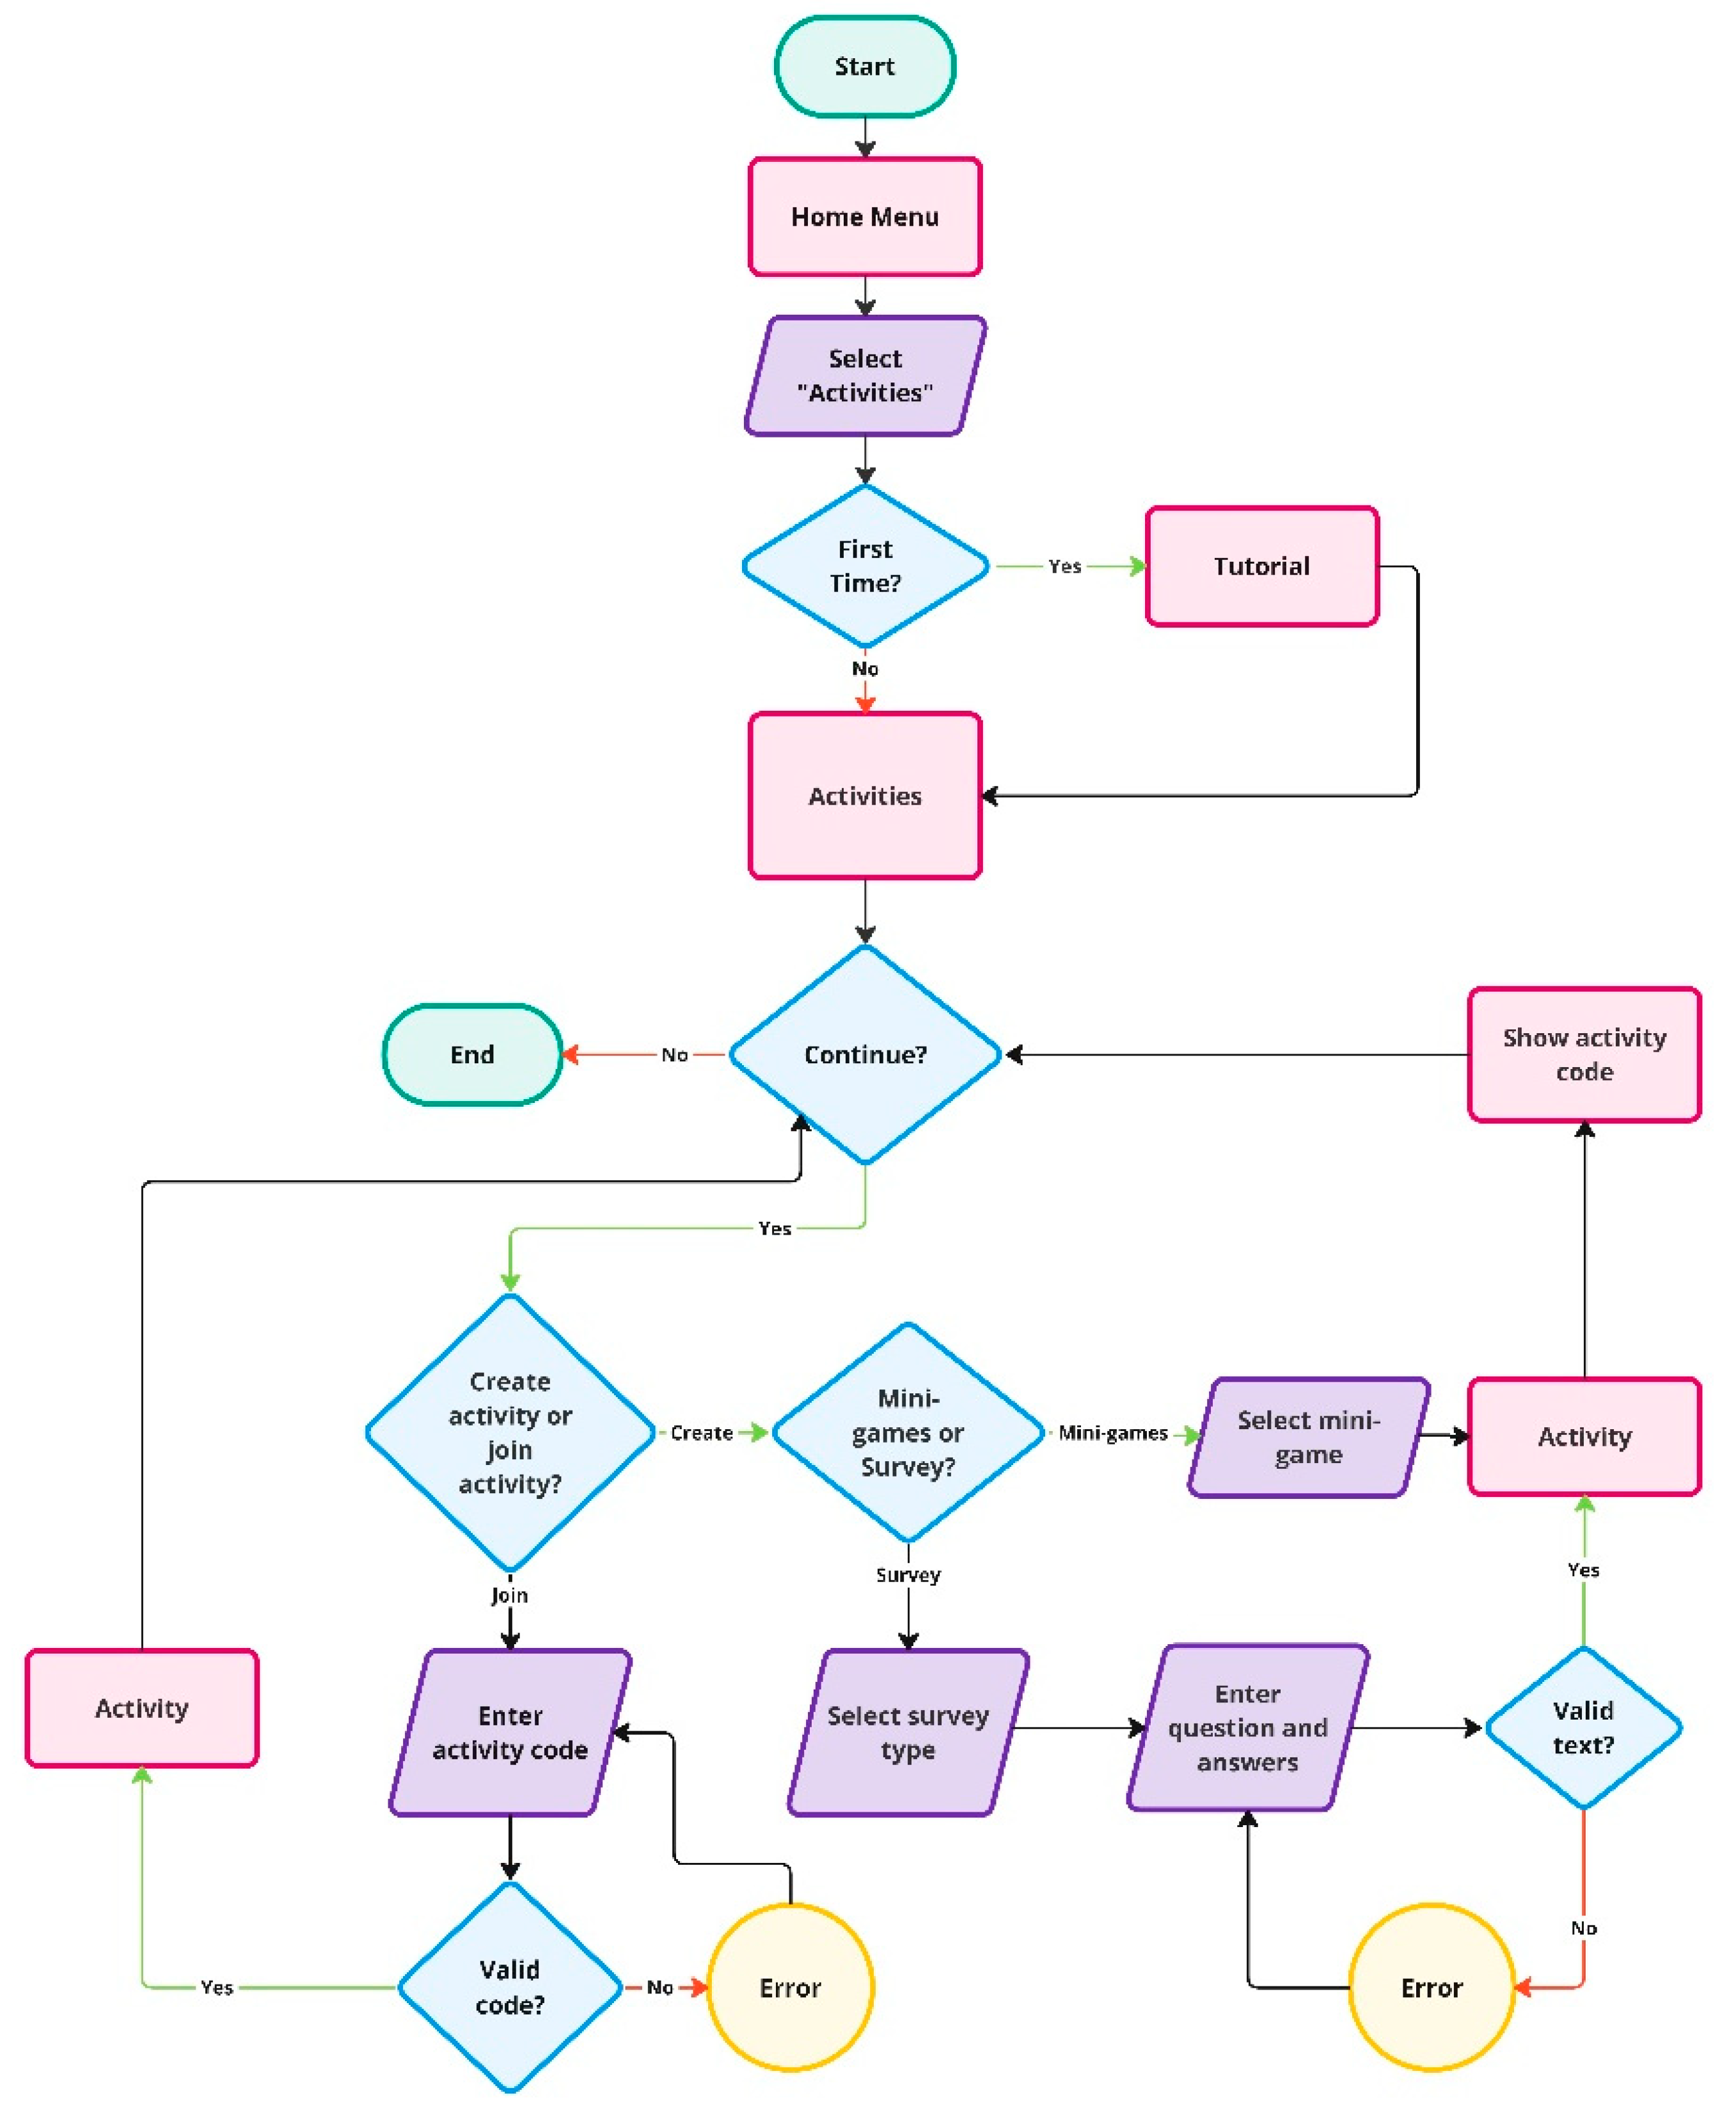
Appendix C. Ideation Phase—Information Architecture
Appendix D. Test Phase—User Testing Scenarios


References
- Dewi, R.; Riyadi, R.; Siswanto, S. Learning process: Obstacles on statistical content. AIP Conf. Proc. 2022, 2566, 020005. [Google Scholar]
- Kurniawan, D.; Wahyuningsih, T. Analysis of student difficulties in statistics courses. Int. J. Trends Math. Educ. Res. 2018, 1, 53–55. [Google Scholar] [CrossRef]
- Hsu, J.L.; Chen, Y.-R. Integrating Big Data in Introductory Statistics Education-Challenges for Instructors and Students. In Proceedings of the Innovative Technologies and Learning: Third International Conference, ICITL 2020, Porto, Portugal, 23–25 November 2020; Proceedings 3. Springer: Berlin/Heidelberg, Germany, 2020; pp. 263–267. [Google Scholar]
- Alaiat, H.H.M. The Challenges and Difficulties Encountered by Computer Science Educators in Higher Education, Specifically Focusing on the Utilization of Chat GPT Technology in Libya. Bani Waleed Univ. J. Humanit. Appl. Sci. 2023, 8, 120–137. [Google Scholar]
- Ramoso, M.G.D.; Cruz, R.O.-D. Adapting to the new normal: Remote teaching challenges among educators in higher education. Eureka J. Educ. Res. 2024, 2, 98–107. [Google Scholar] [CrossRef]
- Ben-Zvi, D.; Makar, K.; Garfield, J. International Handbook of Research in Statistics Education; Springer: Berlin/Heidelberg, Germany, 2017; ISBN 3319661957. [Google Scholar]
- Ministerio de Educación Chile. Bases Curriculares Educación Básica; Gobierno de Chile: Santiago, Chile, 2012; Available online: https://bibliotecadigital.mineduc.cl/handle/20.500.12365/632 (accessed on 10 March 2024).
- Ministerio de Educación Chile. Bases Curriculares 7° a 2° Medio; Gobierno de Chile: Santiago, Chile, 2016; Available online: https://bibliotecadigital.mineduc.cl/handle/20.500.12365/654 (accessed on 10 March 2024).
- Ministerio de Educación Chile. Bases Curriculares 3° y 4°Medio; Gobierno de Chile: Santiago, Chile, 2019; Available online: https://bibliotecadigital.mineduc.cl/handle/20.500.12365/14364 (accessed on 10 March 2024).
- Bargagliotti, A.; Franklin, C.; Arnold, P.; Gould, R.; Johnson, S.; Perez, L.; Spangler, D.A. Pre-K–12 Guidelines for Assessment and Instruction in Statistics Education II (GAISE II): A Framework for Statistics and Data Science Education; American Statistical Association: Alexandria, VA, USA, 2020. [Google Scholar]
- Pfannkuch, M.; Budgett, S.; Fewster, R.; Fitch, M.; Pattenwise, S.; Wild, C.; Ziedins, I. Probability modeling and thinking: What can we learn from practice? Stat. Educ. Res. J. 2016, 15, 11–37. [Google Scholar] [CrossRef]
- Tintle, N.; Chance, B.L.; Cobb, G.W.; Rossman, A.J.; Roy, S.; Swanson, T.; VanderStoep, J. Introduction to Statistical Investigations; John Wiley & Sons: Hoboken, NJ, USA, 2016; ISBN 1119683459. [Google Scholar]
- Andre, M.; Lavicza, Z. Technology changing statistics education: Defining possibilities, opportunities and obligations. Electron. J. Math. Technol. 2019, 13, 253–264. [Google Scholar]
- Ben-Zvi, D.; Gravemeijer, K.; Ainley, J. Design of statistics learning environments. In International Handbook of Research in Statistics Education; Springer: Cham, Switzerland, 2018; pp. 473–502. [Google Scholar]
- Zieffler, A.; Garfield, J.; Fry, E. What is statistics education? In International Handbook of Research in Statistics Education; Springer: Cham, Switzerland, 2018; pp. 37–70. [Google Scholar]
- Biehler, R.; Ben-Zvi, D.; Bakker, A.; Makar, K. Technology for enhancing statistical reasoning at the school level. In Third International Handbook of Mathematics Education; Springer: New York, NY, USA, 2013; pp. 643–689. [Google Scholar]
- Burckhardt, P.; Nugent, R.; Genovese, C.R. Teaching statistical concepts and modern data analysis with a computing-integrated learning environment. J. Stat. Data Sci. Educ. 2021, 29, S61–S73. [Google Scholar] [CrossRef]
- Counsell, A.; Cribbie, R.A. Students’ Attitudes toward Learning Statistics with R. Psychol. Teach. Rev. 2020, 26, 36–56. [Google Scholar] [CrossRef]
- Ke, F.; Grabowski, B. Gameplaying for maths learning: Cooperative or not? Br. J. Educ. Technol. 2007, 38, 249–259. [Google Scholar] [CrossRef]
- Hmelo-Silver, C.E. Problem-based learning: What and how do students learn? Educ. Psychol. Rev. 2004, 16, 235–266. [Google Scholar] [CrossRef]
- Norman, D. The Design of Everyday Things: Revised and Expanded Edition; Basic Books: New York, NY, USA, 2013; ISBN 0465072992. [Google Scholar]
- ISO 9241-210; ISO 9241-210: 2010 Ergonomics of Human-System Interaction—Part 210: Human-Centred Design for Interactive Systems. International Standard; ISO: Geneva, Switzerland, 2019. Available online: https://www.iso.org/standard/77520.html (accessed on 5 June 2024).
- Statistics Education Research Group TinkerPlots Software. Available online: https://www.tinkerplots.com/ (accessed on 5 June 2024).
- The Concord Consortium Fathom Dynamic Data Software. Available online: https://fathom.concord.org/ (accessed on 5 June 2024).
- Gapminder Gapminder Tool. Available online: https://www.gapminder.org/ (accessed on 5 June 2024).
- Li, K.W. An empirical study on integrating technology into statistics classroom practice. J. Pedagog. Res. 2022, 6, 112–136. [Google Scholar] [CrossRef]
- Preece, J.; Rogers, Y.; Sharp, H. Interaction Design: Beyond Human-Computer Interaction; J. Wiley & Sons: Hoboken, NJ, USA, 2002. [Google Scholar]
- Hassenzahl, M.; Tractinsky, N. User experience-a research agenda. Behav. Inf. Technol. 2006, 25, 91–97. [Google Scholar] [CrossRef]
- O’Brien, H.L.; Toms, E.G. What is user engagement? A conceptual framework for defining user engagement with technology. J. Am. Soc. Inf. Sci. Technol. 2008, 59, 938–955. [Google Scholar] [CrossRef]
- Nielsen, J. Usability Engineering; Morgan Kaufmann Publishers Inc.: San Francisco, CA, USA, 1994; ISBN 9780080520292. [Google Scholar]
- Bano, M.; Zowghi, D.; Kearney, M.; Schuck, S.; Aubusson, P. Mobile learning for science and mathematics school education: A systematic review of empirical evidence. Comput. Educ. 2018, 121, 30–58. [Google Scholar] [CrossRef]
- Ivan, C.; Rumondor, P.C.B.; Ricky, M.Y.; Yossy, E.H.; Budiharto, W. Help the math town: Adaptive multiplayer math-science games using fuzzy logic. Procedia Comput. Sci. 2017, 116, 309–317. [Google Scholar] [CrossRef]
- Aker, J.C.; Ksoll, C. Call me educated: Evidence from a mobile phone experiment in Niger✰. Econ. Educ. Rev. 2019, 72, 239–257. [Google Scholar] [CrossRef]
- Kahoot! Kahoot! Available online: https://kahoot.com/ (accessed on 3 August 2024).
- Mentimeter Mentimeter. Available online: https://www.mentimeter.com/ (accessed on 3 August 2024).
- The Concord Consortium Common Online Data Analysis Platform (CODAP). Available online: https://codap.concord.org/ (accessed on 3 August 2024).
- Rossman/Chance Rossman/Chance Applet Collection 2021. Available online: https://www.rossmanchance.com/applets/index2021.html (accessed on 3 August 2024).
- Klingenberg, B. Art of Stat. Available online: https://artofstat.com/web-apps (accessed on 3 August 2024).
- Peing, X.L.; Liu, J.J.; Huang, M.Y. Online Interactive Dynamic Statistical Education Method, Platform, Device and Storage Medium. 2022. Available online: https://patents.google.com/patent/CN114969660A/en?oq=CN114969660A (accessed on 3 August 2024).
- Chen, B.; Wang, Y.; Xiao, L.; Xu, C.; Shen, Y.; Qin, Q.; Li, C.; Chen, F.; Leng, Y.; Yang, T. Effects of mobile learning for nursing students in clinical education: A meta-analysis. Nurse Educ. Today 2021, 97, 104706. [Google Scholar] [CrossRef]
- Mohammadzadeh, N.; Gholamzadeh, M.; Zahednamazi, S.; Ayyoubzadeh, S.M. Mobile health applications for children’s oral health improvement: A systematic review. Inform. Med. Unlocked 2023, 37, 101189. [Google Scholar] [CrossRef]
- Holtzman, D.J.; Quick, H.E.; Keuter, S. Math for 2s and 3s: The impact of parent-child math activities on parents’ beliefs and behaviors and young children’s math skill development. Early Child. Res. Q. 2023, 62, 163–174. [Google Scholar] [CrossRef]
- Özkaya, C.; Thurston, A.; MacKenzie, A.; ul Ain, Q. What works for high attaining girls in primary schools in math, science and STEM courses? Int. J. Educ. Res. Open 2023, 5, 100283. [Google Scholar] [CrossRef]
- Crompton, H.; Burke, D.; Gregory, K.H. The use of mobile learning in PK-12 education: A systematic review. Comput. Educ. 2017, 110, 51–63. [Google Scholar] [CrossRef]
- Gibbons, S. Design Thinking 101. Nielsen Norman Group, 2016. Available online: https://www.nngroup.com/articles/design-thinking/ (accessed on 3 August 2024).
- Conta, A. The Art and Science of UX Design; New Riders: Indianapolis, IN, USA, 2023. [Google Scholar]
- Moodle Moodle. Available online: https://moodle.com/ (accessed on 14 September 2024).
- Davis, F.D.; Bagozzi, R.P.; Warshaw, P.R. User acceptance of computer technology: A comparison of two theoretical models. Manage. Sci. 1989, 35, 982–1003. [Google Scholar] [CrossRef]
- Monteiro, V.; Mata, L.; Peixoto, F. Intrinsic motivation inventory: Psychometric properties in the context of first language and mathematics learning. Psicol. Reflexão Crítica 2015, 28, 434–443. [Google Scholar] [CrossRef]
- Google Classroom About Classroom. Available online: https://support.google.com/edu/classroom/answer/6020279?hl=en (accessed on 14 September 2024).

| Stage | Activity | Definition |
|---|---|---|
| Empathize | Interview | Direct conversation with people to collect information about who the users are, their needs, problems, and frustrations, to better understand the problem. |
| Survey | A questionnaire that allows probing into the issues, needs, expectations, and actions people take to achieve their goals. It enables reaching many people located in different geographical areas. | |
| Benchmarking | Involves exploring multiple alternatives that have been formulated as solution options to the problem being addressed. Then, a comparative analysis is conducted to identify the positive and negative aspects of each proposal with the goal of developing a custom solution that considers the best aspects, practices, and standards. | |
| Define | User profile | A method that synthesizes the characteristics, behaviors, needs, expectations, goals, challenges, and problems of a specific group of users. |
| Empathy map | A method that visually and graphically synthesizes the thoughts, emotions, behaviors, and needs of a group of people. | |
| Ideate | Brainstorming | A method for generating a set of ideas about the solution to the problems and obstacles people face in achieving their goals, improving the process and associated experience. In software development, this method is used to generate ideas about potential functionalities to include in the solution. |
| Card sorting and information architecture | Card sorting is a technique used to organize and categorize information according to the users’ perspectives. Participants group cards that represent concepts or elements, which helps designers understand how users structure information. This technique enables the development of information architecture, which is the logical structure and organization of content within a system, ensuring that users can navigate and find information intuitively. | |
| Taskflows and userflows | Taskflows describe the specific steps a user follows to complete a task in a product. On the other hand, userflows are visual representations of the path a user travels through an application or website to reach a goal, considering the interactions and decisions they make along the way. | |
| Prototype | Low-fidelity wireframes | Involves creating simple and initial representations (usually paper sketches) of the solution and its interface. Low-fidelity prototypes are used to obtain quick feedback without investing too much time and resources. |
| Medium-fidelity wireframes | Involves creating digital representations of the solution with design elements that will be part of the interface, but without details such as color, typography, or images. | |
| High-fidelity wireframes | Involves creating detailed and realistic representations of the solution and its interface. These prototypes closely resemble the final version of the solution in terms of appearance and functionality. They are used to obtain more accurate and valuable feedback due to the prototypes’ similarity to the final product. | |
| Test | User testing | Involves observing and evaluating the interaction of end users with the product design proposal. It allows for direct information from end users about the design proposal, identifies problems that occur during interaction, and thereby identifies opportunities for improvement and makes necessary corrections. |
| Application | Description | Usability | Language | Design |
|---|---|---|---|---|
| Kahoot (august 2023 version) | Mobile app that uses learning games to introduce a topic, review and reinforce content, and even conduct assessments. | Highly intuitive for all types of users. | Non-technical and easy to understand for anyone. | Pleasant design, appropriate colors, and icons. |
| Mentimeter (august 2023 version) | Online web tool used for asking questions, conducting surveys, and playing games with an audience (students). | Highly intuitive for anyone to use. | Non-technical language, easy to understand for anyone. | Pleasant design, appropriate colors, and icons. |
| Codap (august 2023 version) | Educational software that serves as a tool for data analysis. | Intuitive and contains aids for people who are not specialized in statistics. | Easy language for anyone who is not familiar with technical statistical terms. | Aesthetic, consistent colors, and software identity. |
| Rossmanchance (2021 version) | Website containing various applets (small programs with specific tasks) on statistics topics. | Without prior knowledge in statistics, it is difficult to use. | All language used is very technical. | Poor design. Just text with a basic font. |
| Fathom (2018 version) | Dynamic software aimed at teaching data analysis and statistics. | Not intuitive at all, no tutorials in the software, functionalities are not explained. Very difficult to use for a first-time user. | All language used is very technical, and there is no help to understand the concepts shown in the software. | Not aesthetically pleasant, but not poor either. |
| ArtofStat (2022 version) | Web app that allows for interactive exploration of statistical concepts. Allows for constructing graphs, obtaining summary statistics, finding probabilities, obtaining confidence intervals, or fitting linear regression models. | Not entirely intuitive to use all offered functionalities, as some prior understanding of statistical concepts is required. | When interacting with certain functionalities, technical jargon knowledge is required to use them properly. | Pleasant design, consistent colors, and app identity. |
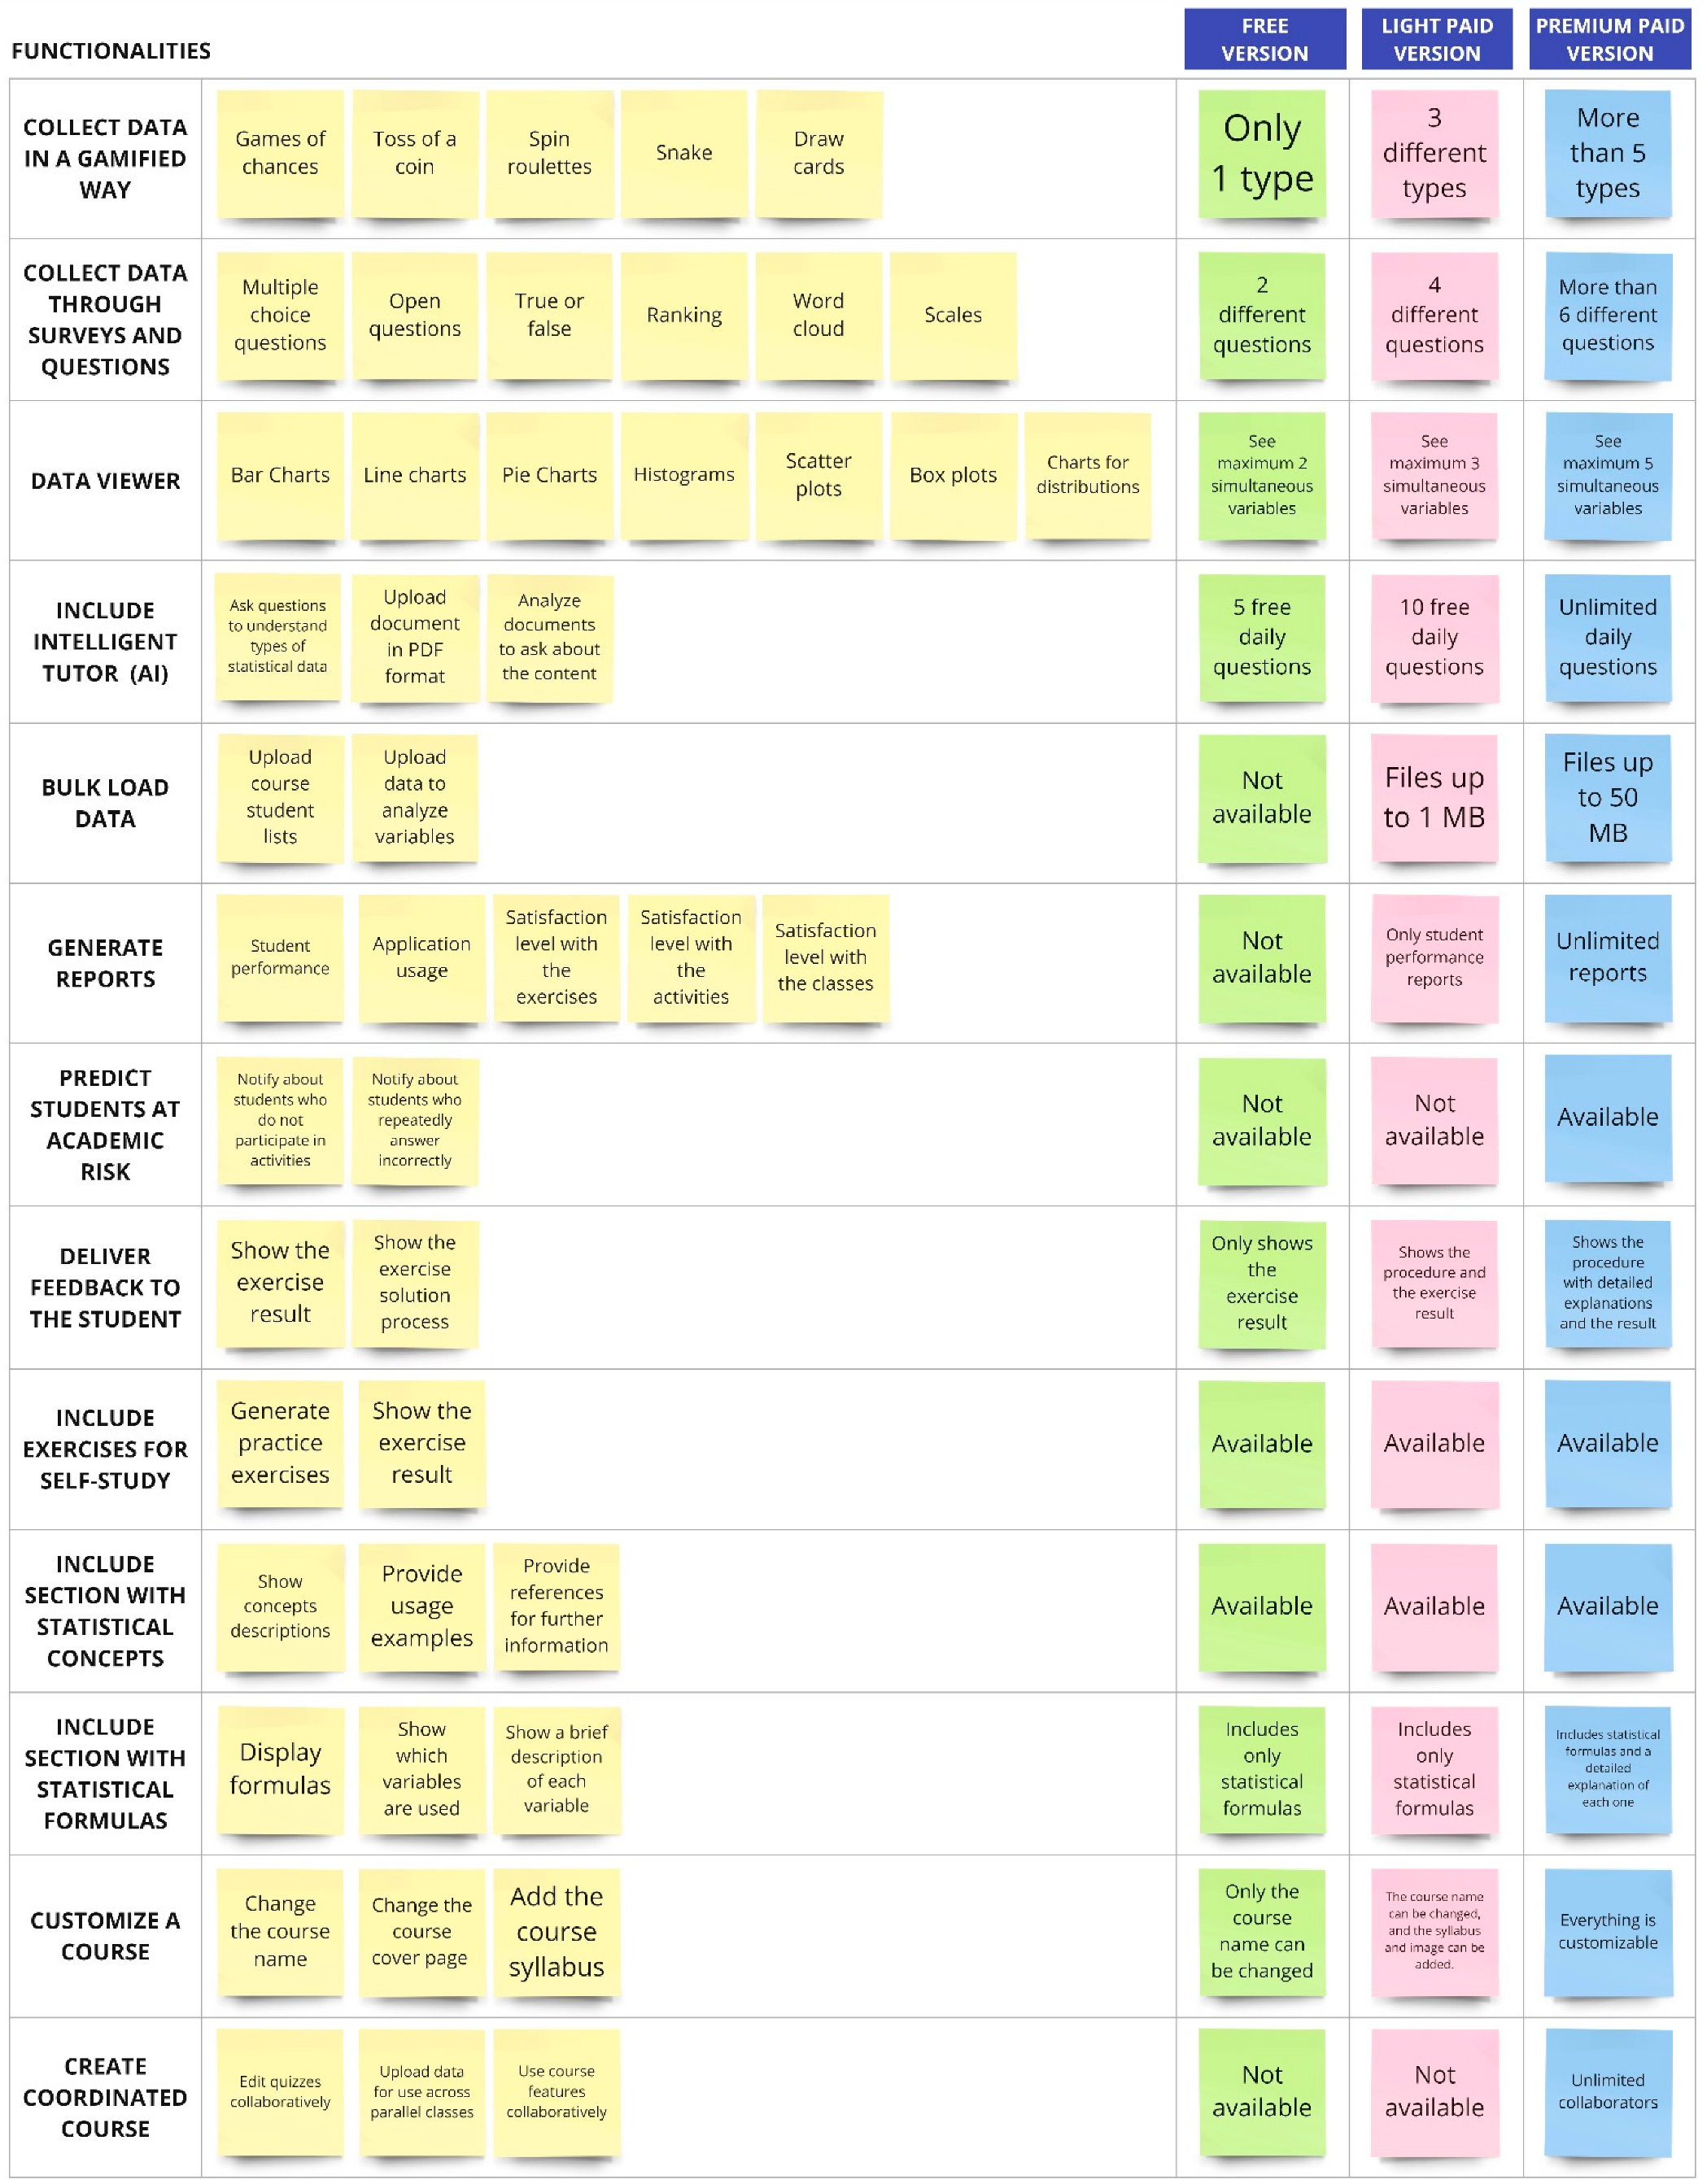
| Functionality | Technical Description | Impact on Education |
|---|---|---|
| Probability Calculator | Calculates probabilities for various statistical distributions (Binomial, Poisson, Normal, T-student, Chi-square, F-distribution, and Exponential, among others). Users can enter specific parameters to calculate accurate probabilities. | Reinforces probabilistic reasoning by allowing students to interact directly with statistical distributions, experiment with variables, and obtain immediate results. Real-time practice aids in understanding theoretical concepts and conditional probabilities, improving retention and mastery of the subjects. |
| Data Generator | Incorporates random experiments (such as coin tosses, dice rolls, and roulette spins) and mini-games (such as Snake, Tetris, and quizzes) that generate real-time data. The data can be visualized and analyzed directly in the application. | Introduces a “gamified” approach to learning statistics, making abstract concepts more understandable. Students can experiment with the data and observe how their decisions impact the outcomes, promoting active and meaningful learning. This keeps students motivated, improving their engagement and participation. |
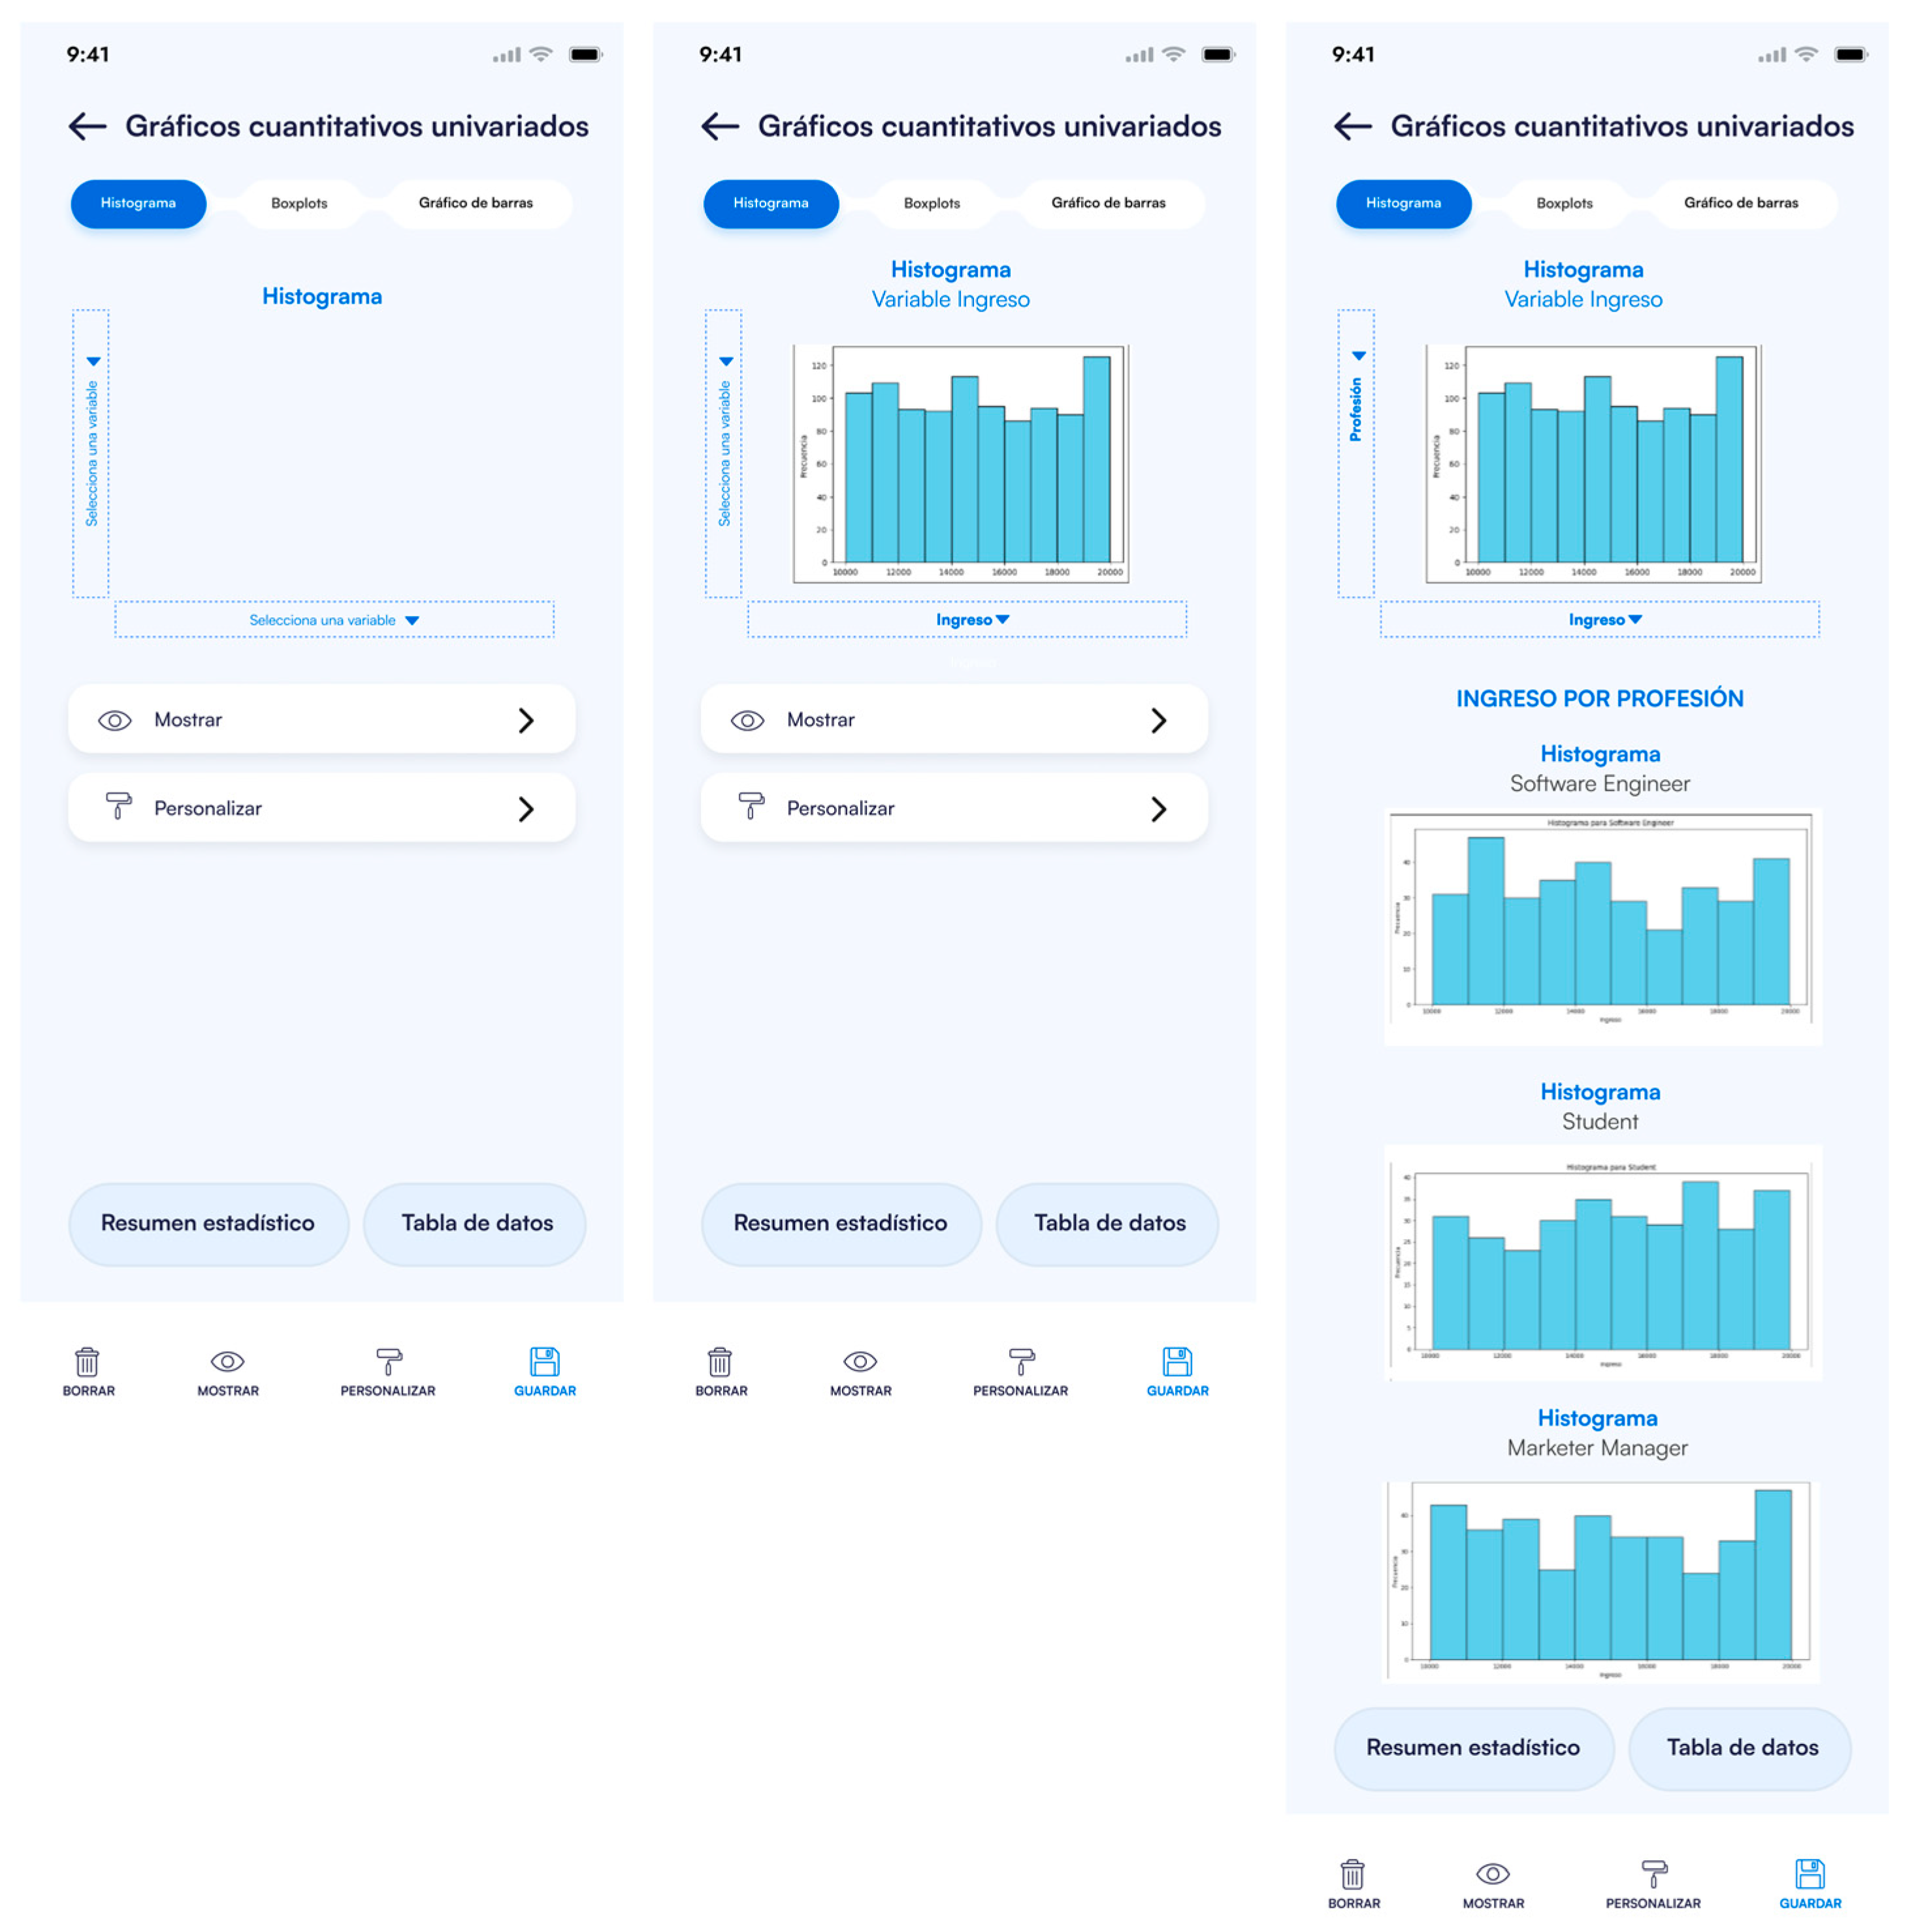
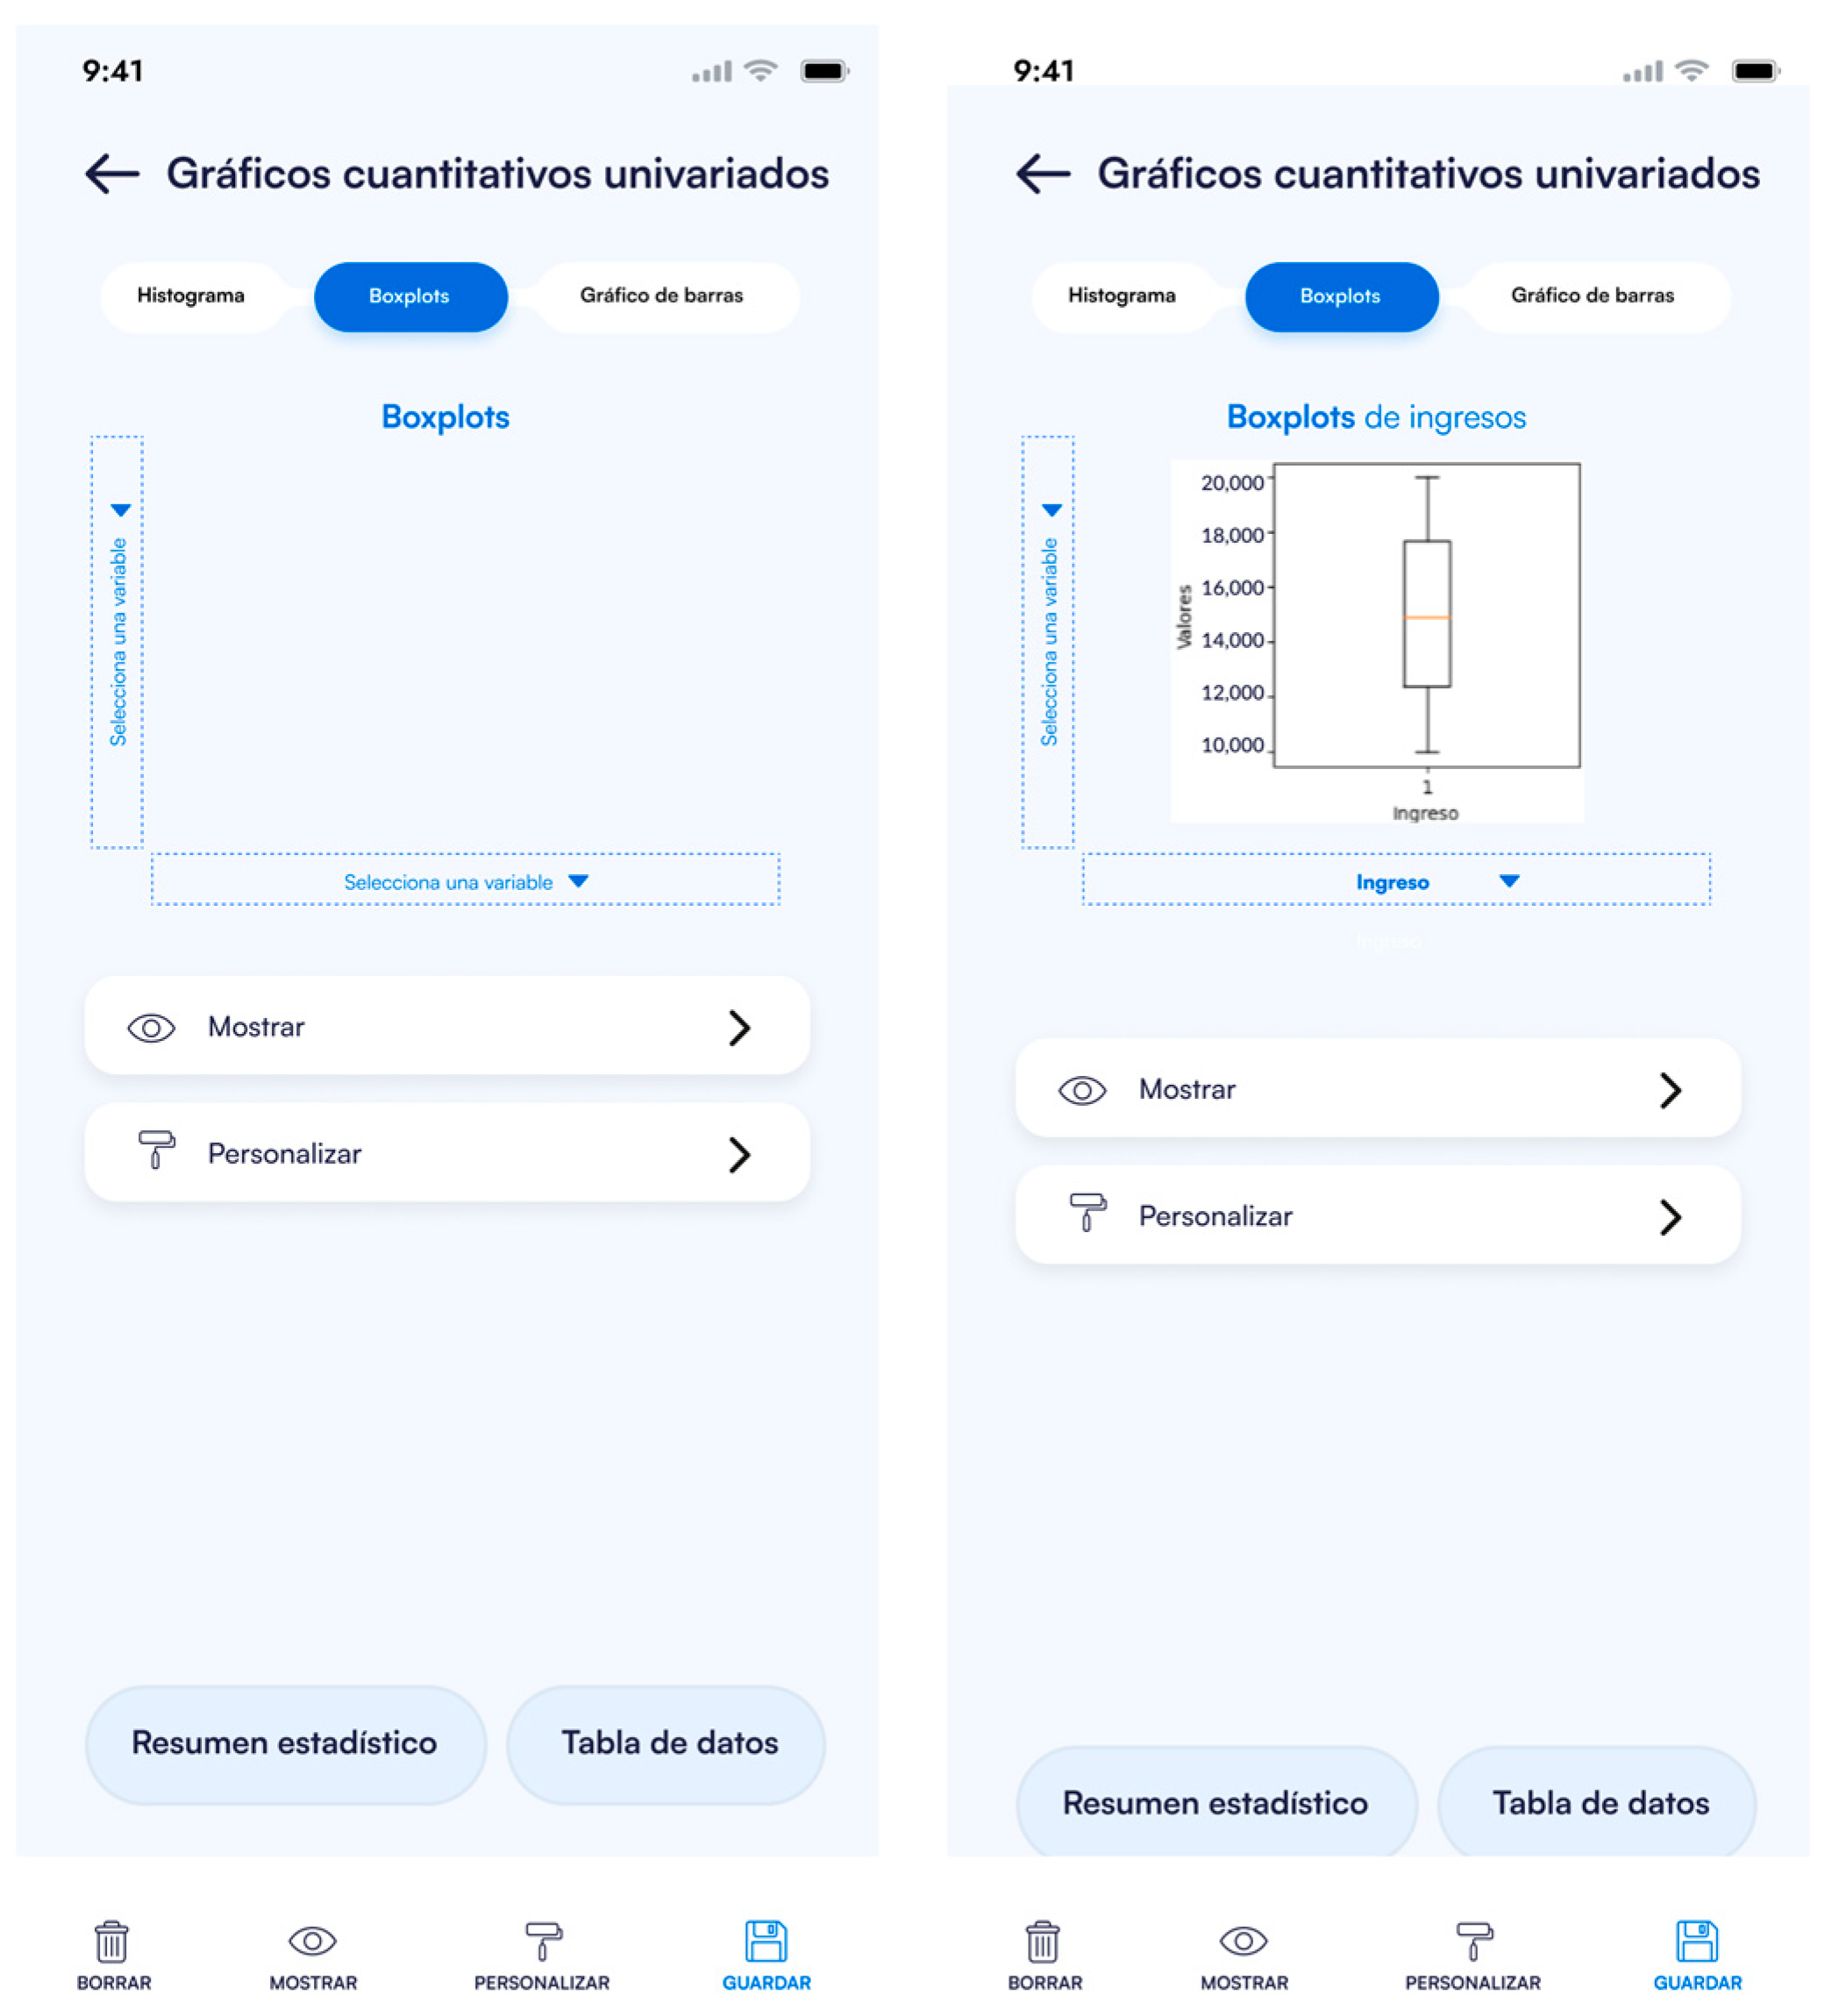
| Data Visualizer | Imports files in TXT, CSV, and Excel formats, and create charts such as histograms, bar charts, pie charts, box plots, and more. Students can customize the charts and visualize different relationships between variables. | Promotes statistical literacy by allowing students to see graphical representations of data, making it easier to understand trends and variability. By manipulating different variables and chart types, students develop analytical skills and a greater ability to interpret data visualizations. |
| AI Tutor | Offers real-time personalized assistance by answering questions about formulas, statistical concepts, and steps to solve problems. The AI Tutor also provides answers based on PDF documents uploaded to the app. | The AI Tutor acts like a “professor”, guiding students through their learning process. This promotes autonomy and self-directed learning, as students can immediately clarify doubts. Personalized feedback allows students to correct mistakes in real-time, reinforcing learning and fostering self-efficacy. |
| Surveys and Data Collection | Create custom surveys with open-ended, multiple-choice, or true/false questions, and collect data that can later be analyzed and visualized within the app. | This feature involves students in the practical process of data collection and analysis. They learn to interpret data and analyze statistical results, improving their understanding of statistical methods. |
| Report Generation | Generates reports based on student performance, tracks their progress throughout the course, and provides detailed feedback on areas where improvement is needed. | This fosters self-regulated learning, as students receive detailed insights into their performance, allowing them to identify weaknesses and areas for improvement. These reports also enable professors to monitor student progress and offer timely interventions. |
| Design Consideration Proposed by Ben-Zvi et al. [6] | EstApp Functionalities | How It Was Considered in the Design of EstApp |
|---|---|---|
| Focus on developing core statistical ideas rather than tools and procedures | Probability Calculator, Data Visualizer, AI Tutor | EstApp focuses on fundamental statistical concepts, such as distributions and probabilities, through tools that allow students to understand and explore statistical ideas. |
| Use well-designed tasks to support the development of statistical reasoning | AI Tutor, Surveys, Data Generator | The tasks within EstApp are designed to guide students in solving real-world statistical problems. The AI Tutor provides immediate and personalized feedback, fostering the development of statistical reasoning. |
| Use of real, realistic, and motivating datasets | Data Visualizer, Data Generator, Data Upload (TXT, CSV, Excel) | EstApp enables students to work with both real and simulated data, encouraging the practical application of statistical concepts. |
| Establish a classroom culture that encourages statistical arguments | AI Tutor, Interactive Feedback | The AI Tutor promotes dialogue and critical thinking by having students ask questions about topics they do not fully understand, fostering a culture of autonomous and personalized learning. |
| Use assessments to monitor students’ development of statistical learning and evaluate instructional plans | Progress Reports, Surveys, AI Tutor Feedback | EstApp monitors students’ progress through reports that track their performance on tasks, providing feedback. Teachers can use this information to adjust lessons and improve learning outcomes. |
| Integrate the use of technological tools that allow students to explore and analyze data | Data Visualizer, Probability Calculator, Data Generator, AI Tutor | EstApp integrates technological tools allowing students to manipulate data and explore results. These tools encourage autonomous exploration and data analysis, facilitating active learning. |
| Aspect | Lessons Learned |
|---|---|
| User research |
|
| Prototype validation |
|
| Flexibility of Design Thinking |
|
| Personalized education |
|
| Multidisciplinary collaboration |
|
| Aspect | Challenges Encountered | How We Addressed Them |
|---|---|---|
| User research | Students and professors had very different needs and expectations, making the analysis of the information gathered from interviews and surveys challenging. We obtained a lot of valuable data, but it took time to consolidate and prioritize. | We created two user personas and two empathy maps, allowing us to identify their common frustrations and challenges, as well as their particular expectations. This user-centered approach for both groups enabled us to balance EstApp’s features to cater to both, creating a platform that is useful for both teaching and learning. |
| Prototype validation | The design process for EstApp required significant time and resources, especially in creating and validating the wireframes. | We employed an “incremental design” strategy, starting with low-fidelity wireframes to gather quick and cost-effective feedback before moving on to medium- and high-fidelity versions. This approach allowed us to iterate quickly without overburdening the project. |
| Personalized education | Not all team members were experts or professors in the field of statistics, so the rest of the team had to learn key concepts to properly design EstApp in a way that was intuitive and facilitated the understanding of complex concepts. | We held various team meetings to learn and familiarize ourselves with statistical concepts. These meetings included internal validations of the most important features, the wireframes, and how to make the interaction “logical” from a statistical perspective. Additionally, we conducted usability tests with students to ensure that the designs were intuitive for them. This allowed us to adjust the design to ensure students clearly understood the content. |
Disclaimer/Publisher’s Note: The statements, opinions and data contained in all publications are solely those of the individual author(s) and contributor(s) and not of MDPI and/or the editor(s). MDPI and/or the editor(s) disclaim responsibility for any injury to people or property resulting from any ideas, methods, instructions or products referred to in the content. |
© 2024 by the authors. Licensee MDPI, Basel, Switzerland. This article is an open access article distributed under the terms and conditions of the Creative Commons Attribution (CC BY) license (https://creativecommons.org/licenses/by/4.0/).
Share and Cite
Quiñones, D.; Ruz, F.; Díaz-Arancibia, J.; Paz, F.; Osega, J.; Rojas, L.F. Innovating Statistics Education: The Design of a Novel App Using Design Thinking. Appl. Sci. 2024, 14, 8515. https://doi.org/10.3390/app14188515
Quiñones D, Ruz F, Díaz-Arancibia J, Paz F, Osega J, Rojas LF. Innovating Statistics Education: The Design of a Novel App Using Design Thinking. Applied Sciences. 2024; 14(18):8515. https://doi.org/10.3390/app14188515
Chicago/Turabian StyleQuiñones, Daniela, Felipe Ruz, Jaime Díaz-Arancibia, Freddy Paz, José Osega, and Luis Felipe Rojas. 2024. "Innovating Statistics Education: The Design of a Novel App Using Design Thinking" Applied Sciences 14, no. 18: 8515. https://doi.org/10.3390/app14188515