Article

Making Aquaponics More Sustainable Using Worms and Water Replenishment Combined with a Sensing- and IoT-Based Monitoring System

by
Praveen Chandramenon
1,2,*,
Andrew Gascoyne
1,
Liam Naughton
1 and
Fideline Tchuenbou-Magaia
1,2,*
1
School of Engineering, Computing and Mathematical Sciences, University of Wolverhampton, Wolverhampton, Wulfruna St, Wolverhampton WV1 1LY, UK
2
Energy, Green Technology Research Group, Centre for Engineering Innovation, Research School of Engineering, Computing and Mathematical Sciences, University of Wolverhampton, Wolverhampton WV1 1LY, UK
*
Authors to whom correspondence should be addressed.
Appl. Sci. 2024, 14(18), 8516; https://doi.org/10.3390/app14188516
Submission received: 21 August 2024 / Revised: 17 September 2024 / Accepted: 19 September 2024 / Published: 21 September 2024
(This article belongs to the Special Issue Advances in Bioprocess Monitoring and Control)

Abstract

:
Aquaponics offers a simple conclusive solution to the food and environmental crisis around the world. This paper presents a comparative analysis of standard aquaponics with vermiponics (aquaponics with earthworms) before and after applying an optimal freshwater replenishment. Fish and plants were grown on a standard aquaponics testbed and a vermiponics testbed for 3 months each, initially without water replenishment, and then with 19% replenishment based on the fishtank volume. Water quality and environmental data were monitored, collected and processed using sensors and internet of things (IoT) devices. Daily growth analysis, the mean productivity of both testbeds before and after replenishment, the percentage of productivity difference and the general productivity comparison between standard and vermiponics testbeds were determined. Results showed an enhanced productivity of 2.83% and 5.54% for the standard testbed and the vermiponics testbed, respectively, when replenishment was applied. The yield improvement after replenishment was proven to be statistically significant, with p < 0.05 reassuring the impact of water replenishment. This research contributes to the understanding of the impact of water replenishment in aquaponics and vermiponics systems. Moreover, it provides insights into the effect of earthworms on both systems’ yield productivity.

1. Introduction

The incrementing growth rate of the world population and the ever-growing need for food alongside the pressure to achieve sustainable goals have driven changes from conventional farming approaches to sustainable agricultural ones. Aquaponics is an agricultural approach that links fish and soilless plant production in a recirculating ecosystem where natural bacteria convert fish waste into plant nutrients [1]. The plants take up the nutrients from the water to grow whilst purifying the water, which returns to the fish tanks. A coupled aquaponics system contains aquatic organisms, bacteria and plants that benefit from each other in a closed recirculated water body. A standard aquaponics system has a growbed where the plants are grown and a fishtank is placed under the growbed tray where the fish are kept. Fishtank water is recirculated between the growbed and fishtank. Vermiponics is an aquaponics system with red tape earthworms, scientifically known as Eisenia fetida, added onto the growbed media. The earthworms added onto the growbed media help to break down any solid waste from the fish and any detritus from the plants, and also provides additional nutrients for the plants. Earthworms help convert organic waste to fertilizer [2]. They contain hormone-like substances, which encourage the health and growth of plants [3]. They are rich in protein and recommended as fish feed to aquaponics systems, making them environmentally sustainable [4]. This helps to reduce the negative environmental impact of the conventional aquaponics systems. The amino acid content in the earthworms is higher than the standard fish meal [5,6]. Therefore, it is hypothesized that the vermiponics testbed with earthworms tend to be more efficient and sustainable. This article further describes the related work in Section 2 and the materials and methods in Section 3. Later, the results are illustrated in Section 4, followed by the discussion of the results in Section 5.

2. Related Work

Ref. [7] performed a comparative study between two different aquaponics systems using the Life Cycle Assessment. The authors grew Lettuce and Rainbow trout in a raft aquaponics and media-filled system. They found that floating systems are less effective than those with cultivation in gravel. Ref. [8] studied the growth promoting effect of earthworms on tomato plants. The authors tried different concentrations of vermiwash and discovered that the vermiwash treatment outperformed the normal fish water treatment. A project was conducted by the authors of [9] on the effect of vermiwash as a vermiponics medium on the growth of biochemical indices of Amaranthus. They compared different percentages of vermicompost and identified that 100% of vermiponics performed best with statistically significant improvements at α = 0.05 . Ref. [10] determined an optimal freshwater replenishment rate of 19% on a 100-liter aquaponics system and found that a regular water replenishment system helps to maintain fishtank water quality. Aquaponics fish and plant production performance were analyzed when the authors of [11] studied the optimal hydraulic loading rate on plant rations. The authors of [12] conducted an evaluation of the growth of the different plants added to small-scale aquaponics systems to obtain adequate concentrations. They used basil, chard and chive plants with different concentrations of vermicompost added to each plant. Ref. [13] performed a hematobiochemical response and intestinal histomorphology of Nile-tilapia with earthworm meal and concluded that elevating the diversity of protein sources is imperative for fish growth improvement. Earthworms with a favourable content of amino acids are natural food for numerous species of fish, especially benthophagous fish such as Cyprinids. They have a beneficial effect on the fish, leading to fish immunity [14,15]. Ref. [4] suggested that aquaponics productivity could be enhanced using earthworms and vermicompost from vegetable waste. The authors proposed that the earthworms can be cultivated from vegetable waste. A study [16] outlined that the use of vermiliquers from earthworms in aquaponics leafy vegetable production improves nutrient uptake and supports immunity, thereby boosting growth.
Regular water replenishment may help in improving the efficiency of aquaponics productivity [10,17] than conventional aquaponics without water replenishment. Although studies have been performed on conventional aquaponics and vermiponics systems separately, to the best of our knowledge, there is no study comparing aquaponics and vermiponics with and without water replenishment. The present study attempts to cover this research gap by performing a comparative study of standard aquaponics and vermiponics performance and the effect of earthworms in vermiponics productivity. The major contributions of this research are as follows: a unique dataset of a comparison of standard aquaponics and vermiponics systems along with novel algorithms and mathematical formulae; an analysis regarding the impact of water replenishment on yield productivity with gold carp fish and Swiss chard plants; and an attribute-wise productivity evaluation of both systems.

3. Materials and Methods

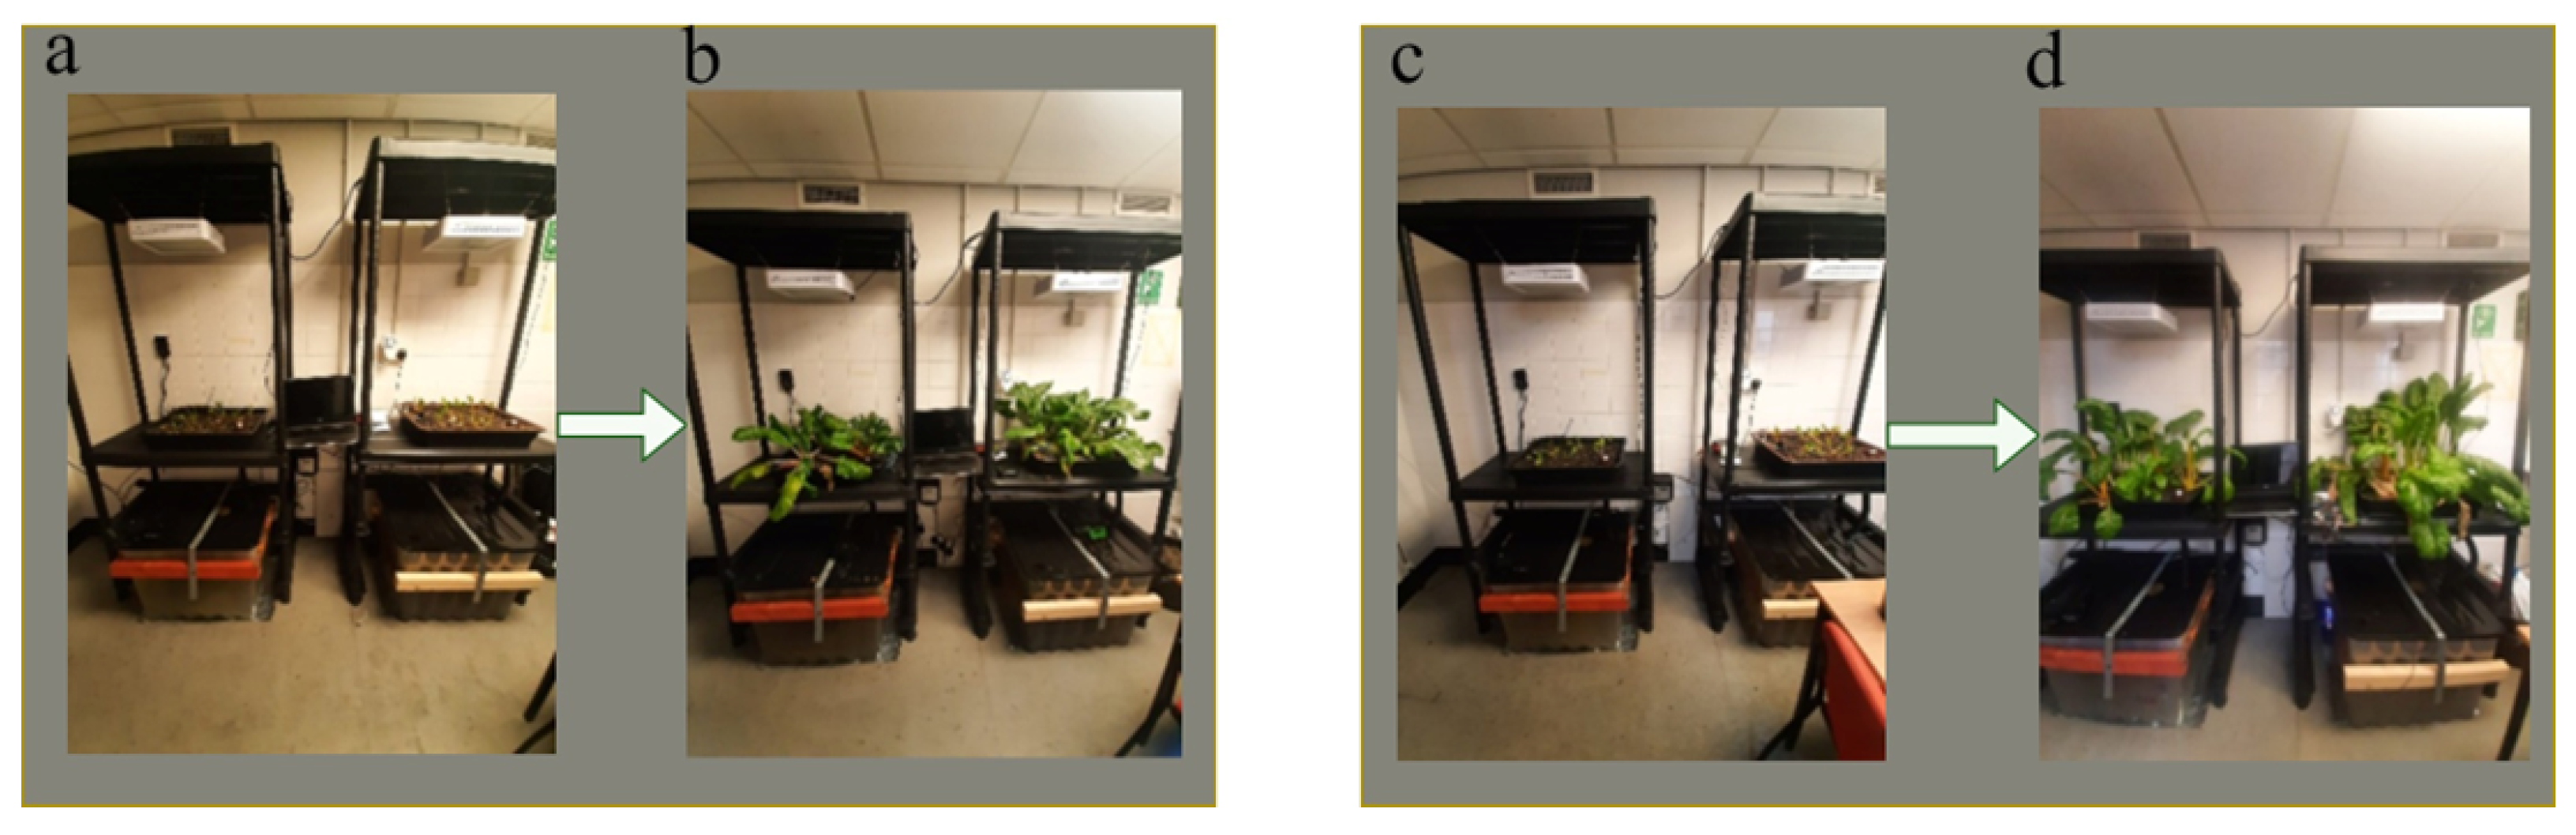
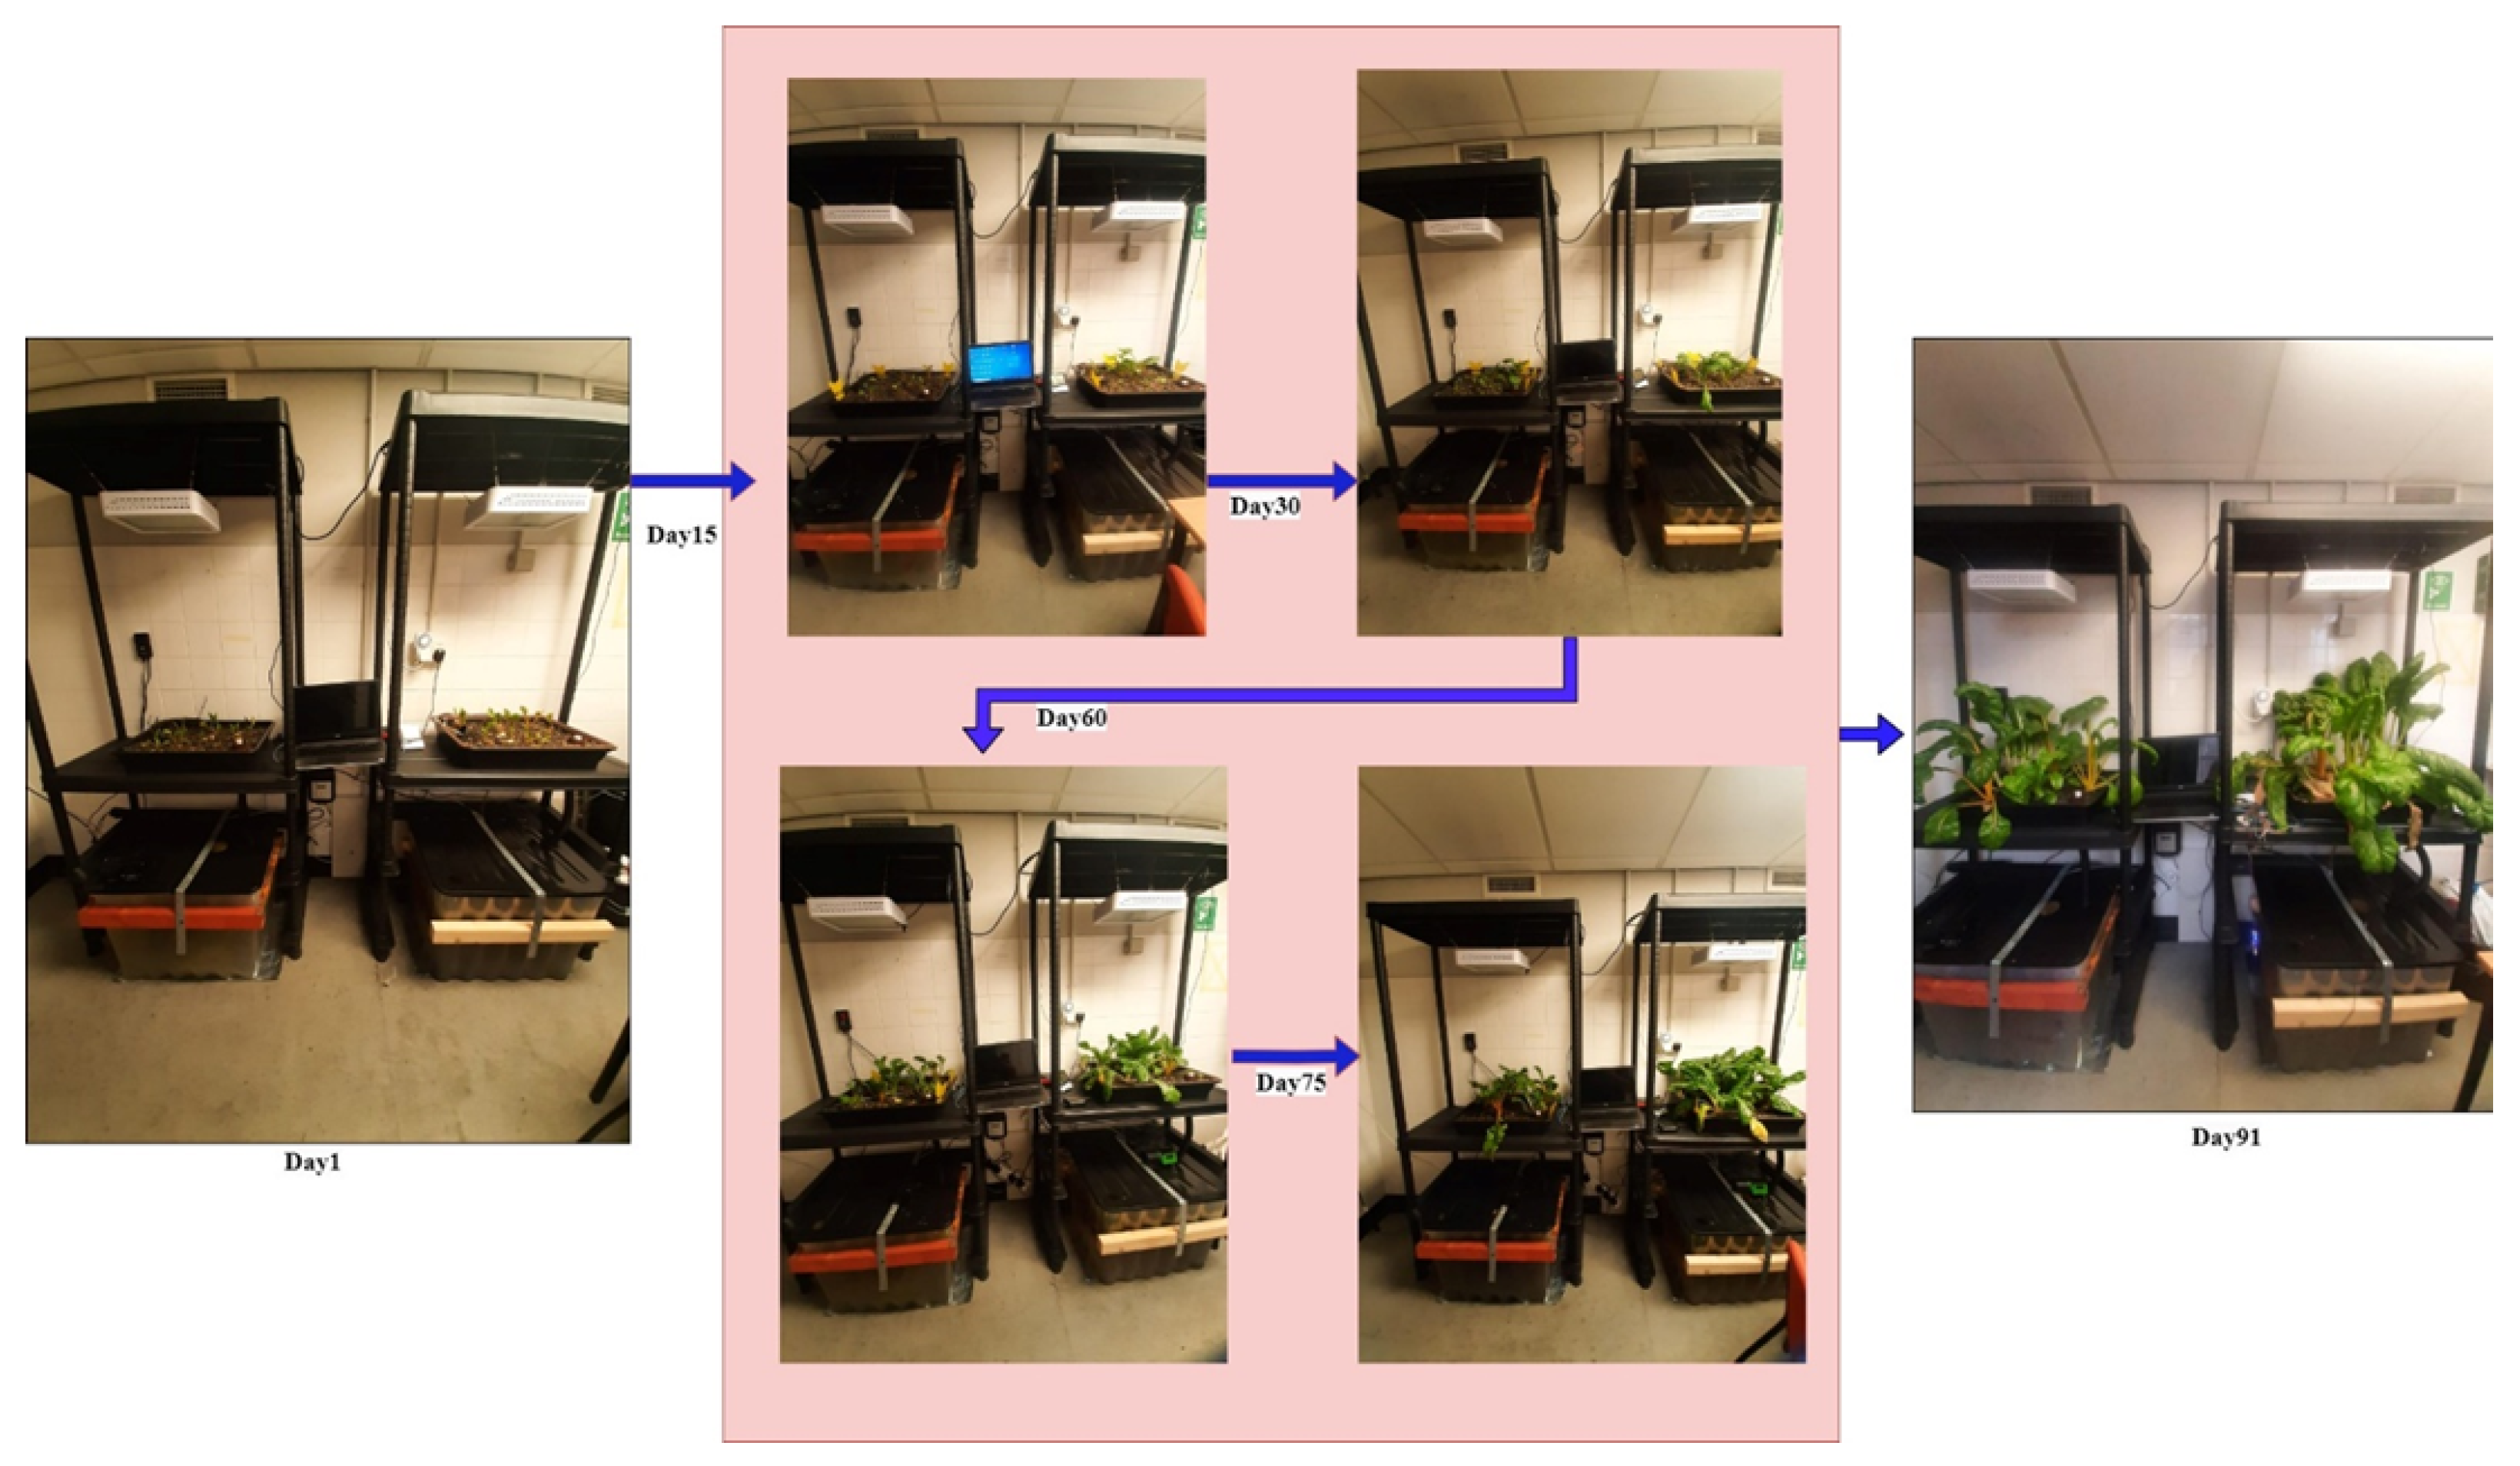
3.1. Experimental Design and Data Collection

Two identical aquaponics testbeds were designed and installed for the experiment: a standard aquaponics testbed and a vermiponics testbed, both with 12 g of red tape earthworms added onto the growbeds. Both testbeds have the same specification with 100 L fishtanks and were equipped with artificial LED lights. A total of 6 Swiss chard plants and 6 cold-water carp fish, scientifically known as Cyprinus carpio, were chosen to grow on both testbeds. Fish water was recirculated on both systems every 30 min. Initially, the experiment was run without replenishment for 91 days. Then, water replenishment of 19 L in 100 L tanks of both testbeds were performed weekly, for the next 91 days. Manual data collection for fish and plant attributes was performed weekly in both terms of experimentation. IoT-based data collection for water quality data and environmental data was performed daily, in both terms. Plant length, leaf breath length, stem size and leaf length were chosen as plant attributes, whereas fish length and fish weight were used as fish attributes, contributing to evaluating the growth rate of the yields. Water quality parameters such as pH, dissolved oxygen, Total Ammonia and Nitrogen (TAN), temperature, turbidity and TDS values were also collected along with environmental parameters such as room temperature, humidity and CO2, whose values were collected using sensors and IoT. Arduino UNO was used for data collection and processing. Data were collected and stored in a local computer and in the cloud. Cloud-based and IoT-based predicative analysis has been proven to be effective in sustainable aquaponics systems [18]. Figure 1 shows the IoT communication of this experimental setup.

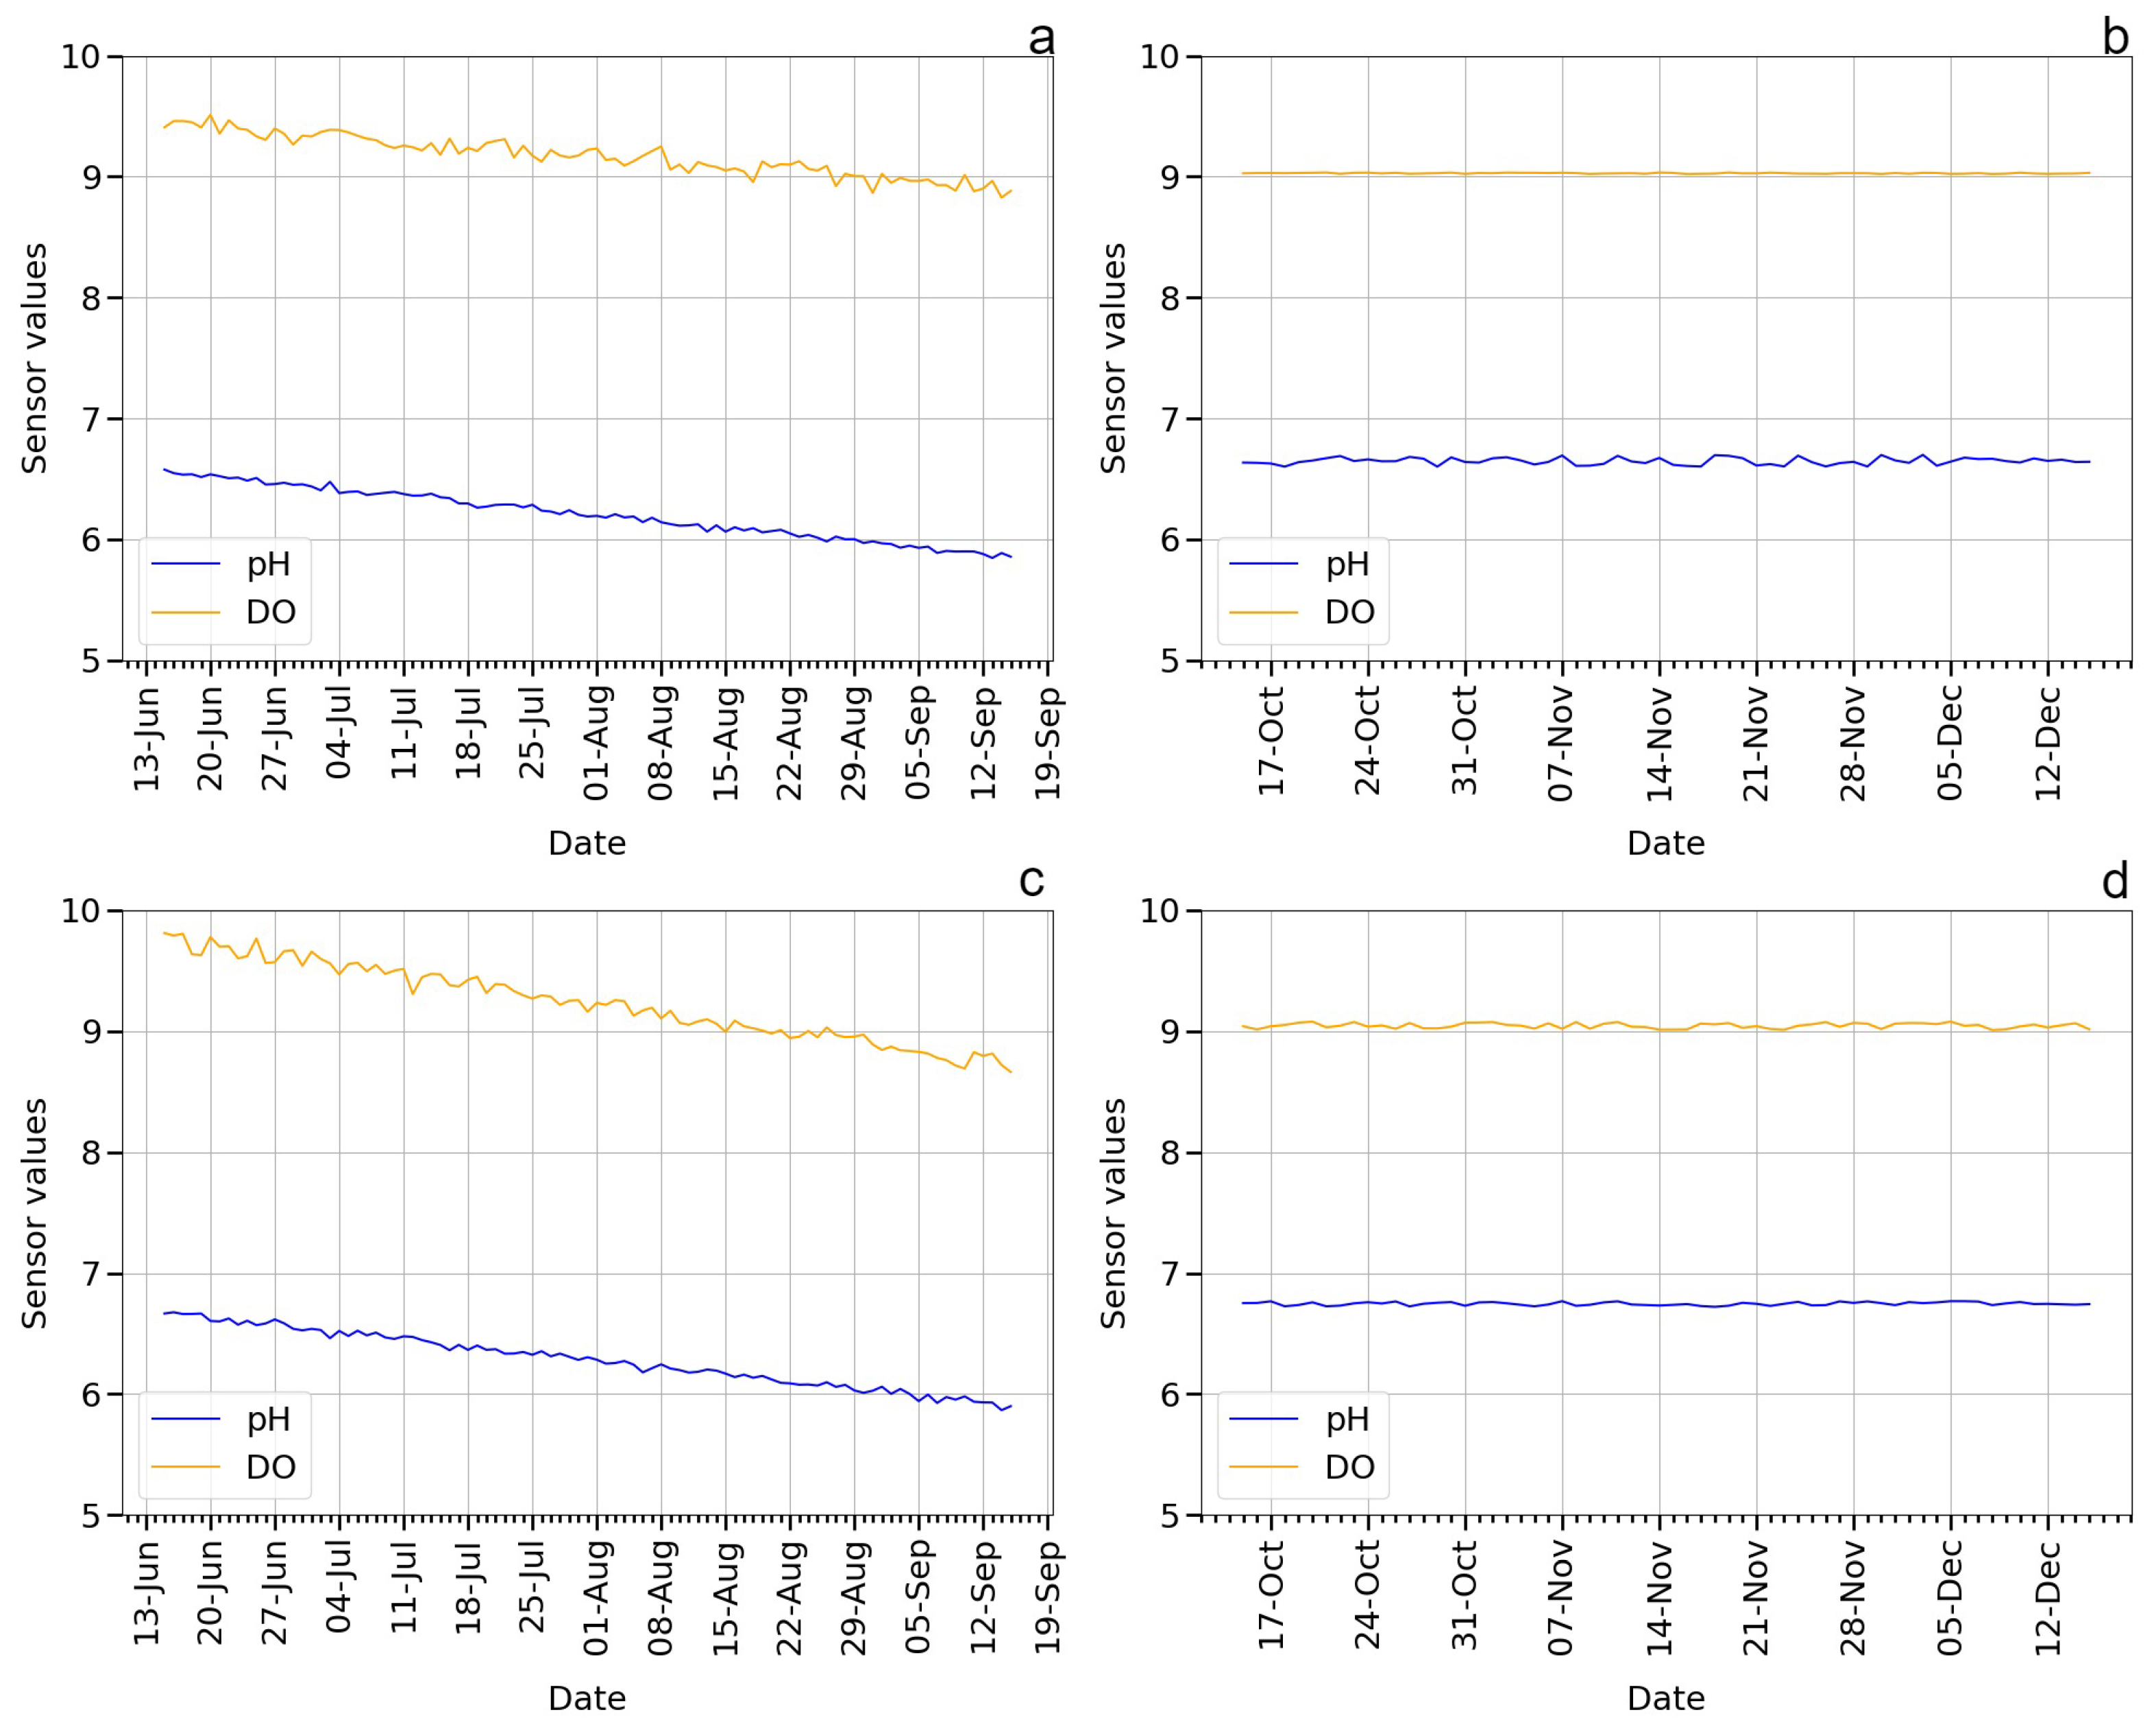
3.2. Sensors and IoT Devices

The main sensors used in the aquaponics system include sensors for water temperature (DFROBOT DS18B20 digital), water pH (DFROBOT Gravity Analog-SEN0161), water turbidity (DFROBOT Analog), dissolved oxygen (DFROBOT Analog DO), total dissolved solids (DFROBOT Analog TDS) and CO2 (DFROBOT Infrared). These sensors were connected to the fish water tank for data collection. The sensors were attached to the Arduino UNO Microcontroller and an ESP8266 Wi-Fi module, which is connected to a standard PC. All these sensors and IoT devices were operated on the USB power from the connected PC. Arduino UNO IDE 2.0 firmware was used for this project.
Overall, the length of the plant, the lengths of the plant leaves, breadth size and leaf–stem size measurements as well as the fish weights and lengths were calculated on a 7-day interval so that the changes would be noticeable. Fish and plant attributes were measured using a measuring scale and a high-precision weighing scale. Fish were fed once daily and the same source of water was used for water replenishment. After the first phase of the project, the growbed media, trays, fish, plants, water, connecting pipes and filters were replaced with new stock to avoid any possibilities of contamination or influence in the new results. The room was sanitized before the second run, using soap water and antibacterial wipes. The second phase of the project was performed for the next 3 months with weekly water replenishment. Figure 2 shows the plants’ attributes, whose data were collected, and that both testbeds were used along with the red tape earthworms added to the vermiponics growbed media.
The fish and plant data collected were segregated as 4 CSV files: two of them for the standard testbed’s data before and after water replenishment and the other two for the vermiponics testbed’s data before and after water replenishment. Python code was used to perform data analysis and comparison. Plant length, leaf length and breadth, and leaf–stem perimeter measurements were stored, and average values were calculated. Fish weight and length were measured for each fish and averaged for 6 fish within the system.

3.3. Algorithm Design

The Pandas library was used for data analysis while the Numpy library was used for mathematical calculation and data analysis. Matplotlib library was used to plot the graph. ‘Avg_Plant_Length’, ‘Avg_Breadth’, ‘Avg_leaf_Length’ and ‘Avg_Stem_size’ columns were used to analyze plant productivity and the ‘Fish_weight_avg’ and ‘Fish_length_avg’ columns of the data were used to analyze fish productivity. The analysis was performed to determine the productivity of both testbeds before and after replenishment and the graph was plotted using the data of the final day of data collection, that is, Day 91 data. The fish productivity data and plant productivity data were added to find out the total testbed productivity for both testbeds before and after replenishment, as shown in Equation (1). Productivity difference in percentage and the growth rate difference were calculated by finding the difference of productivity of testbeds before and after replenishment, and then dividing the value with that of before replenishment productivity, as shown in Equation (2). Linear interpolation was applied to the data to scale up from weekly data to daily data.
( Γ = α + β )
where Γ is the combined productivity, α is the total plant productivity score and β is the total fish productivity score.
Ω = ( ( Φ Θ ) / Θ ) × 100
where Ω is the percentage of productivity difference, Φ is the combined productivity score after replenishment and Θ is the combined productivity score before replenishment.

4. Results

Figure 3 portrays the status of the standard (left) and vermiponics (right) testbeds before and after the replenishment is applied. The plants’ health and size difference is evident from the images upon comparing both testbeds on the first day (Figure 3a) and on the 91st day (Figure 3b) before replenishment and after replenishment (Figure 3c,d), respectively. It is also apparent that vermiponics plants have better productivity than the standard plants with and without replenishment. Figure 4 shows the progressive growth of both testbeds from Day 1, until the 91st day, after replenishment.
Figure 5 shows the productivity comparison on the 91st day of standard and vermiponics testbeds before and after water replenishment. The Y-axis represents attributes such as average plant length, average breadth, average leaf length, average stem size, fish weight and fish length. The X-axis shows the maximum productivity values. The actual productivity values are displayed at the top of every bar in the chart. These comparative charts illustrate a clear picture of the enhanced productivity of each individual attribute after replenishment. Table 1 shows the mean productivity before and after replenishment of the standard testbed. The results showed that there was significant productivity when water replenishment was applied to both testbeds. The vermiponics testbed showed a better and quicker yield than the standard testbed. When water replenishment was performed in the standard testbed, plant length showed a 3.41% better growth compared to the yield without replenishment. Average leaf breadth yielded 8.40% more productivity. Leaf length was 5.33% better grown with replenishment, with a stem size increase of 13.77%. Fish weight was increased by 0.74% and fish length improved by 0.17%. Figure 6a shows a comparison chart between mean productivity before and after replenishment in the standard testbed with a percentage of productivity difference on top of every bar. The X-axis shows plant and fish attributes, and the Y-axis contains the sum of mean productivity. Figure 6b displays a pie chart showing the percentage productivity difference.

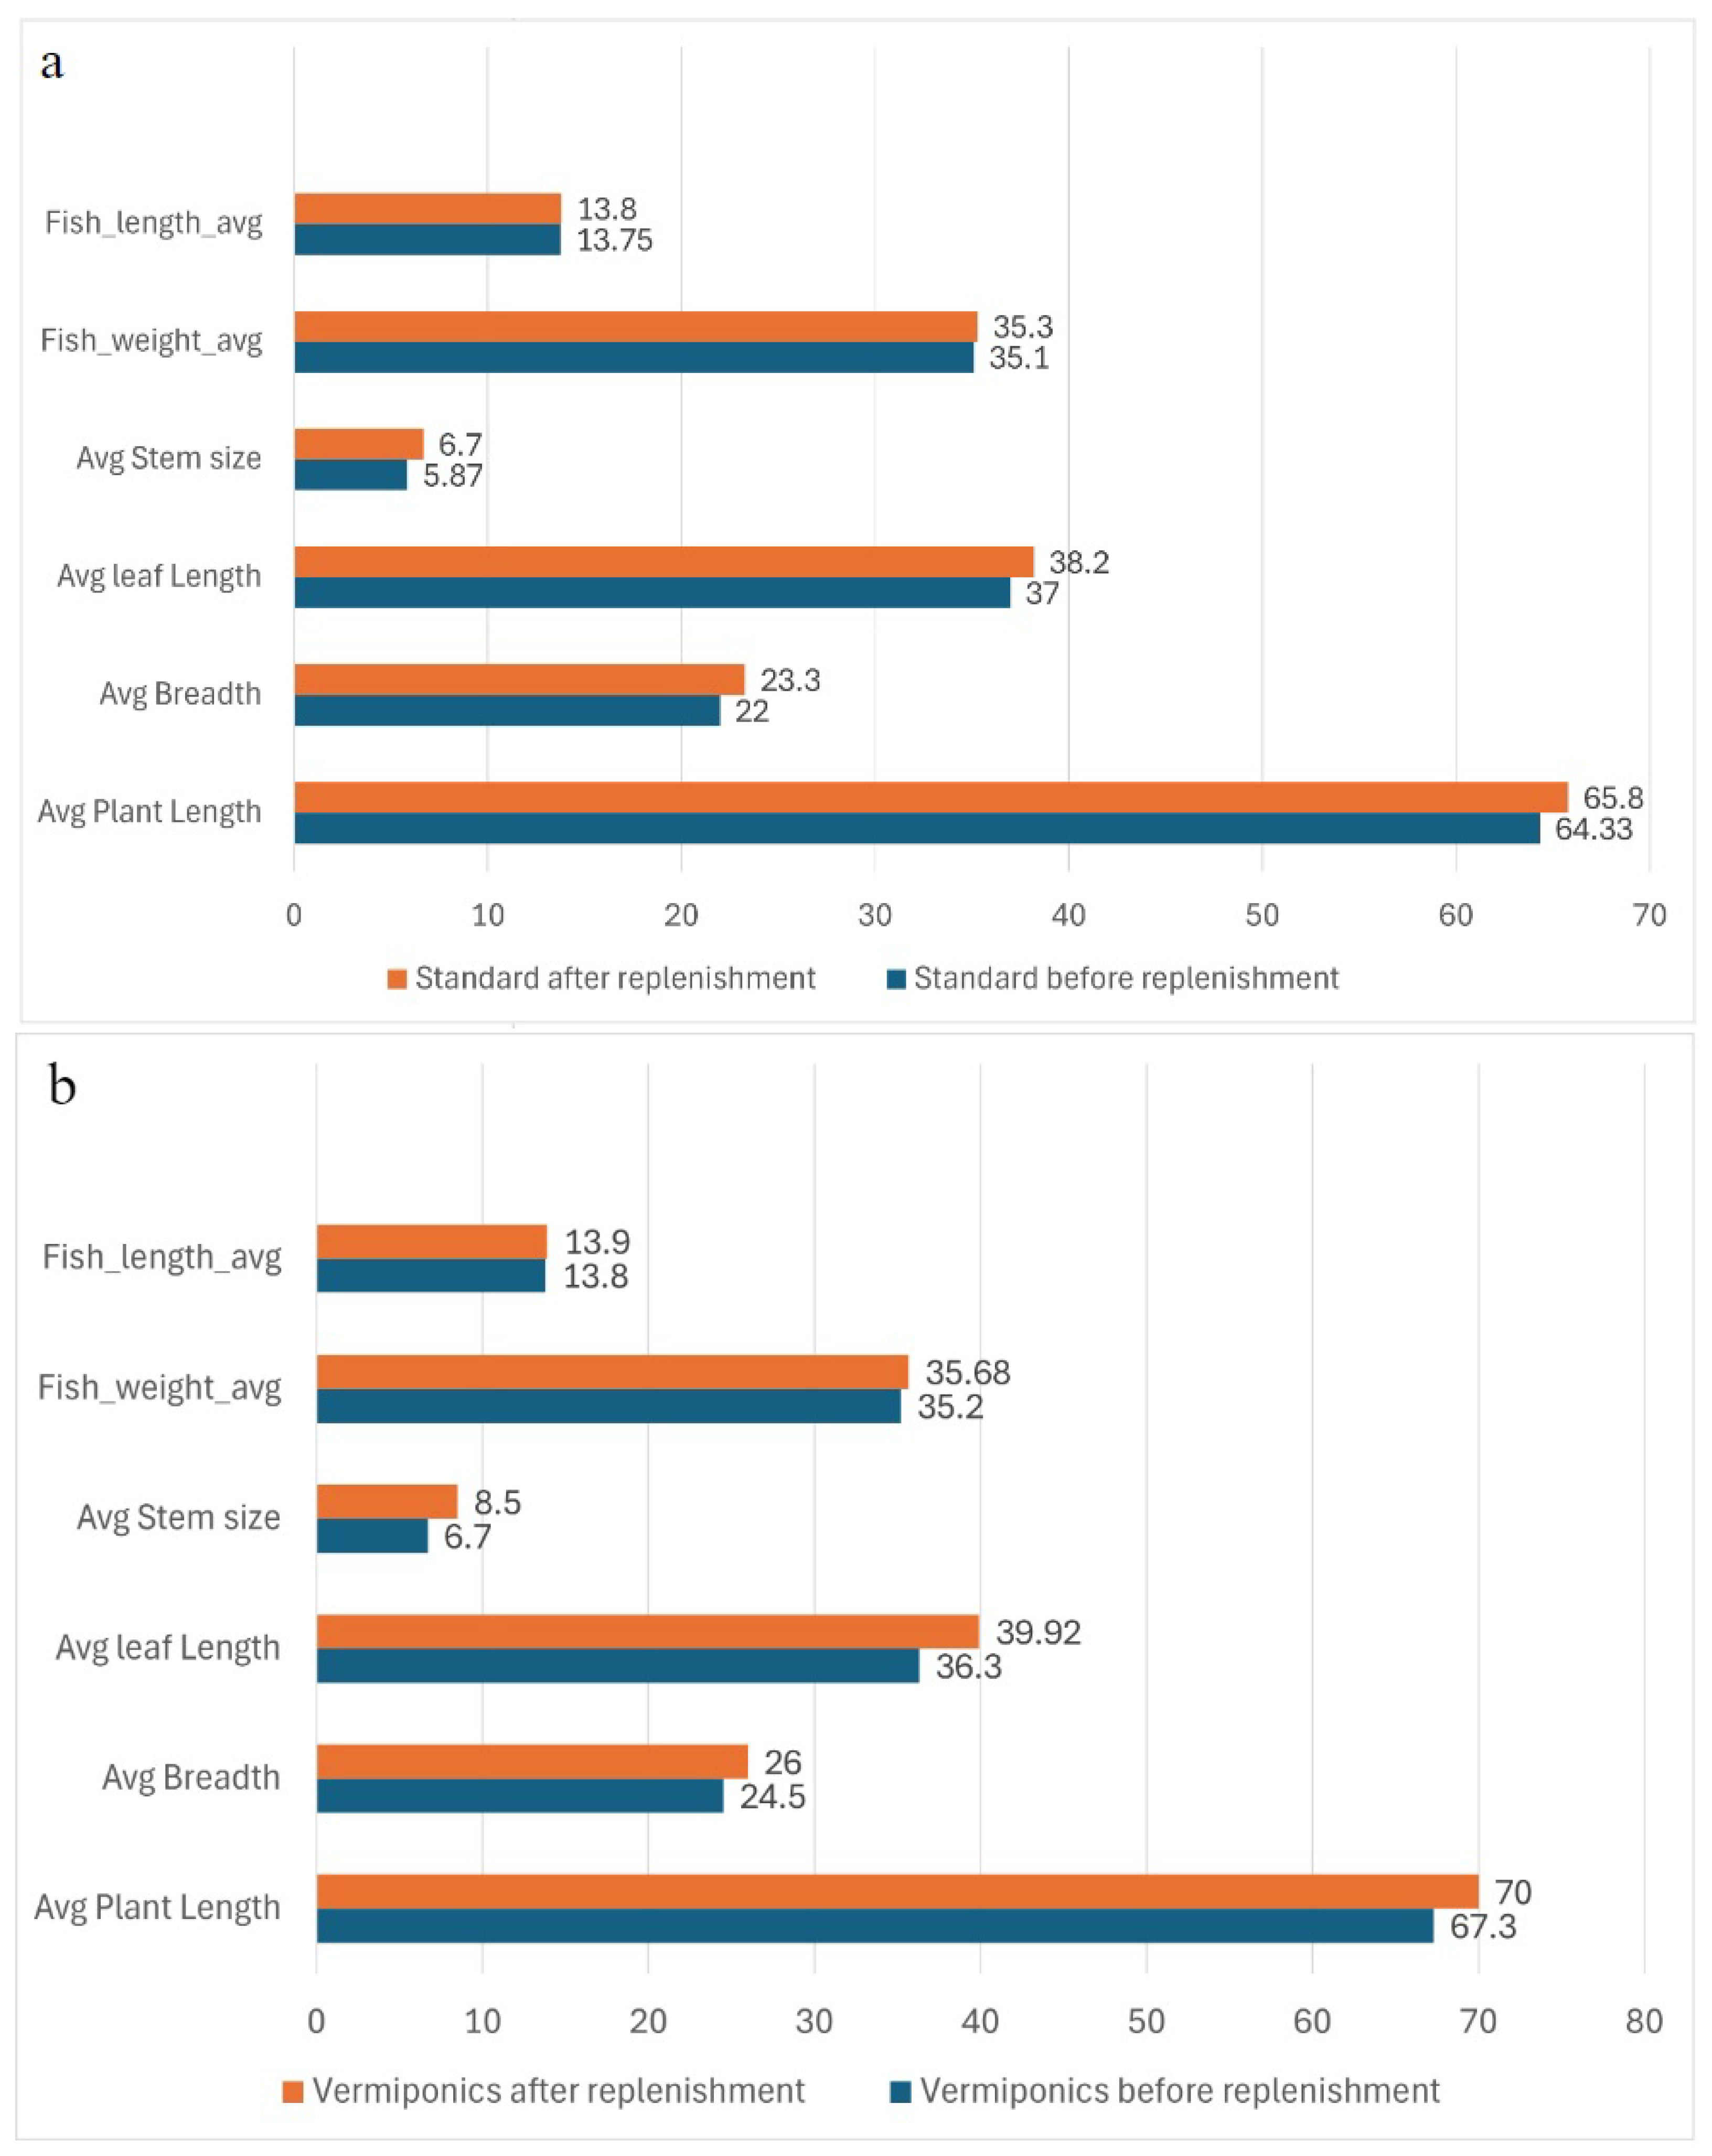
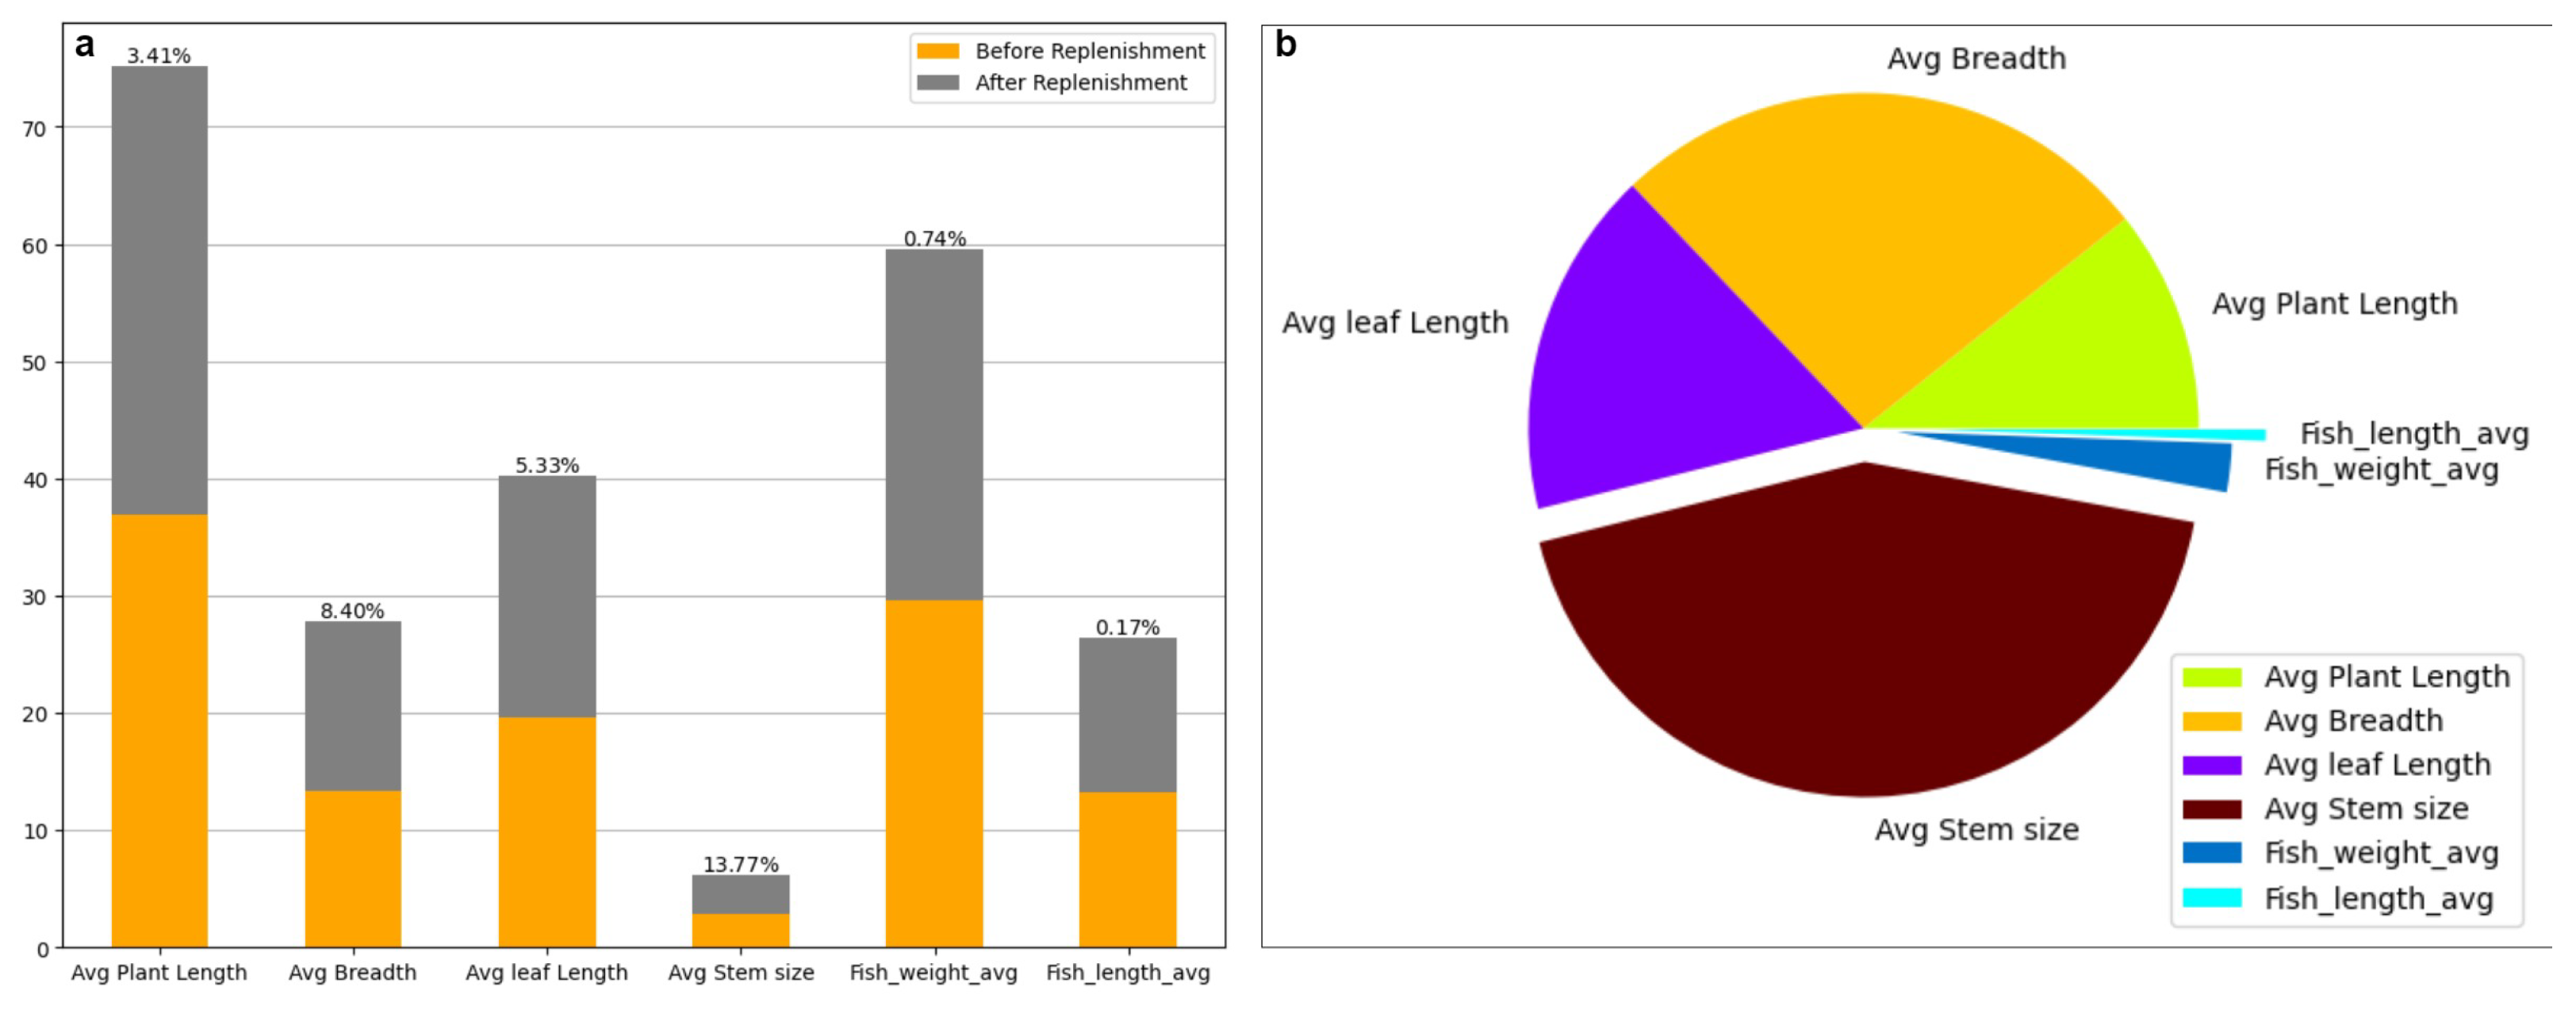
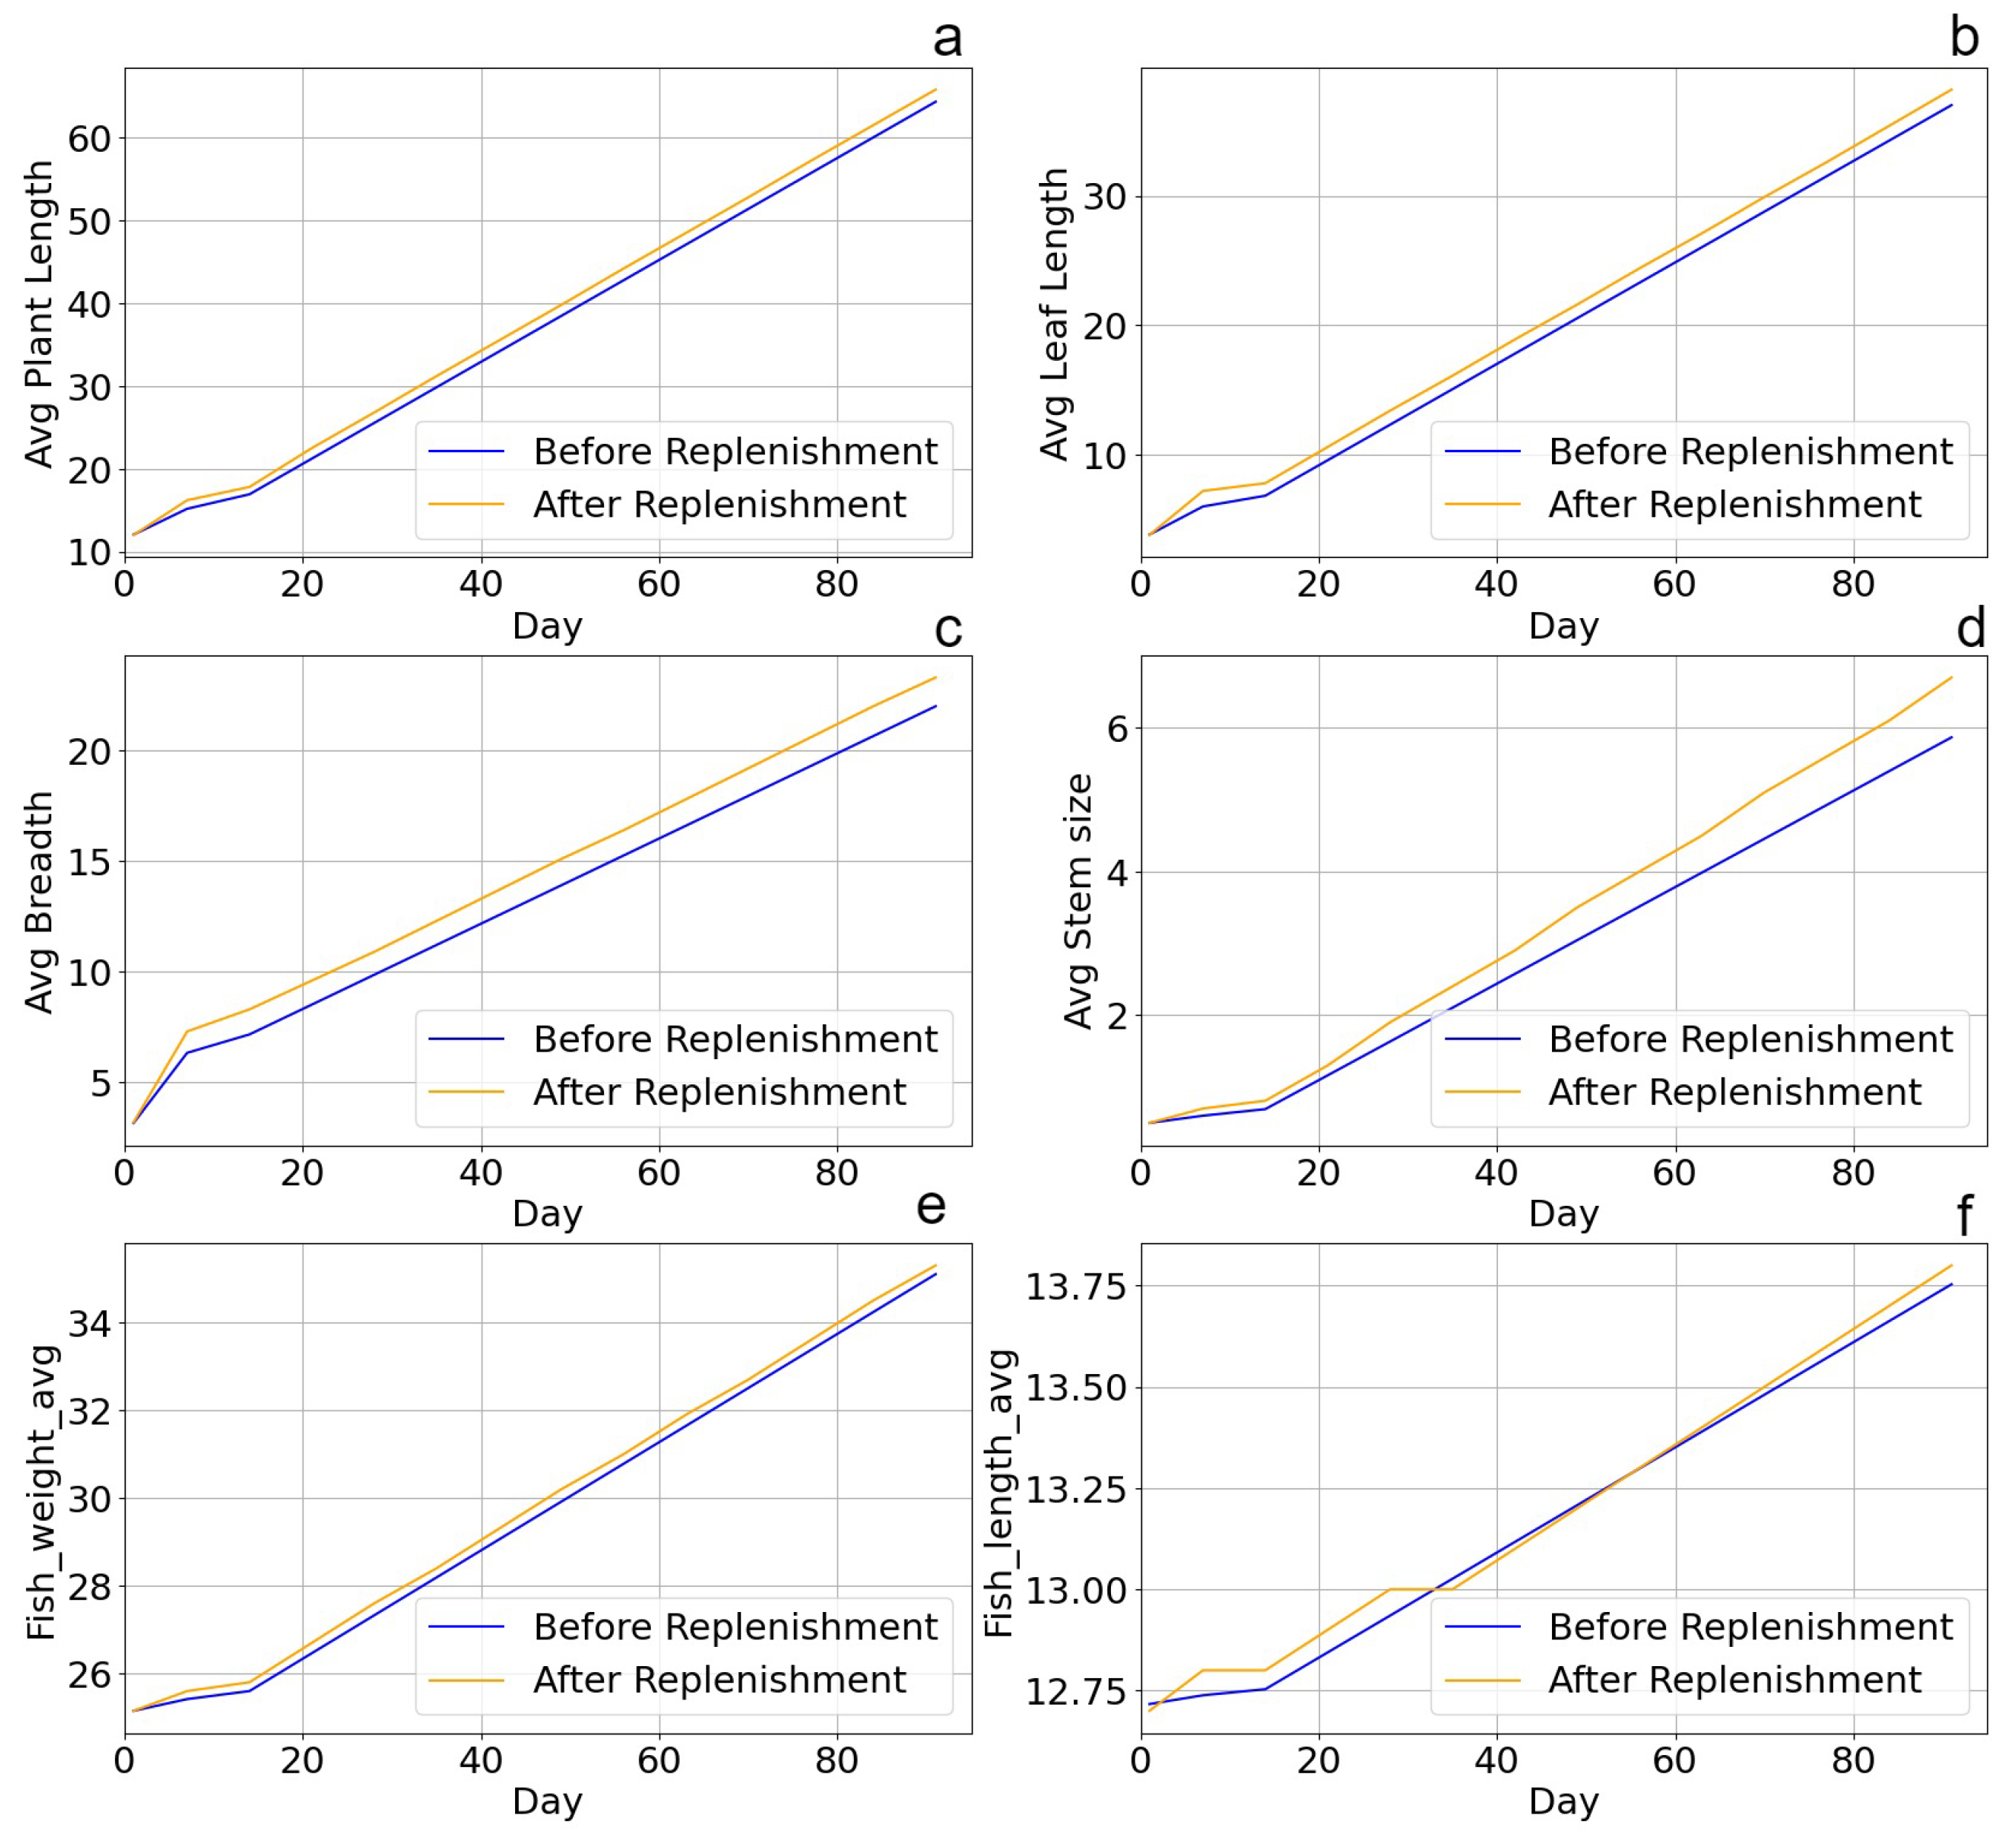
4.1. Standard Testbed Productivity Comparison

Table 2 shows the mean productivity before and after the replenishment of the vermiponics testbed. It is found that the plant length was improved by 5.04% and leaf breadth size was increased by 7.89%. Leaf length was improved by 11.00% with a stem size betterment of 26.06% than the yields without replenishment. Fish weight and fish length had an increase of 2.01% and 0.86%, respectively, showing improvement after replenishment. With respect to average plant length, average breadth, average leaf length, average stem size, average fish weight and fish length, Figure 7a shows a comparison chart between mean productivity before and after replenishment in the vermiponics testbed with the percentage of productivity difference on top of every bar. The X-axis shows the plant and fish attributes, and the Y-axis contains the sum of mean productivity. Figure 7b shows a pie chart showing the percentage productivity difference.

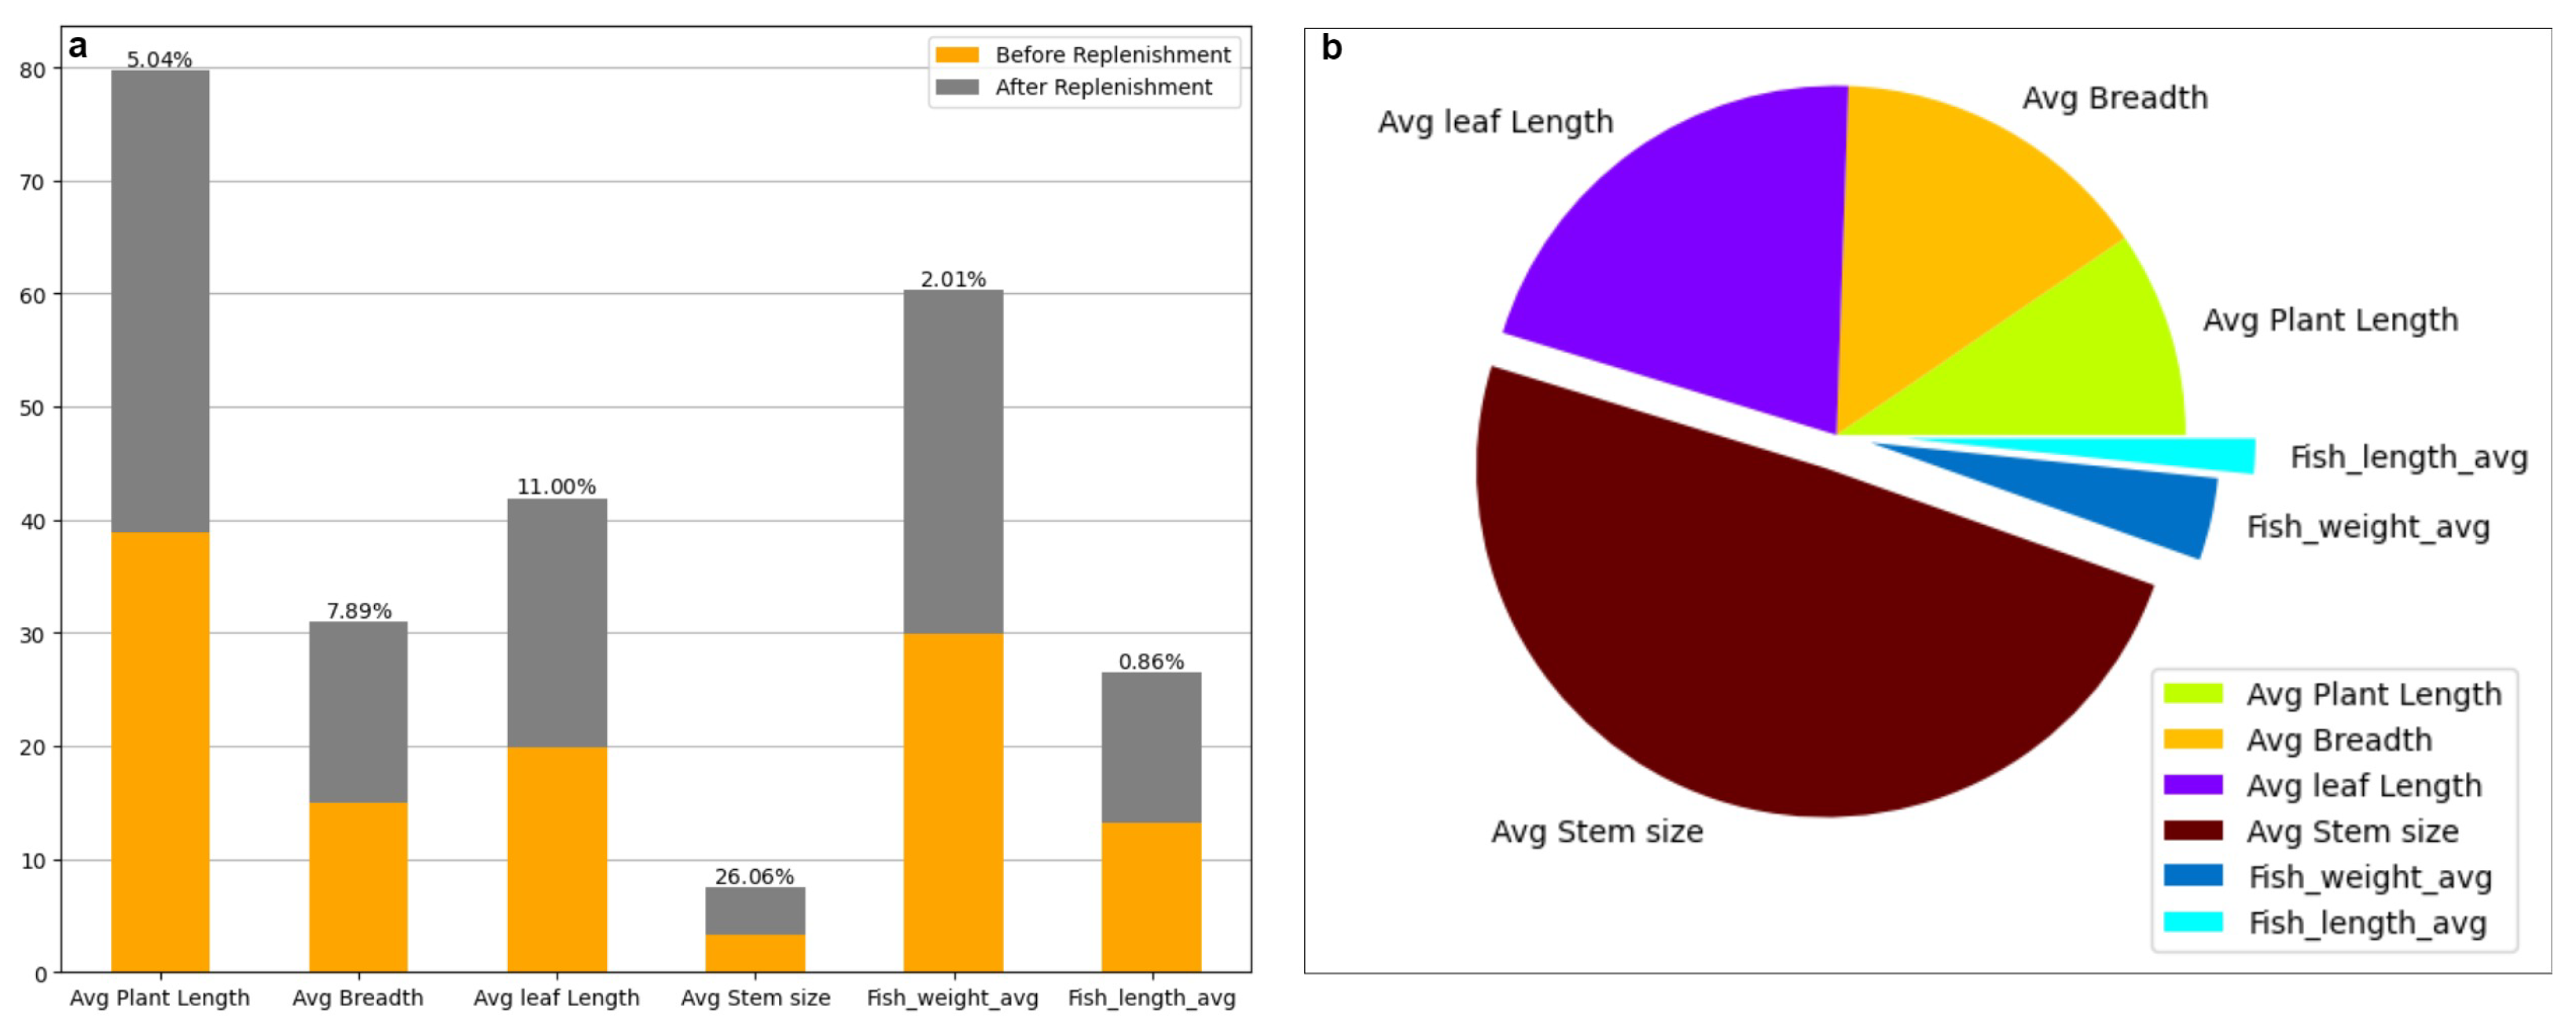
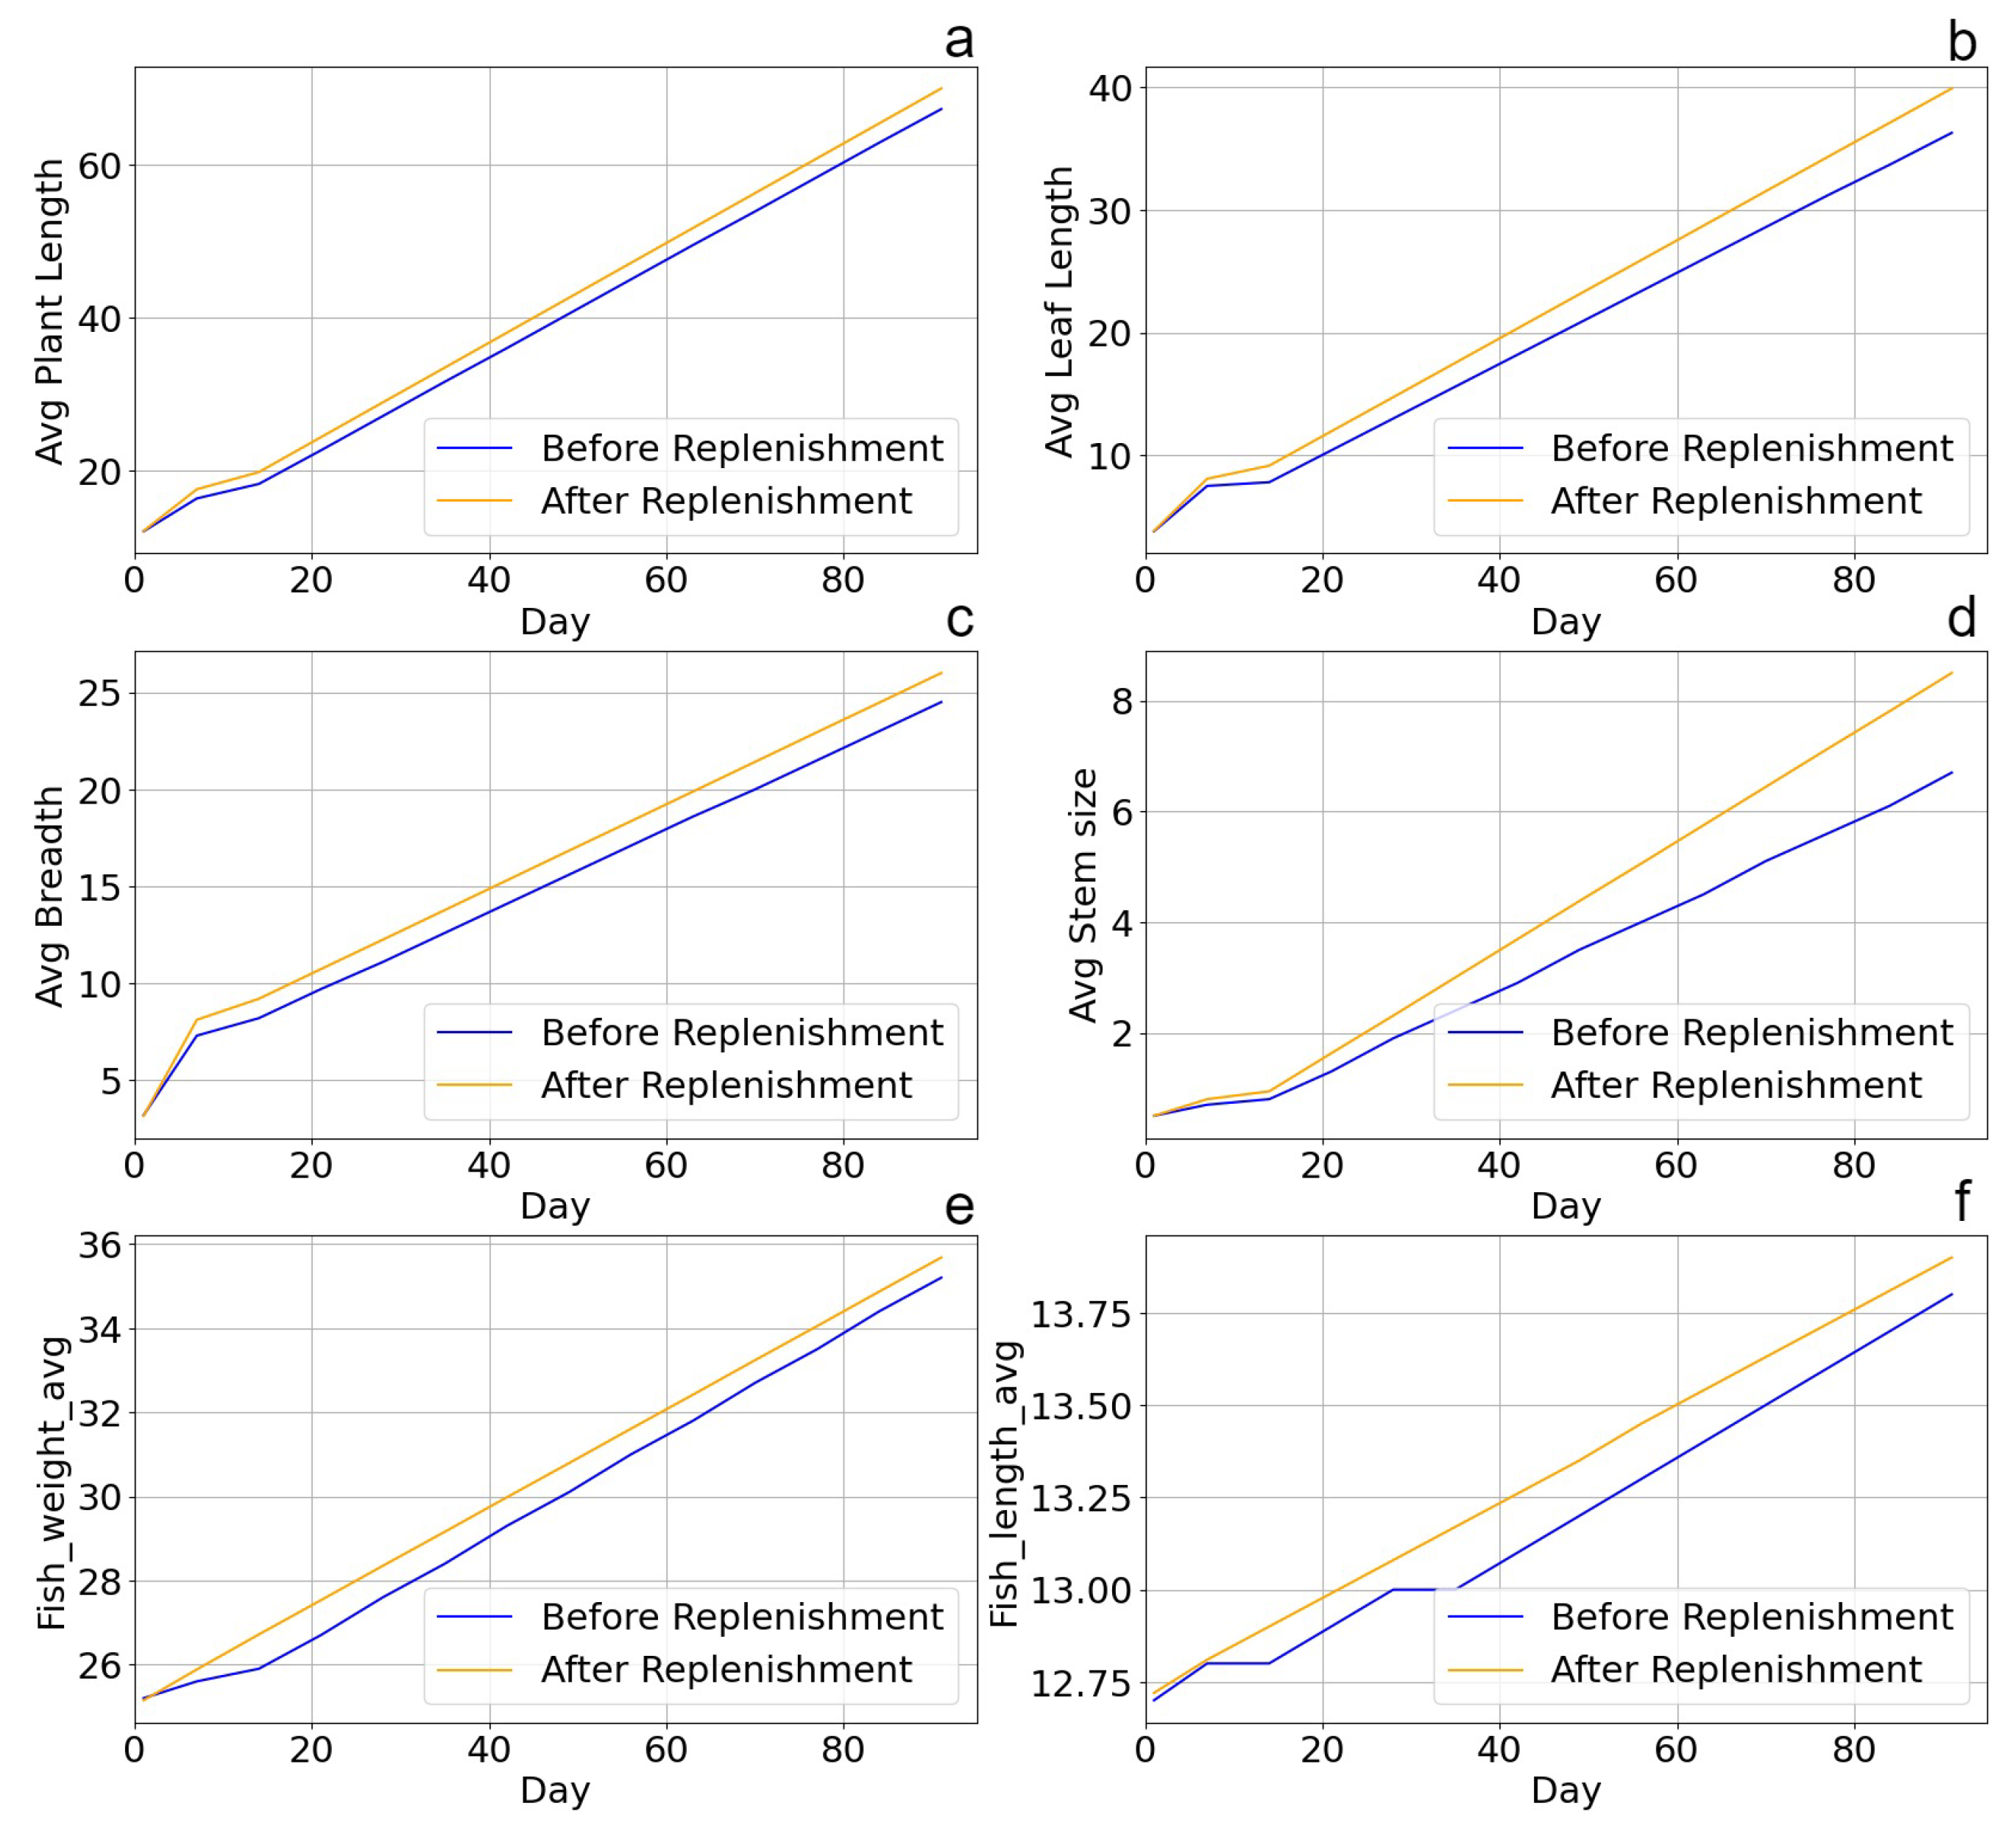
4.2. Vermiponics Testbed Productivity Comparison

Further statistical analysis was performed on the results to determine whether the improvement in the productivity after water replenishment in both testbeds were statistically significant, using t-test and p-values. Paired-sample t-test is generally applied to compare the means of the sample collected from the main group or population, but with different intervals such as pre- and post-tests or before and after a treatment [19]. Mean productivity scores were calculated first using the column values of ‘Avg_Plant_Length’, ‘Avg_Breadth’, ‘Avg_leaf_Length’, ‘Avg_Stem_ ’Fish_weight_avg’ and ‘Fish_length_avg’ column values of the input data. Then, paired t-tests were performed with mean productivity scores determined with before and after replenishment data for both testbeds. The stats.ttest_rel() function was used to perform the test using Python code in Google Colab. libraries. The minimum p-value set for comparison was 0.05. Lower p-values typically suggest that the corresponding t-statistic is associated with highly significant results. Analysis revealed that the p-values are far below 0.05, indicating a significant difference between data before and replenishment. Table 3 shows the attributes and corresponding p-values for standard aquaponics and vermiponics testbeds.
Figure 8 and Figure 9 show the progressions of the daily growth comparison over 91 days on the X-axis and the plant or fish attribute productivity scores attained on the Y-axis for vermiponics and standard testbeds in order, before and after water replenishment. In Figure 8a, the daily growth of plant length is plotted before and after replenishment and a clear difference is shown between the lines plotted. Similarly, all plots show clear differences between the daily growth of all chosen attributes before and after replenishment. These gaps in the plots visually prove the replenishment to be effective for fish and plant productivity.
Key water quality parameters such as dissolved oxygen and pH values seemed to be in the healthy range [20]. pH values were maintained in between 6 and 8, whereas dissolved oxygen values were between 5 and 10 during replenishment. Total Ammonia and Nitrogen values were shown to be less than 1 after replenishment was applied. Figure 10 shows the pH and DO values before and after replenishment was applied. A clear decline in pH and DO values over time is noticeable in the figure, before the replenishment was applied.
A general comparison between the productivity scores of both testbeds before and after water replenishment showed an overall productivity difference of 2.83% for the standard testbed and 5.54% for the vermiponics testbed, indicating a better outcome with replenishment. This is particularly evident in Figure 11, which shows the total productivity score as function of the treatments. The combined productivity was calculated by adding the productivity scores of plants’ attributes with the productivity scores of the fish attributes on Day 91. This calculation was made for both the testbed results before and after replenishment, and the difference in the productivity was inferred.

5. Discussion

Standard aquaponics and vermiponics systems were designed, built and used to assess the impact of water replenishment and earthworm presence on plant and fish growth and the overall productivity of each system. The results proved that water replenishment effectively improves plants and fish growth and the productivity of the aquaponics with and without the presence of earthworms in the growbed. Further improvement of the performance was observed with the vermiponics system. The results are in agreement with the literature that suggests earthworm presence enhances the nutrient availability of plants in the aquaponics [21] and thereby improves the growth of the plants. Similarly, it is reported that the earthworms help to increase the crop yield and root structure of the plants [22]. Earthworms in the aquaponics growbed could improve the biofiltration mechanism and support to mineralize nutrients, influencing the bacterial ecosystem [23]. In both terms of experimentation of this project, it was evident that the vermiponics testbed yielded better productivity than the standard testbed because of the worm’s presence. It is quite evident from the data presented and the images of the vermiponics testbed that it showed a better yield compared to the standard testbed.
Results show that a better yield close to 3% was possible with regular water replenishment of 19 L in a 100-liter fishtank for the standard testbed and a more than 5.5% productivity was possible on the vermiponics system yield. Leaf breadth size showed a slightly better productivity in the standard testbed than the vermiponics system after replenishment. Leaf length and stem size were the two attributes which were highly impacted by water replenishment according to the results. Plant lengths increased faster with the replenishment term than the previous term of growth without replenishment. Fish length and weight increased steadily. The stems of the plants looked stronger, and the leaves were greener and healthier when replenishment was applied. It is also noted that the fish were more active and looked healthier during replenishment. When the water quality parameter values were collected from the fishtank water while no replenishment was applied, pH values were found to drop over time, making the fish water more acidic. Without replenishment, the Total Ammonia Nitrogen (TAN) values were increased from 0 to 1, which is detrimental for fish life [10]. Water temperature showed an increase up to 2 degrees when no replenishment was applied. Dissolved oxygen values dropped over time while turbidity was unaffected. Water replenishment helped the key water quality parameter values to stay optimal. That is, pH and DO values, which dropped when no replenishment was applied, maintained the optimal range throughout the replenishment term. TAN values were at 0 after replenishment. Turbidity values remained unaffected during replenishment. The literature shows that most of the comparative studies have been performed using manual approaches, whereas this project effectively blended the use of technology along with conventional methods.

Limitation and Scope of the Project

The data and results could be influenced by the number and types of fish and plants grown as well as the environmental conditions. The type of aquaponics used could be another influencing factor in optimal replenishment rate calculation. This project is carried out in a standard indoor coupled aquaponics system within a controlled environment. The results discussed above were generated with the data collected from a specific aquaponics system as described in the Section 3. This study was performed on a small-scale aquaponics system, and the application of the results of this research to medium-level or industrial-level farming needs adequate scaling in replenishment rate and other parameters according to the size of the system. The replenishment rate calculated in the project was sensitive to the aquaponics tank capacity used. This project used a 100 L water tank and optimal rate, and water quality was calculated accordingly. The experimentation was carried out in a controlled environment inside a closed room where artificial lighting was provided. A 19 L water replenishment system was used in this study and a different replenishment rate may result in different productivity rates. The results may have been impacted by the room environment such as humidity, room temperature and carbon dioxide levels. Artificial light operation timing, water recirculation timing, feed timing and feed quantity may have also influenced the results obtained. The results discussed are based on experimentation which was conducted for 91 days. The number of days may have influenced the productivity and impact of replenishment. That is, experimentation in an uncontrolled environment for a longer period than 91 days may cause variations in room temperature and humidity, which can potentially influence the water quality.
This project opens a new arena of research in various aspects of smart aquaponics. Investigation on the effect of water replenishment on the plant’s nutrients could be a potential research topic. Further analysis on the impact of the earthworms on different fish and plant types could be investigated. This research will be further explored with the growth-stage classification of the Swiss chards using machine vision and machine learning. Plant harvest time prediction is another prospective topic for investigation as a future step.

6. Conclusions

Fish and plants were grown on an aquaponics standard testbed and a vermiponics testbed for three months without water replenishment and the next three months with water replenishment. Both systems were monitored using sensors and IoT devices. The plants’ attributes selected were plant length, leaf length, stem size and leaf size, whereas the fish attributes chosen were fish weight and fish length. The main observation from this study was that there was better fish and plant growth as well as clear productivity improvement in the yields produced, with water replenishment. The changes observed with the water replenishment were statistically significant. Under the current investigation conditions, adding earthworms in the growbed enhances productivity as water replenishment resulted in 2.83% and 5.54% overall productivity improvement for the standard aquaponics and vermiponics systems, respectively. This research will be further explored with the growth-stage classification of the Swiss chards using machine vision and machine learning. Plant harvest time prediction is another prospective topic for investigation as the growth rate of the two systems were slightly different.

Author Contributions

Conceptualization, P.C. and F.T.-M.; methodology, P.C. and F.T.-M.; software, P.C. and A.G.; validation, P.C., F.T.-M., A.G. and L.N.; formal analysis, P.C., F.T.-M., A.G. and L.N.; investigation, P.C.; resources, P.C.; data curation, P.C.; writing—original draft preparation, P.C.; writing—review and editing, P.C., F.T.-M., A.G. and L.N.; visualization, P.C.; supervision, F.T.-M. and A.G.; project administration, A.G. and F.T.-M.; funding acquisition, F.T.-M. All authors have read and agreed to the published version of the manuscript.

Funding

This project has been partially internally funded by the School of Engineering, Computing, and Mathematical Sciences at the University of Wolverhampton and supported by the EU Horizon 2020 MSCA RISE Project ReACTIVE Too, Grant Agreement No 871163.

Institutional Review Board Statement

This animal study was approved by the Faculty of Science and Engineering ethics committee (LSEC/202122/AA/147), University of Wolverhampton. This study was conducted in accordance with the local legislation and institutional requirements.

Informed Consent Statement

Not applicable.

Data Availability Statement

The raw data supporting the conclusions of this article will be made available by the authors on request.

Conflicts of Interest

The authors declare that the research was conducted in the absence of any commercial or financial relationships that could be construed as a potential conflict of interest.

Abbreviations

The following abbreviations are used in this manuscript:
IOTInternet of Things
MLMachine Learning
APSAquaponics Systems
TANTotal Ammonia and Nitrogen
pHPotential Hydrogen
TDSsTotal Dissolved Solids
DODissolved Oxygen

References

  1. Delaide, B.; Delhaye, G.; Dermience, M.; Gott, J.; Soyeurt, H.; Jijakli, M.H. Plant and fish production performance, nutrient mass balances, energy and water use of the PAFF Box, a small-scale aquaponic system. Aquac. Eng. 2017, 78, 130–139. [Google Scholar] [CrossRef]
  2. Goddek, S.; Joyce, A.; Kotzen, B.; Dos-Santos, M. Aquaponics and Global Food Challenges. In Aquaponics Food Production Systems; Springer: Berlin/Heidelberg, Germany, 2019; pp. 3–17. [Google Scholar] [CrossRef]
  3. Ahmed, N.; Al-Mutairi, K.A. Earthworms effect on microbial population and soil fertility as well as their interaction with agriculture practices. Sustainability 2022, 14, 7803. [Google Scholar] [CrossRef]
  4. Sandell, L. Vermicompost for Reduction of Vegetable Waste-and a Possible Means to Produce Fish Feed in Aquaponic Systems; Swedish University of Agricultural Sciences: Uppsala, Sweden, 2014. [Google Scholar]
  5. Garczyńska, M.; Kostecka, J.; Pączka, G.; Mazur-Pączka, A.; Cebulak, T.; Butt, K.R. Chemical composition of earthworm (Dendrobaena veneta Rosa) biomass is suitable as an alternative protein source. Int. J. Environ. Res. Public Health 2023, 20, 3108. [Google Scholar] [CrossRef] [PubMed]
  6. Musyoka, S.N.; Liti, D.M.; Ogello, E.; Waidbacher, H. Utilization of the earthworm, Eisenia fetida (Savigny, 1826) as an alternative protein source in fish feeds processing: A review. Aquac. Res. 2019, 50, 2301–2315. [Google Scholar] [CrossRef]
  7. Forchino, A.; Lourguioui, H.; Brigolin, D.; Pastres, R. Aquaponics and sustainability: The comparison of two different aquaponic techniques using the Life Cycle Assessment (LCA). Aquac. Eng. 2017, 77, 80–88. [Google Scholar] [CrossRef]
  8. Akazawa, S.i.; Badamkhatan, T.; Omiya, K.; Shimizu, Y.; Hasegawa, N.; Sakai, K.; Kamimura, K.; Takeuchi, A.; Murakami, Y. The Growth-Promoting Effect of Earthworm Vermiwash on House Tomato Plants. Sustainability 2023, 15, 10327. [Google Scholar] [CrossRef]
  9. Deepthi, M.P.; Nivethitha, S.; Saminathan, K.; Narendhirakannan, R.T.; Karmegam, N.; Kathireswari, P. Effect of vermiwash prepared from livestock biowaste as vermiponics medium on the growth and biochemical indices of Amaranthus viridis L. Environ. Technol. Innov. 2021, 21, 101300. [Google Scholar] [CrossRef]
  10. Chandramenon, P.; Gascoyne, A.; Tchuenbou-Magaia, F. IoT and machine learning approach for the determination of optimal freshwater replenishment rate in aquaponics system. Front. Sustain. Resour. Manag. 2024, 3, 1363914. [Google Scholar] [CrossRef]
  11. Endut, A.; Jusoh, A.; Ali, N.; Nik, W.W.; Hassan, A. A study on the optimal hydraulic loading rate and plant ratios in recirculation aquaponic system. Bioresour. Technol. 2010, 101, 1511–1517. [Google Scholar] [CrossRef] [PubMed]
  12. Franco, I.; Faustino, E.; Mota, A.; Bernardino, R. Sustainable nutrients: Vermicompost, a tool to additivate aquaponic systems. Front. Mar. Sci. 2018, 5. [Google Scholar] [CrossRef]
  13. Das, B.; Islam, S.M.; Nag, S.K.; Vatsos, I.N.; Siddik, M.A. Earthworm, Perionyx excavatus as an alternate protein source for Nile tilapia: Effects on growth performance, blood biochemistry, erythrocyte morphology and intestinal health. Aquac. Int. 2024, 1–23. [Google Scholar] [CrossRef]
  14. Ingram, G. Substances involved in the natural resistance of fish to infection—A review. J. Fish Biol. 1980, 16, 23–60. [Google Scholar] [CrossRef]
  15. Falahatkar, B. Nutritional requirements of the Siberian sturgeon: An updated synthesis. In The Siberian Sturgeon (Acipenser baerii, Brandt, 1869) Volume 1-Biology; Springer: Cham, Switzerland, 2018; pp. 207–228. [Google Scholar]
  16. Rico-García, E.; Esteban Ortega-Torres, A.; Sabino Herrera-Matallana, T. Vermiliquer as a biostimulant and antioxidant in hydroponic lettuce (Lactuca sativa). Production 2023, 50, 25–31. [Google Scholar]
  17. Kasozi, N.; Wilhelmi, B.; Kaiser, H. The effect of the addition of a probiotic mixture of two Bacillus species to a coupled aquaponics system on water quality, growth and digestive enzyme activity of Mozambique tilapia, Oreochromis mossambicus. J. Appl. Aquac. 2021, 35, 510–528. [Google Scholar] [CrossRef]
  18. Karimanzira, D.; Rauschenbach, T. Enhancing aquaponics management with IoT-based Predictive Analytics for efficient information utilization. Inf. Process. Agric. 2019, 6, 375–385. [Google Scholar] [CrossRef]
  19. Okoye, K.; Hosseini, S. T-test Statistics in R: Independent Samples, Paired Sample, and One Sample T-tests. In R Programming: Statistical Data Analysis in Research; Springer: Berlin/Heidelberg, Germany, 2024; pp. 159–186. [Google Scholar]
  20. Sallenave, R. Important Water Quality Parameters in Aquaponics Systems; College of Agricultural, Consumer and Environmental Sciences: Urbana, IL, USA, 2016. [Google Scholar]
  21. Fox, B.K.; Tamaru, C.S.; Radovich, T.; Klinger-Bowen, R.; McGovern-Hopkins, K.; Bright, L.; Pant, A.; Gurr, I.; Sugano, J.; Sipes, B.; et al. Beneficial Use of Vermicompost in Aquaponic Vegetable Production; Hānai ‘Ai/the Food Provider: Hawai, HI, USA, 2011; pp. 1–5. [Google Scholar]
  22. Pant, A.P.; Radovich, T.J.; Hue, N.V.; Talcott, S.T.; Krenek, K.A. Vermicompost extracts influence growth, mineral nutrients, phytonutrients and antioxidant activity in pak choi (Brassica rapa cv. Bonsai, Chinensis group) grown under vermicompost and chemical fertiliser. J. Sci. Food Agric. 2009, 89, 2383–2392. [Google Scholar] [CrossRef]
  23. Kasozi, N.; Abraham, B.; Kaiser, H.; Wilhelmi, B. The complex microbiome in aquaponics: Significance of the bacterial ecosystem. Ann. Microbiol. 2021, 71, 1. [Google Scholar] [CrossRef]
Figure 1. IoT communication in this project.
Applsci 14 08516 g001
Figure 2. (a) Plant attributes defined for productivity comparison. (b) Standard (left) and vermiponics (right) testbeds with fishtanks of 100 L capacity under them, and artificial LED lights on top of them. Both testbeds have black plastic frames with two shelves separating the growbeds and fishtanks. (c) Red tape earthworms added onto the growbed media.
Applsci 14 08516 g002
Figure 3. Standard testbed and vermiponics testbed on (a) Day 1 and (b) Day 91 without replenishment. Standard testbed and vermiponics testbed on (c) Day 1 and (d) Day 91 with replenishment.
Applsci 14 08516 g003
Figure 4. Growth stages of the aquaponics and vermiponics testbeds on Day 1, Day 15, Day 30, Day 60, Day 75 and Day 91 after replenishment is applied. In all images, the standard testbed is on the left side and the vermiponics testbed is on the right side.
Applsci 14 08516 g004
Figure 5. Comparison of (a) standard and (b) vermiponics testbeds before and after water replenishment. The Y-axis represents attributes such as average plant length, average breadth, average leaf length, average stem size, fish weight and fish length. The X-axis shows the maximum productivity values. The data labels display the productivity values of the attributes of the 91st day.
Applsci 14 08516 g005
Figure 6. (a) Comparison chart between mean productivity before and after replenishment in the standard testbed with percentage of productivity difference on top of every bar. The X-axis shows plant and fish attributes, and the Y-axis contains the sum of mean productivity. (b) A pie chart showing the percentage productivity difference.
Applsci 14 08516 g006
Figure 7. (a) Comparison chart between mean productivity before and after replenishment in vermiponics testbed with percentage of productivity difference on top of every bar. The X-axis shows plant and fish attributes, and the Y-axis contains sum of mean productivity. (b) A pie chart showing the percentage productivity difference.
Applsci 14 08516 g007
Figure 8. Daily growth of plant and fish attributes of vermiponics testbed before and after replenishment. (a) Daily growth of plant length; (b) leaf breadth comparison; (c) leaf length. (d) The stem size growth. (e,f) The fish weights and fish length daily growth, in order.
Applsci 14 08516 g008
Figure 9. Daily growth of plant and fish attributes of the standard testbed before and after replenishment. (a) Daily growth of plant length; (b) leaf breadth comparison; and (c) leaf length. (d) shows the stem size growth. (e,f) The fish weights and fish length daily growth in order.
Applsci 14 08516 g009
Figure 10. pH and DO sensor values for (a) standard aquaponics before replenishment term and (b) standard aquaponics during replenishment; (c) vermiponics before replenishment term and (d) vermiponics during replenishment.
Applsci 14 08516 g010
Figure 11. General comparison between standard and vermiponics testbed before and after water replenishment against the productivity score.
Applsci 14 08516 g011
Table 1. Mean productivity comparison with productivity difference percentage for standard testbed.
AttributesMean Productivity before ReplenishmentMean Productivity after Replenishment% of Productivity Difference
Avg plant length36.9238.183.42
Avg breadth13.3114.428.41
Avg leaf length19.5820.635.33
Avg stem size2.893.2913.78
Fish weight avg29.6429.860.75
Fish length avg13.1713.200.17
Table 2. Mean productivity comparison with productivity difference percentage for vermiponics testbed.
AttributesMean Productivity before ReplenishmentMean Productivity after Replenishment% of Productivity Difference
Avg plant length38.8640.825.04
Avg breadth14.9116.097.89
Avg leaf length19.8622.0511.01
Avg stem size3.294.1526.06
Fish weight avg29.8330.432.02
Fish length avg13.2013.310.86
Table 3. Attributes with p-values for standard aquaponics and vermiponics.
Attributesp-Value (Aquaponics)p-Value (Vermiponics)
Avg Plant Length 8.31 × 10 61 1.77 × 10 54
Avg Breadth 2.15 × 10 66 1.31 × 10 57
Avg leaf Length 6.81 × 10 71 1.10 × 10 39
Avg Stem size 7.59 × 10 29 1.60 × 10 25
Fish weight avg 2.91 × 10 63 3.08 × 10 50
Fish length avg 7.80 × 10 12 1.78 × 10 43
Disclaimer/Publisher’s Note: The statements, opinions and data contained in all publications are solely those of the individual author(s) and contributor(s) and not of MDPI and/or the editor(s). MDPI and/or the editor(s) disclaim responsibility for any injury to people or property resulting from any ideas, methods, instructions or products referred to in the content.

