
A New Criterion for the Splashing of a Droplet on Dry Surface from High-Fidelity Simulations


Abstract
:1. Introduction
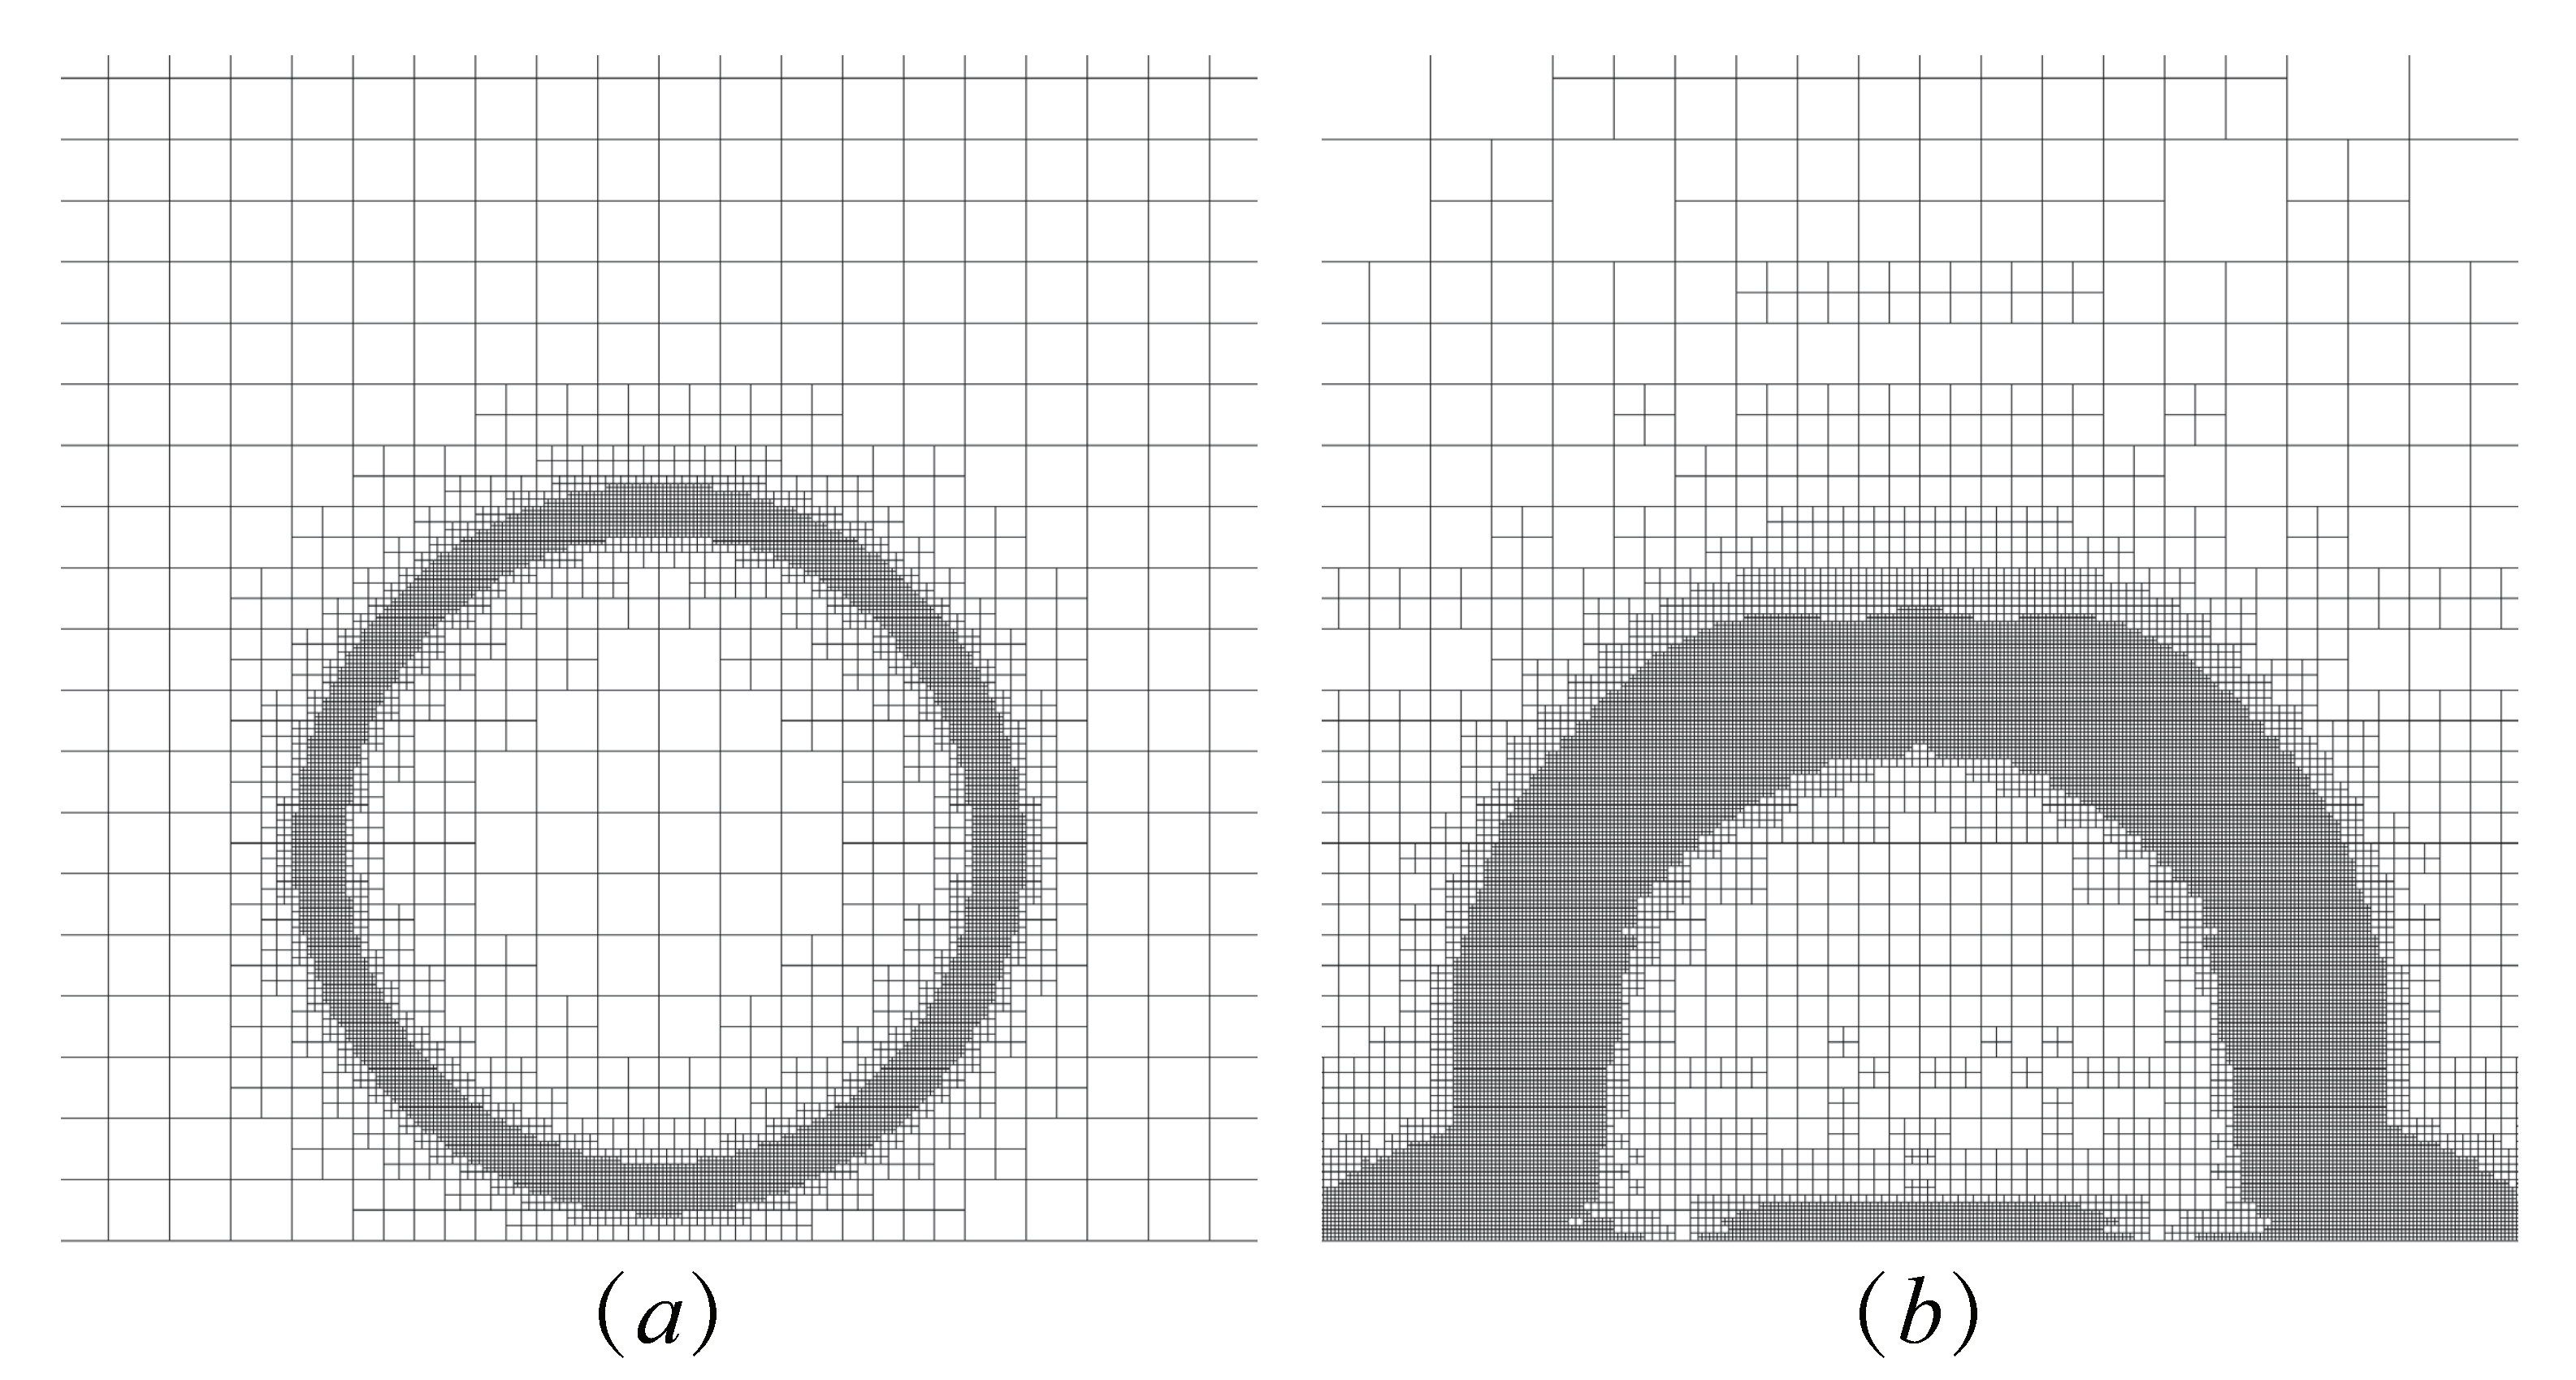
2. Numerical Method
3. Physical Model and Numerical Method Validation
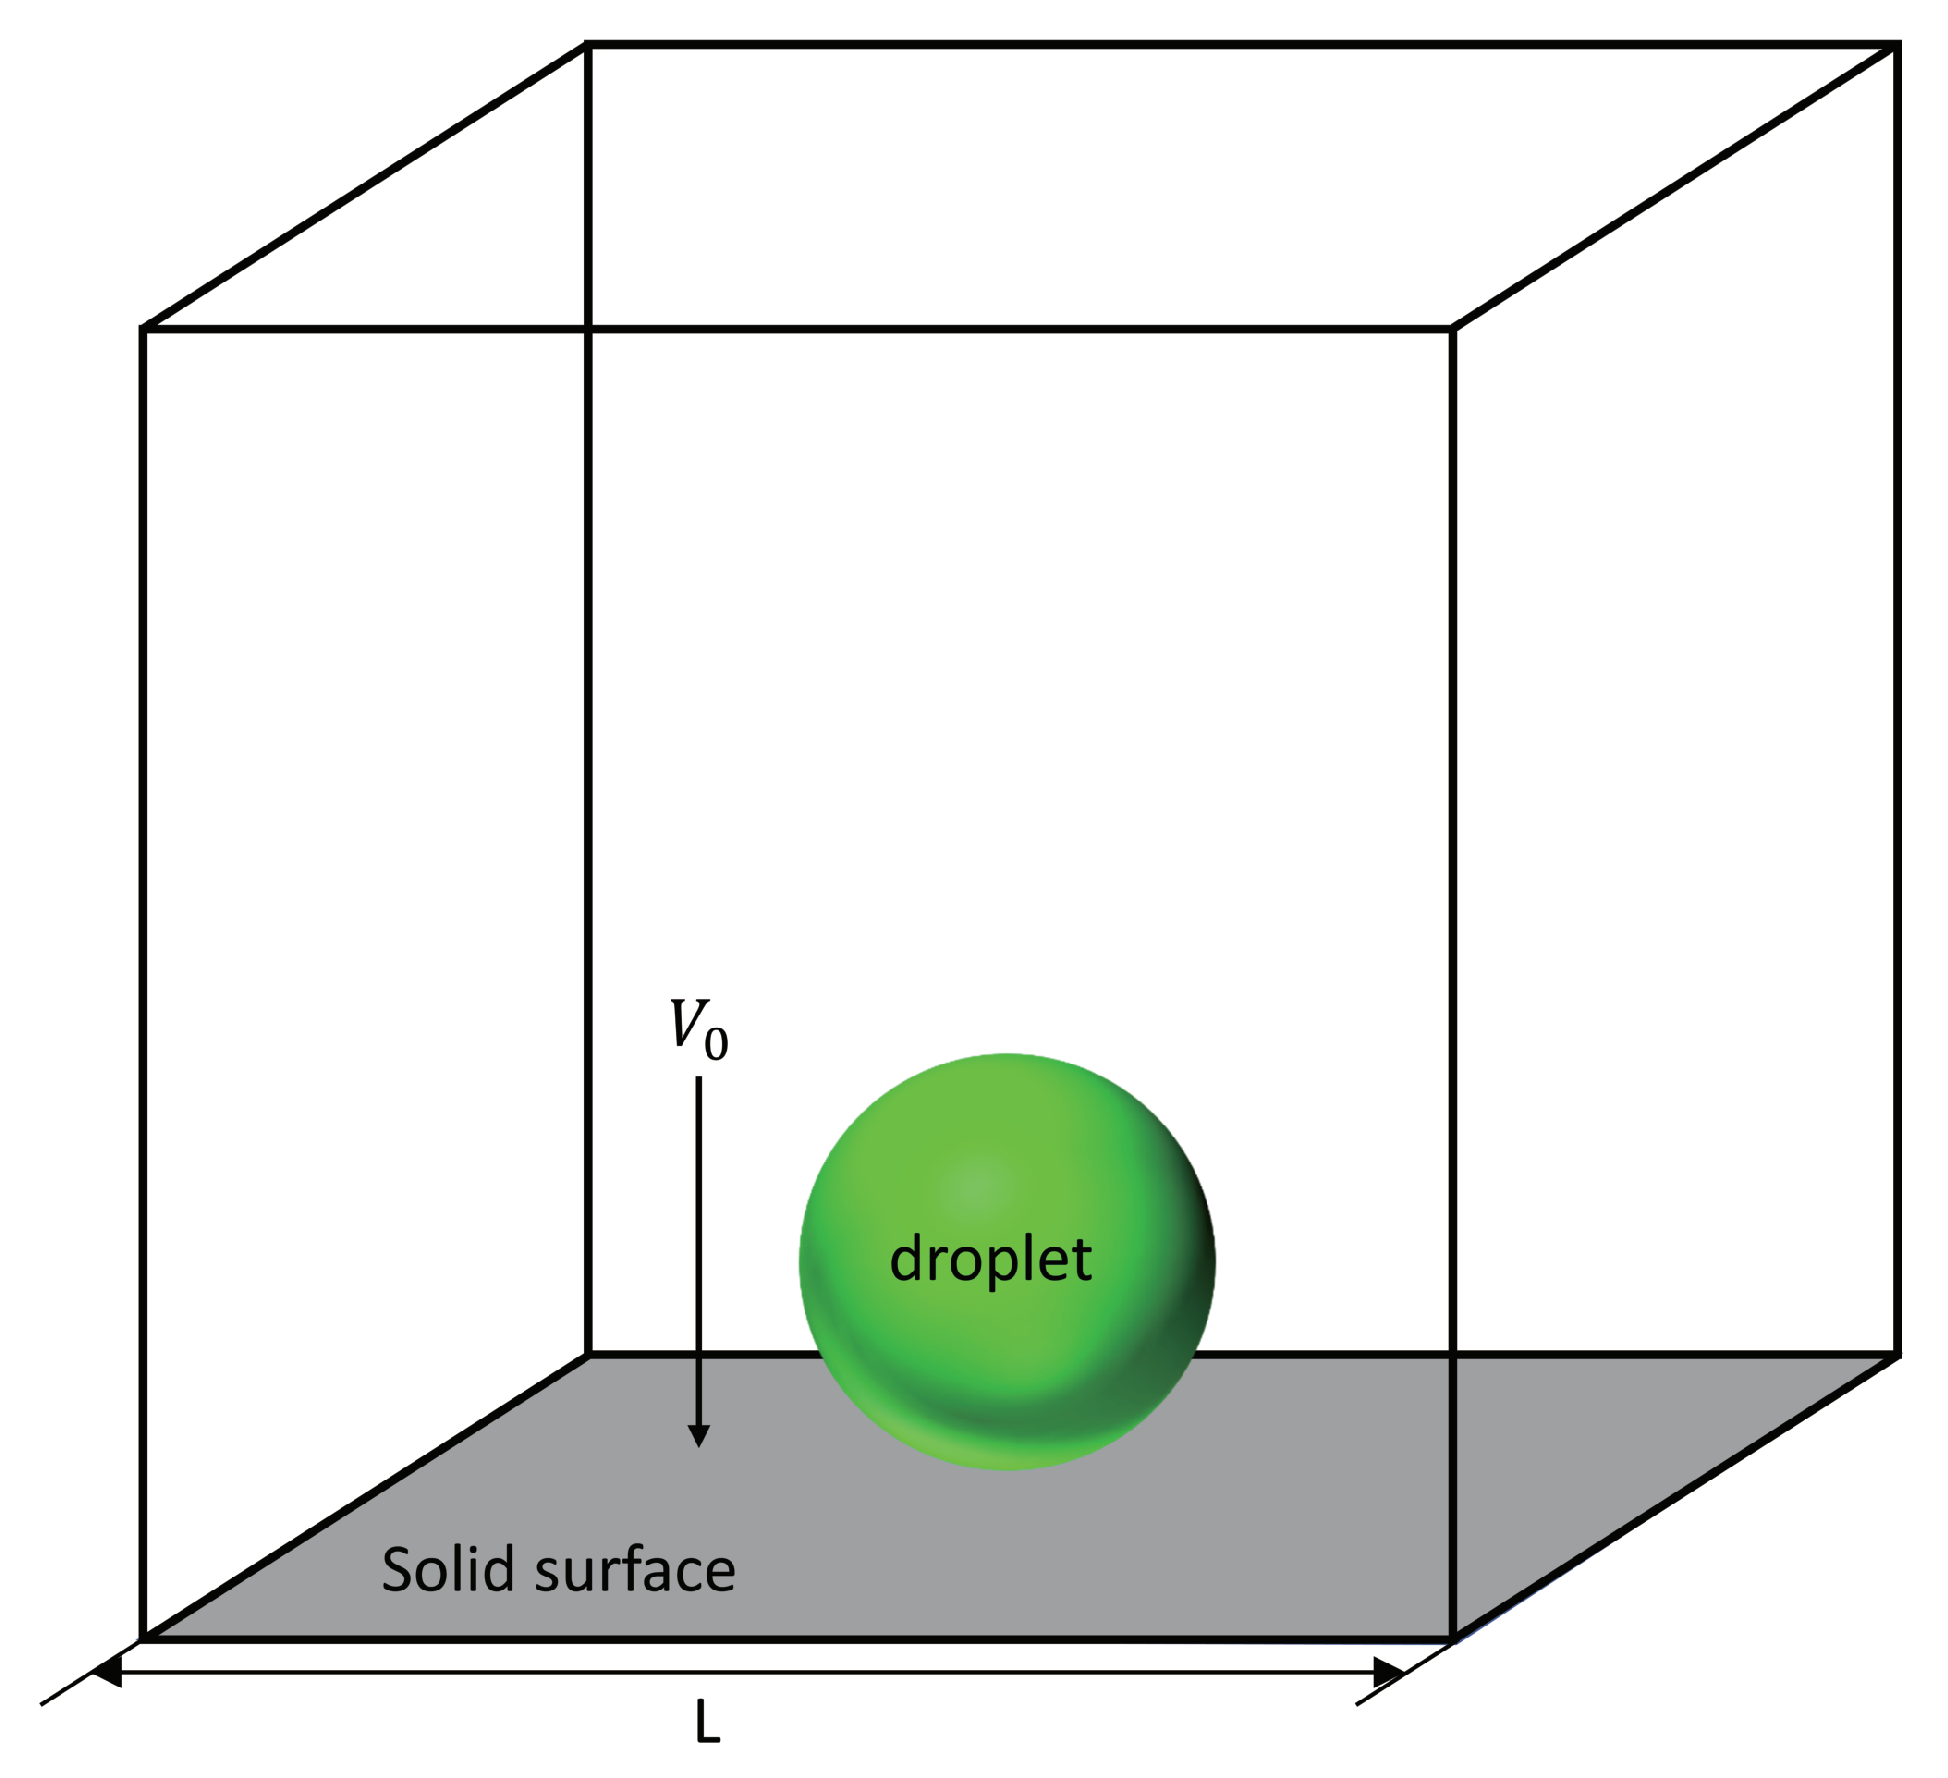
3.1. Physical Model
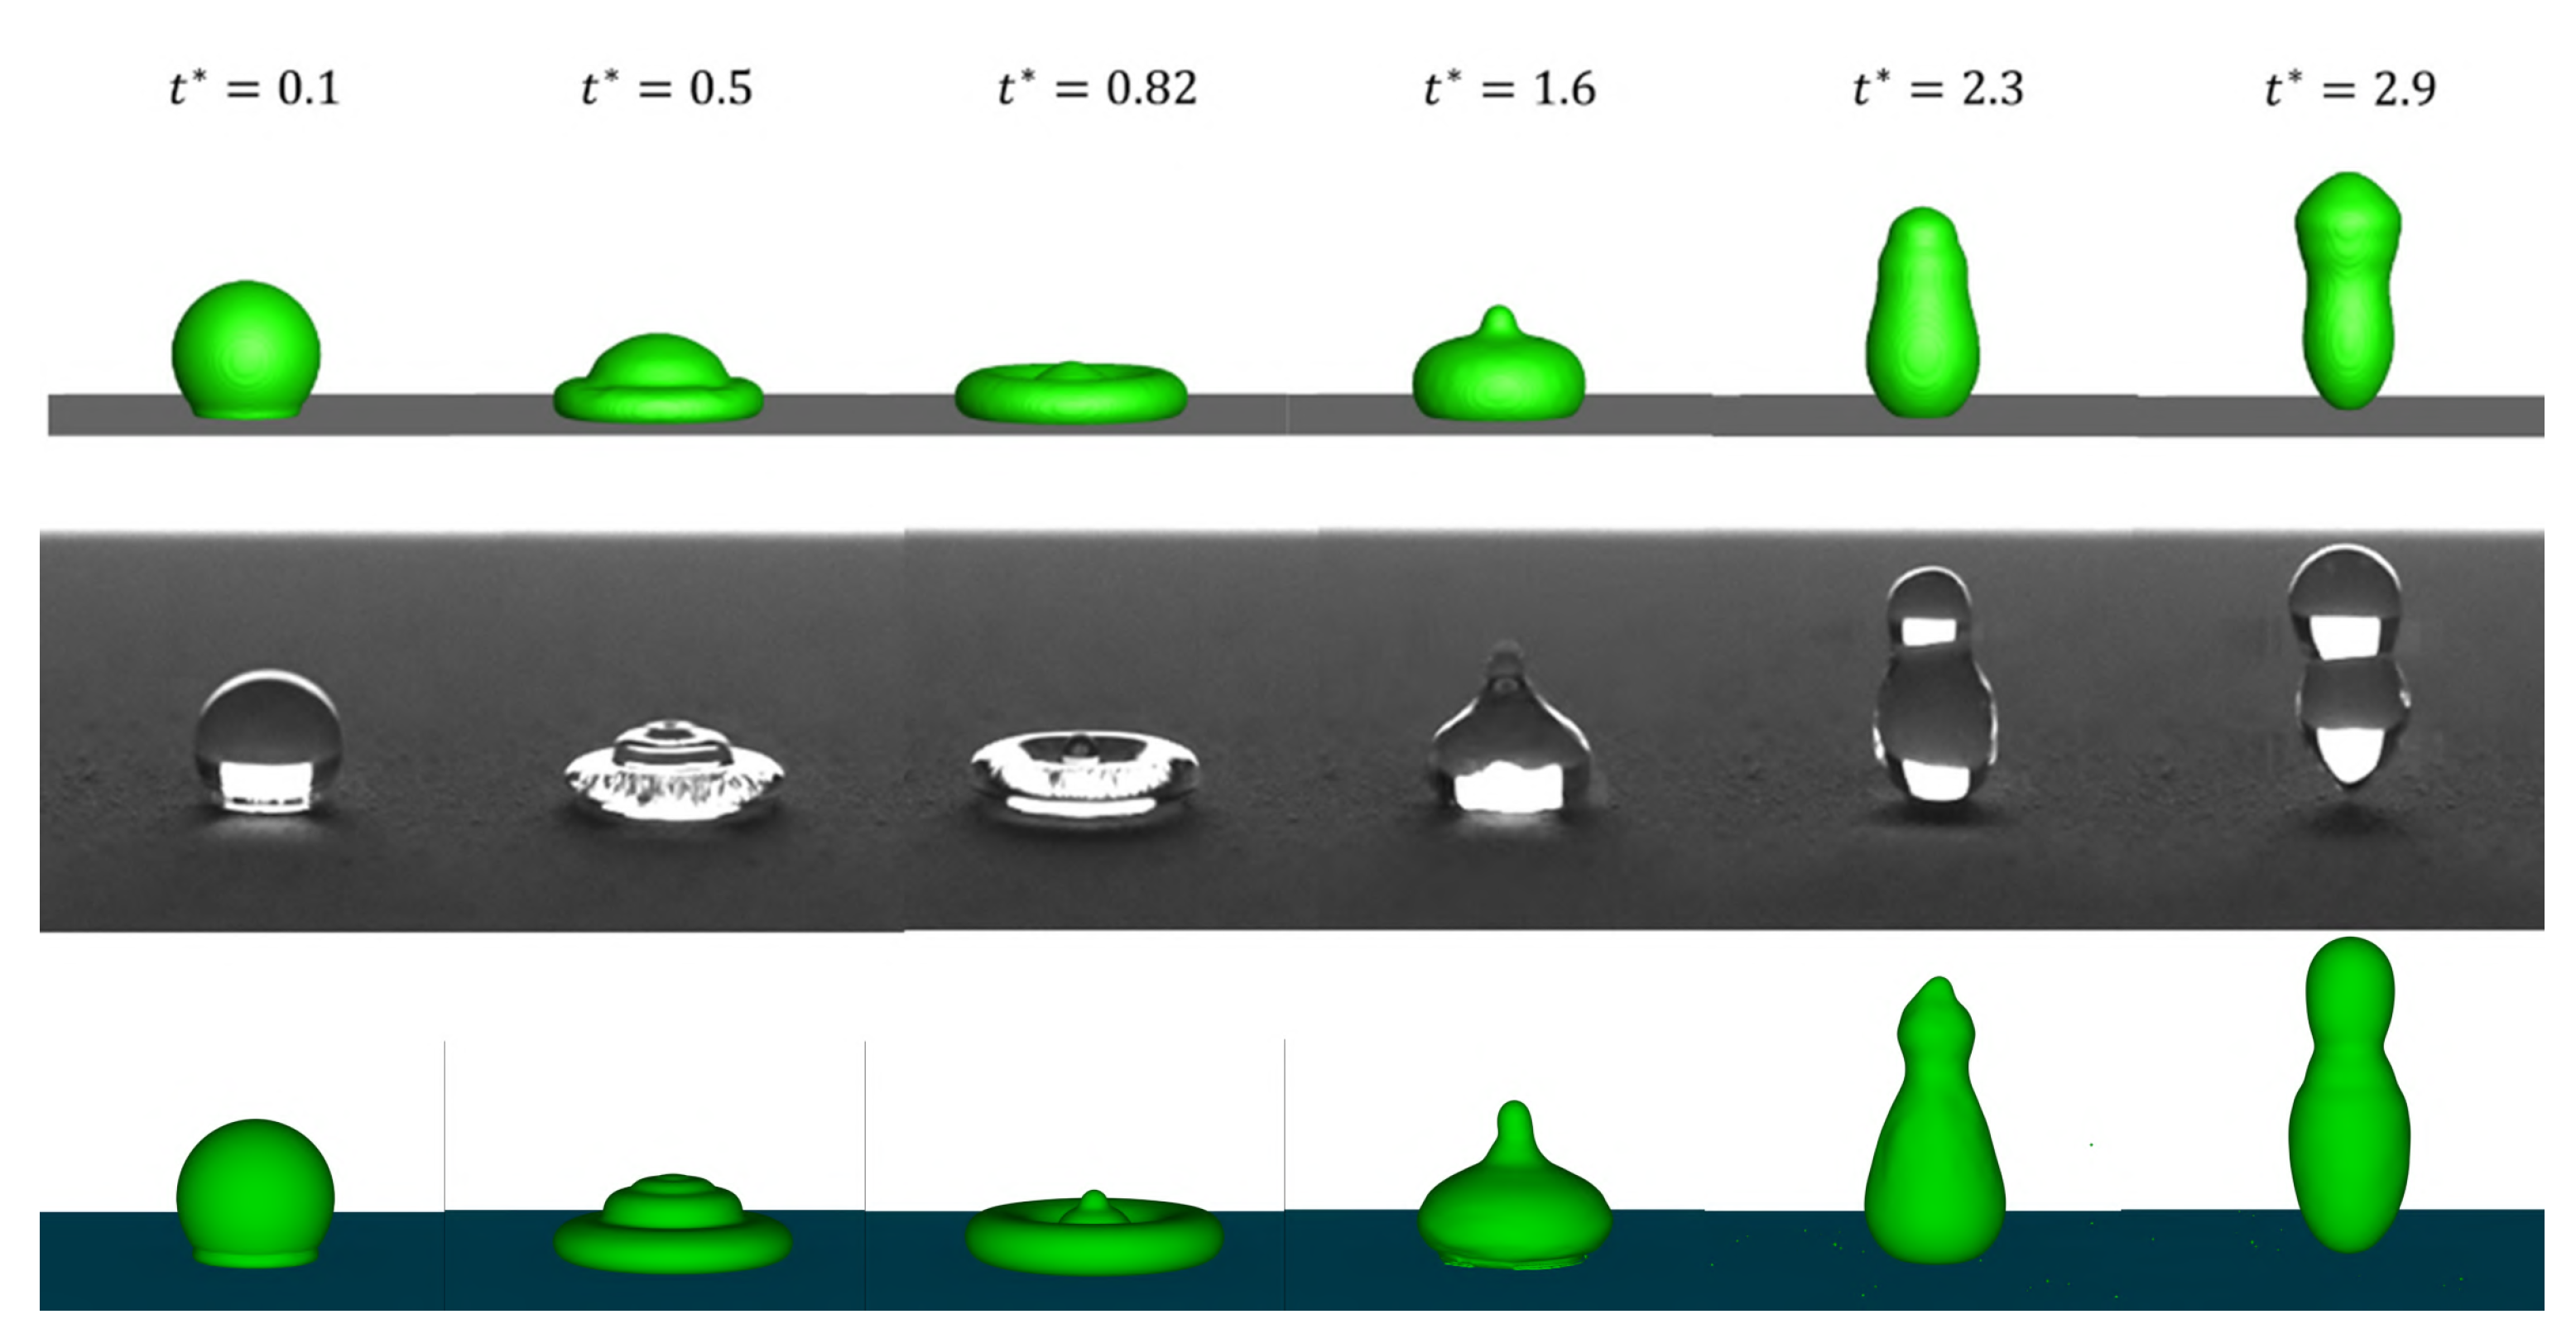
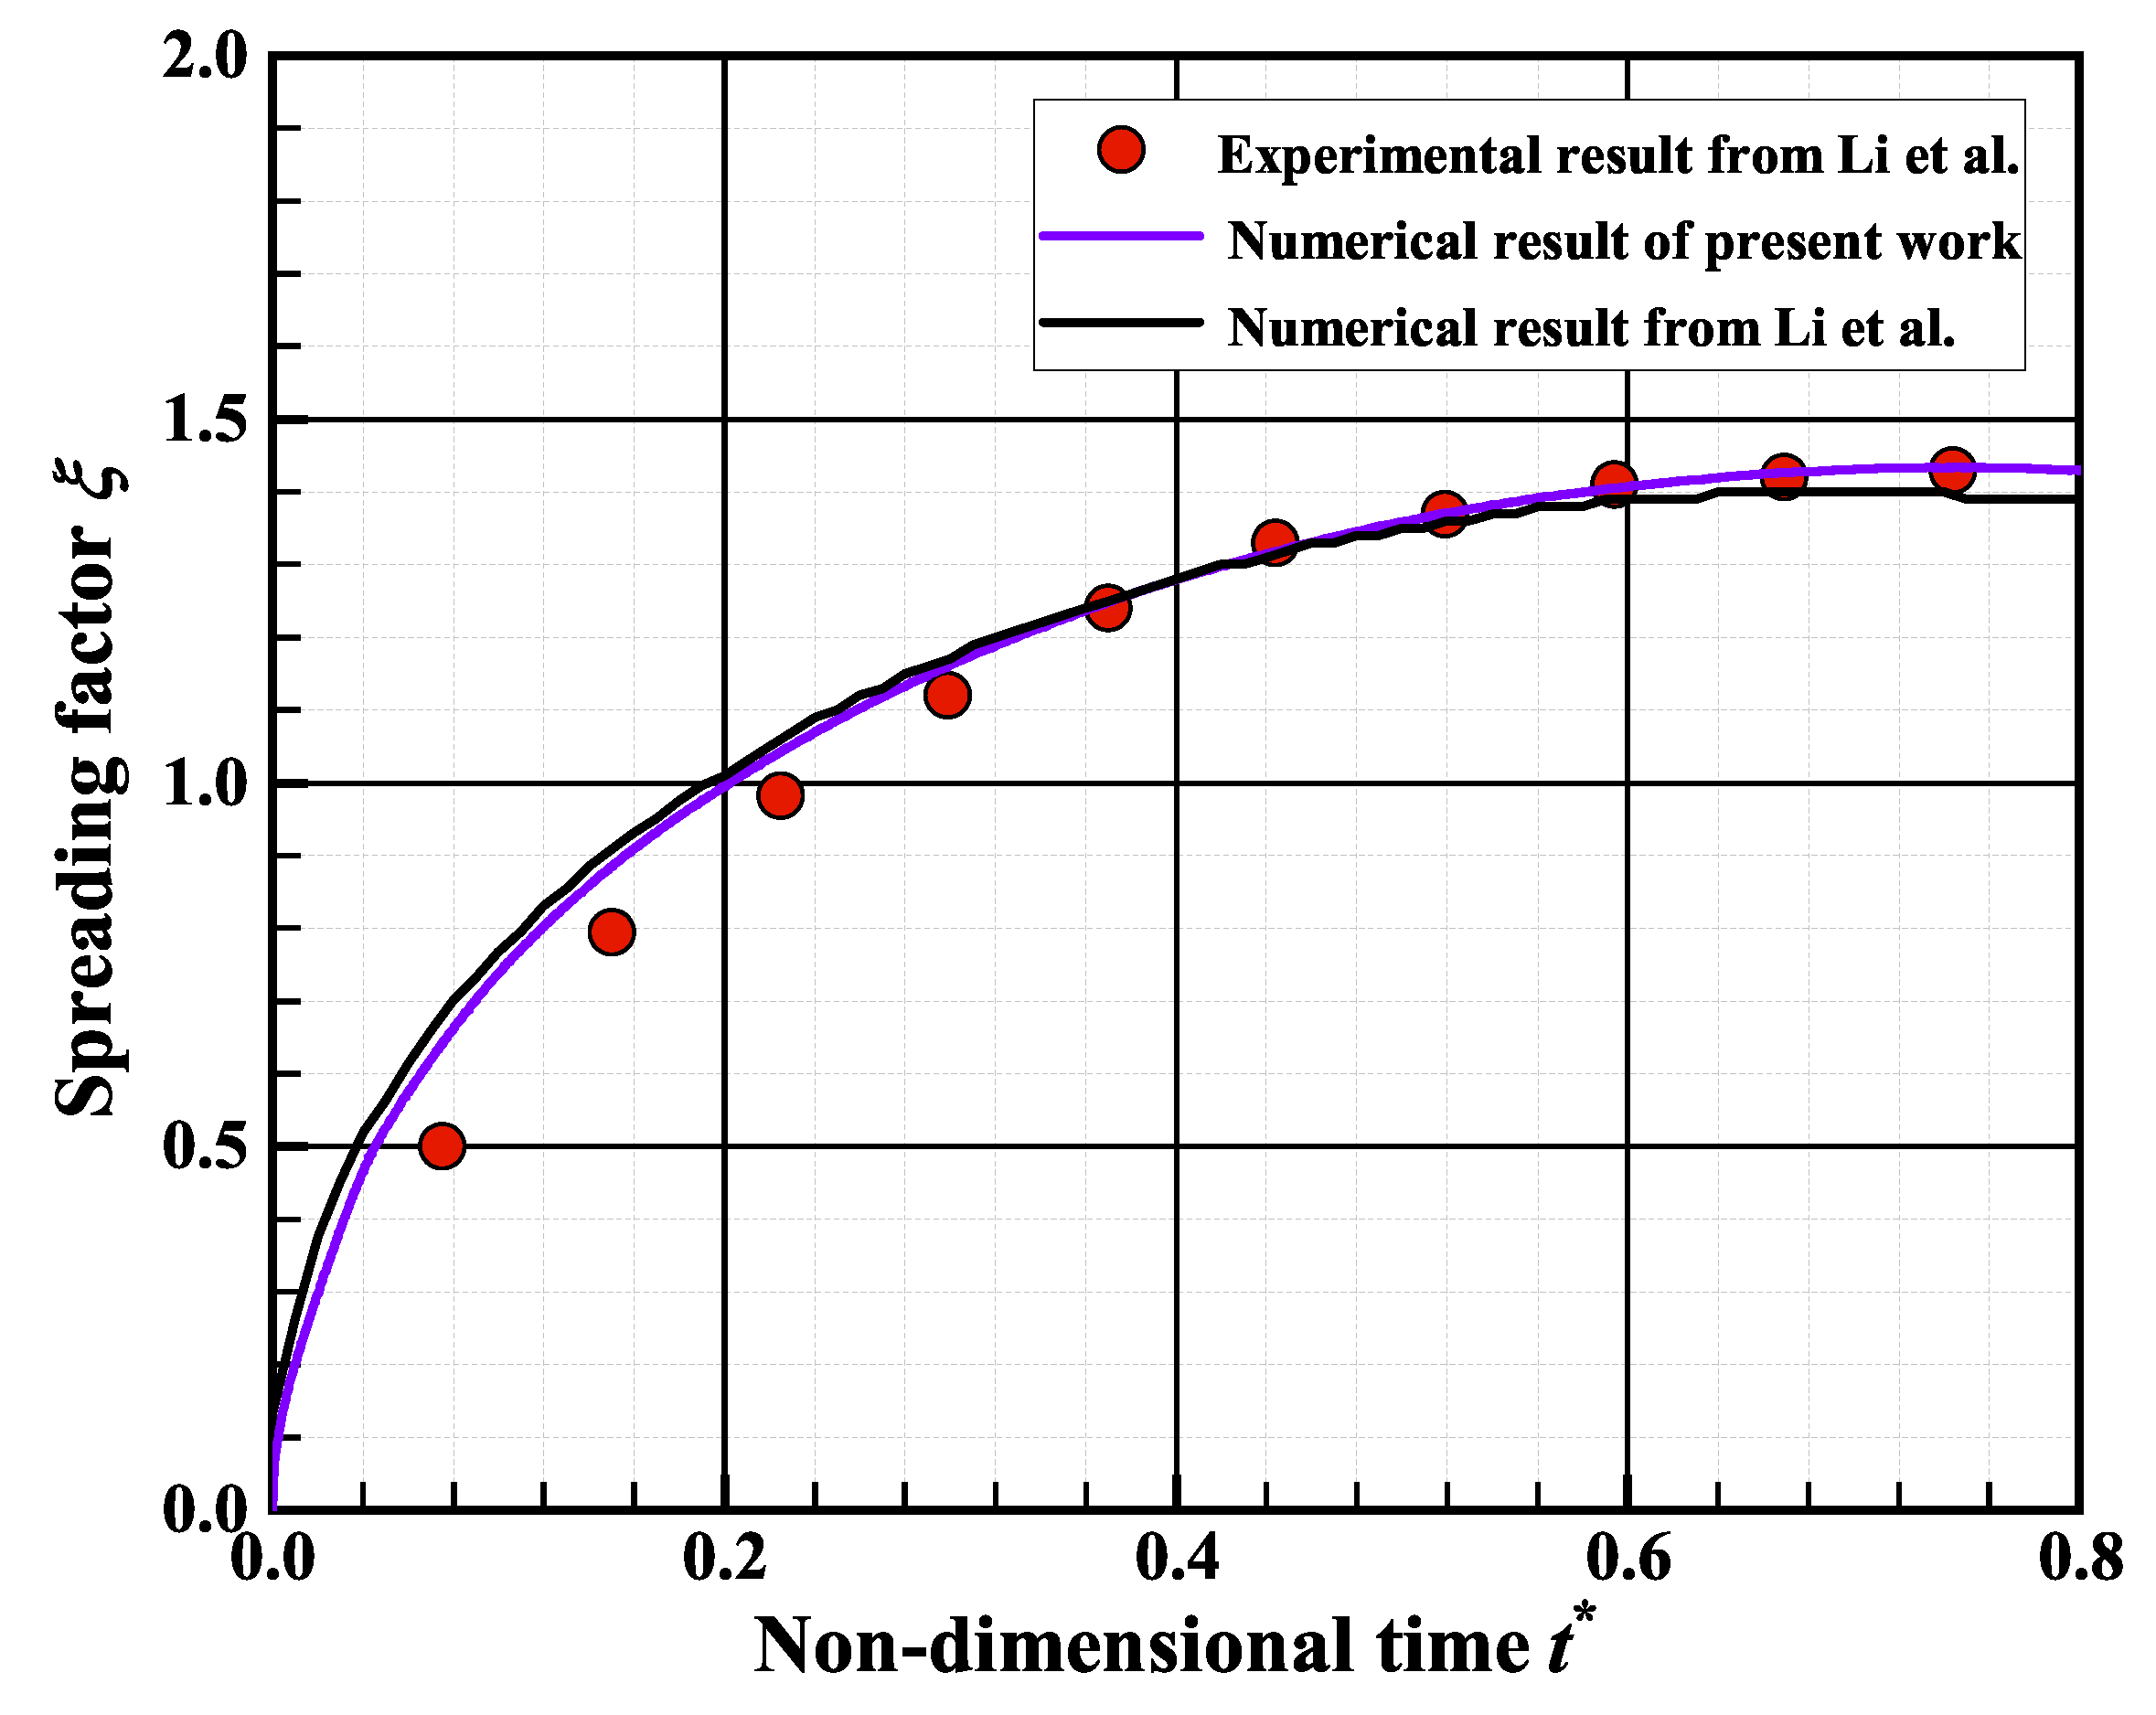
3.2. Numerical Method Validation
4. Results and Discussion
4.1. Modes of Droplet Impact
4.2. Critical Weber Number
4.3. Criterion for Splashing
5. Conclusions
- (1)
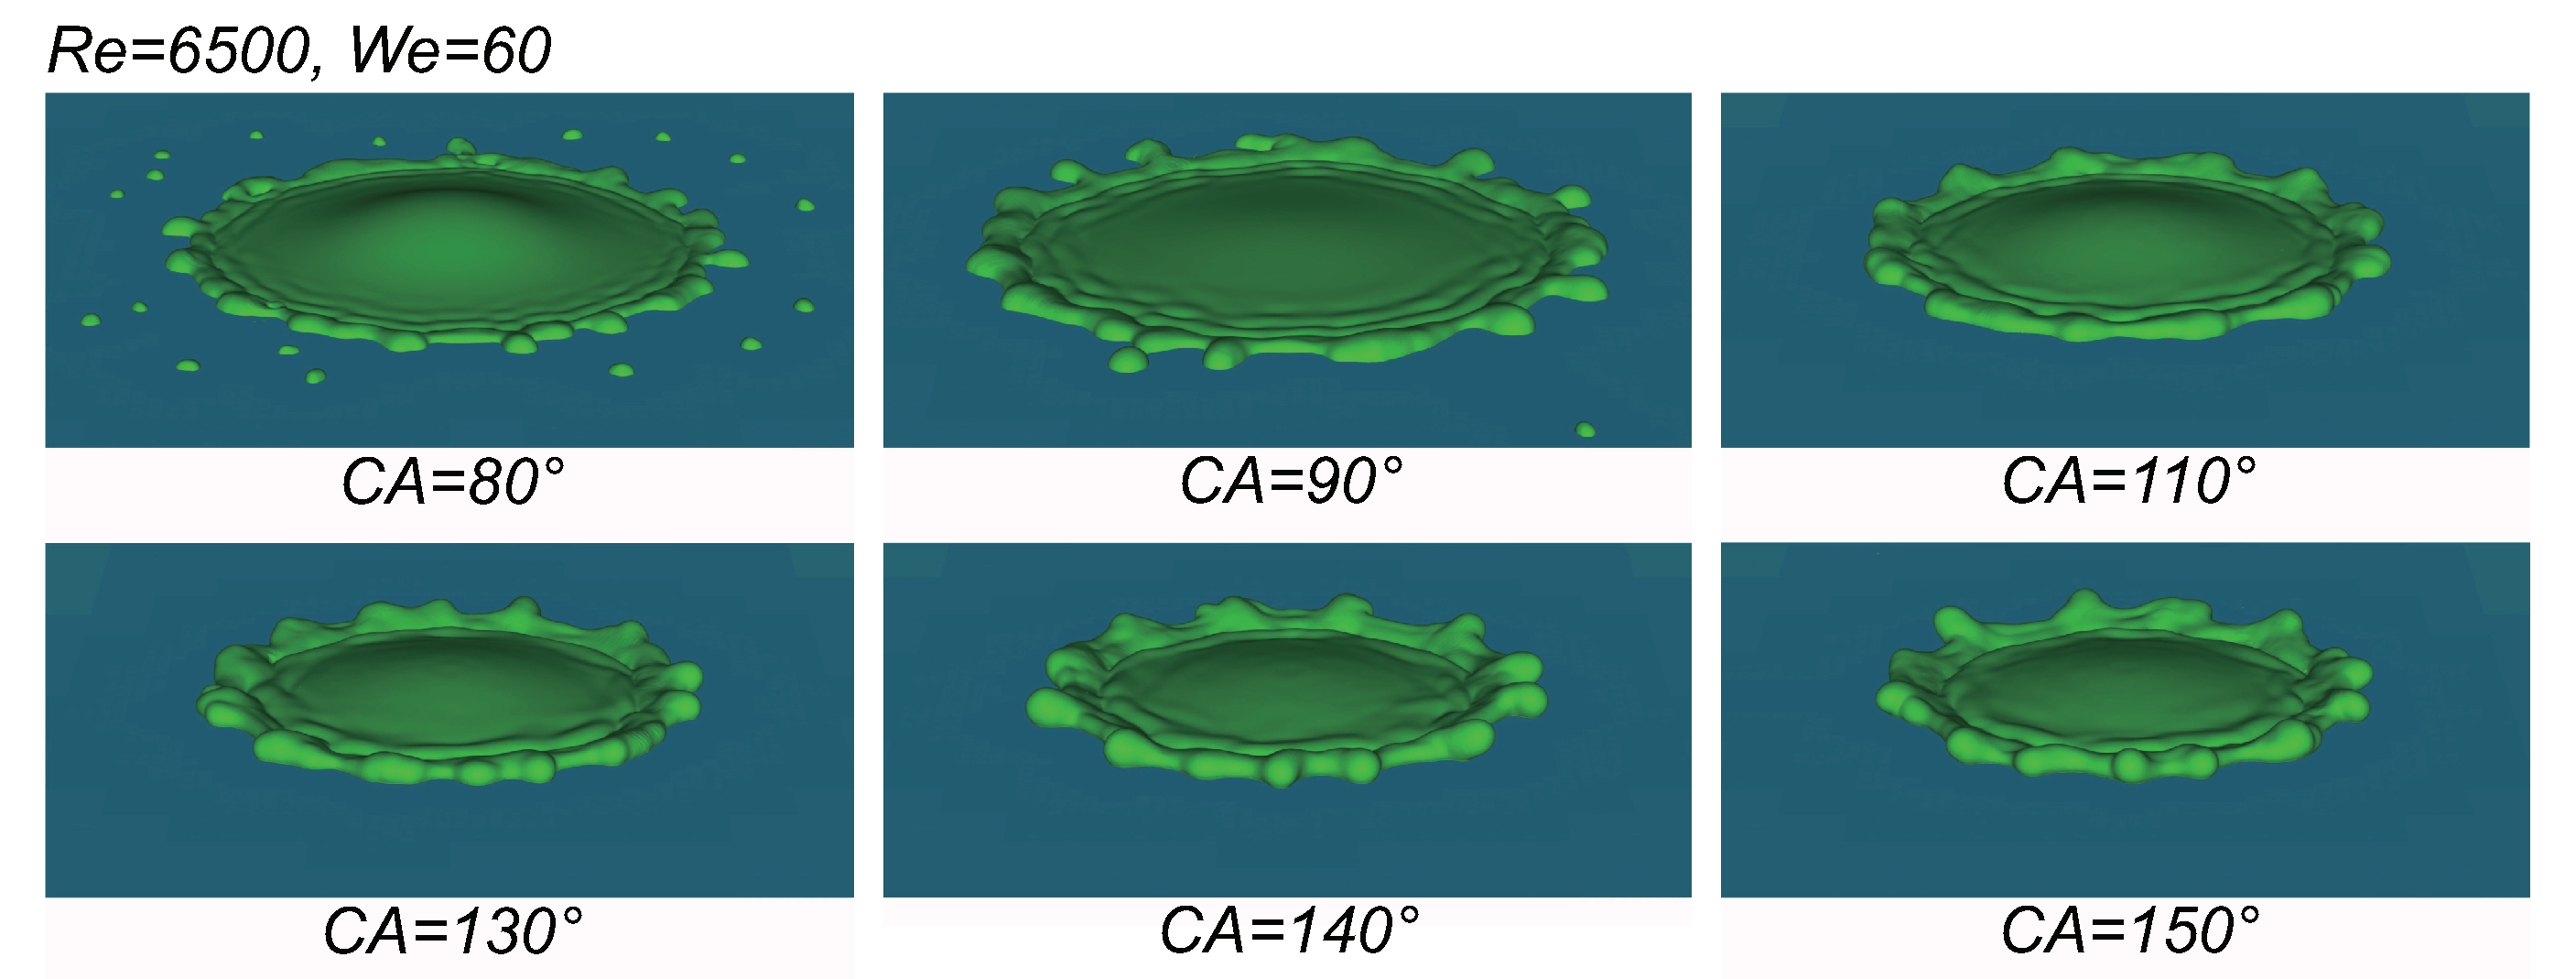
- The phenomenon where secondary droplets are generated before the droplet spreads to its maximum diameter after collision is defined as splashing. Splashing with secondary droplets generated later, relatively larger in diameter, and fewer in number is defined as spreading splashing. Splashing with secondary droplets generated earlier, smaller in diameter, and greater in number is defined as prompt splashing. Based on the symmetry of the distribution of secondary droplets, splashing can be classified into partial splashing (asymmetric distribution of secondary droplets) and splashing (symmetric distribution of secondary droplets).
- (2)
- Spreading splashing primarily occurs in cases where the contact angle is relatively small ( ≤ 120°), while prompt splashing prevails in situations where the contact angle is larger ( > 120°). An increase in the contact angle tends to inhibit spreading splashing, while promoting rapid splashing.
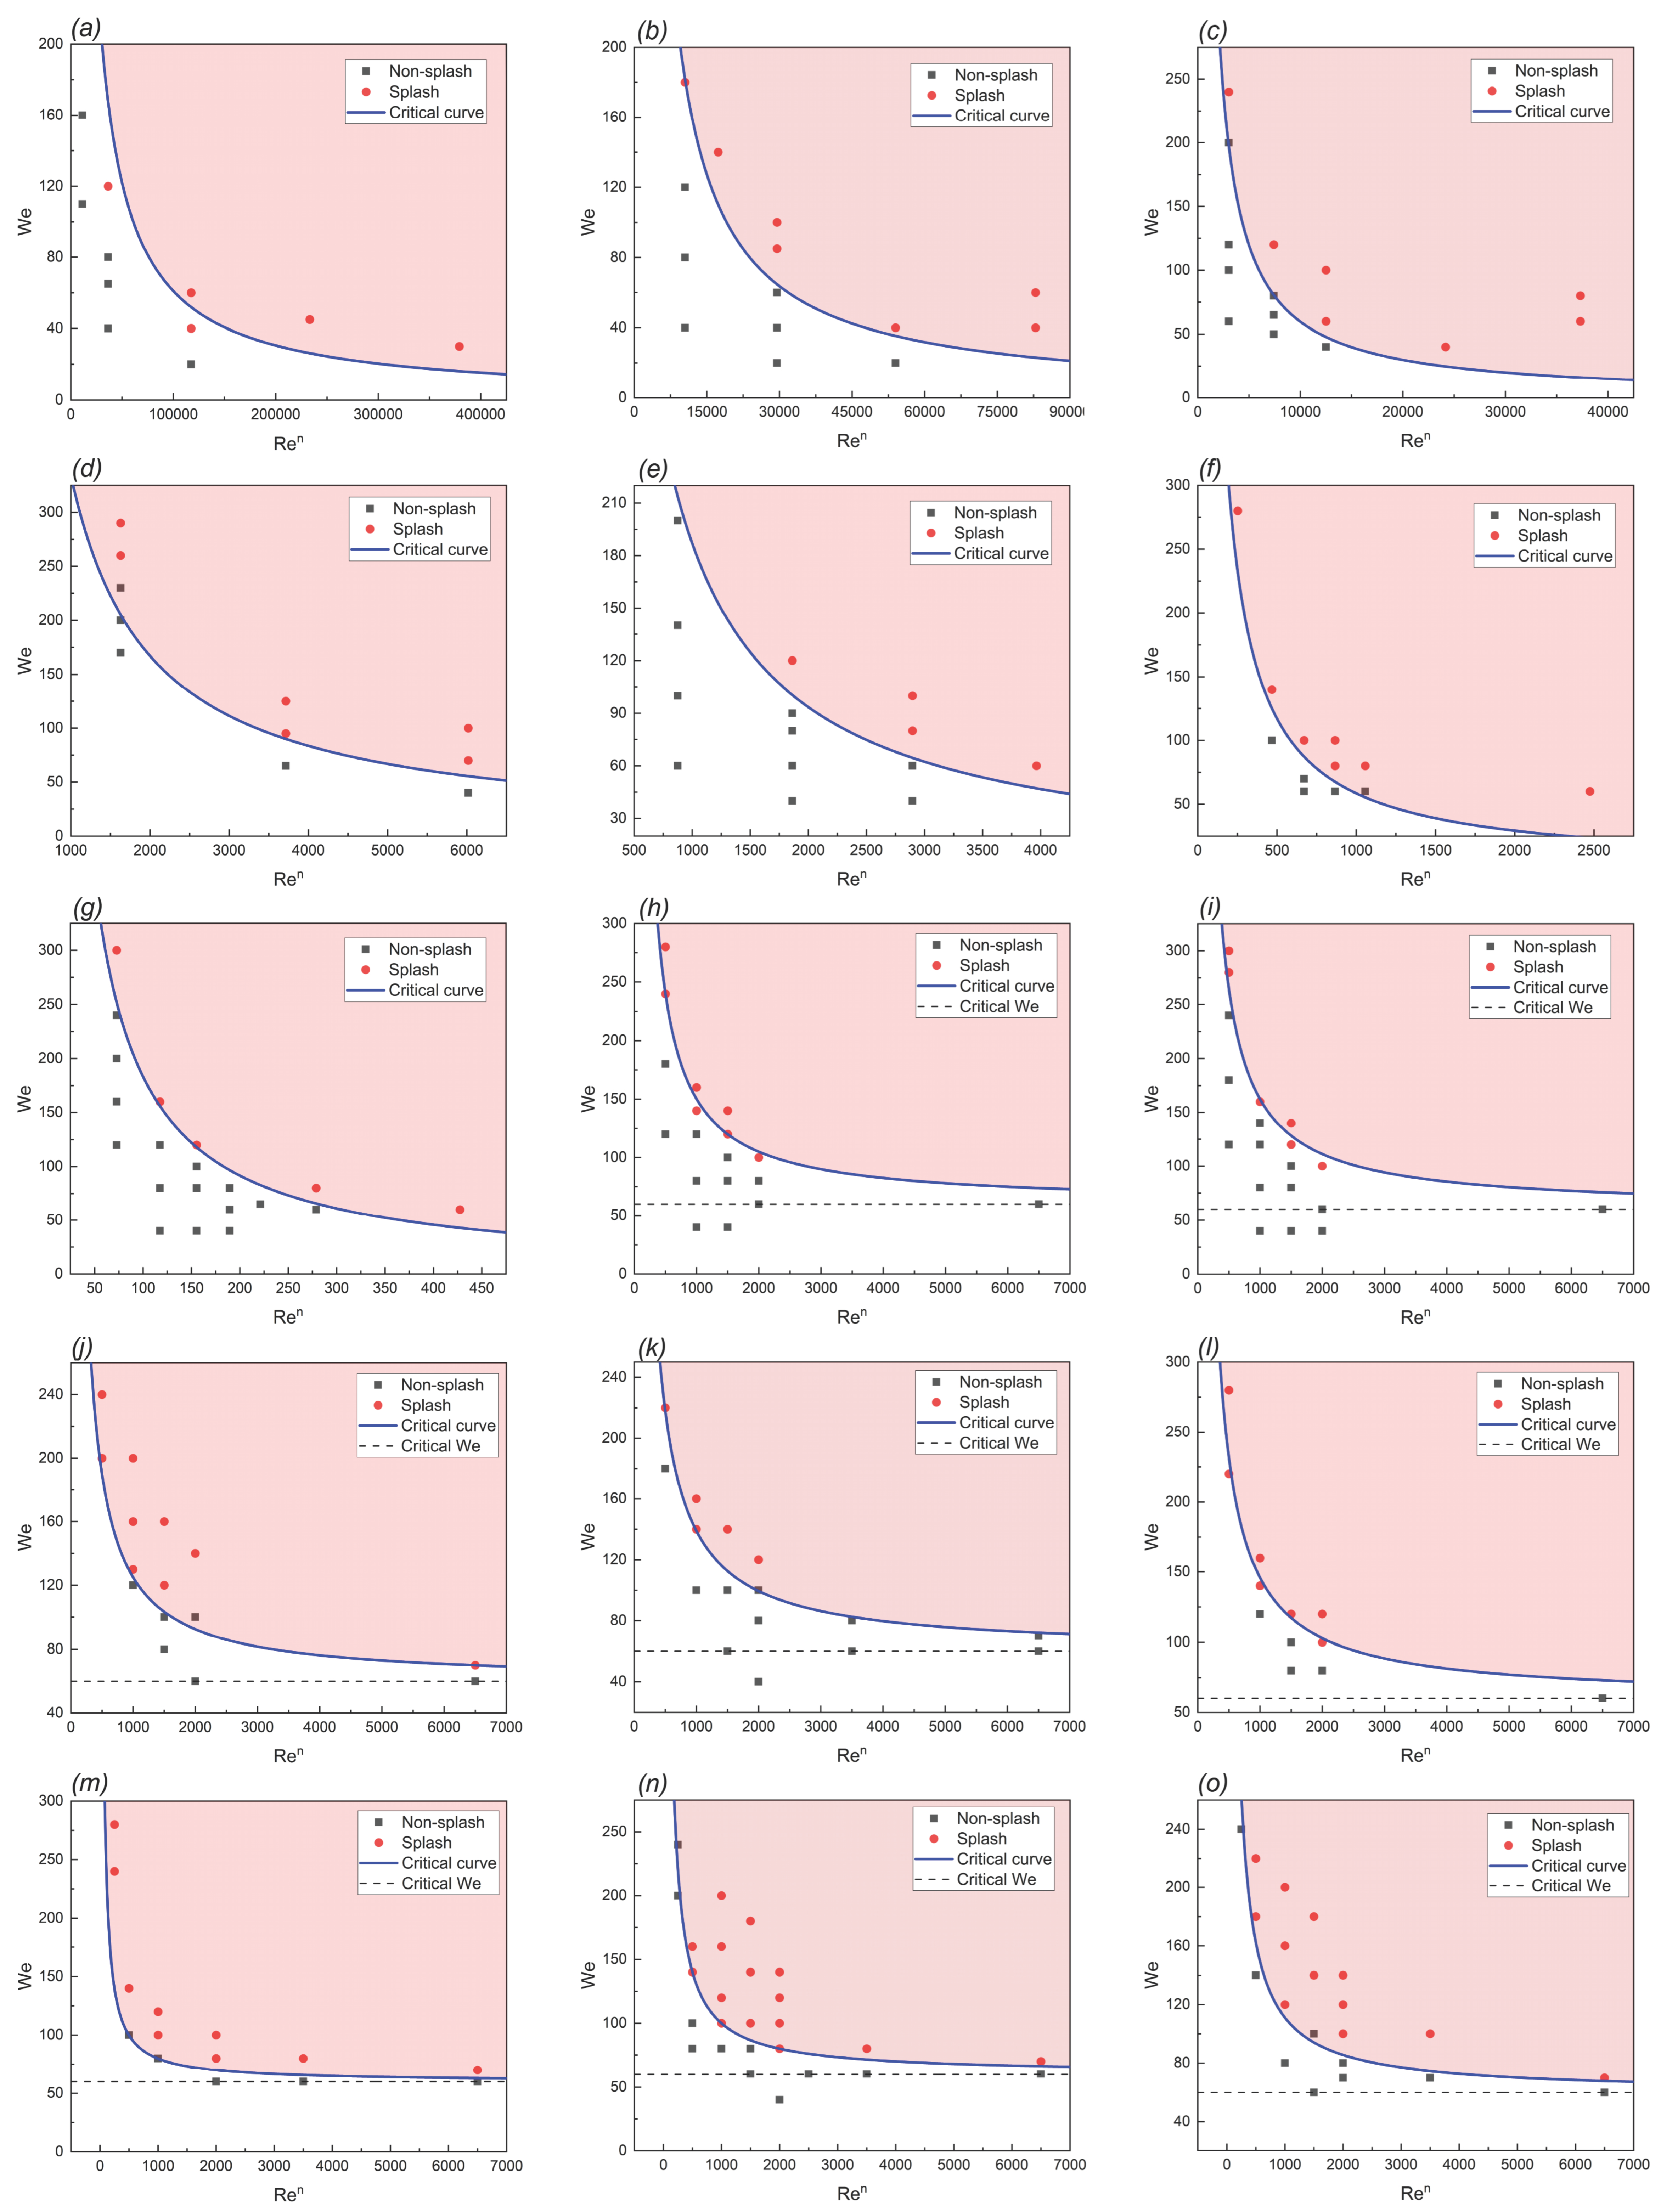
- (3)
- For contact angles greater than 90°, there exists a critical Weber number, , below which splashing does not occur. From our simulations, .
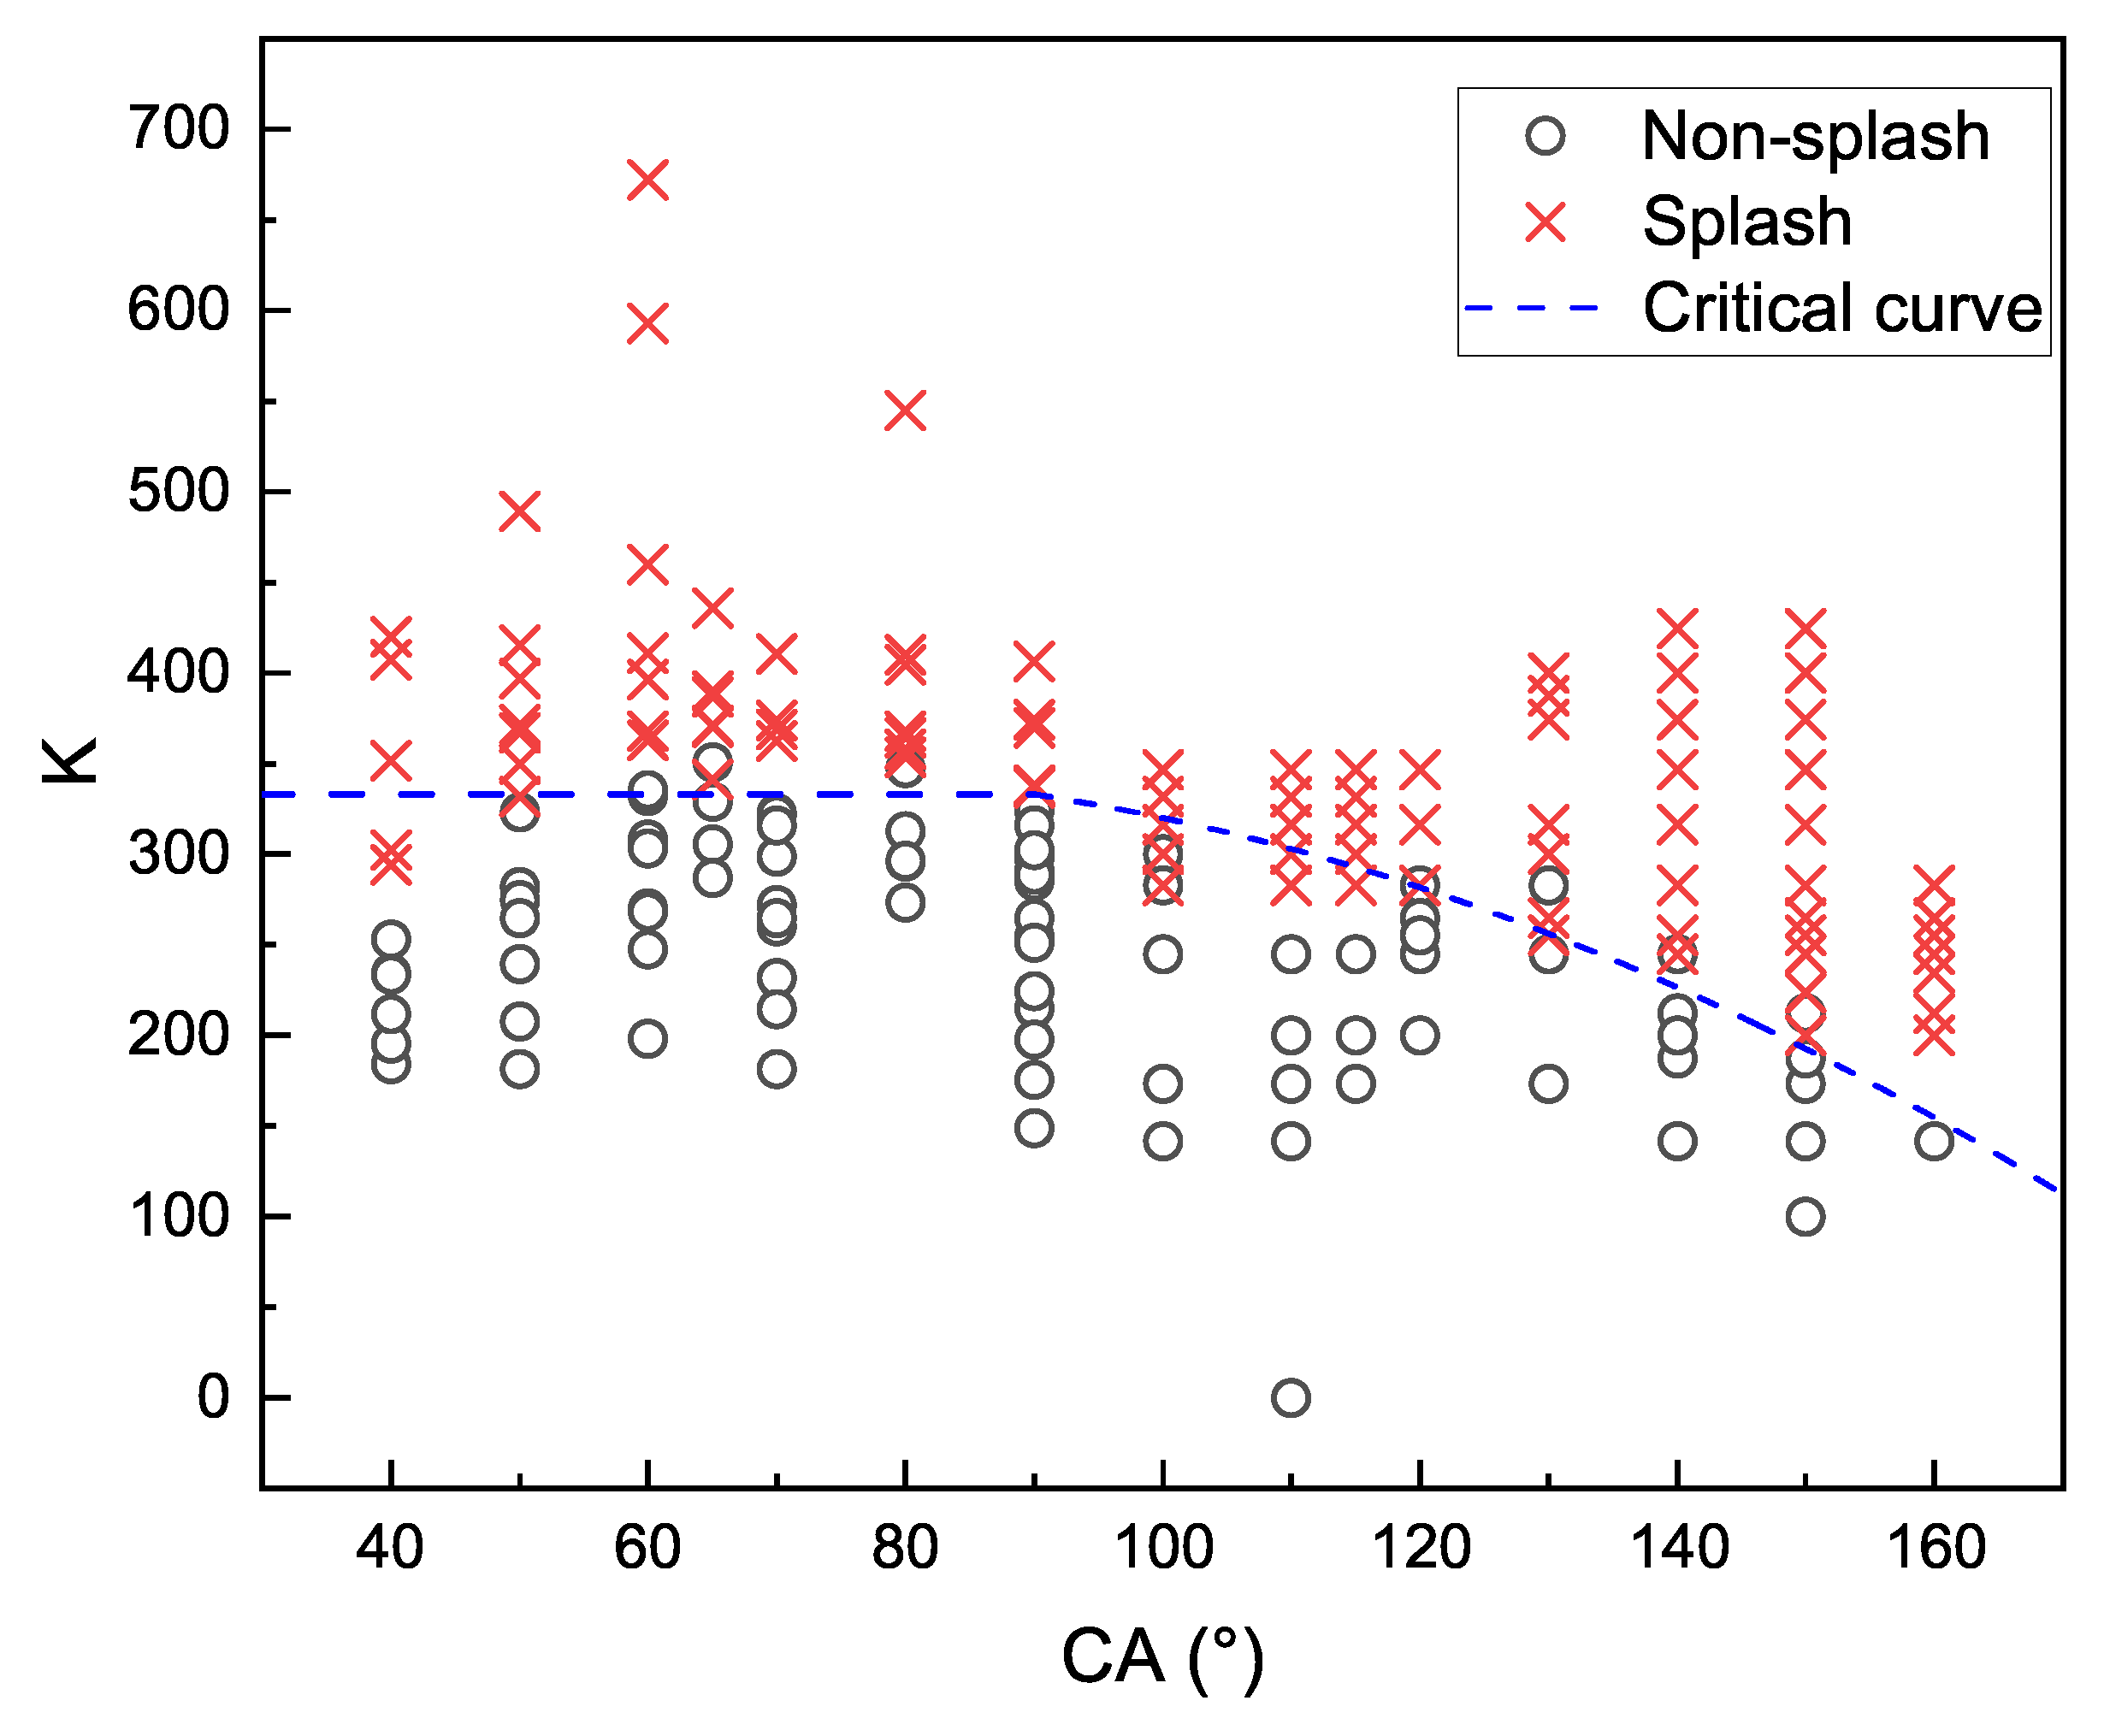
- (4)
- Based on our results, a new criterion for splashing is proposed; , where n equals for ≤ 90° and 1 for > 90°. For ≤ 90°, the threshold , and for > 90°, = −0.021CA2 + 2.7CA + 260.
Author Contributions
Funding
Institutional Review Board Statement
Informed Consent Statement
Data Availability Statement
Conflicts of Interest
Abbreviations
| VOF | Volume of Fluid |
| CSF | Continuum Surface Tension Force |
| AMR | Adaptive Mesh Refinement |
| CA | Contact Angle |
References
- Yarin, A.L. Drop impact dynamics: Splashing, spreading, receding, bouncing. Annu. Rev. Fluid Mech. 2006, 38, 159–192. [Google Scholar] [CrossRef]
- Zhu, C.X.; Tao, M.J.; Zhao, N.; Zhu, C.L.; Wang, Z.Z. Study of droplet shadow zone of aircraft wing with diffusion effects. AIAA J. 2019, 57, 3339–3348. [Google Scholar] [CrossRef]
- Stevens, C.S.; Latka, A.; Nagel, S.R. Comparison of splashing in high-and low-viscosity liquids. Phys. Rev. E 2014, 89, 063006. [Google Scholar] [CrossRef]
- Xu, L. Liquid drop splashing on smooth, rough, and textured surfaces. Phys. Rev. E 2007, 75, 056316. [Google Scholar] [CrossRef] [PubMed]
- Aboud, D.G.; Kietzig, A.M. Splashing threshold of oblique droplet impacts on surfaces of various wettability. Langmuir 2015, 31, 10100–10111. [Google Scholar] [CrossRef]
- Josserand, C.; Thoroddsen, S.T. Drop impact on a solid surface. Annu. Rev. Fluid Mech. 2016, 48, 365–391. [Google Scholar] [CrossRef]
- Owen, L.D.; Ge, W.; Rieth, M.; Arienti, M.; Esclapez, L.; Soriano, B.S.; Mueller, M.E.; Day, M.; Sankaran, R.; Chen, J.H. PeleMP: The Multiphysics Solver for the Combustion Pele Adaptive Mesh Refinement Code Suite. J. Fluids Eng. 2024, 146, 041103. [Google Scholar] [CrossRef]
- Worthington, A.M. XXVIII. On the forms assumed by drops of liquids falling vertically on a horizontal plate. Proc. R. Soc. Lond. 1877, 25, 261–272. [Google Scholar]
- Worthington, A.M. III. A second paper on the forms assumed by drops of liquids falling vertically on a horizontal plate. Proc. R. Soc. Lond. 1877, 25, 498–503. [Google Scholar]
- Worthington, A.M. The Splash of a Drop; Society for Promoting Christian Knowledge: London, UK, 1895. [Google Scholar]
- Engel, O.G. Waterdrop collisions with solid surfaces. J. Res. Natl. Bur. Stand. 1955, 54, 281–298. [Google Scholar] [CrossRef]
- Levin, Z.; Hobbs, P.V. Splashing of water drops on solid and wetted surfaces: Hydrodynamics and charge separation. Philos. Trans. R. Soc. Lond. Ser. A Math. Phys. Sci. 1971, 269, 555–585. [Google Scholar]
- Stow, C.D.; Hadfield, M.G. An experimental investigation of fluid flow resulting from the impact of a water drop with an unyielding dry surface. Proc. R. Soc. Lond. A. Math. Phys. Sci. 1981, 373, 419–441. [Google Scholar]
- Mundo, C.; Sommerfeld, M.; Tropea, C. Droplet-wall collisions: Experimental studies of the deformation and breakup process. Int. J. Multiph. Flow 1995, 21, 151–173. [Google Scholar] [CrossRef]
- Wachters, L.; Westerling, N. The heat transfer from a hot wall to impinging water drops in the spheroidal state. Chem. Eng. Sci. 1966, 21, 1047–1056. [Google Scholar] [CrossRef]
- Range, K.; Feuillebois, F. Influence of surface roughness on liquid drop impact. J. Colloid Interface Sci. 1998, 203, 16–30. [Google Scholar] [CrossRef]
- Wal, R.L.V.; Berger, G.M.; Mozes, S.D. The splash/non-splash boundary upon a dry surface and thin fluid film. Exp. Fluids 2006, 40, 53–59. [Google Scholar] [CrossRef]
- Quetzeri-Santiago, M.A.; Yokoi, K.; Castrejón-Pita, A.A.; Castrejón-Pita, J.R. Role of the dynamic contact angle on splashing. Phys. Rev. Lett. 2019, 122, 228001. [Google Scholar] [CrossRef]
- Roisman, I.V.; Lembach, A.; Tropea, C. Drop splashing induced by target roughness and porosity: The size plays no role. Adv. Colloid Interface Sci. 2015, 222, 615–621. [Google Scholar] [CrossRef]
- Li, W.; Wang, J.; Zhu, C.; Tian, L.; Zhao, N. Numerical investigation of droplet impact on a solid superhydrophobic surface. Phys. Fluids 2021, 33, 063310. [Google Scholar] [CrossRef]
- Zhang, H.; Zhang, X.; Yi, X.; He, F.; Niu, F.; Hao, P. Effect of wettability on droplet impact: Spreading and splashing. Exp. Therm. Fluid Sci. 2021, 124, 110369. [Google Scholar] [CrossRef]
- Mushtaq, M.U.; Bibi, M.; Mehmood, R.; Amin, M.; Sanaullah, K.; Iqbal, A. Correction: Fluid Dynamics Technique in Membrane Bioreactor Systems. Arch. Comput. Methods Eng. 2024, 31, 551. [Google Scholar] [CrossRef]
- Popinet, S. Gerris: A tree-based adaptive solver for the incompressible Euler equations in complex geometries. J. Comput. Phys. 2003, 190, 572–600. [Google Scholar] [CrossRef]
- Popinet, S. An accurate adaptive solver for surface-tension-driven interfacial flows. J. Comput. Phys. 2009, 228, 5838–5866. [Google Scholar] [CrossRef]
- Van Hooft, J.A.; Popinet, S.; Van Heerwaarden, C.C.; Van der Linden, S.J.; De Roode, S.R.; Van de Wiel, B.J. Towards adaptive grids for atmospheric boundary-layer simulations. Bound.-Layer Meteorol. 2018, 167, 421–443. [Google Scholar] [CrossRef]
- García-Geijo, P.; Riboux, G.; Gordillo, J. The skating of drops impacting over gas or vapour layers. J. Fluid Mech. 2024, 980, A35. [Google Scholar] [CrossRef]
- Ray, S.; Han, Y.; Cheng, S. Pinch-off dynamics in unequal-size droplets head-on collision on a wetting surface: Experiments and direct numerical simulations. Phys. Fluids 2023, 35, 104955. [Google Scholar] [CrossRef]
- Liu, L.; Guan, X.; Fu, Q. Numerical simulation study of extensional characteristics impacts on the viscoelastic thread deformation and satellite droplet generation. J. Non-Newton. Fluid Mech. 2023, 311, 104955. [Google Scholar] [CrossRef]
- Pan, Y.; Wang, Z.; Zhao, X.; Deng, W.; Xia, H. On axisymmetric dynamic spin coating with a single drop of ethanol. J. Fluid Mech. 2022, 951, A30. [Google Scholar] [CrossRef]
- Li, Y.; Xu, Z.; Peng, X.; Wang, T.; Che, Z. Numerical simulation of secondary breakup of shear-thinning droplets. Phys. Fluids 2023, 35, 012103. [Google Scholar] [CrossRef]

Disclaimer/Publisher’s Note: The statements, opinions and data contained in all publications are solely those of the individual author(s) and contributor(s) and not of MDPI and/or the editor(s). MDPI and/or the editor(s) disclaim responsibility for any injury to people or property resulting from any ideas, methods, instructions or products referred to in the content. |
© 2024 by the authors. Licensee MDPI, Basel, Switzerland. This article is an open access article distributed under the terms and conditions of the Creative Commons Attribution (CC BY) license (https://creativecommons.org/licenses/by/4.0/).
Share and Cite
Jiang, S.; Xiong, H.; Tian, B.; Yu, Z. A New Criterion for the Splashing of a Droplet on Dry Surface from High-Fidelity Simulations. Appl. Sci. 2024, 14, 8553. https://doi.org/10.3390/app14188553
Jiang S, Xiong H, Tian B, Yu Z. A New Criterion for the Splashing of a Droplet on Dry Surface from High-Fidelity Simulations. Applied Sciences. 2024; 14(18):8553. https://doi.org/10.3390/app14188553
Chicago/Turabian StyleJiang, Shijie, Hongbing Xiong, Baolin Tian, and Zhaosheng Yu. 2024. "A New Criterion for the Splashing of a Droplet on Dry Surface from High-Fidelity Simulations" Applied Sciences 14, no. 18: 8553. https://doi.org/10.3390/app14188553