
Quantitative Assessment of Urban Expansion Impact on Vegetation in the Lanzhou–Xining Urban Agglomeration


Abstract
:1. Introduction
2. Data and Methods
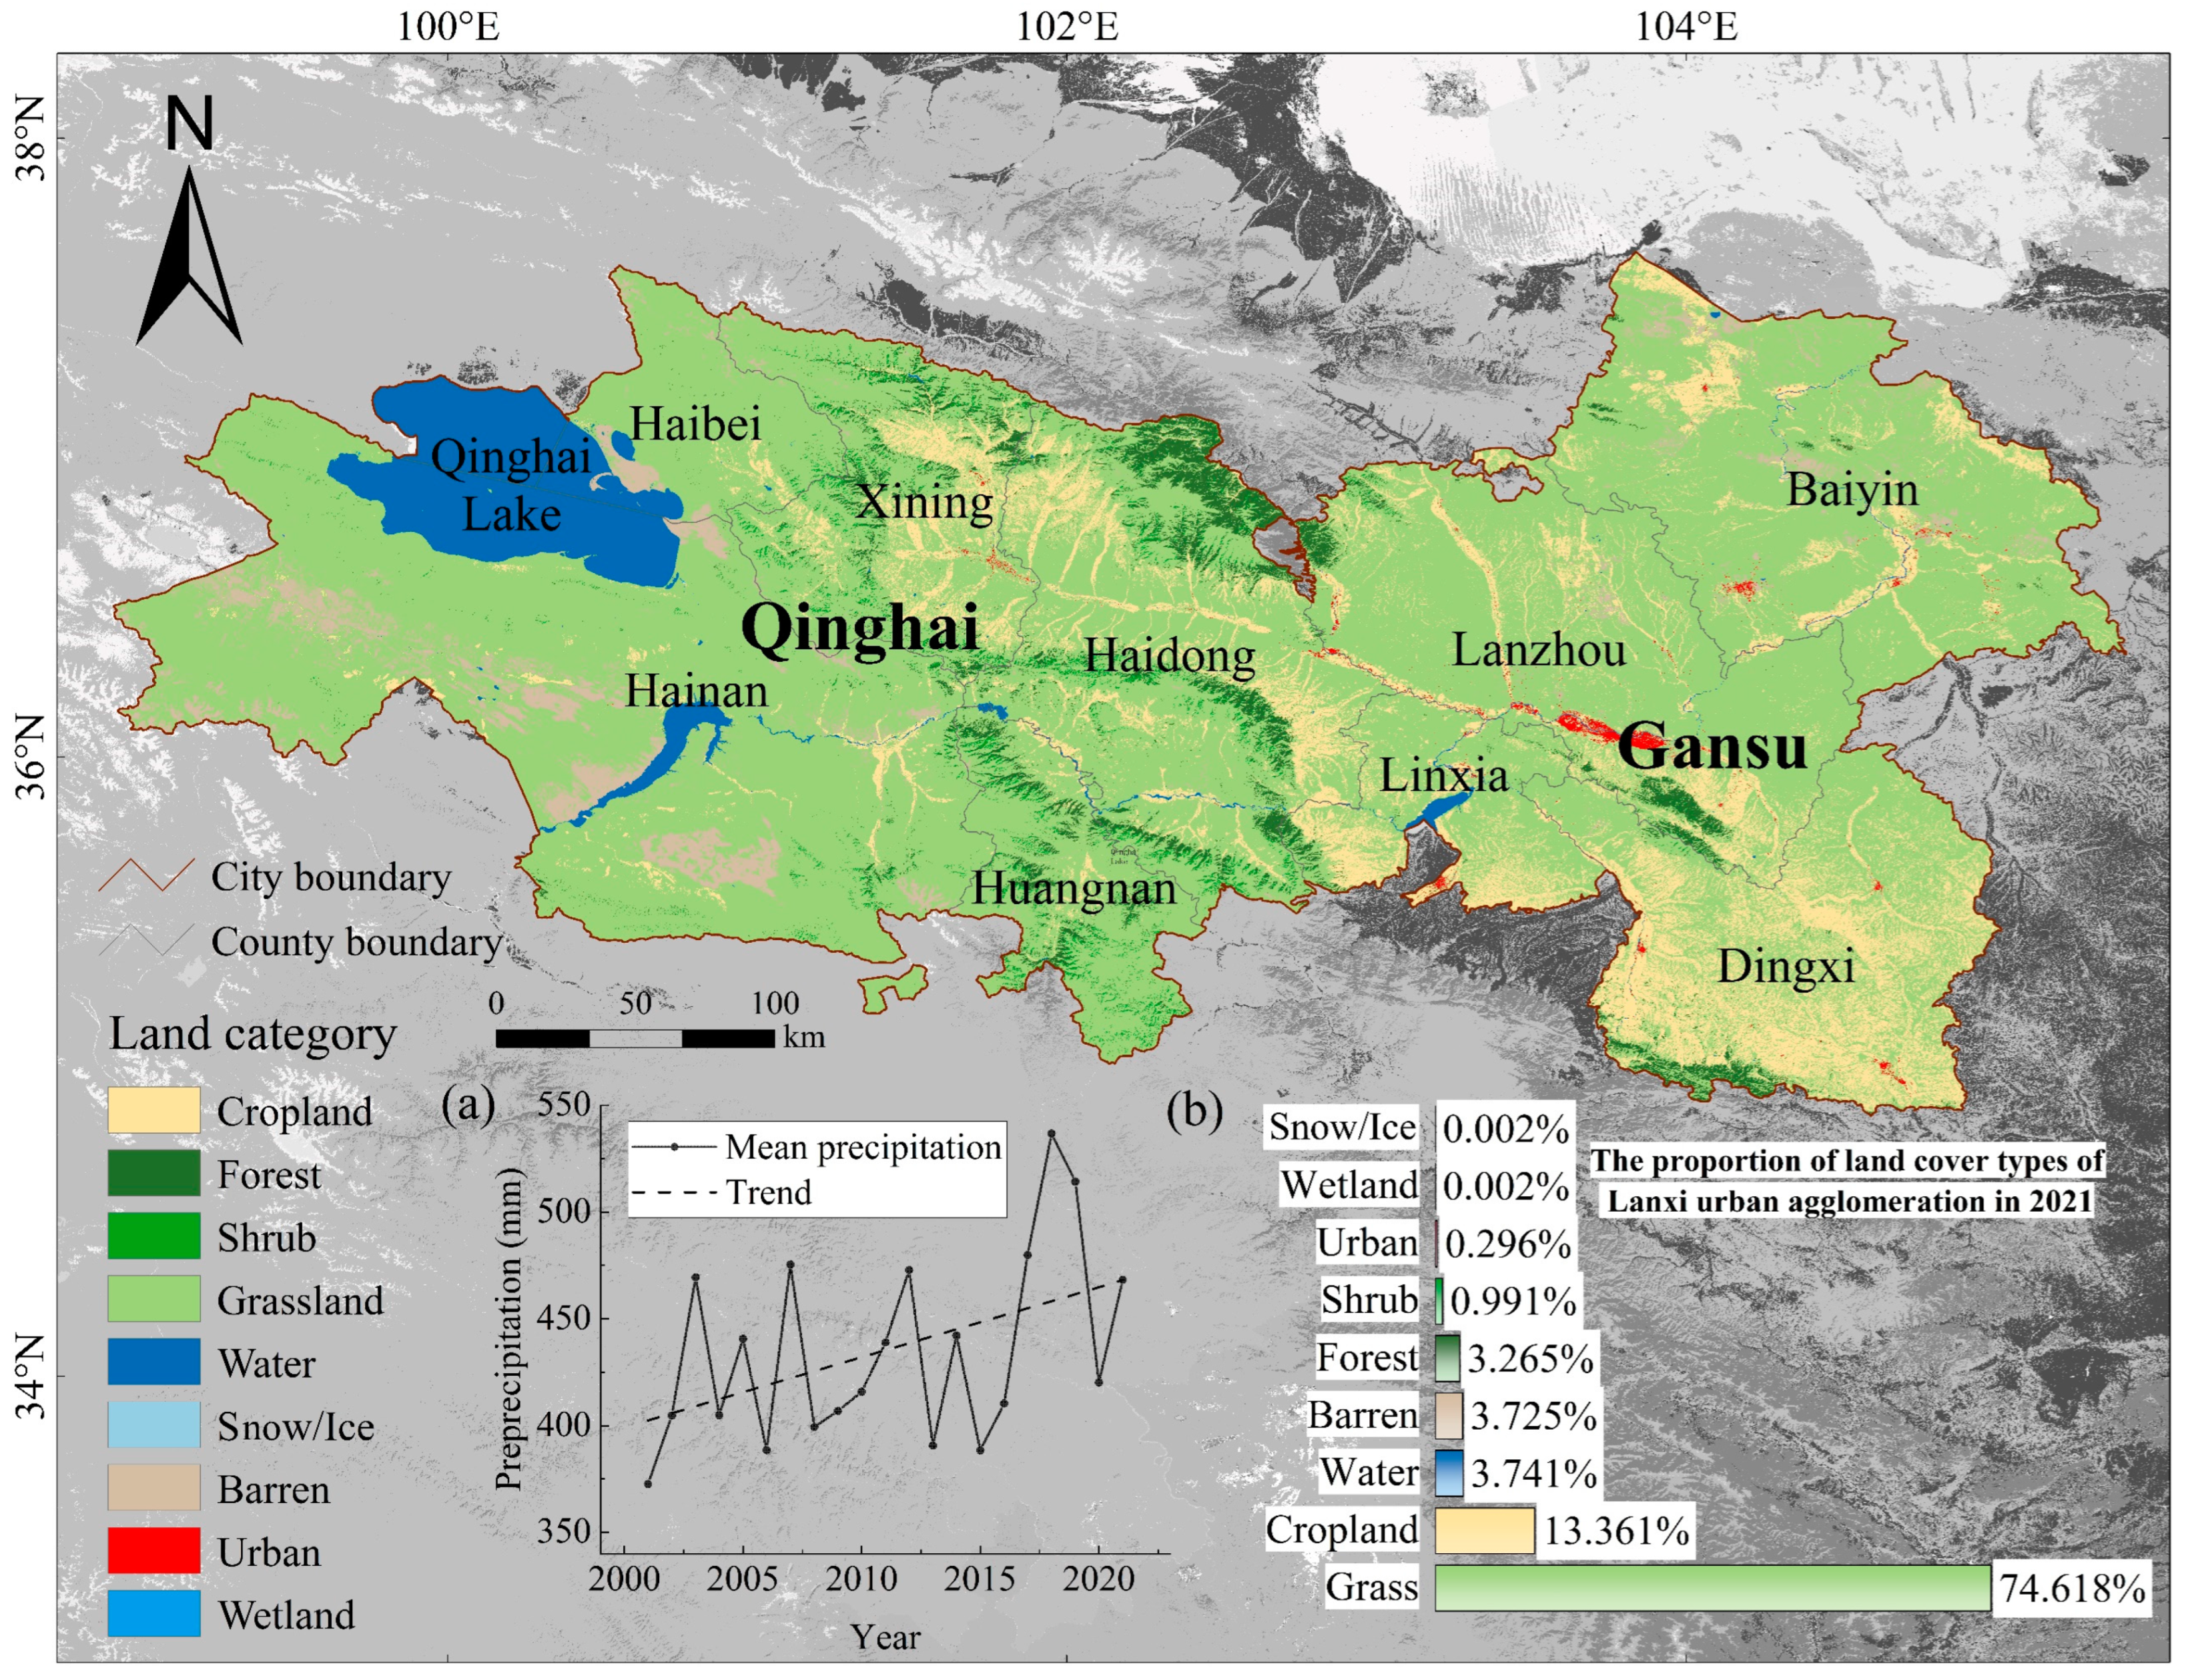
2.1. Study Area
2.2. Data and Preprocessing
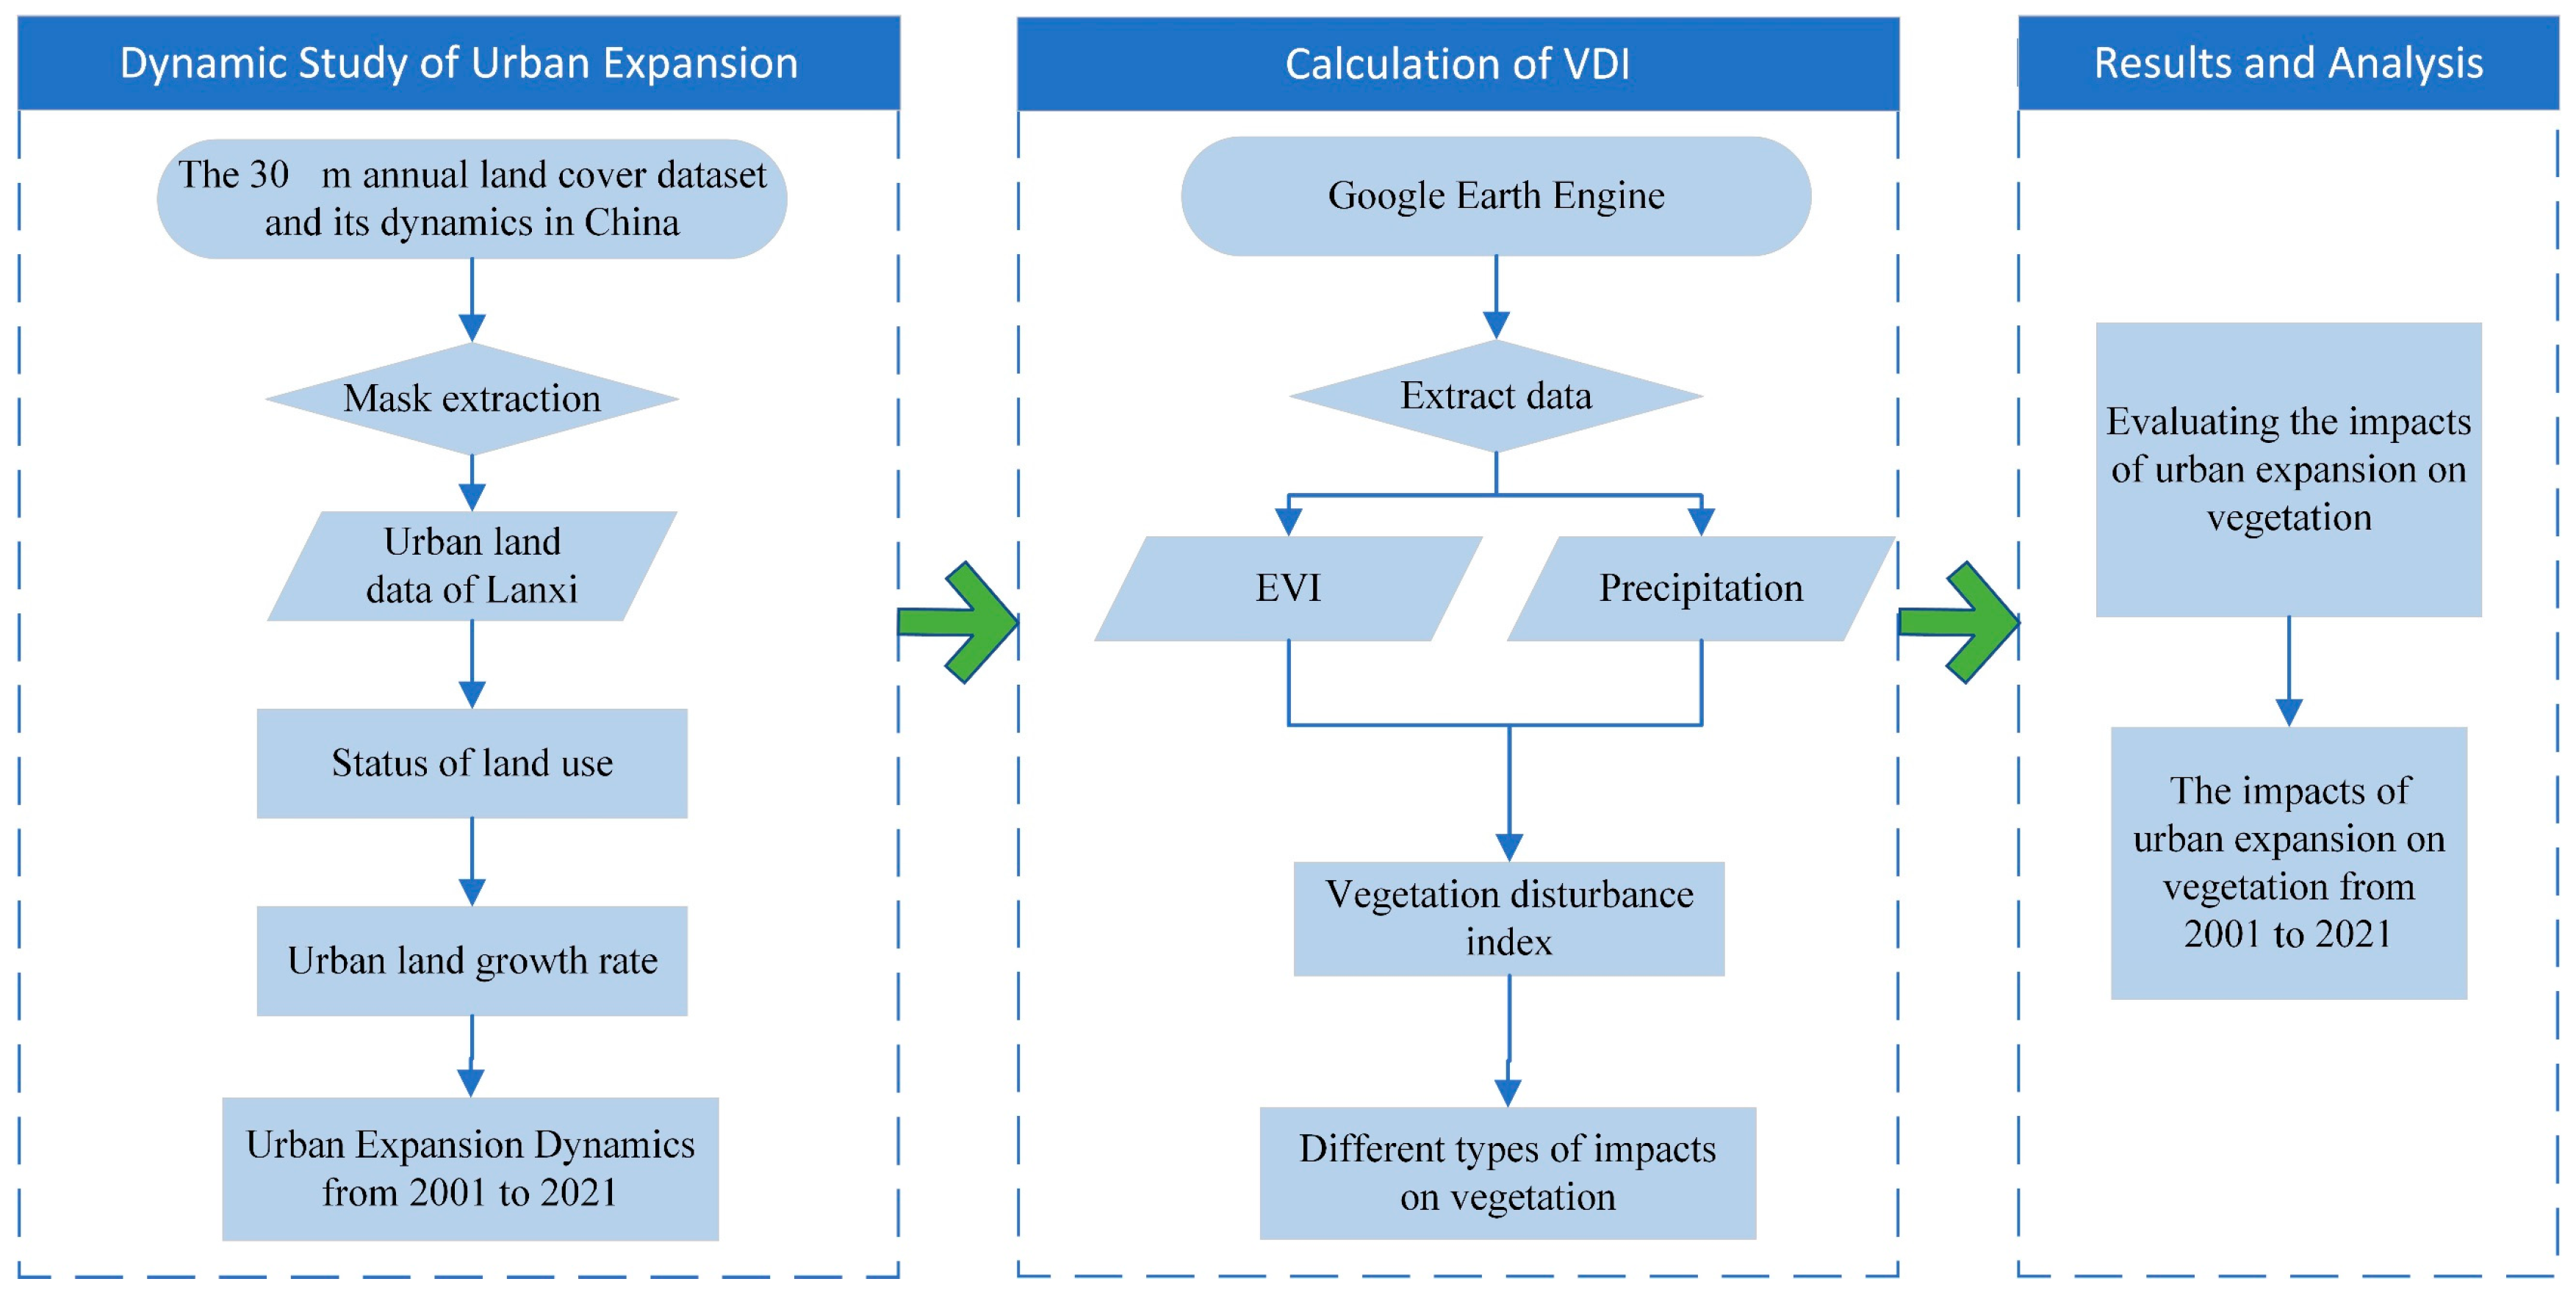
2.3. Methods
2.3.1. Quantifying Urban Expansion Dynamics
2.3.2. Calculation of the VDI
2.3.3. Impacts of Urban Expansion on Vegetation
3. Results
3.1. Urban Expansion Dynamics in the Lanxi Urban Cluster
3.1.1. Overview of Lanxi from 2001 to 2021
3.1.2. Statistical Expansion Information of the Key Cities
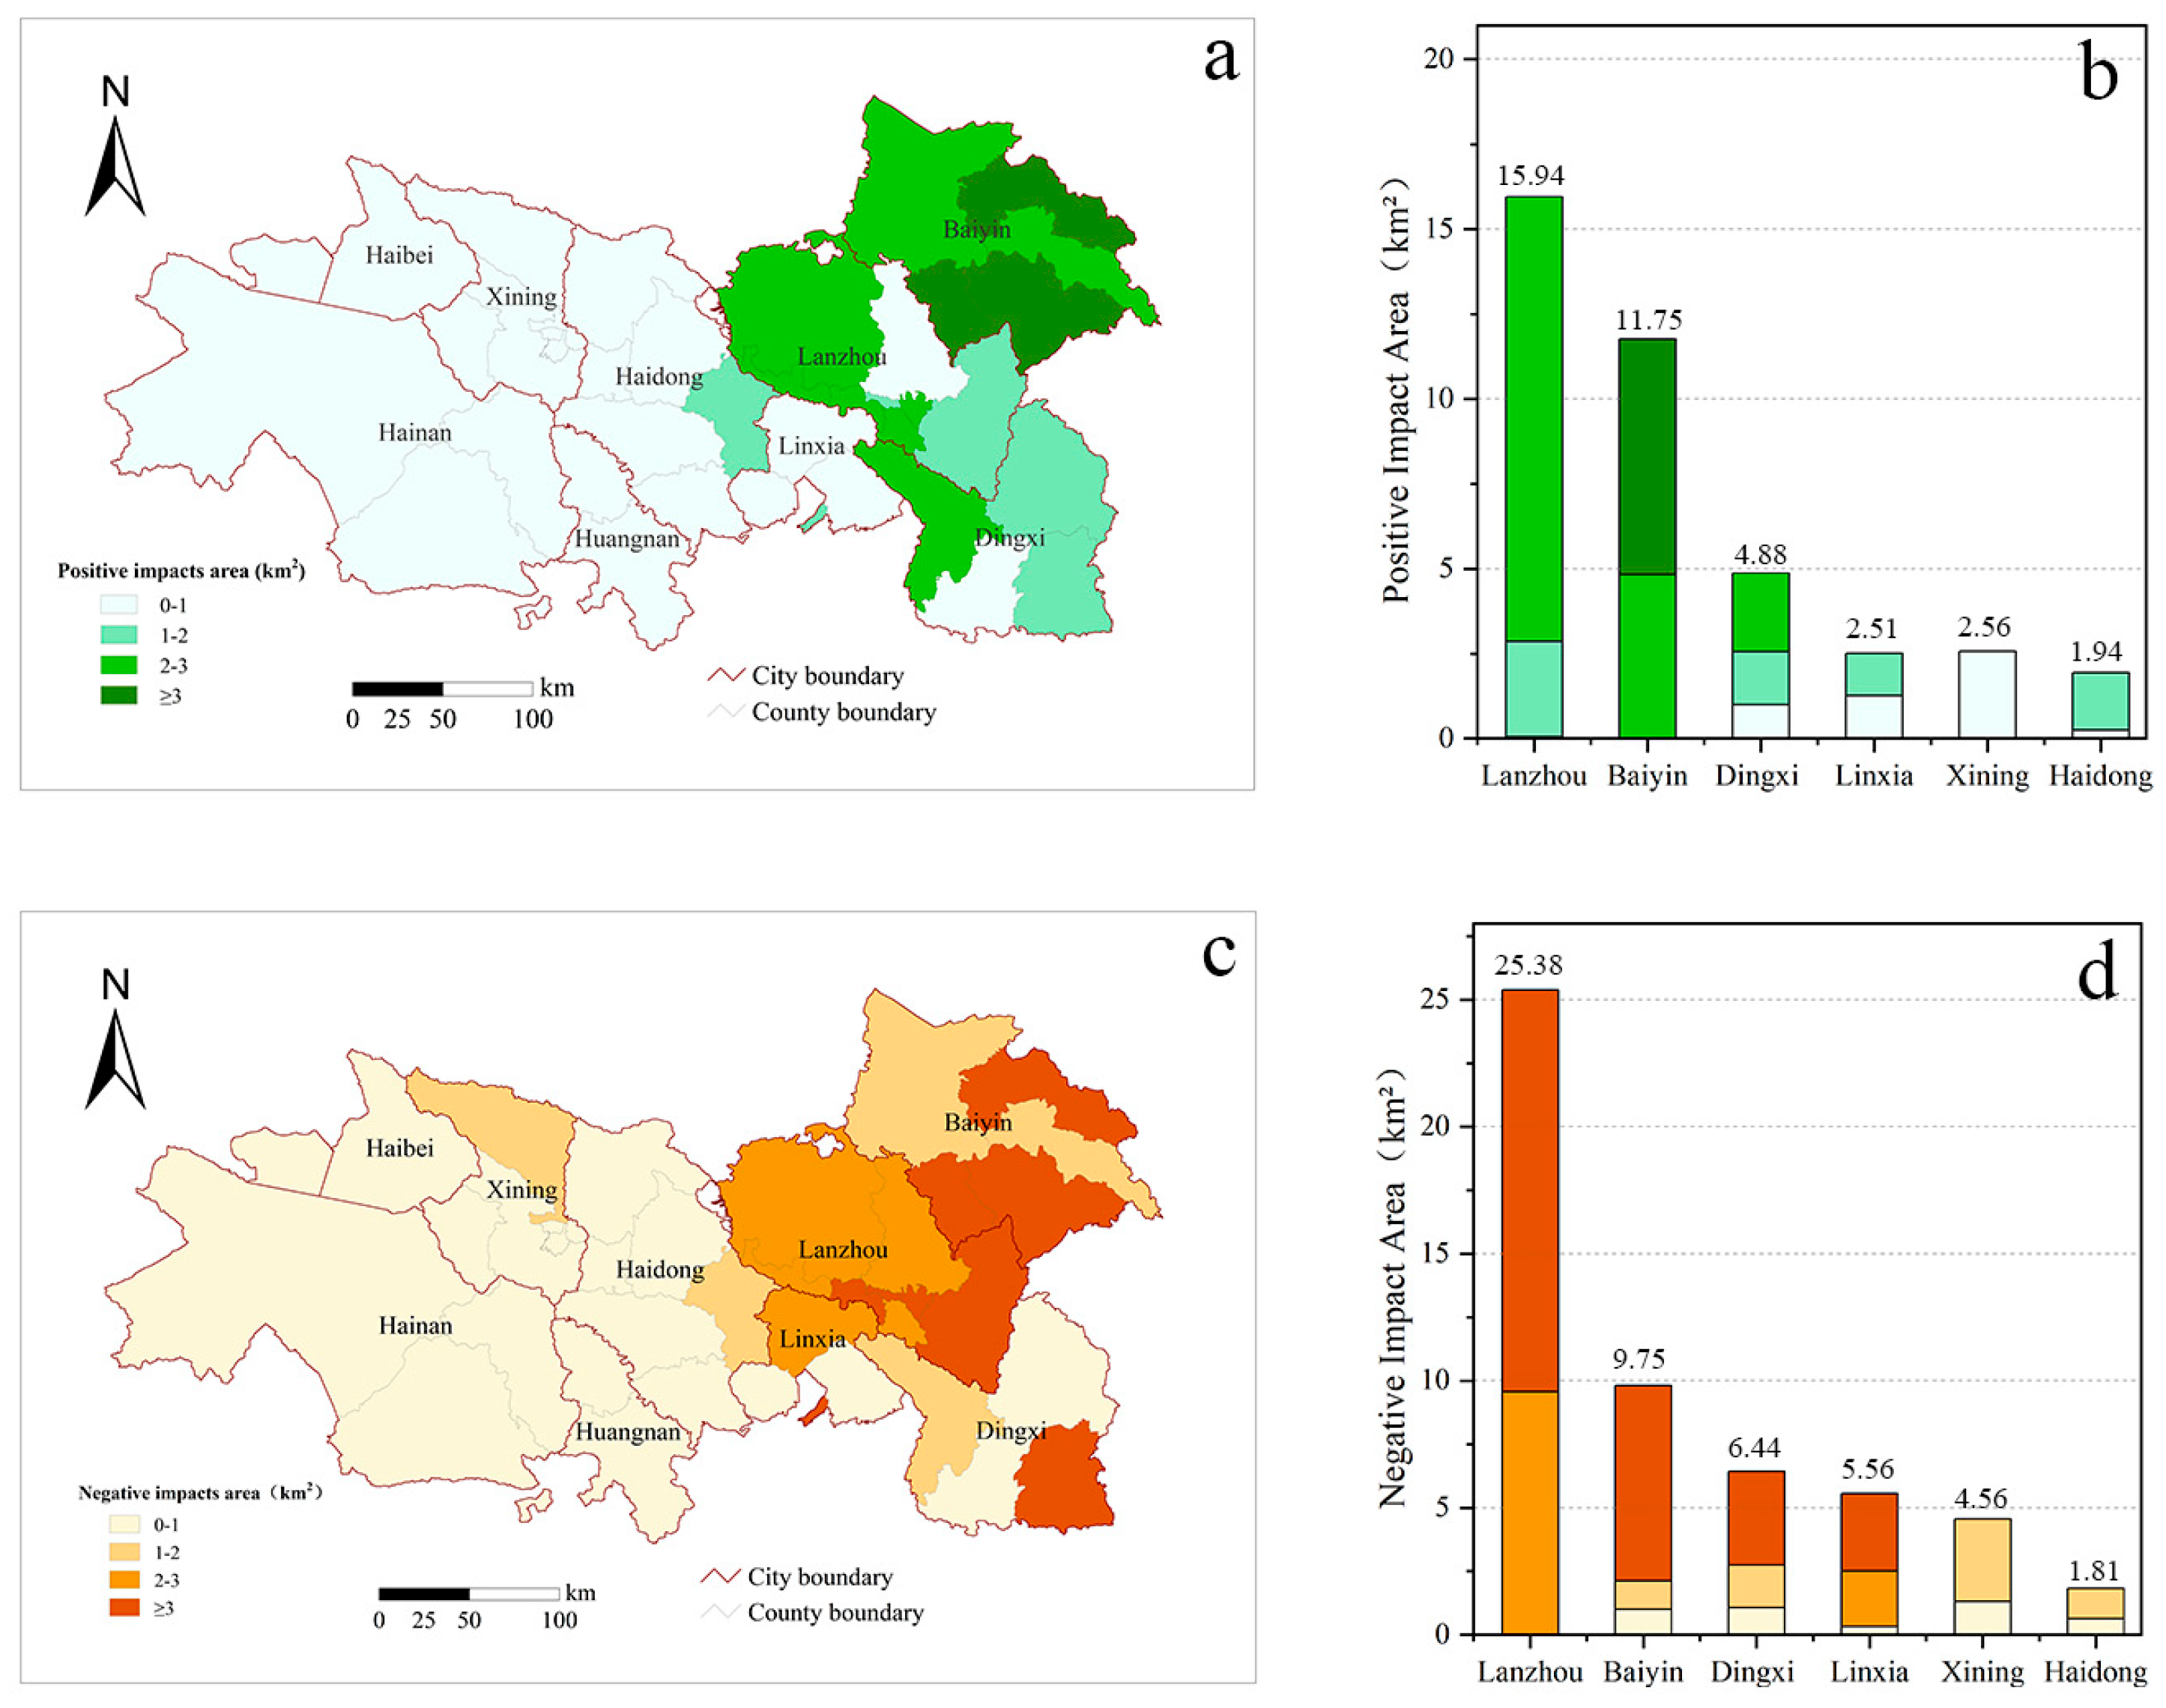
3.2. Expansion Impacts on Vegetation in the Lanxi Urban Cluster
3.3. Impact of Urban Expansion on Vegetation Distribution Dynamics
4. Discussion
4.1. Differences in the Expansion of the Lanxi Urban Cluster
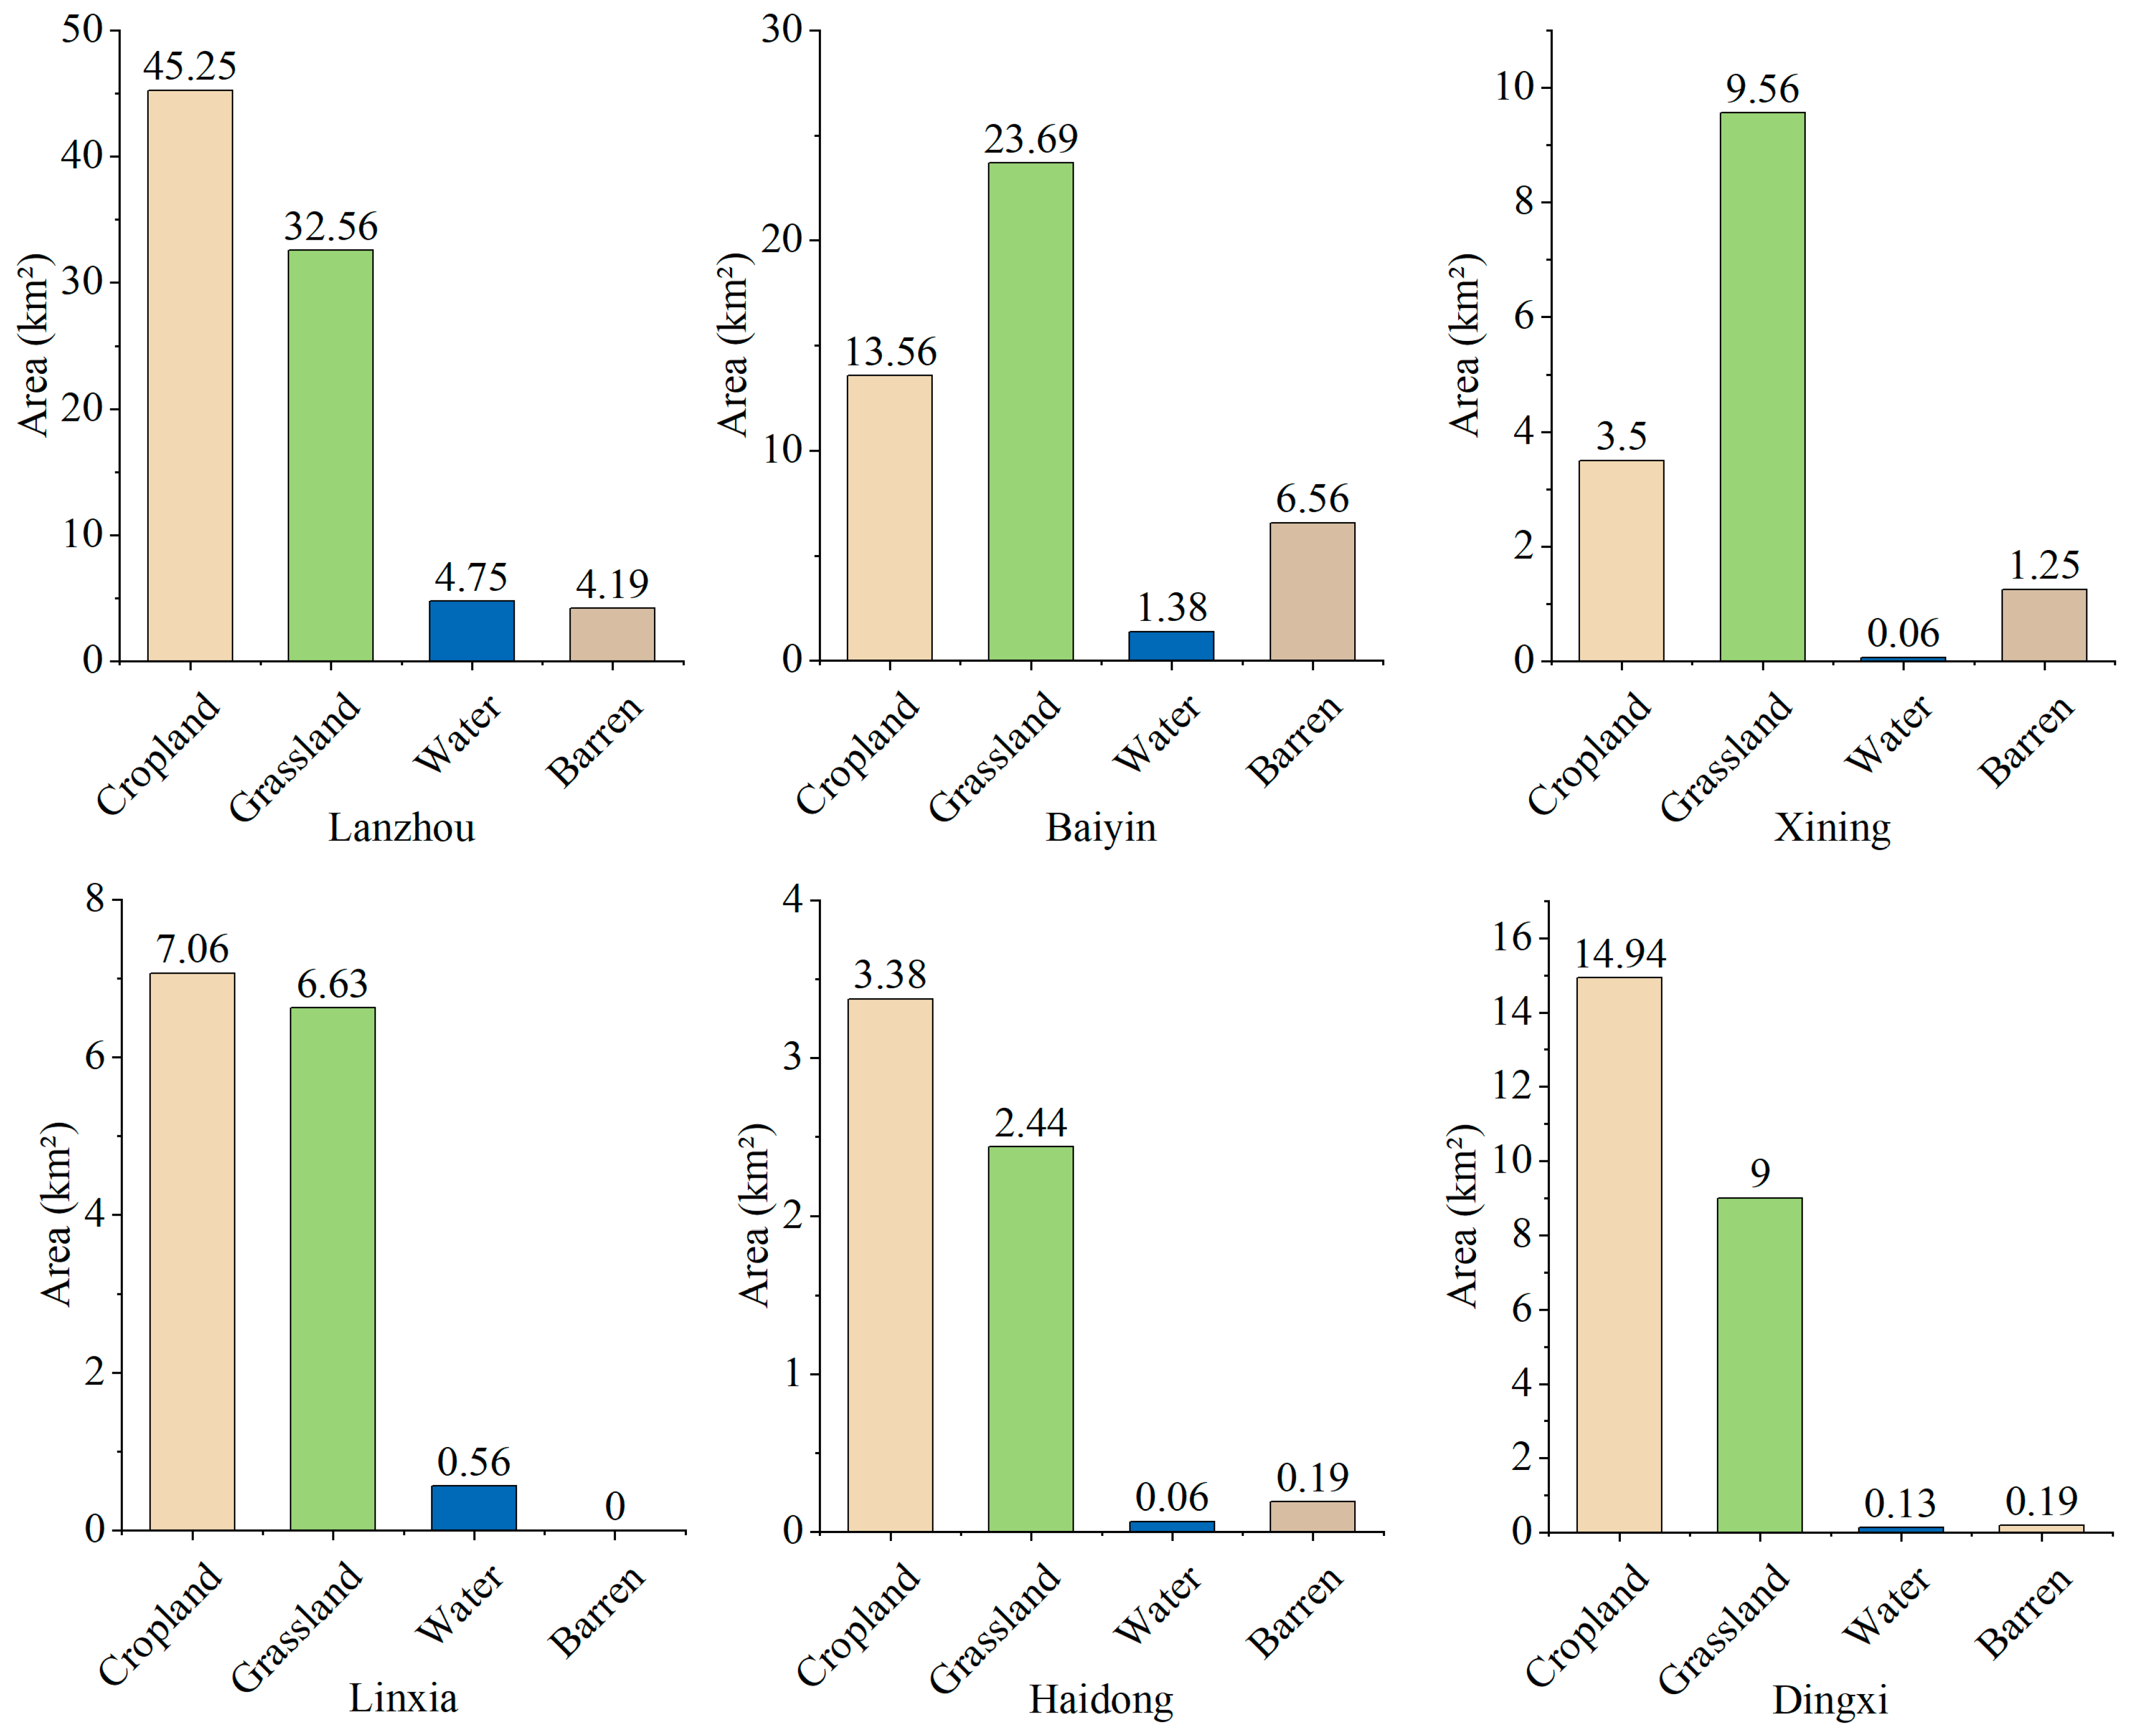
4.2. Negative Impacts Derived from Cropland and Grassland Loss
4.3. Limitations and Implications of This Study
5. Conclusions
Author Contributions
Funding
Institutional Review Board Statement
Informed Consent Statement
Data Availability Statement
Conflicts of Interest
References
- He, C.; Liu, Z.; Gou, S.; Zhang, Q.; Zhang, J.; Xu, L. Detecting global urban expansion over the last three decades using a fully convolutional network. Environ. Res. Lett. 2019, 14, 034008. [Google Scholar] [CrossRef]
- Chen, J.; Chen, J.; Liao, A.; Cao, X.; Chen, L.; Chen, X.; He, C.; Han, G.; Peng, S.; Lu, M. Global land cover mapping at 30 m resolution: A POK-based operational approach. ISPRS J. Photogramm. Remote Sens. 2015, 103, 7–27. [Google Scholar] [CrossRef]
- Kuang, W.; Chi, W.; Lu, D.; Dou, Y. A comparative analysis of megacity expansions in China and the US: Patterns, rates and driving forces. Landsc. Urban Plan. 2014, 132, 121–135. [Google Scholar] [CrossRef]
- Grimm, N.B.; Faeth, S.H.; Golubiewski, N.E.; Redman, C.L.; Wu, J.; Bai, X.; Briggs, J.M. Global change and the ecology of cities. Science 2008, 319, 756–760. [Google Scholar] [CrossRef]
- Qiao, Z.; Tian, G.; Zhang, L.; Xu, X. Influences of urban expansion on urban heat island in Beijing during 1989–2010. Adv. Meteorol. 2014, 2014, 187169. [Google Scholar] [CrossRef]
- Li, X.; Zhou, Y.; Asrar, G.R.; Imhoff, M.; Li, X. The surface urban heat island response to urban expansion: A panel analysis for the conterminous United States. Sci. Total Environ. 2017, 605, 426–435. [Google Scholar] [CrossRef] [PubMed]
- Idowu, D.; Zhou, W. Global Megacities and Frequent Floods: Correlation between Urban Expansion Patterns and Urban Flood Hazards. Sustainability 2023, 15, 2514. [Google Scholar] [CrossRef]
- Gonzalez-Ollauri, A.; Mickovski, S.B. Hydrological effect of vegetation against rainfall-induced landslides. J. Hydrol. 2017, 549, 374–387. [Google Scholar] [CrossRef]
- Zhang, J.; Qiu, H.; Tang, B.; Yang, D.; Liu, Y.; Liu, Z.; Ye, B.; Zhou, W.; Zhu, Y. Accelerating effect of vegetation on the instability of rainfall-induced shallow landslides. Remote Sens. 2022, 14, 5743. [Google Scholar] [CrossRef]
- Liu, C.; Liu, X. Temporal and spatial pattern and dynamic analysis of eco-environmental quality of Lanzhou-Xining urban agglomeration based on RSEI model. J. Qinghai Norm. Univ. 2022, 38, 21–30. [Google Scholar] [CrossRef]
- Li, C.; Fu, B.; Wang, S.; Stringer, L.C.; Wang, Y.; Li, Z.; Liu, Y.; Zhou, W. Drivers and impacts of changes in China’s drylands. Nat. Rev. Earth Environ. 2021, 2, 858–873. [Google Scholar] [CrossRef]
- Funk, C.; Peterson, P.; Landsfeld, M.; Pedreros, D.; Verdin, J.; Shukla, S.; Husak, G.; Rowland, J.; Harrison, L.; Hoell, A. The climate hazards infrared precipitation with stations—A new environmental record for monitoring extremes. Sci. Data 2015, 2, 150066. [Google Scholar] [CrossRef] [PubMed]
- Yao, R.; Cao, J.; Wang, L.; Zhang, W.; Wu, X. Urbanization effects on vegetation cover in major African cities during 2001–2017. Int. J. Appl. Earth Obs. Geoinf. 2019, 75, 44–53. [Google Scholar] [CrossRef]
- Zhao, S.; Liu, S.; Zhou, D. Prevalent vegetation growth enhancement in urban environment. Proc. Natl. Acad. Sci. USA 2016, 113, 6313–6318. [Google Scholar] [CrossRef] [PubMed]
- Yang, J.; Huang, C.; Zhang, Z.; Wang, L. The temporal trend of urban green coverage in major Chinese cities between 1990 and 2010. Urban For. Urban Green. 2014, 13, 19–27. [Google Scholar] [CrossRef]
- Wu, W.-B.; Ma, J.; Meadows, M.E.; Banzhaf, E.; Huang, T.-Y.; Liu, Y.-F.; Zhao, B. Spatio-temporal changes in urban green space in 107 Chinese cities (1990–2019): The role of economic drivers and policy. Int. J. Appl. Earth Obs. Geoinf. 2021, 103, 102525. [Google Scholar] [CrossRef]
- Huang, B.; Li, Z.; Dong, C.; Zhu, Z.; Zeng, H. The effects of urbanization on vegetation conditions in coastal zone of China. Prog. Phys. Geogr. Earth Environ. 2021, 45, 564–579. [Google Scholar] [CrossRef]
- Fu, B.; Wu, X.; Wang, Z.; Wu, X.; Wang, S. Coupling human and natural systems for sustainability: Experience from China’s Loess Plateau. Earth Syst. Dyn. 2022, 13, 795–808. [Google Scholar] [CrossRef]
- Cao, S. Impact of China’s large-scale ecological restoration program on the environment and society in arid and semiarid areas of China: Achievements, problems, synthesis, and applications. Crit. Rev. Environ. Sci. Technol. 2011, 41, 317–335. [Google Scholar] [CrossRef]
- Cumming, G.S. Theoretical frameworks for the analysis of social–ecological systems. Soc. Ecol. Syst. Transit. 2014, 3–24. [Google Scholar]
- Sun, J.; Wang, X.; Chen, A.; Ma, Y.; Cui, M.; Piao, S. NDVI indicated characteristics of vegetation cover change in China’s metropolises over the last three decades. Environ. Monit. Assess. 2011, 179, 1–14. [Google Scholar] [CrossRef] [PubMed]
- Matsushita, B.; Yang, W.; Chen, J.; Onda, Y.; Qiu, G. Sensitivity of the enhanced vegetation index (EVI) and normalized difference vegetation index (NDVI) to topographic effects: A case study in high-density cypress forest. Sensors 2007, 7, 2636–2651. [Google Scholar] [CrossRef] [PubMed]
- d’Amour, C.B.; Reitsma, F.; Baiocchi, G.; Barthel, S.; Güneralp, B.; Erb, K.; Haberl, H.; Creutzig, F.; Seto, K.C. Future urban land expansion and implications for global croplands. Proc. Natl. Acad. Sci. USA 2017, 114, 8939–8944. [Google Scholar] [CrossRef] [PubMed]
- Xu, Y.; Yang, J.; Chen, Y. NDVI-based vegetation responses to climate change in an arid area of China. Theor. Appl. Climatol. 2016, 126, 213–222. [Google Scholar] [CrossRef]
- Jafari, R.; Bashari, H.; Tarkesh, M. Discriminating and monitoring rangeland condition classes with MODIS NDVI and EVI indices in Iranian arid and semi-arid lands. Arid Land Res. Manag. 2017, 31, 94–110. [Google Scholar] [CrossRef]
- Jenerette, G.D.; Miller, G.; Buyantuev, A.; Pataki, D.E.; Gillespie, T.W.; Pincetl, S. Urban vegetation and income segregation in drylands: A synthesis of seven metropolitan regions in the southwestern United States. Environ. Res. Lett. 2013, 8, 044001. [Google Scholar] [CrossRef]
- Wardlow, B.D.; Egbert, S.L. A comparison of MODIS 250-m EVI and NDVI data for crop mapping: A case study for southwest Kansas. Int. J. Remote Sens. 2010, 31, 805–830. [Google Scholar] [CrossRef]
- Wang, L.; Gong, W.; Zhang, M.; Ma, Y. Dynamic monitoring of vegetation NPP in Wuhan based on MODIS. Geomat. Inf. Sci. Wuhan Univ. 2013, 38, 548–552. [Google Scholar]
- Pei, F.; Li, X.; Liu, X.; Wang, S.; He, Z. Assessing the differences in net primary productivity between pre-and post-urban land development in China. Agric. For. Meteorol. 2013, 171, 174–186. [Google Scholar] [CrossRef]
- Cramer, W.; Kicklighter, D.W.; Bondeau, A.; Iii, B.M.; Churkina, G.; Nemry, B.; Ruimy, A.; Schloss, A.L.; ThE. Participants OF. ThE. Potsdam NpP. Model Intercomparison. Comparing global models of terrestrial net primary productivity (NPP): Overview and key results. Glob. Chang. Biol. 1999, 5, 1–15. [Google Scholar] [CrossRef]
- Sala, O.E.; Austin, A.T. Methods of estimating aboveground net primary productivity. In Methods in Ecosystem Science; Springer: Berlin/Heidelberg, Germany, 2000; pp. 31–43. [Google Scholar]
- Esau, I.; Miles, V.V.; Davy, R.; Miles, M.W.; Kurchatova, A. Trends in normalized difference vegetation index (NDVI) associated with urban development in northern West Siberia. Atmos. Chem. Phys. 2016, 16, 9563–9577. [Google Scholar] [CrossRef]
- Schloss, A.; Kicklighter, D.; Kaduk, J.; Wittenberg, U.; ThE. Participants OF. ThE. Potsdam NpP. Model Intercomparison. Comparing global models of terrestrial net primary productivity (NPP): Comparison of NPP to climate and the Normalized Difference Vegetation Index (NDVI). Glob. Chang. Biol. 1999, 5, 25–34. [Google Scholar] [CrossRef]
- Stefanov, W.L.; Netzband, M. Assessment of ASTER land cover and MODIS NDVI data at multiple scales for ecological characterization of an arid urban center. Remote Sens. Environ. 2005, 99, 31–43. [Google Scholar] [CrossRef]
- Stefanov, W.L.; Ramsey, M.S.; Christensen, P.R. Monitoring urban land cover change: An expert system approach to land cover classification of semiarid to arid urban centers. Remote Sens. Environ. 2001, 77, 173–185. [Google Scholar] [CrossRef]
- Wessels, K.J.; Prince, S.D.; Malherbe, J.; Small, J.; Frost, P.E.; VanZyl, D. Can human-induced land degradation be distinguished from the effects of rainfall variability? A case study in South Africa. J. Arid Environ. 2007, 68, 271–297. [Google Scholar] [CrossRef]
- Nicholson, S.; Farrar, T. The influence of soil type on the relationships between NDVI, rainfall, and soil moisture in semiarid Botswana. I. NDVI response to rainfall. Remote Sens. Environ. 1994, 50, 107–120. [Google Scholar] [CrossRef]
- Luan, W.; Li, X. Rapid urbanization and its driving mechanism in the Pan-Third Pole region. Sci. Total Environ. 2021, 750, 141270. [Google Scholar] [CrossRef]
- He, C.; Liu, Z.; Tian, J.; Ma, Q. Urban expansion dynamics and natural habitat loss in China: A multiscale landscape perspective. Glob. Chang. Biol. 2014, 20, 2886–2902. [Google Scholar] [CrossRef]
- Liu, Z.; He, C.; Zhang, Q.; Huang, Q.; Yang, Y. Extracting the dynamics of urban expansion in China using DMSP-OLS nighttime light data from 1992 to 2008. Landsc. Urban Plan. 2012, 106, 62–72. [Google Scholar] [CrossRef]
- Cohen, B. Urbanization in developing countries: Current trends, future projections, and key challenges for sustainability. Technol. Soc. 2006, 28, 63–80. [Google Scholar] [CrossRef]
- Dewan, A.M.; Yamaguchi, Y. Land use and land cover change in Greater Dhaka, Bangladesh: Using remote sensing to promote sustainable urbanization. Appl. Geogr. 2009, 29, 390–401. [Google Scholar] [CrossRef]
- Fei, W.; Zhao, S. Urban land expansion in China’s six megacities from 1978 to 2015. Sci. Total Environ. 2019, 664, 60–71. [Google Scholar] [CrossRef] [PubMed]
- Findell, K.L.; Berg, A.; Gentine, P.; Krasting, J.P.; Lintner, B.R.; Malyshev, S.; Santanello, J.A., Jr.; Shevliakova, E. The impact of anthropogenic land use and land cover change on regional climate extremes. Nat. Commun. 2017, 8, 989. [Google Scholar] [CrossRef] [PubMed]
- Hansen, M.C.; Loveland, T.R. A review of large area monitoring of land cover change using Landsat data. Remote Sens. Environ. 2012, 122, 66–74. [Google Scholar] [CrossRef]
- Jun, L.; Xuebin, Z. Research on Agricultural Production Efficiency of Lanzhou-Xi’ning Urban Agglomeration. IOP Conf. Ser. Mater. Sci. Eng. 2020, 780, 072055. [Google Scholar] [CrossRef]
- Li, C.; Wang, R. Recent changes of precipitation in Gansu, Northwest China: An index-based analysis. Theor. Appl. Climatol. 2017, 129, 397–412. [Google Scholar] [CrossRef]
- Yang, B.; Qin, C.; Bräuning, A.; Burchardt, I.; Liu, J. Rainfall history for the Hexi Corridor in the arid northwest China during the past 620 years derived from tree rings. Int. J. Climatol. 2011, 31, 1166–1176. [Google Scholar] [CrossRef]
- Li, J.; Li, G.; Liang, Y.; Yuan, J.; Xu, G.; Yang, C. Spatiotemporal differentiation of the ecosystem service value and its coupling relationship with urbanization: A case study of the Lanzhou-Xining urban agglomeration. Ecol. Indic. 2024, 160, 111932. [Google Scholar] [CrossRef]
- Lv, Y.; Xiu, L.; Yao, X.; Yu, Z.; Huang, X. Spatiotemporal evolution and driving factors analysis of the eco-quality in the Lanxi urban agglomeration. Ecol. Indic. 2023, 156, 111114. [Google Scholar] [CrossRef]
- Yang, J.; Huang, X. The 30 m annual land cover dataset and its dynamics in China from 1990 to 2019. Earth Syst. Sci. Data 2021, 13, 3907–3925. [Google Scholar] [CrossRef]
- Kumar, M. World geodetic system 1984: A modern and accurate global reference frame. Mar. Geod. 1988, 12, 117–126. [Google Scholar] [CrossRef]
- Liang, D.; Zuo, Y.; Huang, L.; Zhao, J.; Teng, L.; Yang, F. Evaluation of the consistency of MODIS Land Cover Product (MCD12Q1) based on Chinese 30 m GlobeLand30 datasets: A case study in Anhui Province, China. ISPRS Int. J. Geo-Inf. 2015, 4, 2519–2541. [Google Scholar] [CrossRef]
- Yu, L.; Wang, J.; Gong, P. Improving 30 m global land-cover map FROM-GLC with time series MODIS and auxiliary data sets: A segmentation-based approach. Int. J. Remote Sens. 2013, 34, 5851–5867. [Google Scholar] [CrossRef]
- Zhang, M.; Li, G.; He, T.; Zhai, G.; Guo, A.; Chen, H.; Wu, C. Reveal the severe spatial and temporal patterns of abandoned cropland in China over the past 30 years. Sci. Total Environ. 2023, 857, 159591. [Google Scholar] [CrossRef]
- Hinojosa, L.; Napoléone, C.; Moulery, M.; Lambin, E.F. The “mountain effect” in the abandonment of grasslands: Insights from the French Southern Alps. Agric. Ecosyst. Environ. 2016, 221, 115–124. [Google Scholar] [CrossRef]
- Lambin, E.F.; Geist, H.J.; Lepers, E. Dynamics of land-use and land-cover change in tropical regions. Annu. Rev. Environ. Resour. 2003, 28, 205–241. [Google Scholar] [CrossRef]
- Kennedy, M. Introducing Geographic Information Systems with ARCGIS: A Workbook Approach to Learning GIS; John Wiley & Sons: Hoboken, NJ, USA, 2009. [Google Scholar]
- Mutanga, O.; Kumar, L. Google Earth Engine Applications. Remot Sens. 2019, 11, 591. [Google Scholar] [CrossRef]
- Ma, Q.; He, C.; Fang, X. A rapid method for quantifying landscape-scale vegetation disturbances by surface coal mining in arid and semiarid regions. Landsc. Ecol. 2018, 33, 2061–2070. [Google Scholar] [CrossRef]
- Qi, T.; Ren, Q.; He, C.; Zhang, X. Dual effects on vegetation from urban expansion in the drylands of northern China: A multiscale investigation using the vegetation disturbance index. Sci. Total Environ. 2024, 928, 172481. [Google Scholar] [CrossRef]
- Huang, Q.; Liu, Z.; He, C.; Gou, S.; Bai, Y.; Wang, Y.; Shen, M. The occupation of cropland by global urban expansion from 1992 to 2016 and its implications. Environ. Res. Lett. 2020, 15, 084037. [Google Scholar] [CrossRef]
- Yang, J.; Li, S.; Lu, H. Quantitative influence of land-use changes and urban expansion intensity on landscape pattern in Qingdao, China: Implications for urban sustainability. Sustainability 2019, 11, 6174. [Google Scholar] [CrossRef]
- Zhao, X.; Hu, H.; Shen, H.; Zhou, D.; Zhou, L.; Myneni, R.B.; Fang, J. Satellite-indicated long-term vegetation changes and their drivers on the Mongolian Plateau. Landsc. Ecol. 2015, 30, 1599–1611. [Google Scholar] [CrossRef]
- Cui, Y.; Xiao, X.; Dong, J.; Zhang, Y.; Qin, Y.; Doughty, R.B.; Wu, X.; Liu, X.; Joiner, J.; Moore, B., III. Continued increases of gross primary production in urban areas during 2000–2016. J. Remote Sens. 2022, 2022, 9868564. [Google Scholar] [CrossRef]
- Song, X.-P.; Hansen, M.C.; Stehman, S.V.; Potapov, P.V.; Tyukavina, A.; Vermote, E.F.; Townshend, J.R. Global land change from 1982 to 2016. Nature 2018, 560, 639–643. [Google Scholar] [CrossRef] [PubMed]
- Liu, Z.; Ding, M.; He, C.; Li, J.; Wu, J. The impairment of environmental sustainability due to rapid urbanization in the dryland region of northern China. Landsc. Urban Plan. 2019, 187, 165–180. [Google Scholar] [CrossRef]
- Nie, X.; Li, K.; Huang, W.; Li, X. Analysis on Spatial and Temporal Evolution Characteristics of National Land Structure of the Lanzhou-Xining Urban Agglomeration in the Upper Reaches of the Yellow River. E3S Web Conf. 2021, 293, 01014. [Google Scholar] [CrossRef]
- Yin, J.; Liu, H.; Shi, P.; Zhang, W. Exploring Coupling Relationship between Urban Connection and High-quality Development Using the Case of Lanzhou-Xining Urban Agglomeration. Complexity 2021, 2021, 9933582. [Google Scholar] [CrossRef]
- Fan, Y.; Fang, C. Evolution process analysis of urban metabolic patterns and sustainability assessment in western China, a case study of Xining city. Ecol. Indic. 2020, 109, 105784. [Google Scholar] [CrossRef]
- Wang, L. People’s Republic of China: Gansu Baiyin Urban Development Project; Asian Development Bank: Mandaluyong, Philippines, 2008. [Google Scholar]
- Xian, X.; Zhang, L.; Ai, N.; Wihelm, W. On the relation between the evolution of natural environment and human factors and the development of urban settlement—Take the Lanzhou Valley Basin as an examples. Chin. Geogr. Sci. 1991, 1, 42–53. [Google Scholar] [CrossRef]
- Zhao, L.; Yang, L.; Chang, X. Spatial network characteristics and economic effects of element flow in the Lanxi urban agglomeration. PLoS ONE 2024, 19, e0296496. [Google Scholar] [CrossRef]
- Yang, M.; Qian, Y.; Li, X.; Liu, Z.; Zeng, J. Dynamic coupling between transportation networks and urban vitality in the Lanzhou–Xining urban agglomeration. Front. Earth Sci. 2024, 12, 1349398. [Google Scholar] [CrossRef]
- Fu, C.; Shi, P.; Feng, T.; Zhang, W. Spatio-temporal difference analysis of land use efficiency in Lanxi Urban Agglomeration based on SBM-Undesirable model. E3S Web Conf. 2020, 194, 05062. [Google Scholar] [CrossRef]
- Song, S.; He, C.; Liu, Z.; Qi, T. Evaluating the influences of urban expansion on multiple ecosystem services in drylands. Landsc. Ecol. 2022, 37, 2783–2802. [Google Scholar] [CrossRef]
- Chen, Z.; Zhang, Q.; Li, F.; Shi, J. Comprehensive evaluation of land use benefit in the Yellow River Basin from 1995 to 2018. Land 2021, 10, 643. [Google Scholar] [CrossRef]
- Tang, X.; Wei, T.; He, Y.; He, K. Differentiation of Vegetation Community Characteristics by Altitude within Urban Parks and Their Service Functions in a Semi-Arid Mountain Valley: A Case Study of Lanzhou City. ISPRS Int. J. Geo-Inf. 2022, 11, 549. [Google Scholar] [CrossRef]
- Yang, K.; Sun, W.; Luo, Y.; Zhao, L. Impact of urban expansion on vegetation: The case of China (2000–2018). J. Environ. Manag. 2021, 291, 112598. [Google Scholar] [CrossRef]
- Li, W.; Cui, Y.; Liu, X.; Deng, C.; Zhang, S. Positive impact of urbanization on vegetation growth has been continuously strengthening in arid regions of China. Environ. Res. Lett. 2023, 18, 124011. [Google Scholar] [CrossRef]
- Liu, Y.; Gao, Y.; Liu, L.; Song, C.; Ai, D. Nature-based solutions for urban expansion: Integrating ecosystem services into the delineation of growth boundaries. Habitat Int. 2022, 124, 102575. [Google Scholar] [CrossRef]
- He, C.; Li, J.; Zhang, X.; Liu, Z.; Zhang, D. Will rapid urban expansion in the drylands of northern China continue: A scenario analysis based on the Land Use Scenario Dynamics-urban model and the Shared Socioeconomic Pathways. J. Clean. Prod. 2017, 165, 57–69. [Google Scholar] [CrossRef]
- Prăvălie, R. Drylands extent and environmental issues. A global approach. Earth-Sci. Rev. 2016, 161, 259–278. [Google Scholar] [CrossRef]


| Type | 2001 (km2) | 2021 (km2) |
|---|---|---|
| Cropland | 14,660.31 | 13,272.51 |
| Forest | 2813.32 | 3243.09 |
| Shrub | 1084.71 | 984.61 |
| Grassland | 73,833.91 | 74,126.35 |
| Water | 3332.12 | 3716.11 |
| Snow/Ice | 3.11 | 1.96 |
| Barren | 3429.48 | 3700.02 |
| Urban | 183.49 | 294.31 |
| Wetland | 0.59 | 2.09 |
| City | Urban Expansion Dynamics | Impact on Vegetation | |||||||||
|---|---|---|---|---|---|---|---|---|---|---|---|
| Urban Land Area (km2) | Expanded Area (km2) | UEI | Annual Growth Rate | Expansion Rate | Positive Impacts | Negative Impacts | |||||
| 2001 | 2021 | Area (km2) | Percentage | Area (km2) | Percentage | ||||||
| Lanzhou | 121.80 | 169.73 | 47.93 | 0.02 | 1.67% | 1.39 | 15.94 | 33.25% | 25.38 | 52.94% | |
| Baiyin | 27.43 | 52.45 | 25.02 | 0.05 | 3.29% | 1.91 | 11.75 | 46.96% | 9.75 | 38.96% | |
| Dingxi | 14.68 | 30.07 | 15.38 | 0.05 | 3.65% | 2.05 | 4.88 | 31.69% | 6.44 | 41.84% | |
| Linxia | 11.72 | 20.41 | 8.69 | 0.04 | 2.81% | 1.74 | 2.50 | 28.76% | 5.56 | 63.99% | |
| Xining | 4.91 | 13.92 | 9.01 | 0.09 | 5.35% | 2.84 | 2.56 | 28.43% | 4.56 | 50.59% | |
| Haidong | 2.86 | 7.39 | 4.53 | 0.08 | 4.87% | 2.59 | 1.94 | 42.75% | 1.81 | 39.99% | |
| Total | 2184.40 | 2314.97 | 110.56 | 0.03 | 2.39% | 1.60 | 39.57 | 35.71 | 53.5 | 48.28 | |
| 2001 | Barren | Cropland | Forest | Grassland | Impervious | Shrub | Snow/Ice | Water | Wetland | Total (km2) | |
| 2021 | |||||||||||
| Barren | 2077.50 | 56.41 | 0.15 | 1534.25 | 5.71 | 0.05 | 3.44 | 6.17 | - | 3683.68 | |
| Cropland | 46.47 | 8225.32 | 28.72 | 4889.49 | 26.08 | 0.42 | - | 31.37 | 0.04 | 13,247.91 | |
| Forest | 0.14 | 80.84 | 1870.16 | 1115.32 | 0.01 | 160.94 | - | 0.51 | - | 3227.91 | |
| Grassland | 1111.10 | 6153.24 | 765.40 | 65,289.73 | 44.43 | 608.53 | 0.26 | 44.45 | 0.22 | 74,017.36 | |
| Impervious | 12.30 | 87.78 | - | 85.82 | 103.45 | - | - | 5.82 | - | 295.17 | |
| Shrub | - | 1.51 | 137.01 | 535.68 | - | 315.25 | - | - | - | 989.45 | |
| Snow/Ice | 1.21 | - | 0.02 | 0.34 | - | - | 0.18 | - | - | 1.75 | |
| Water | 179.25 | 59.57 | 1.79 | 221.61 | 4.70 | 0.12 | - | 3239.12 | 0.10 | 3706.26 | |
| Wetland | - | 0.27 | 0.02 | 1.97 | - | - | - | 0.04 | 0.32 | 2.63 | |
| Total | 3427.96 | 14,664.95 | 2803.26 | 73,674.21 | 184.38 | 1085.31 | 3.87 | 3327.48 | 0.69 | 99,172.12 | |
Disclaimer/Publisher’s Note: The statements, opinions and data contained in all publications are solely those of the individual author(s) and contributor(s) and not of MDPI and/or the editor(s). MDPI and/or the editor(s) disclaim responsibility for any injury to people or property resulting from any ideas, methods, instructions or products referred to in the content. |
© 2024 by the authors. Licensee MDPI, Basel, Switzerland. This article is an open access article distributed under the terms and conditions of the Creative Commons Attribution (CC BY) license (https://creativecommons.org/licenses/by/4.0/).
Share and Cite
Wang, W.; Luan, W.; Jing, H.; Zhu, J.; Zhang, K.; Ma, Q.; Zhang, S.; Liang, X. Quantitative Assessment of Urban Expansion Impact on Vegetation in the Lanzhou–Xining Urban Agglomeration. Appl. Sci. 2024, 14, 8615. https://doi.org/10.3390/app14198615
Wang W, Luan W, Jing H, Zhu J, Zhang K, Ma Q, Zhang S, Liang X. Quantitative Assessment of Urban Expansion Impact on Vegetation in the Lanzhou–Xining Urban Agglomeration. Applied Sciences. 2024; 14(19):8615. https://doi.org/10.3390/app14198615
Chicago/Turabian StyleWang, Wensheng, Wenfei Luan, Haitao Jing, Jingyao Zhu, Kaixiang Zhang, Qingqing Ma, Shiye Zhang, and Xiujuan Liang. 2024. "Quantitative Assessment of Urban Expansion Impact on Vegetation in the Lanzhou–Xining Urban Agglomeration" Applied Sciences 14, no. 19: 8615. https://doi.org/10.3390/app14198615