Article

Geochemical Characteristics and Depositional Environment from the Permian Qipan Formation Hydrocarbon Source Rocks in the Piedmont of Southwestern Tarim Basin

1
College of Geosciences, Yangtze University, Wuhan 430100, China
2
Exploration and Development Research Institute of PetroChina Changqing Oilfield Company, Xi’an 710016, China
*
Author to whom correspondence should be addressed.
Appl. Sci. 2024, 14(19), 8634; https://doi.org/10.3390/app14198634
Submission received: 1 August 2024 / Revised: 1 September 2024 / Accepted: 18 September 2024 / Published: 25 September 2024

Abstract

:
The Permian Qipan Formation (P1-2q) is the aim horizon for hydrocarbon source rocks in the piedmont area of southwestern Tarim Basin. In the present study, the depositional environment and geochemical characteristics of muddy hydrocarbon source rocks of P1-2q were systematically evaluated using total organic carbon (TOC), Rock-Eval pyrolysis, vitrinite reflectance (Ro), reflected light microscopy, main and trace element, and biomarker parameters of 167 outcrop samples and 176 core samples. The TOC of P1-2q is primarily concentrated within the range of 0.36% to 2.77%, with an average of 1.58%. This suggests that the overall evaluation of the hydrocarbon source rock is fair to good. The source rocks of P1-2q predominately contain Type III and Type II2 kerogen. The overall Tmax values of P1-2q hydrocarbon source rocks are notably elevated, with the majority exceeding 490 °C or falling between 455 °C and 490 °C. The Ro value is between 0.90% and 2.00%, indicating that the maturity has reached a high, over-mature evolutionary stage. The trace element and biomarker parameters indicate that hydrocarbon source rocks of P1-2q are predominantly slightly oxygen-rich, with a minor anoxic component. The asymmetric ‘V’ arrangement of the C27-C29 regular steranes indicates that the hydrocarbon parent material is predominantly derived from algae or aquatic organisms, with varying degrees of mixing with organic matter of terrestrial origin. The study of source rock geochemistry of the P1-2q makes the exploration target of the southwest depression of the Tarim Basin more accurate in the complex tectonic geological environment.

1. Introduction

The majority of the world’s significant oil and gas fields are situated within the piedmont area [1]. The piedmont of the southwestern area in the Tarim Basin has the potential to be a significant location for oil exploration. The development of multiple sets of source rocks in the research area has initiated a debate about oil sources. The early view was that oil and gas originated from multiple source rocks, including the Carboniferous-Permian, Jurassic, and Cretaceous-Paleogene [2]. Moreover, it was found that the oil and gas in the central and southern study area originated from the Carboniferous, Permian, and Jurassic system, rather than a unified period, and the Jurassic system has the smallest contribution [3,4,5]. Not only in the central ad southern study area, but also in the southwestern depression of the Tarim Basin, the source of oil is still uncertain. In April 2010, Well Kedong-1 produced high-yield industrial oil and gas flows. This represents a new condensate gas reservoir following the Kekeya field [6,7]. Consequently, the debate surrounding the origin of oil in the southwest depression shifted from a long-standing dispute between the Carboniferous and Jurassic periods to the significance of the Permian oil source [8,9,10,11]. In 2023, the Well Qiatan-1 exploration demonstrated considerable industrial production capacity for natural gas, with an estimated natural gas resource of 350 × 108 m3 [12]. Organic geochemical studies have concluded that the hydrocarbons in question originated from the marine mud hydrocarbon source rock of the P1-2q Formation in the deeper part of the lower plate of the fracture [13].
The organic matter sedimentary environment and hydrocarbon source rock analysis are crucial topics in petroleum geology. Through geochemical methods such as Rock-Eval pyrolysis and biomarker analysis, the genesis, types, and potential of hydrocarbons in sedimentary basins are studied [14,15,16,17]. Field exploration of outcrop profiles provides data on lithological and sedimentary features. Pyrolysis, TOC, and Ro can evaluate the abundance, type, maturity, and hydrocarbon generation potential of source rocks [18,19]. Biomarker data and spectral configurations can distinguish the sources and sedimentary environments of hydrocarbons in rock samples [20,21,22]. From the perspective of sedimentary background and lithofacies paleogeography, a relatively stable water environment is conducive to the formation of sedimentary environments that are favorable for the development of source rocks [23,24,25]. At present, some exploration wells in the mountain front zone have exhibited oil and gas indications, yet the proven oil and gas resources do not align with the predicted ones. This research focuses on the study of source rocks in the Permian Qipan Formation, which depends on the characterization of petroleum by Rock-Eval pyrolysis and gas chromatography/mass spectrometry (GC/MS). Combining field profiles with geochemical analysis helps establish the correlation between geochemical features and biomarkers found in hydrocarbon extracts from source rocks.

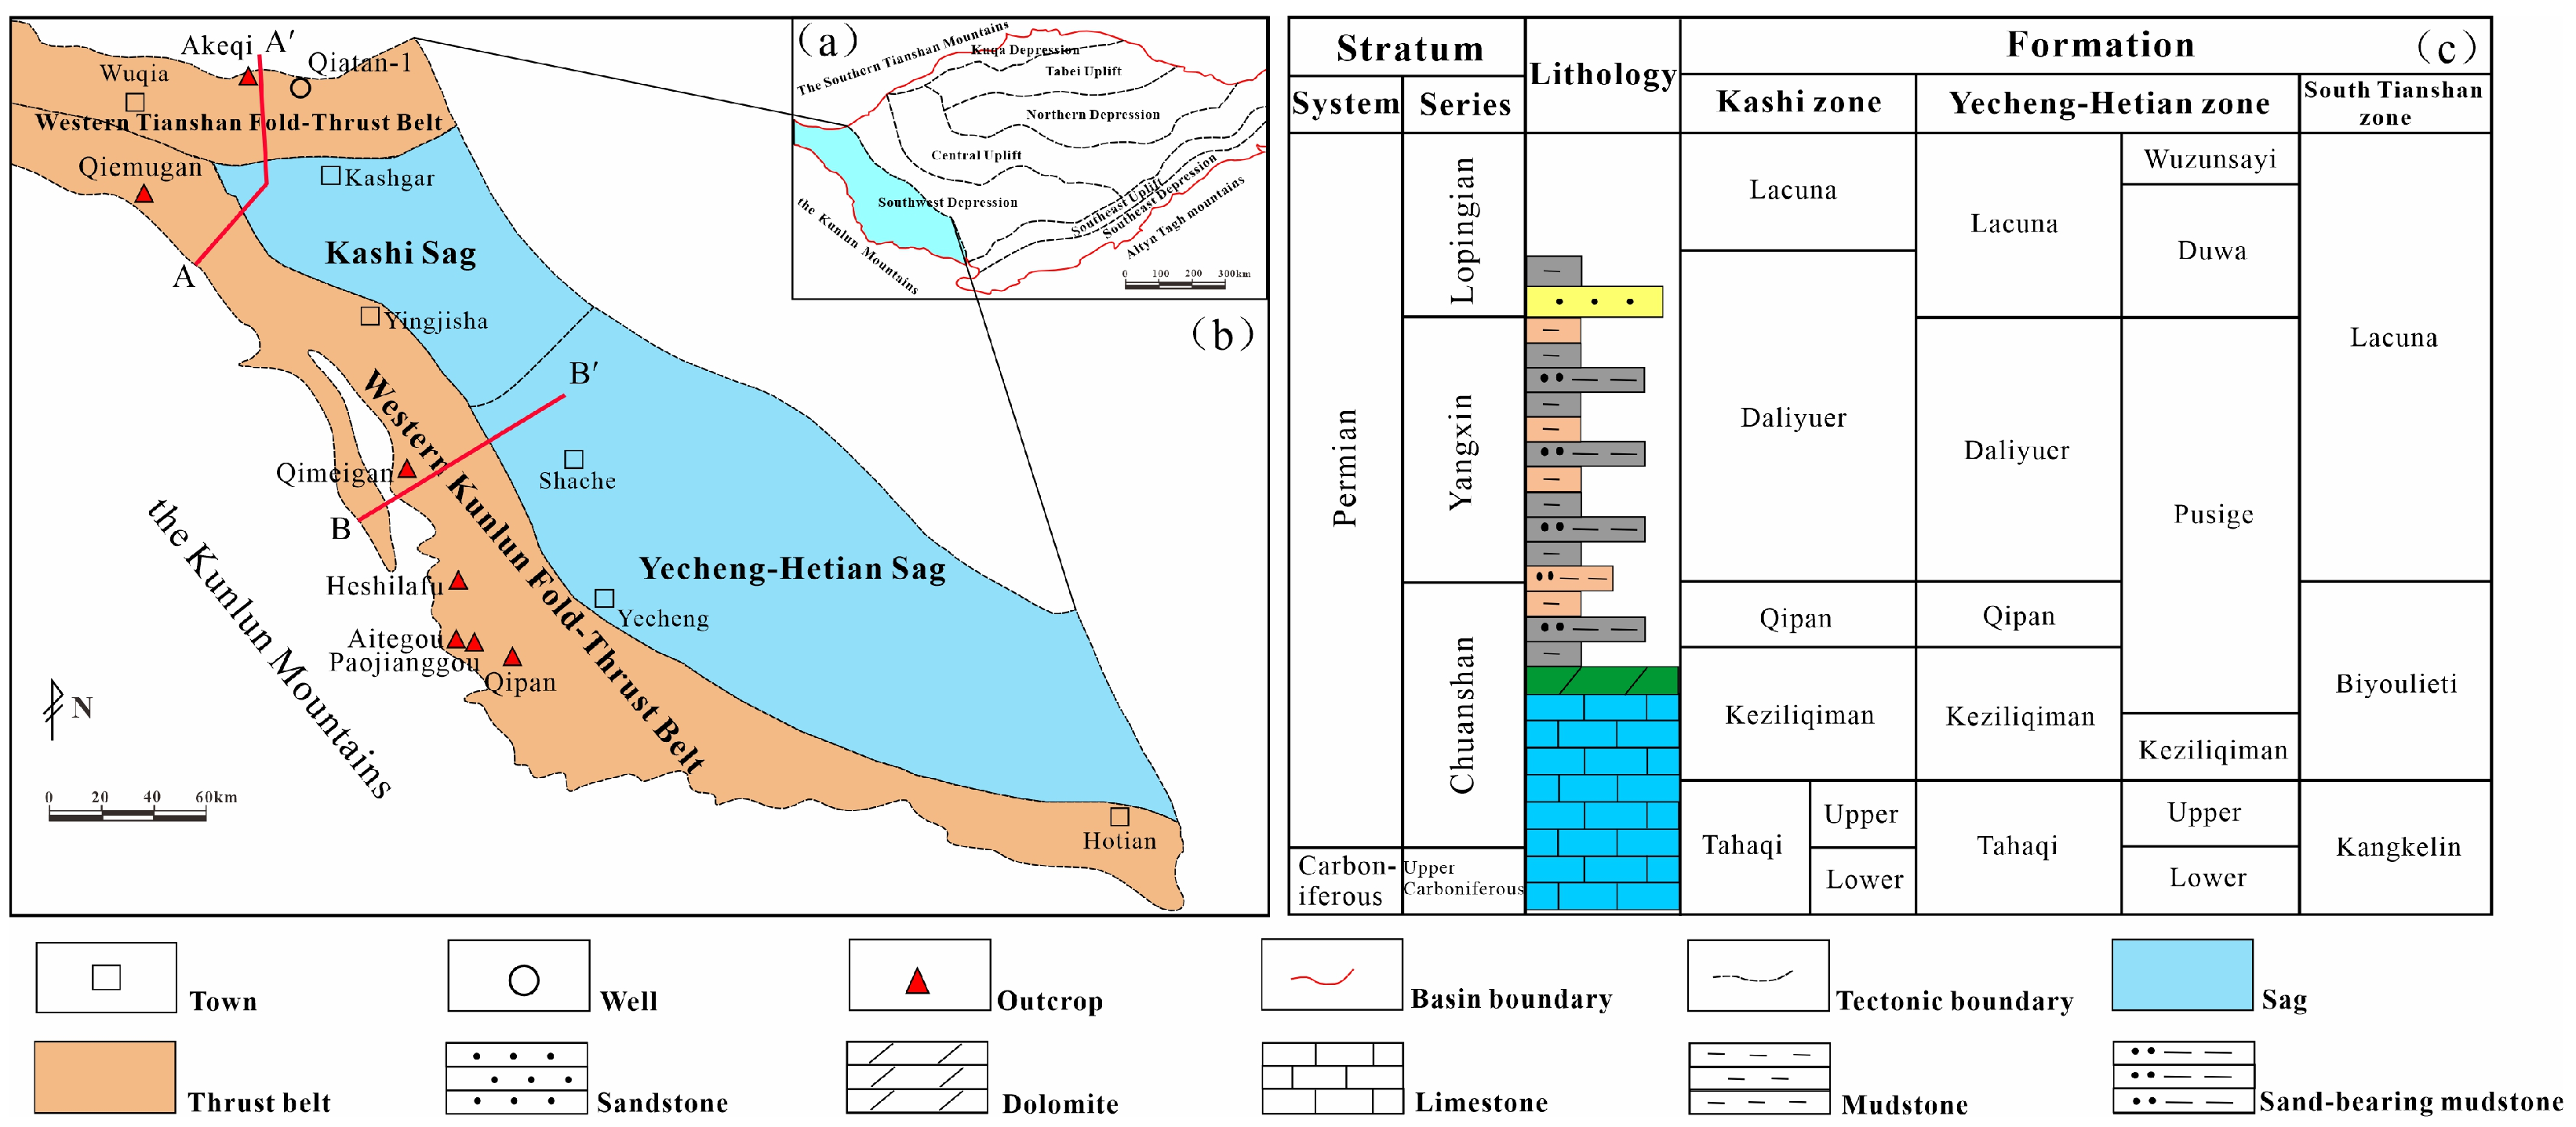
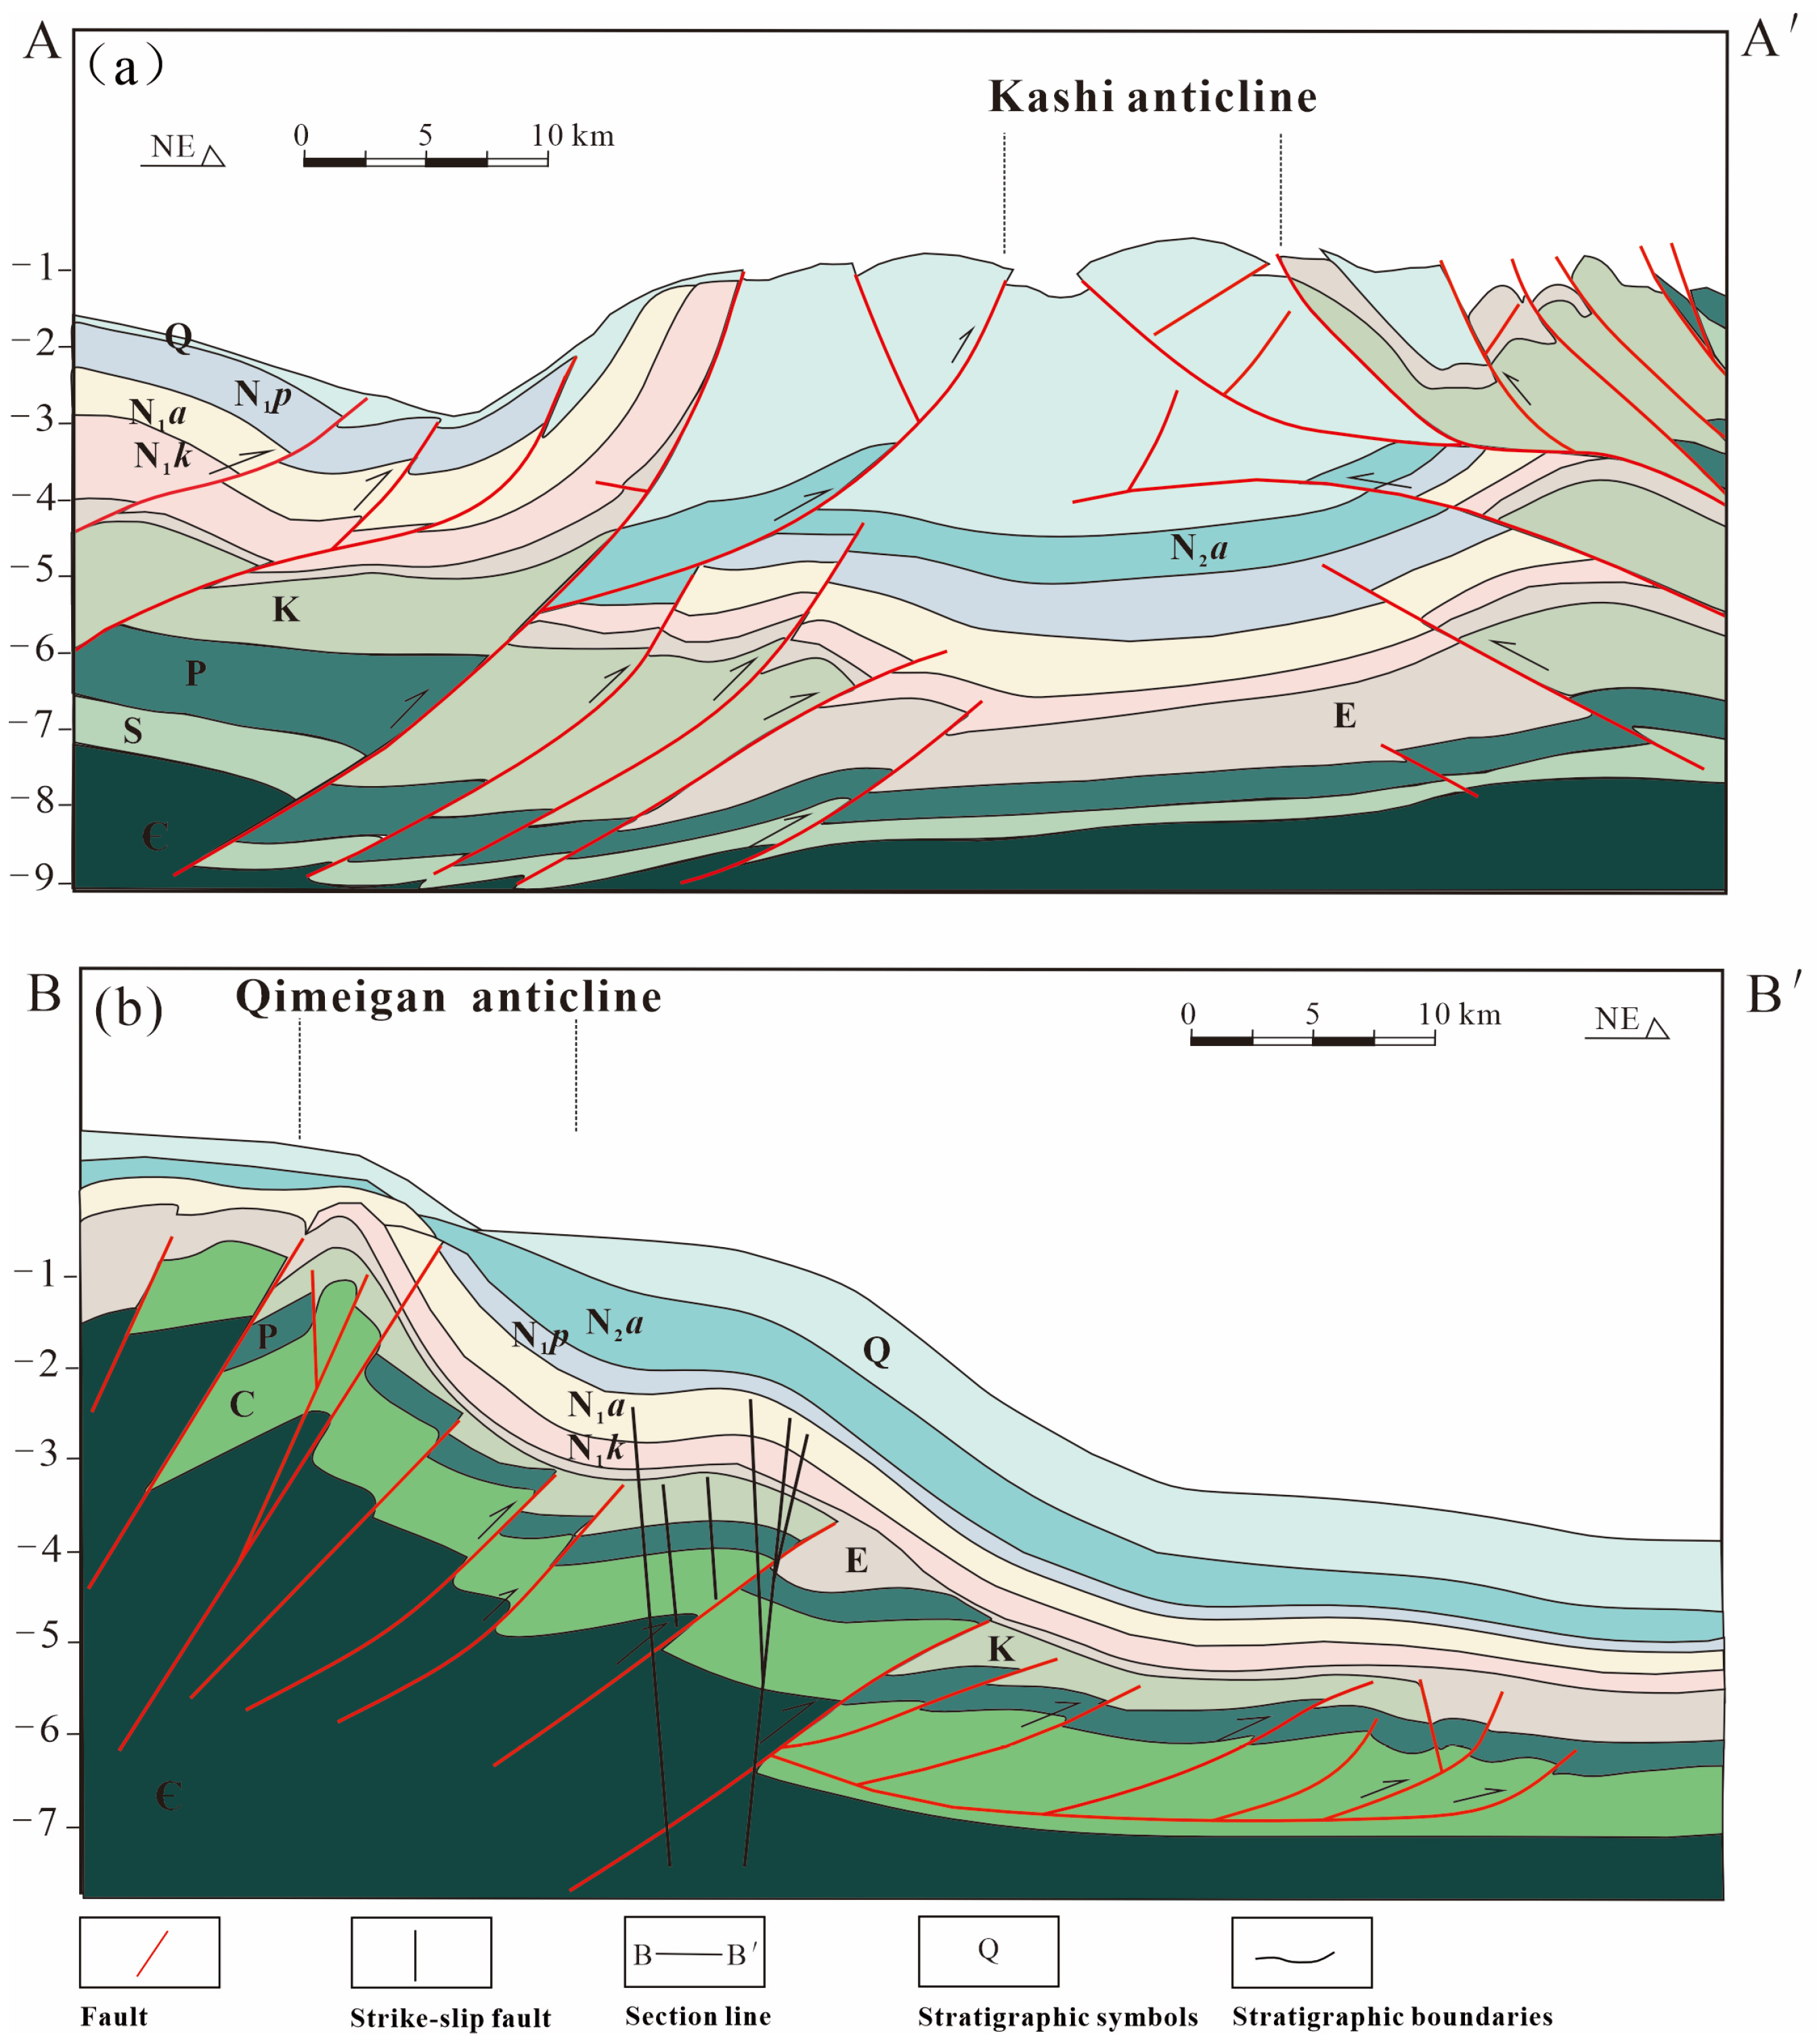
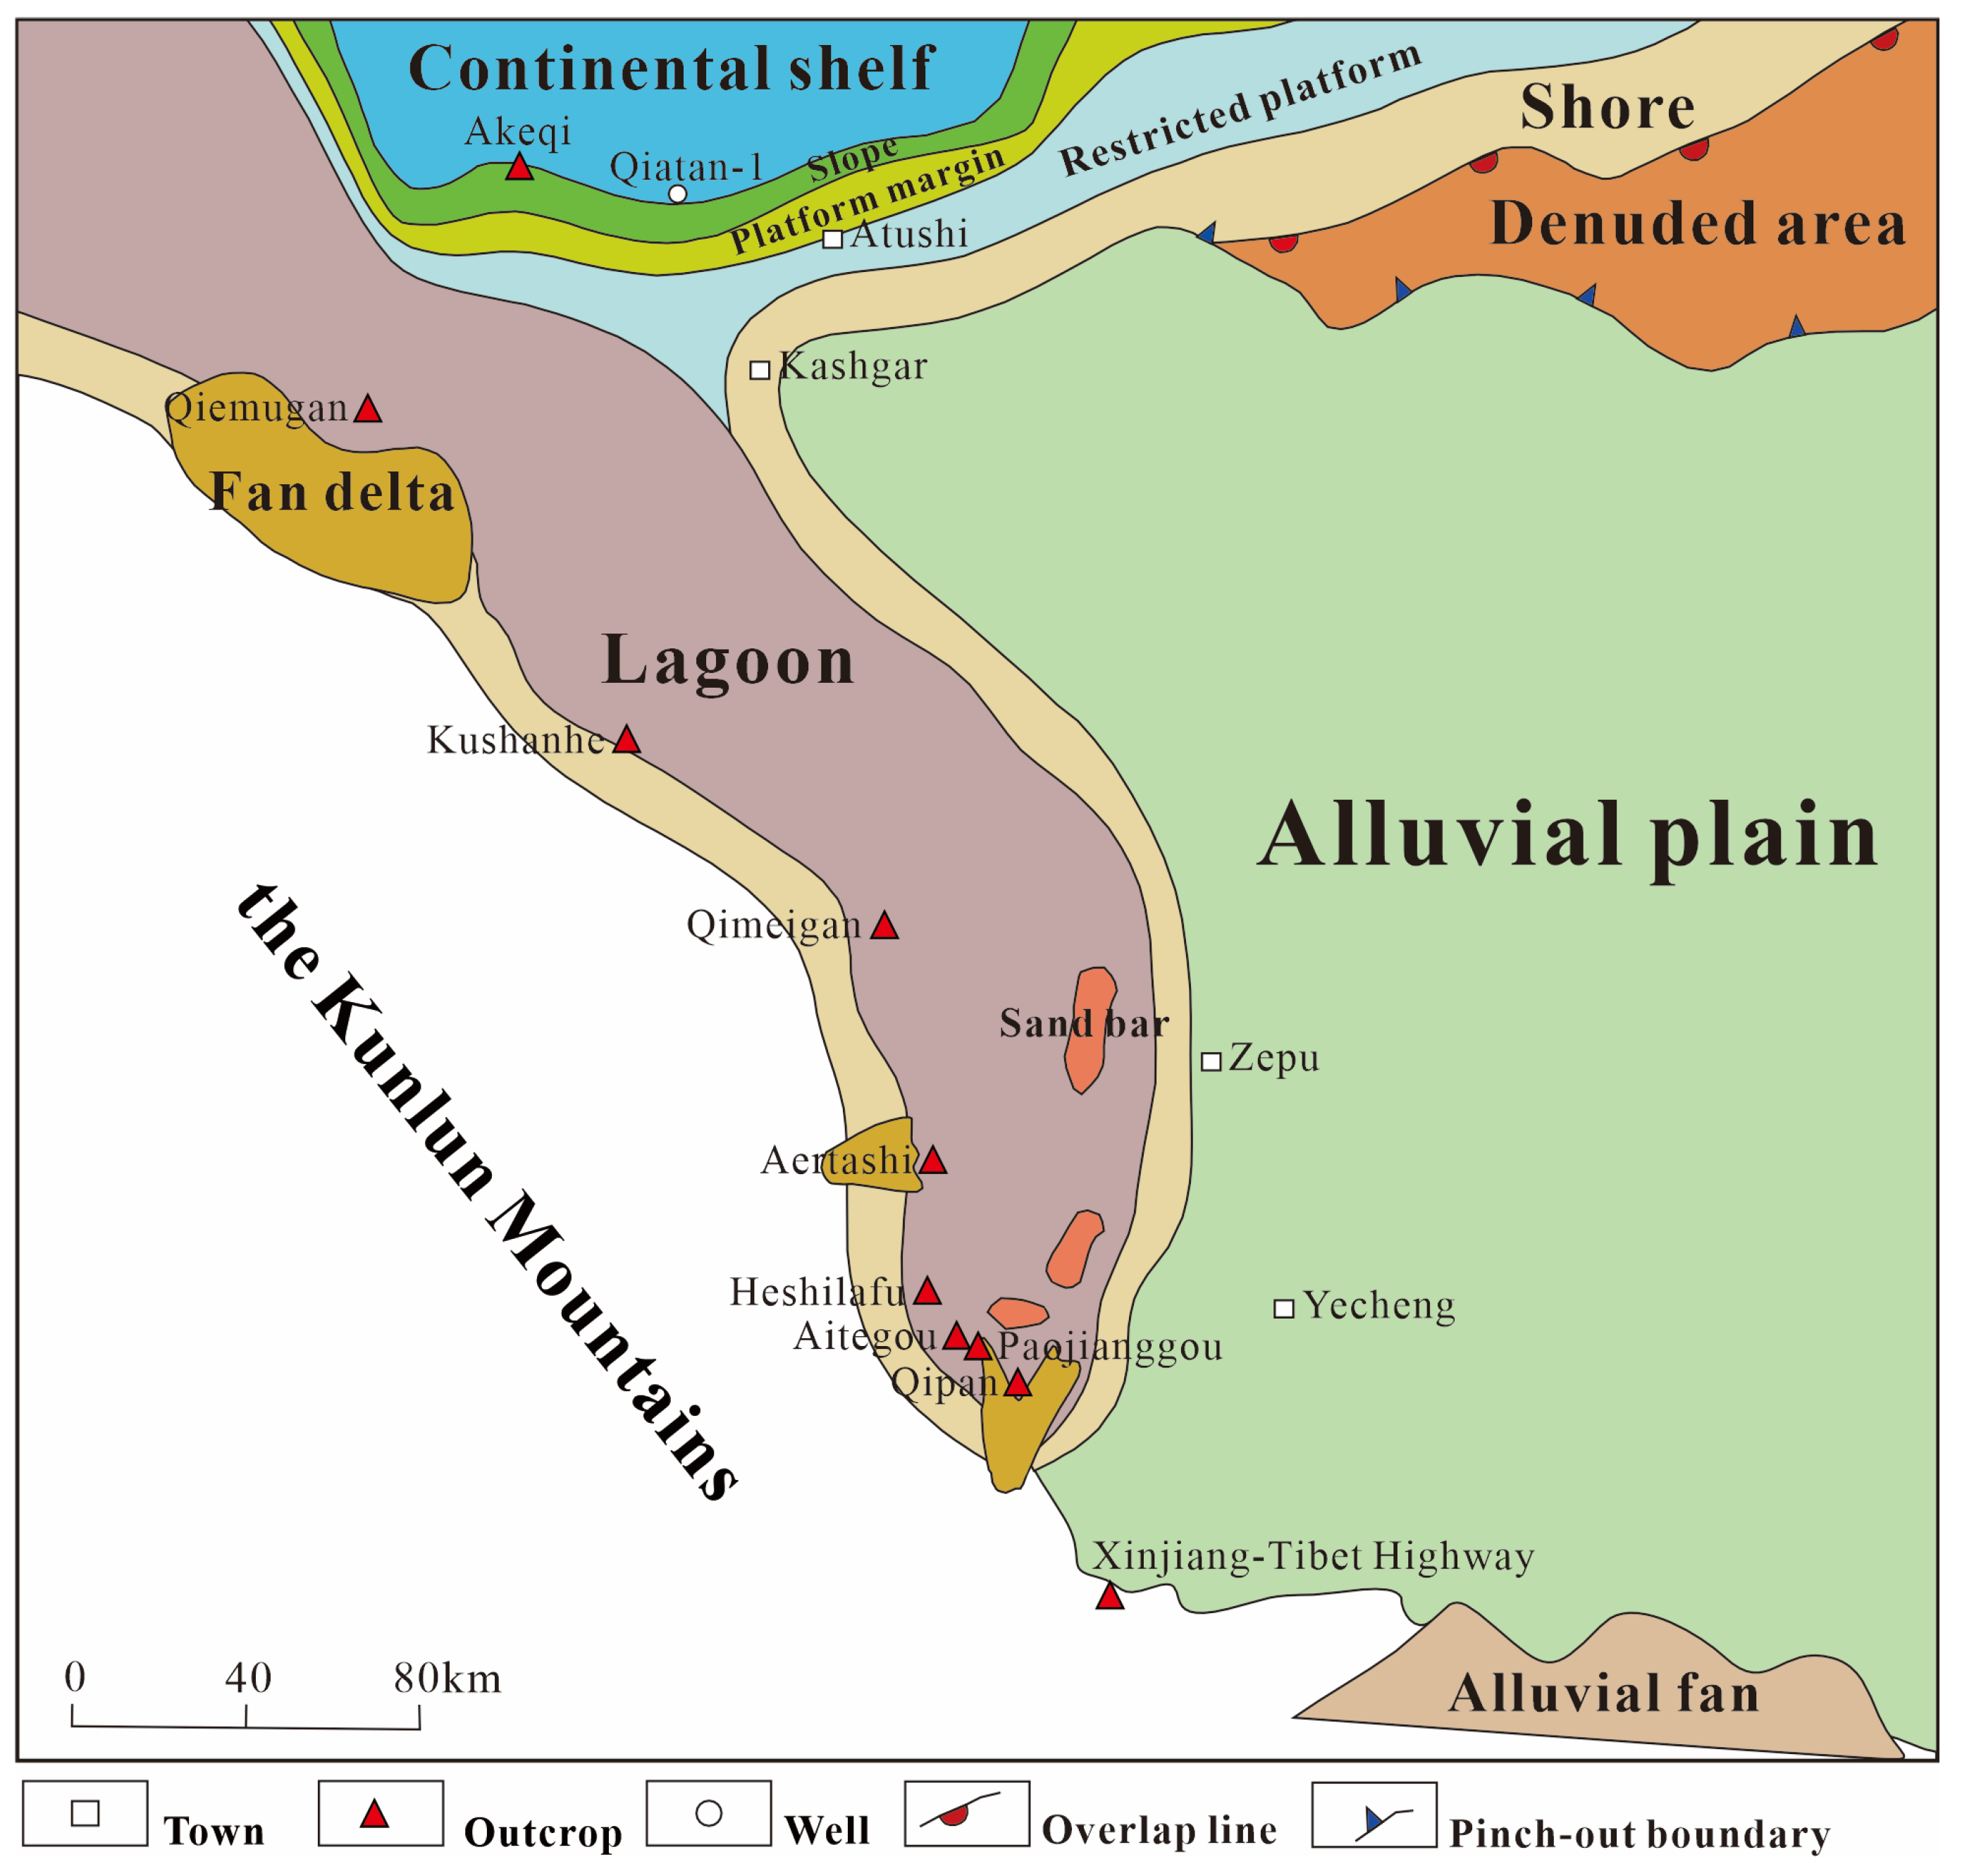
2. Geological Background

The study area was located in the periphery of the southwestern depression of the Tarim Basin, exhibiting a belt-shaped distribution along the Kunlun Mountains. The piedmont area of southwestern Tarim Basin has a complex structure, and the overall framework consists of two thrust belts and two sags, including the West Tianshan thrust belt, the West Kunlun thrust belt, the Kashi sag, and the Yecheng-Hetian sag (Figure 1). The terrain features of this region are high altitude in the west and low altitude in the east. The highest altitude in the southwest is 4621 m, and the altitude in the east is about 1500–1800 m. The southwest depression of Tarim Basin was formed on the Middle-Neoproterozoic basement. Under the influence of continental rifting, the South Tianshan Ocean basin in the Palaeo-Asian Ocean tectonic domain and the North Kunlun Ocean basin in the Palaeo-Tethyan Ocean tectonic domain were formed. Due to compression and subduction during the early Silurian period, the North Kunlun Ocean basin closed. During the Carboniferous-early Permian, a structural inversion occurred in the southern part of the depression. The subduction of the Old Tethys into the interior of the Tarim Plate resulted in a large amount of seawater invading the basin. During the late Permian to Triassic period, significant orogenic movements were observed in both the Western Kunlun and the Western Tianshan Mountains. These movements resulted in north–south compression, causing surface uplift and the absence of Triassic deposits (Figure 2). In summary, the premontane was formed by the combined influence of two major orogenic belts and the internal tectonic background of the basin. This process began in the middle and late Miocene and then proceeded through four evolutionary stages: the early Pliocene, the middle and late Pliocene, the early-middle early Pleistocene, and the late early Pleistocene [26].
The Permian strata span across the West Kunlun and South Tianshan orogenic belts, and are influenced by different tectonic domains on the southern and northern edges, resulting in different geological developments. The Permian strata in the piedmont area of the West Kunlun Mountains are mainly distributed in the central southern part of the study area, specifically in the Poti Lek region. There are variations in the stratigraphic nomenclature of different zones (Figure 1). The Kashi zone divides the Permian strata from old to new based on rock assemblages and biological characteristics: the lower Permian Keziliqiman Formation (P1kz), middle-lower Permian Qipan Formation (P1-2q), and middle-superior Permian Daliyuer Formation (P2-3d). The stratigraphic division of the western part of the Yecheng-Hetian zone is consistent with that of the Kashi zone. The Permian strata in the southern part of the Yecheng-Hetian zone from old to new are as follows: the lower Permian Keziliqiman Formation (P1kz), middle-lower Permian Pusige Formation (P2p), and upper Permian Duwa Formation (P3d). The upper Permian strata are absent in the piedmont area of southern Tianshan. The remaining eroded strata of the lower Permian are divided from old to new as follows: the Kangkelin Formation (C2-P1k) and the Biyoulieti group (P1by). In the Wensu County area of the Keping uplift, the C2-P1k gives rise to terrestrial alluvial fan conglomerate deposits, comprising graywacke, sandstone, and a minor quantity of siliceous rock, feldspathic gneiss, and granite [27]. The rock assemblage of P1by in the Akeqi section is composed of maroon or gray green siltstone, mudstone, and graystone. In 2017, BGP Inc., China National Petroleum Corporation delineated the depth of the bottom boundary of P1by as 4209.5 m through the drilling data of the Well Ake-1. This can be correlated with the stratigraphy of P1kz and P1-2q of the Western Kunlun Mountain thrust belt.

3. Materials and Methods

The study was conducted at a site where P1-2q was extensively exposed (Figure 3). Detailed sedimentological studies have been conducted through fieldwork in the piedmont southwestern Tarim Basin. Here, the thickness and lithology of the Qimeigan and Qiemugan outcrop sections were observed, and 167 samples of source rock from P1-2q were collected. Figure 1 shows the specific sampling locations. The core of the Well Qiatan-1 was observed, and 176 source rock samples and experimental data were collected at the Development Research Institute of PetroChina Tarim Oilfield Company. Furthermore, data and information from previous studies were collated [22,28,29].
A total of 74 samples from P1-2q sediments samples were used for TOC and pyrolysis analysis. These samples included 45 mudstone samples from the Qimeigan section, 29 mudstone samples from the Qiemugan section. Some samples were additionally analyzed by vitrinite reflectance, gas chromatography–mass spectrometry, and element analysis. The abundance, type, and maturity of organic matter from P1-2q were analyzed and evaluated in order to assess the potential of P1-2q mudstone as a hydrocarbon source rock. The experiment was conducted at the College of Resources and Environment, Yangtze University, and the Research Institute of Exploration and Development, PetroChina Tarim Oilfield Company.

3.1. TOC and Pyrolysis Analysis

The sample of removed carbonate rock was repeatedly cleaned with deionized water until the hydrochloric acid was removed. Prior to analysis, the washed and dried samples were crushed to a particle size of less than 200 mesh, with each powder sample comprising 100 mg [30,31]. The TOC contents were conducted using the LECO CS-230 carbon-sulfur analyzer (LECO Corporation, St. Joseph, MI, USA). The Rock-Eval analysis was performed using OG-2000V (Horiba, Kyoto, Japan), which is an oil and gas display evaluator. This enabled the identification of the following parameters: total organic carbon (TOC), thermal maturity (Tmax), free hydrocarbon (S1), thermal pyrolysis hydrocarbon (S2), production index (PI), and hydrogen index (HI).

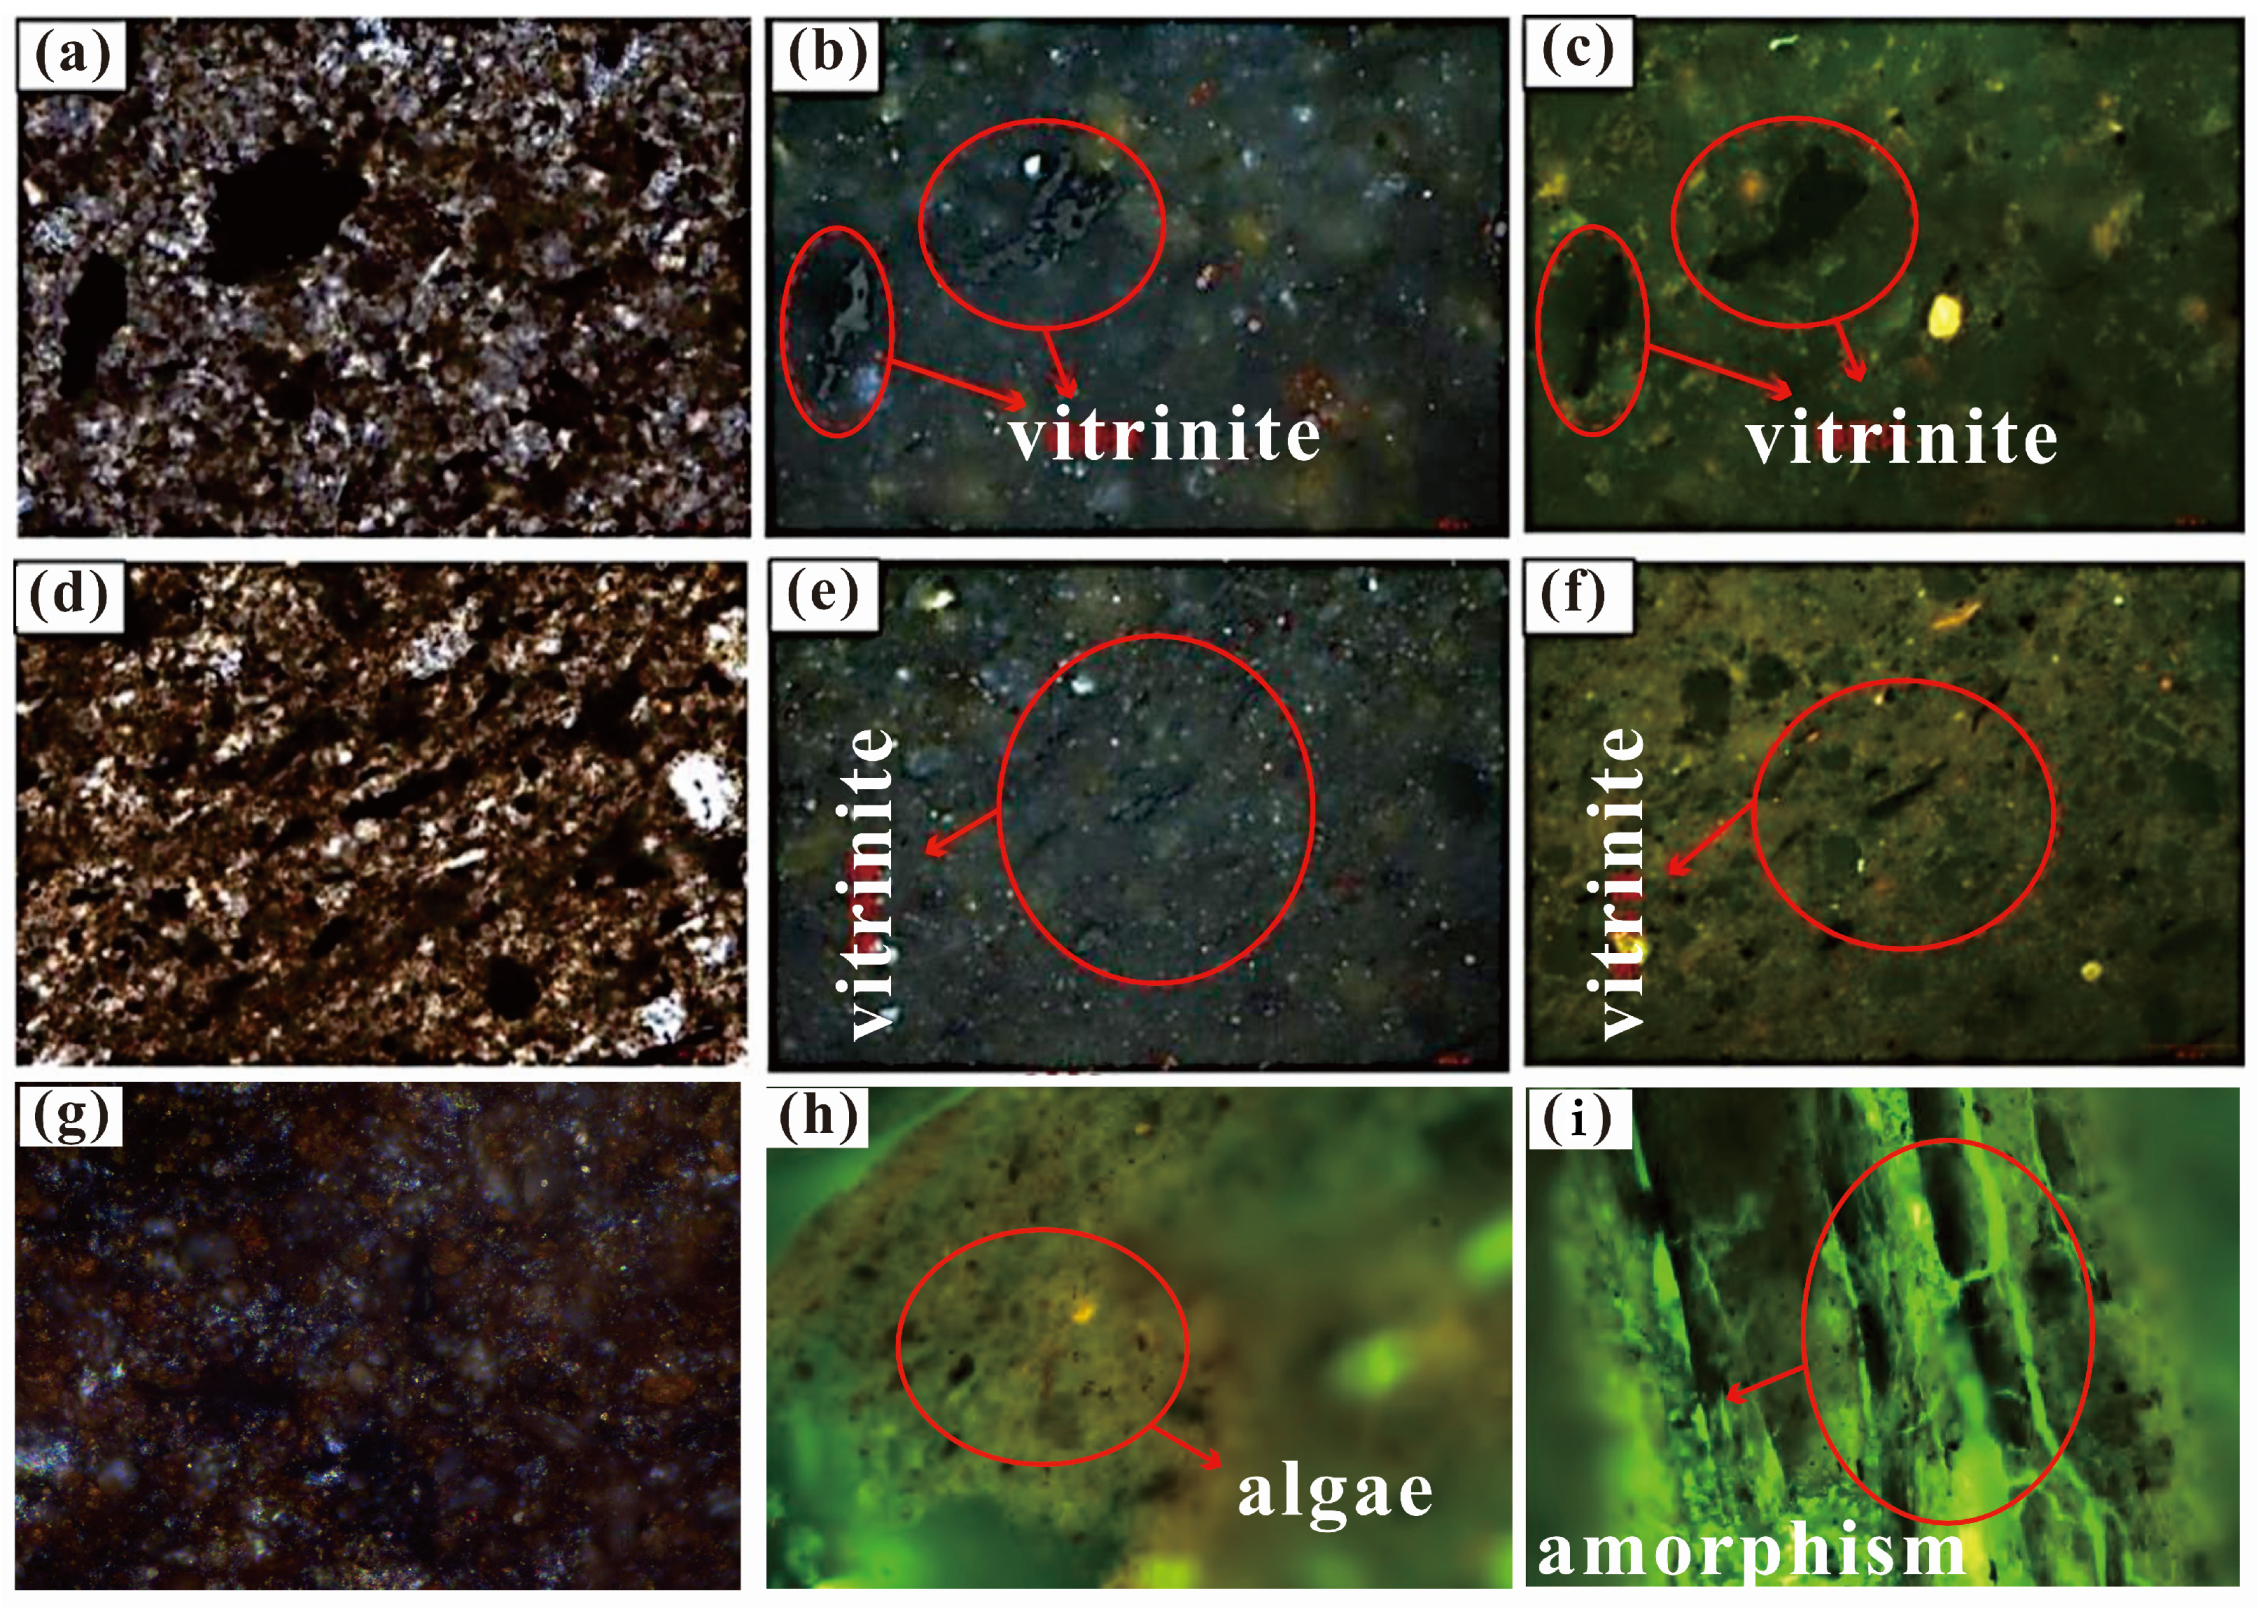
3.2. Vitrinite Reflectance and Reflected Light Microscopy

Vitrinite reflectance is a measure of the degree of light reflection of the polished surface of vitrinite, which has been demonstrated to have a strong correlation with maturity [32,33,34,35]. The rock sample had to be encased in epoxy, dried, and polished until the surface was smooth, forming a complete rock lithograph. The light sheets were quantified utilizing an MF43 micro fluorescence spectrometer (Horiba, Kyoto, Japan), which was calibrated in accordance with the Chinese petroleum industry standard process (SY/T 5124-2012) [36]. Vitrinite reflectance values (Ro) were quantified by measuring the difference between the light sheet and the standard sample on the gray scale. The optical flakes were employed to identify the minerals and organic matter utilizing transmission, polarization, reflection, and fluorescence under a transreflective polarized fluorescence microscope of the model MF43 (Horiba, Kyoto, Japan). The identification following the SY/T 6414-2014 [37].

3.3. Main and Trace Element Analysis

The samples were finely crushed to a particle size of less than 100 μm and baked in an oven at 105 °C for a period of three hours. Following this, the samples were cooled to room temperature in a desiccator. Among these, trace elements were quantified by means of an ELEMENT XR plasma-mass spectrometer (Thermo Fisher Scientific, Waltham, MA, USA), in accordance with the IC-PMS-1000IV (Dionex, Waltham, MA, USA) method GB/T 14506.30-2010 [38]. The major elements were determined by an AxiosmAX X-ray fluorescence spectrometer (Malvern Panalytical, Malvern, UK) according to the fluorescence intensity method GB/T 14506.28-2010 [39].

3.4. Gas Chromatography–Mass Spectroscopy (GC–MS)

The analysis of the saturated hydrocarbons was conducted using gas chromatography–mass spectrometry (GC–MS) with an Agilent 7890B-5977A GC–MS instrument (Agilent Technologies, Santa Clara, CA, USA). The samples were pulverized and fully reacted with dichloromethane in a Soxhlet apparatus (Thermo Fisher, Santa Clara, CA, USA). The organic solution was extracted, and the soluble organic matter was separated. The oven temperature program commenced at 60 °C and gradually increased to 290 °C at a steady rate of 3 °C per minute.
Biomarkers are defined as ‘molecular fossils’ which retain the majority of the original carbon skeleton of their original form [35,40]. The biomarker data from the samples of the Qimeigan section and Qiemugan section were used to identify the paleodepositional environment of P1-2q hydrocarbon source rocks. Biomarkers are primarily composed of hydrocarbons and can be clearly identified in extracts of oil, rocks, or sediments. They play a pivotal role in the study of the source and sedimentary environment of organic matter [41].

4. Results

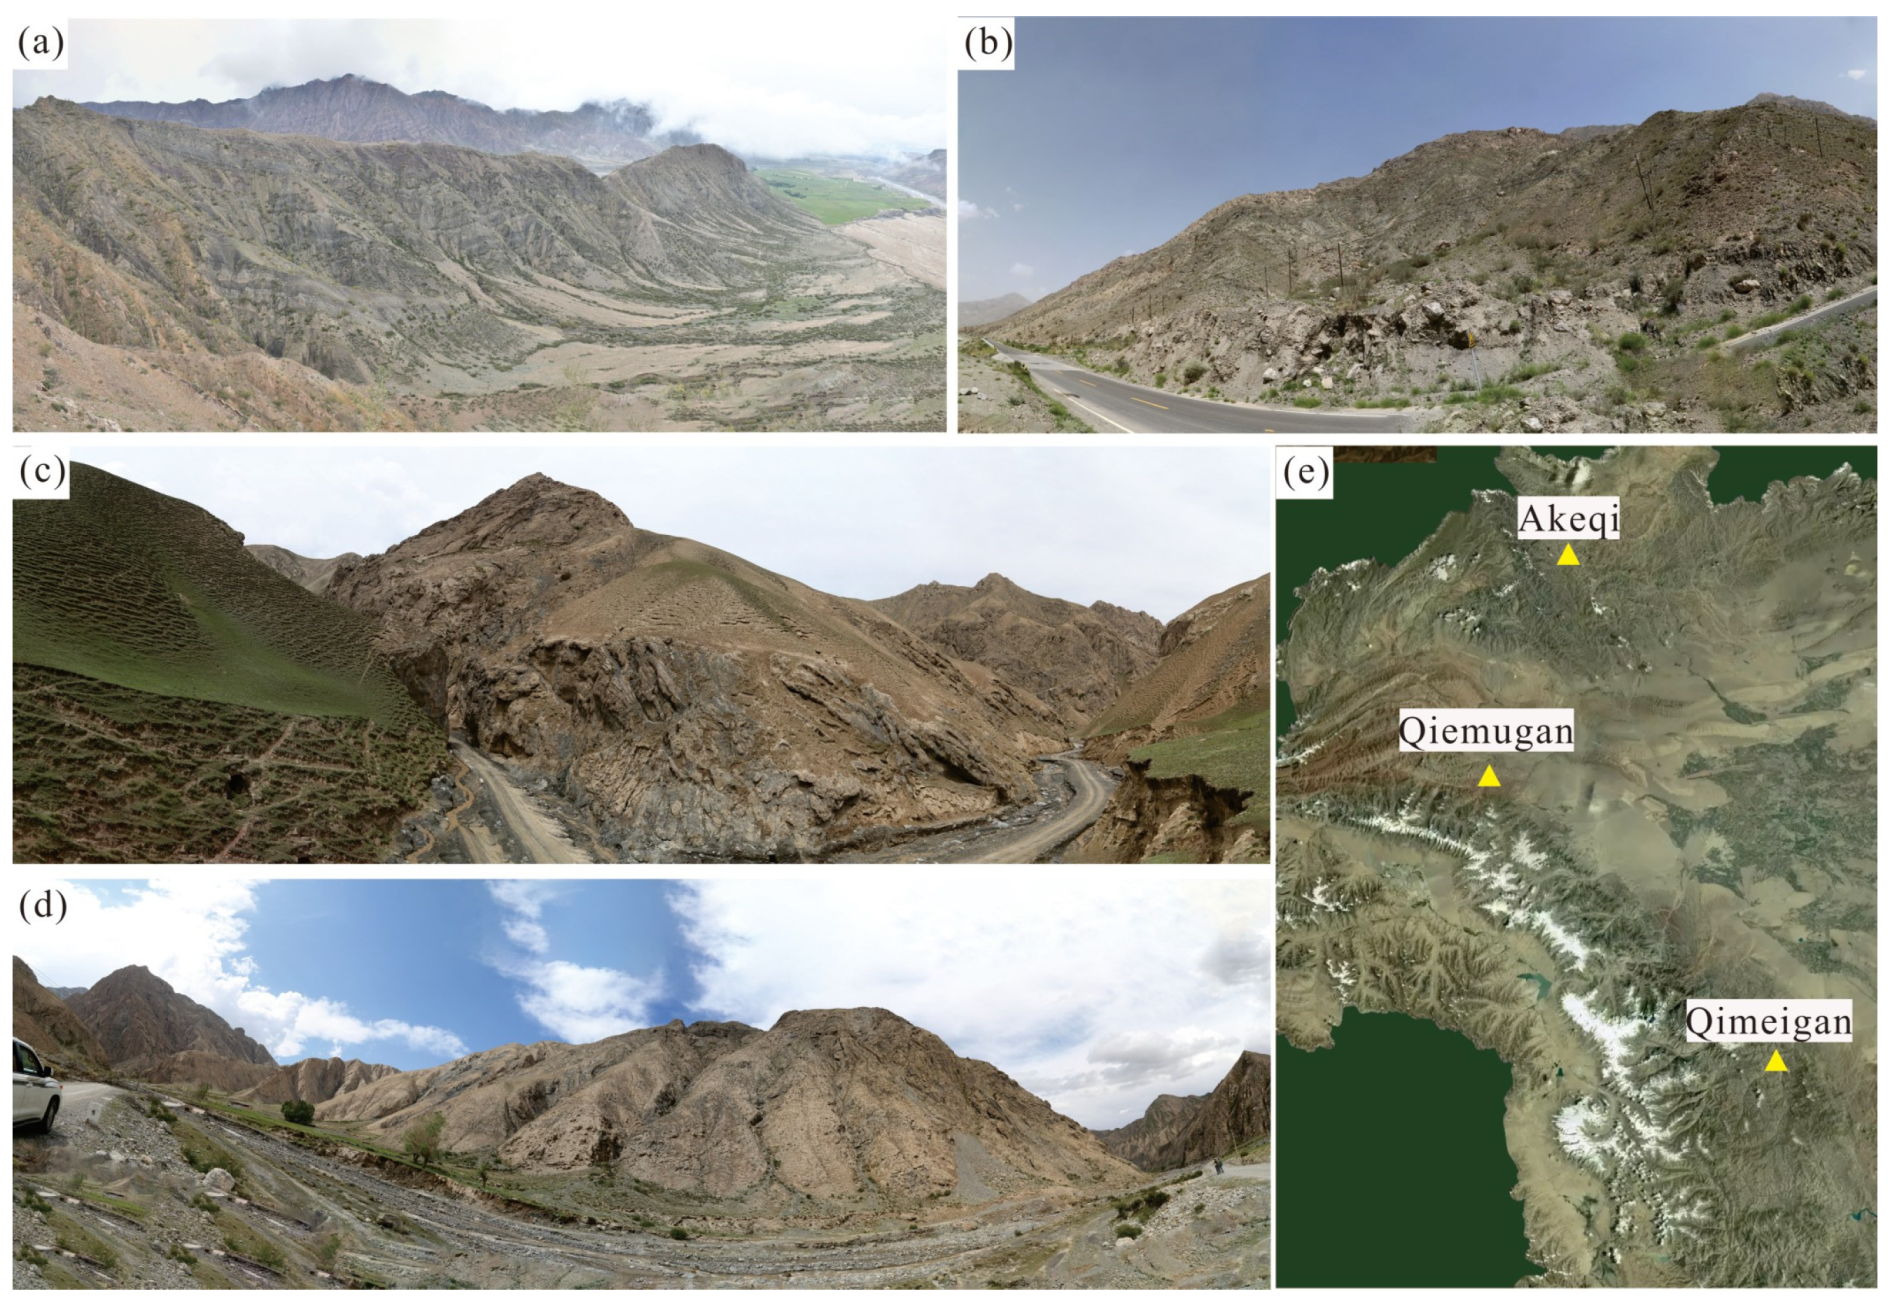
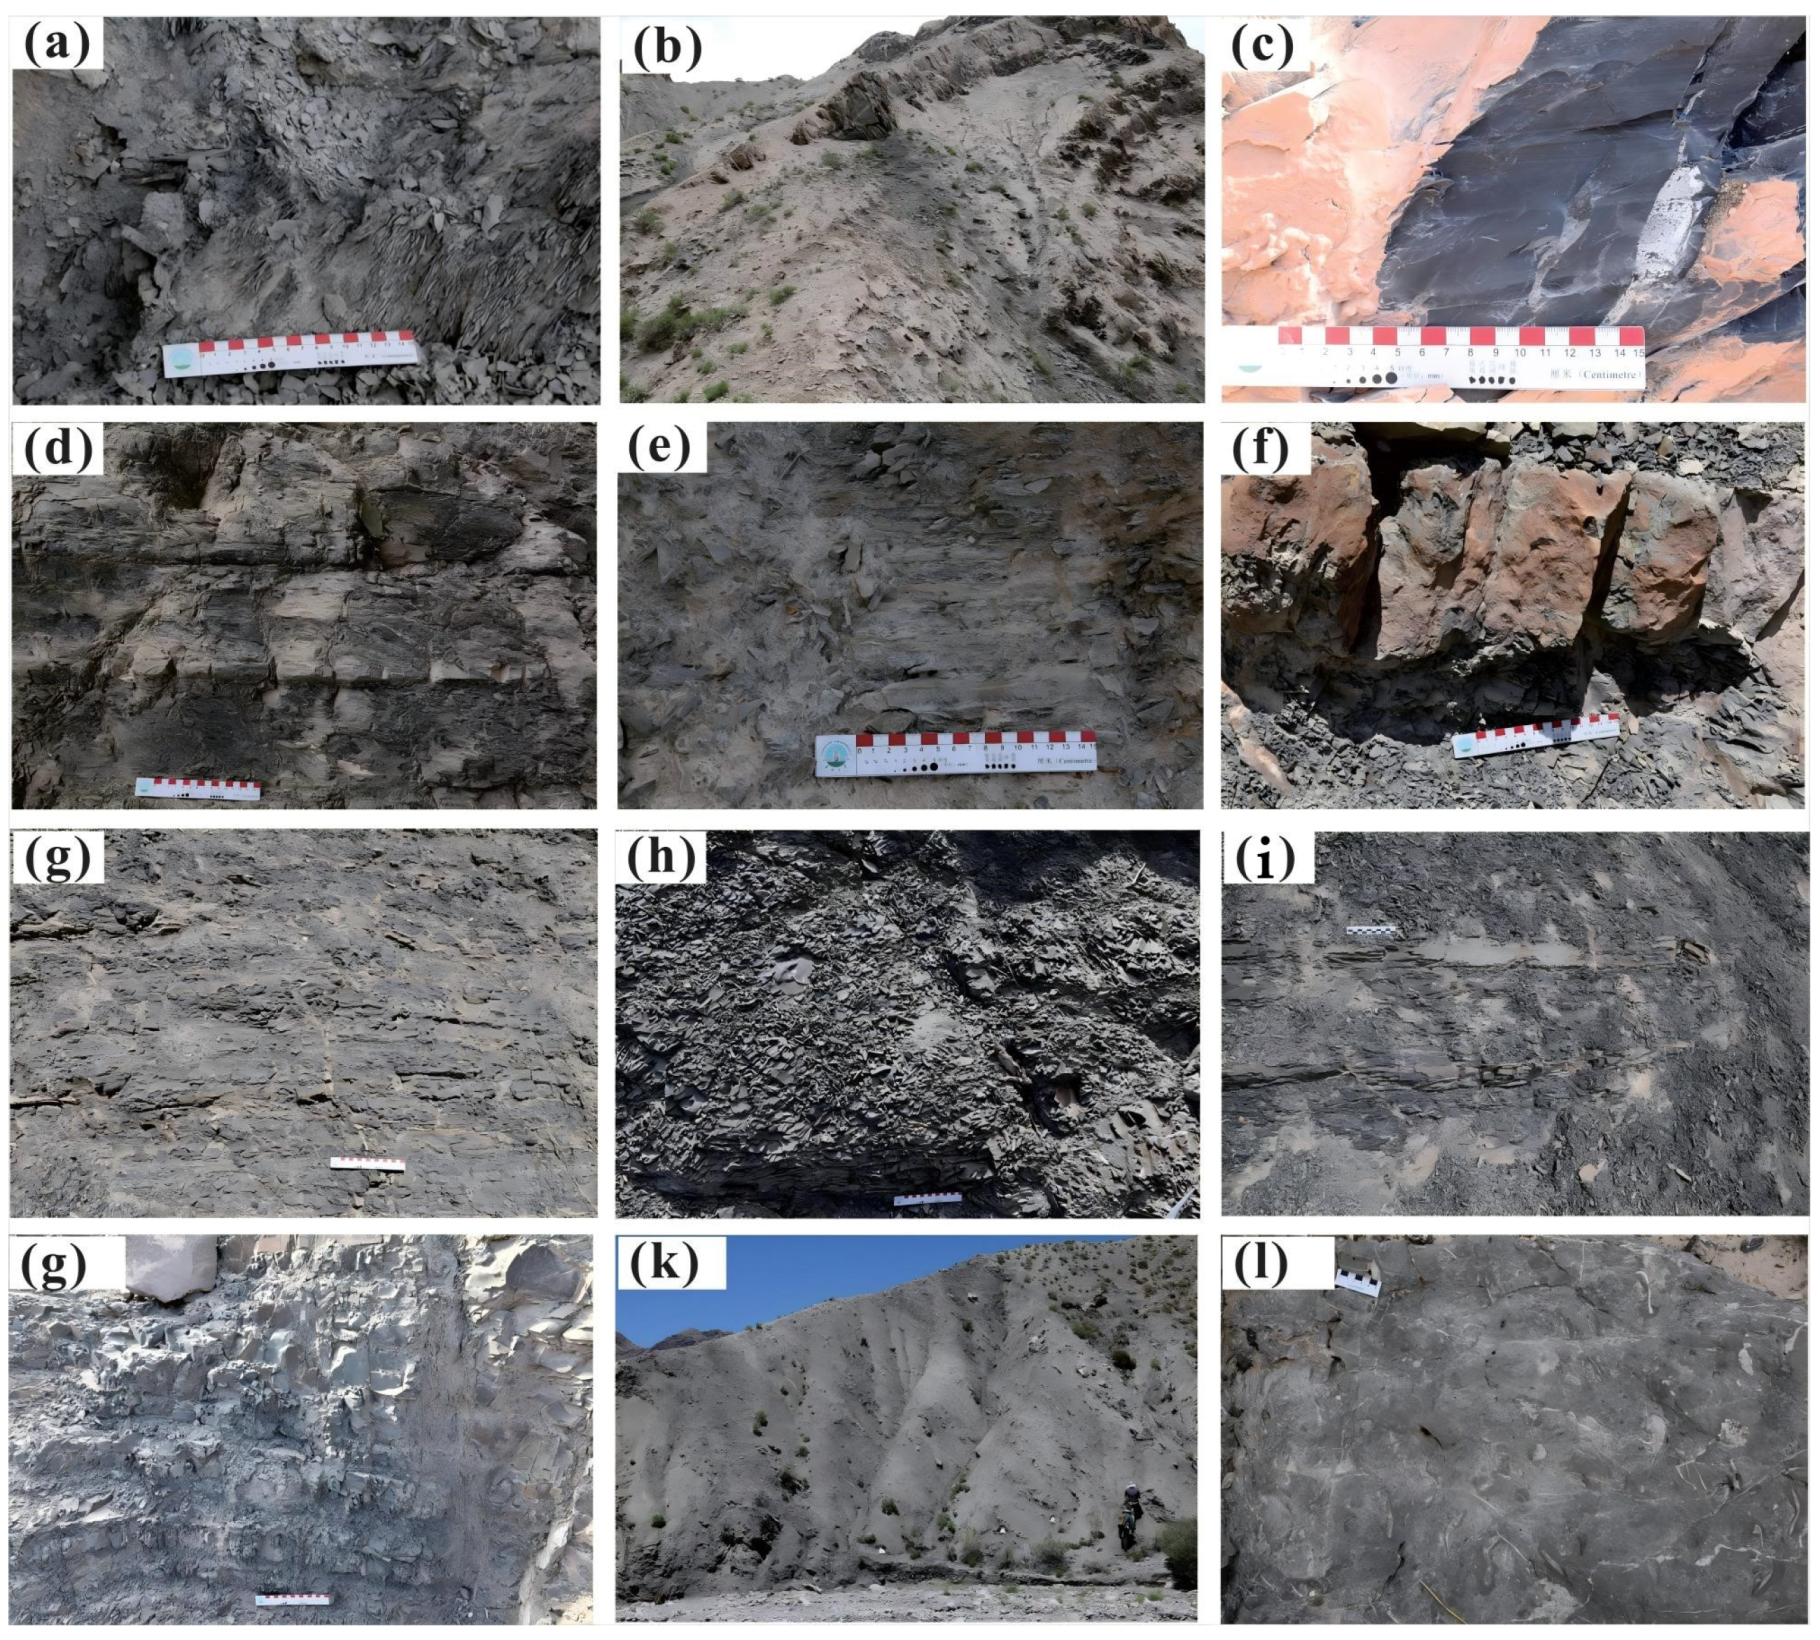
4.1. Petrological Characteristics by Field Observations

4.1.1. Qimeigan Outcrop Section

The Qimeigan section is situated approximately 100 km southeast of Yingjisha County. The stratigraphic thickness of P1-2q is estimated to be approximately 987.35 m. The formation can be divided into four members according to the characteristics of its lithological assemblage (Figure 4).
(1)
The thickness of the first member is 200.24 m, and the lithology is dominated by frequent unequal thick interbedding of dark gray mudstone, dark gray carbonate rock, and gray green sandstone (Figure 5a). In the middle of the section, there is dark gray or gray black mudstone, which is a great hydrocarbon source rock (Figure 5b).
(2)
The second member is 191.48 m thick and is dominated by limestone, with a small amount of mudstone. The limestones are primarily composed of micrite bioclastic limestone and mudstone limestone (Figure 5c). The limestones are dark in color, and parallel-bedding or cross-bedding is observed in the interior. This member can be attributed to the process of normal marine sedimentation. The limestones with a high mudstone content are indicative of the beach-interacting sea sedimentary environment, whereas the limestone dominated by sparry calcite cementation is representative of various open platform sedimentation, which is predominantly biodetritus beach.
(3)
The stratigraphy of the third member is 157.39 m thick, and the lithology is mainly mudstone interbedded with thinly bedded sandstone. The sandstone is mostly argillaceous siltstone (Figure 5d). Three sets of basalts, exhibiting a grayish green coloration, are exposed at the bottom and top of the member, reaching a thickness of up to 61.58 m. The mudstones are dark gray in color and thinly bedded, and are interpreted as continental shelf deposit. The basalt was formed by a submarine volcanic eruption, which is an effusion facies. The size of the volcanic breccia is mostly between 2 and 7 cm, with a maximum of 20 cm.
(4)
The fourth member is 438.2 m thick and is dominated by clastic sedimentary rocks, with a small amount of carbonate rocks. Mudstone is gray in color (Figure 5e), while sandstone is grayish green, comprising fine-grained debris sandstone and limy siltstone. The material in question can be attributed to the deltaic environment, where it forms a set of lithological assemblages of delta front and prodelta interactive deposition.
The thickness of the muddy hydrocarbon source rock in the Qimeigan section is approximately 401 m, and the lithology is predominantly dark mudstone and gray black calcareous mudstone. The sedimentary environment is predominantly marine sedimentation, including a portion of transition facies of sea continent, which forms a delta–open platform–continental shelf depositional combination (Figure 6).

4.1.2. Qiemugan Outcrop Section

The stratigraphic thickness of P1-2q in this section is approximately 610.57 m, with a minor presence of carbonate rocks at the base and a gradual transition upwards into braided river delta sedimentation, characterized by frequent unequal thick interbedding of sandstone and mudstone. These can be divided into four distinct lithological members (Figure 7).
(1)
The thickness of the first member is 35.92 m, with the bottom comprising mudstone limestone (Figure 5f). The formation comprises some dark gray calcareous mudstones, which contain sandstone bands (Figure 5g). The micrite structure is composed primarily of calcite, with a minor component of bioclastic fragments. The upper part of the member comprises sandstone and mudstone, which were deposited by the front edge of the braided river delta front and underwater distributary channel.
(2)
The second member is 40.52 m thick, with the lower part comprising gray black carbonaceous mudstone mingled with gray fine sandstone. This is deposited in the former prodelta. The middle part is a combination of yellow green siltstone, gray green argillaceous siltstone, and gray green fine sandstone (Figure 5h), with reverse grain sequence, which is deposited in braided river delta front and underwater distributary channel. The upper part of the lithological assemblage is essentially identical to the lower part.
(3)
The thickness of the third stratigraphic member is 91.05 m. The upper part of the lithographic assembly is essentially the same as the lower part. In the middle part of the member, there is a layer of yellow green fine sandstone, which transforms upwards to dark gray mudstone (Figure 5i) interbedded with sandstone and argillaceous siltstone (Figure 5j). In the upper part, there is a thin layer of dark mudstone interbedded with argillaceous siltstone, and a set of greenish gray fine sandstone is developed about 50 m away from the top of this section, in a positive grained sequence. The entire member can be attributed to the sedimentary system of the front edge of braided river delta front and prodelta. The braided river delta front is characterized by the deposition of mudstone, while prodelta is marked by the deposition of sandstone.
(4)
The fourth member is 129.84 m thick and is dominated by clastic rocks, including gray green fine sandstone, gravel-bearing coarse sandstone, and purplish red fine sandstone. These are interspersed with light gray thinly medium sandstone. The formation of large cross-bedded and parallel-bedded rocks is observed. The clastic rock was dominated by sandstone, conglomerate, and gravel-bearing coarse sandstone, while the gravel component is dominated by volcanic rocks. The top of the rocks develops lacustrine carbonate rocks.
The thickness of the muddy hydrocarbon source rock in the Qiemugan section is approximately 63 m, and the lithology is predominantly black mudstone and bioclast calcareous mudstone. The sedimentary environment is characterized by transitional facies, with the transition from shelf to braided river delta front deposition (Figure 6).

4.1.3. Akeqi Outcrop Section

The Akeqi section is situated in Akeqi Village, Biaoertuokuoyi Township, Wuqia County. The exposed Permian strata of the profile are primarily of P1by, with a thickness of approximately 1947.67 m. The lithology is characterized by a gray purple conglomerate and gravelly bearing mudstone, with the upper part comprising gray, greenish gray, and dark gray mudstone (Figure 5k). The lithological characteristics and changes can be divided into three members. The third member can be correlated with the stratigraphy of P1-2q in the southwest depression, which is approximately 386.35 m thick. The main lithology is gray mudstone, with a minor component of gray bioclastic limestone (Figure 5l). The mudstone hydrocarbon source rock section is approximately 300 m thick, and the depositional environment is characterized by marine shelf sedimentary (Figure 8).

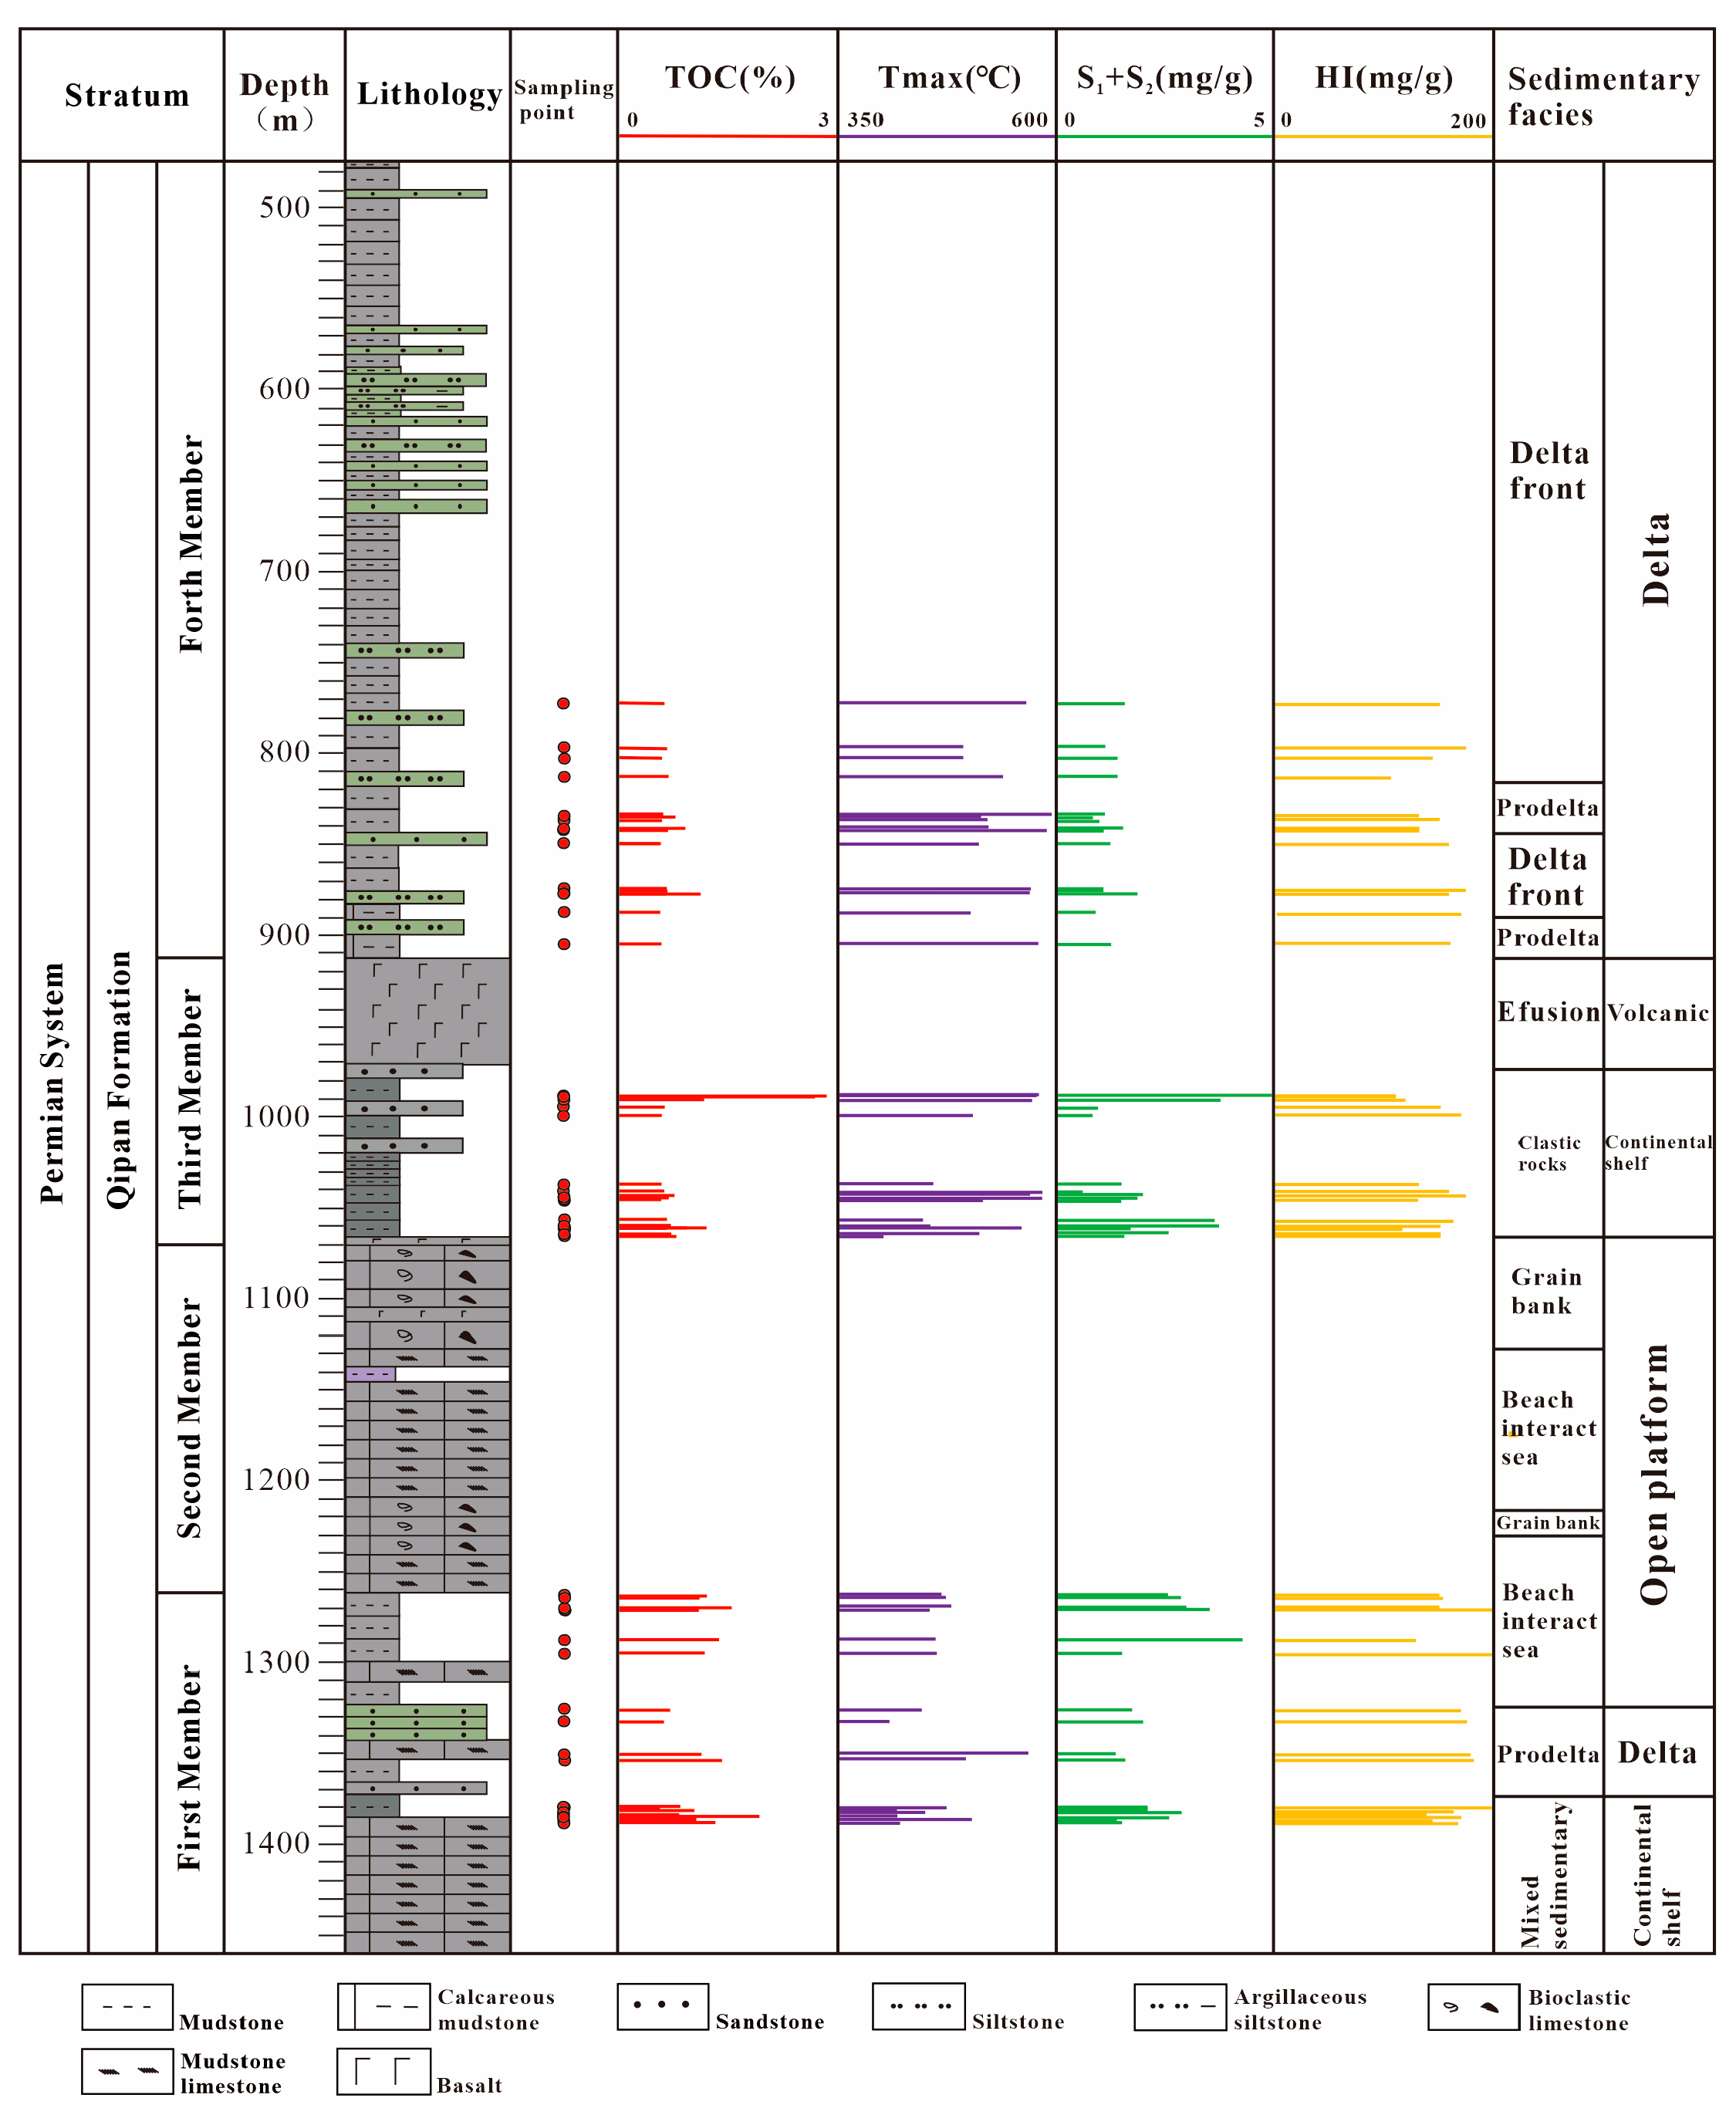
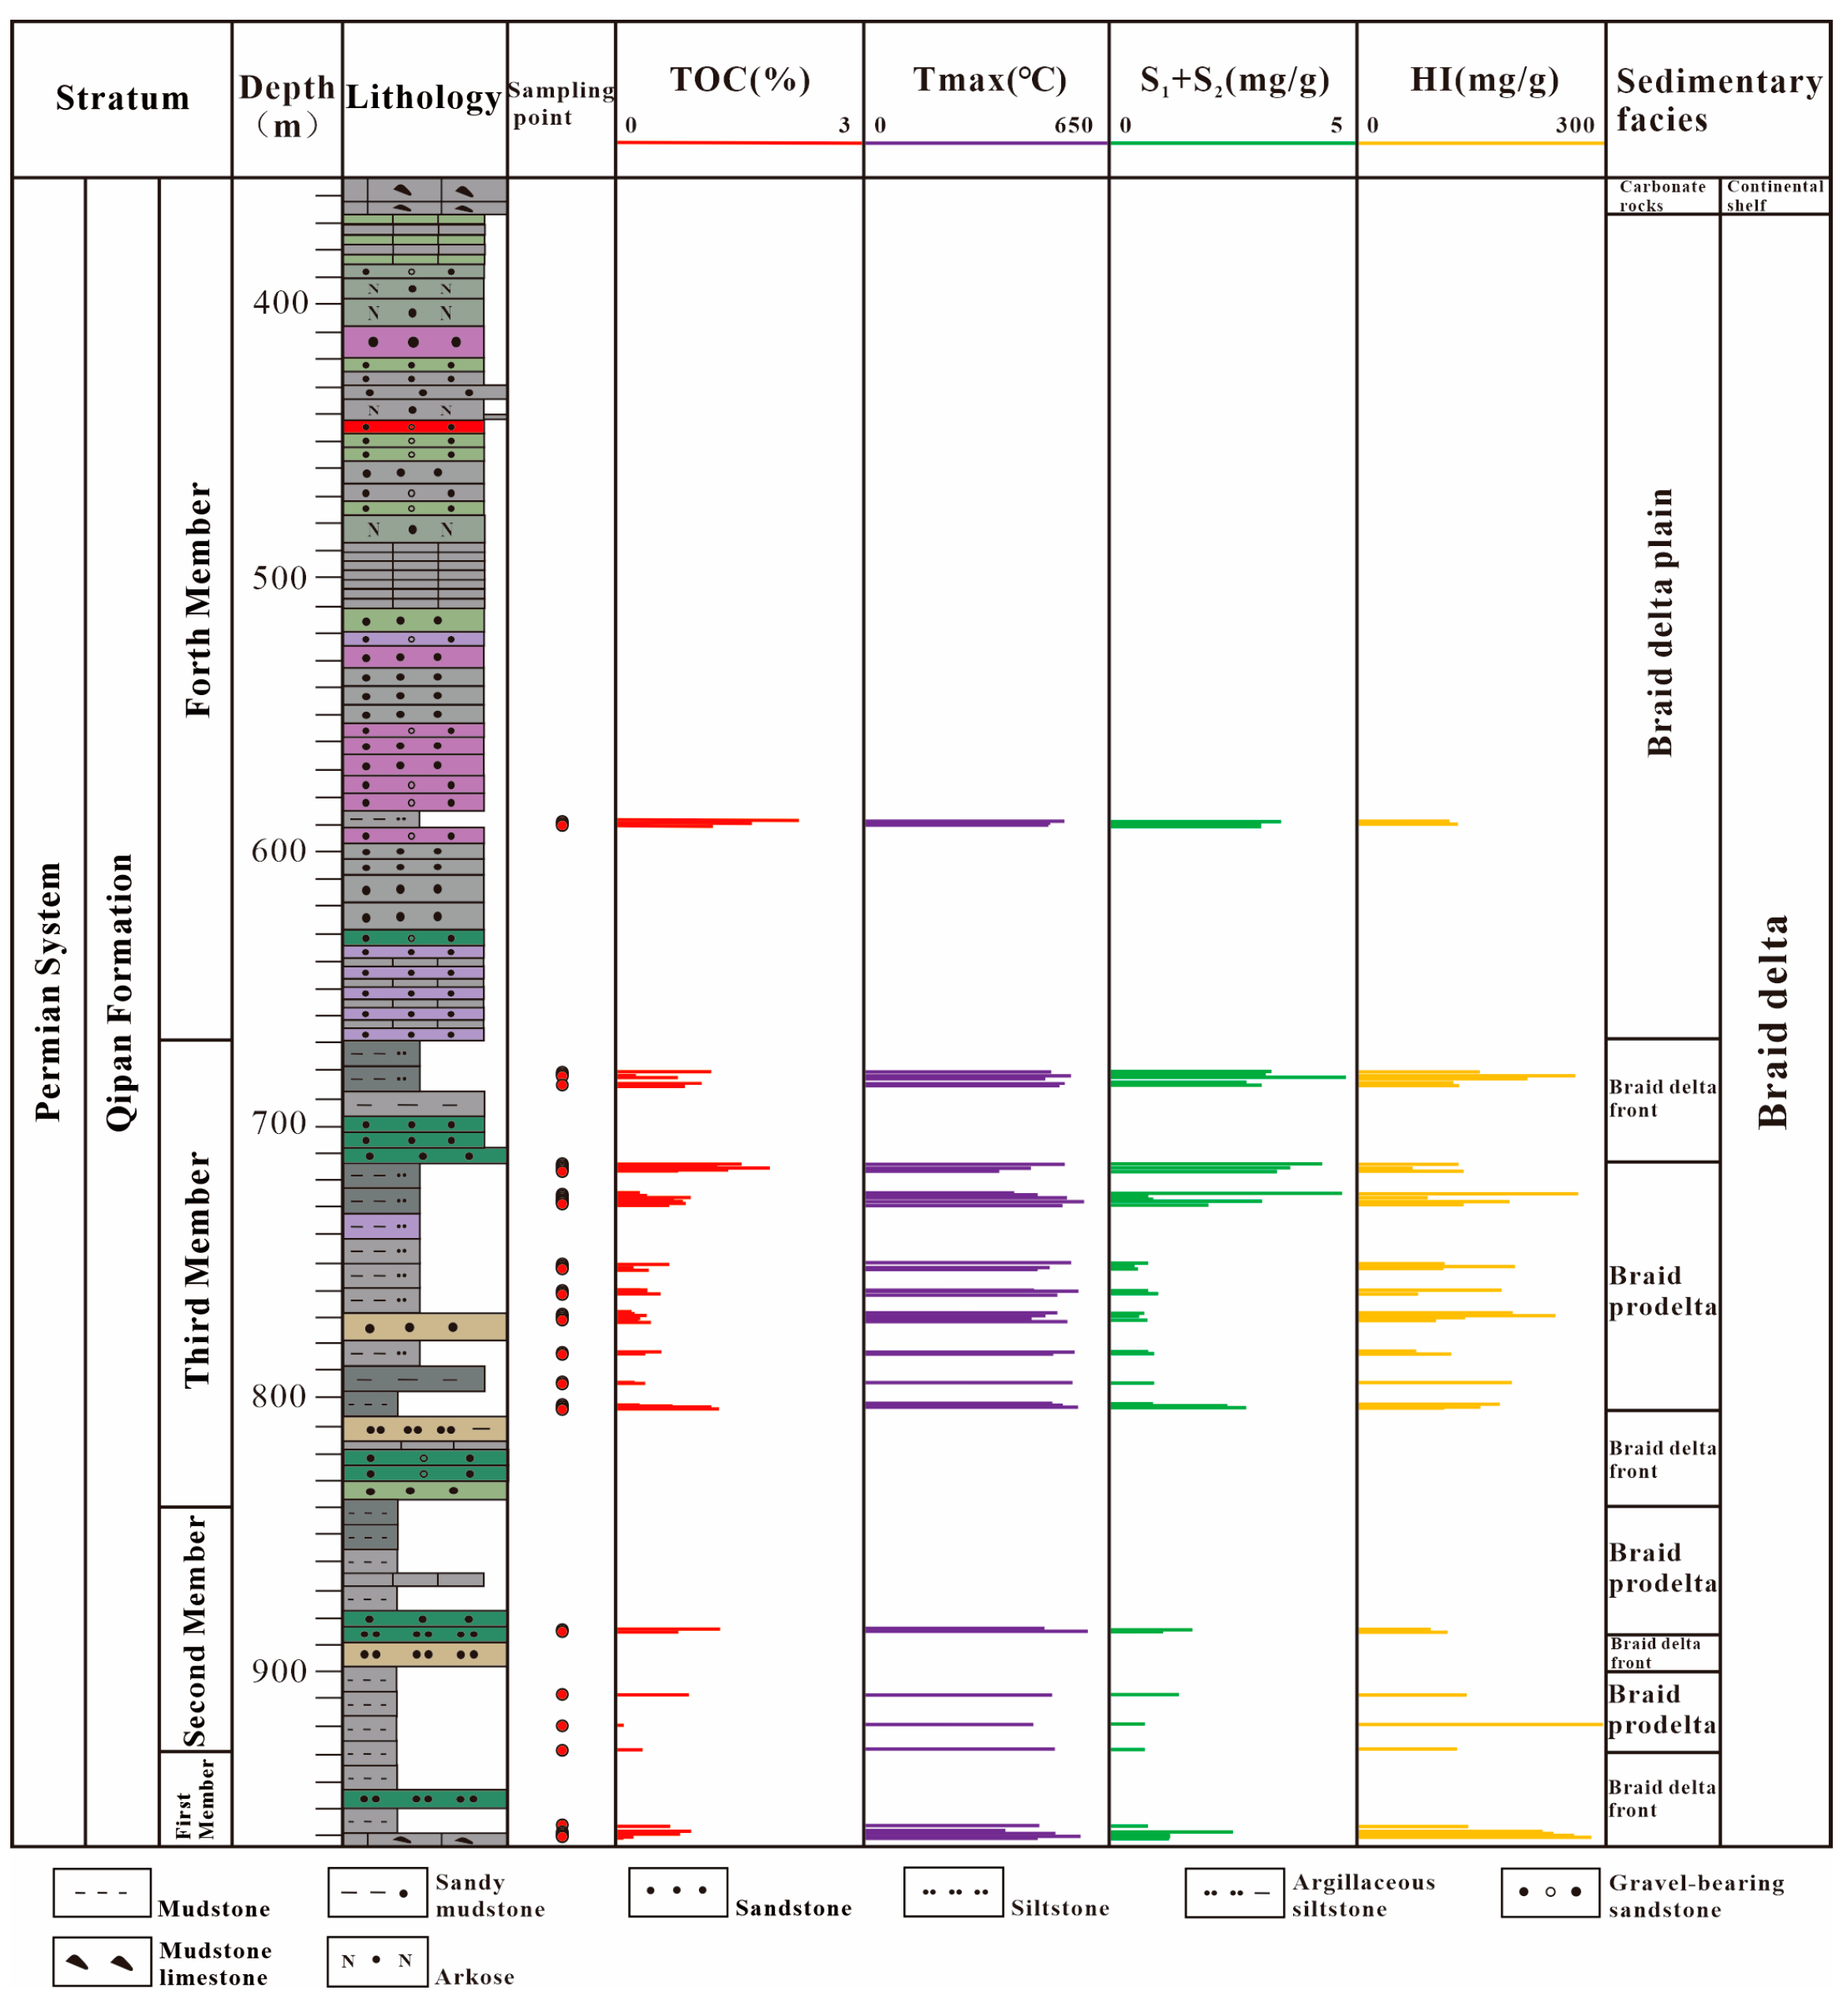
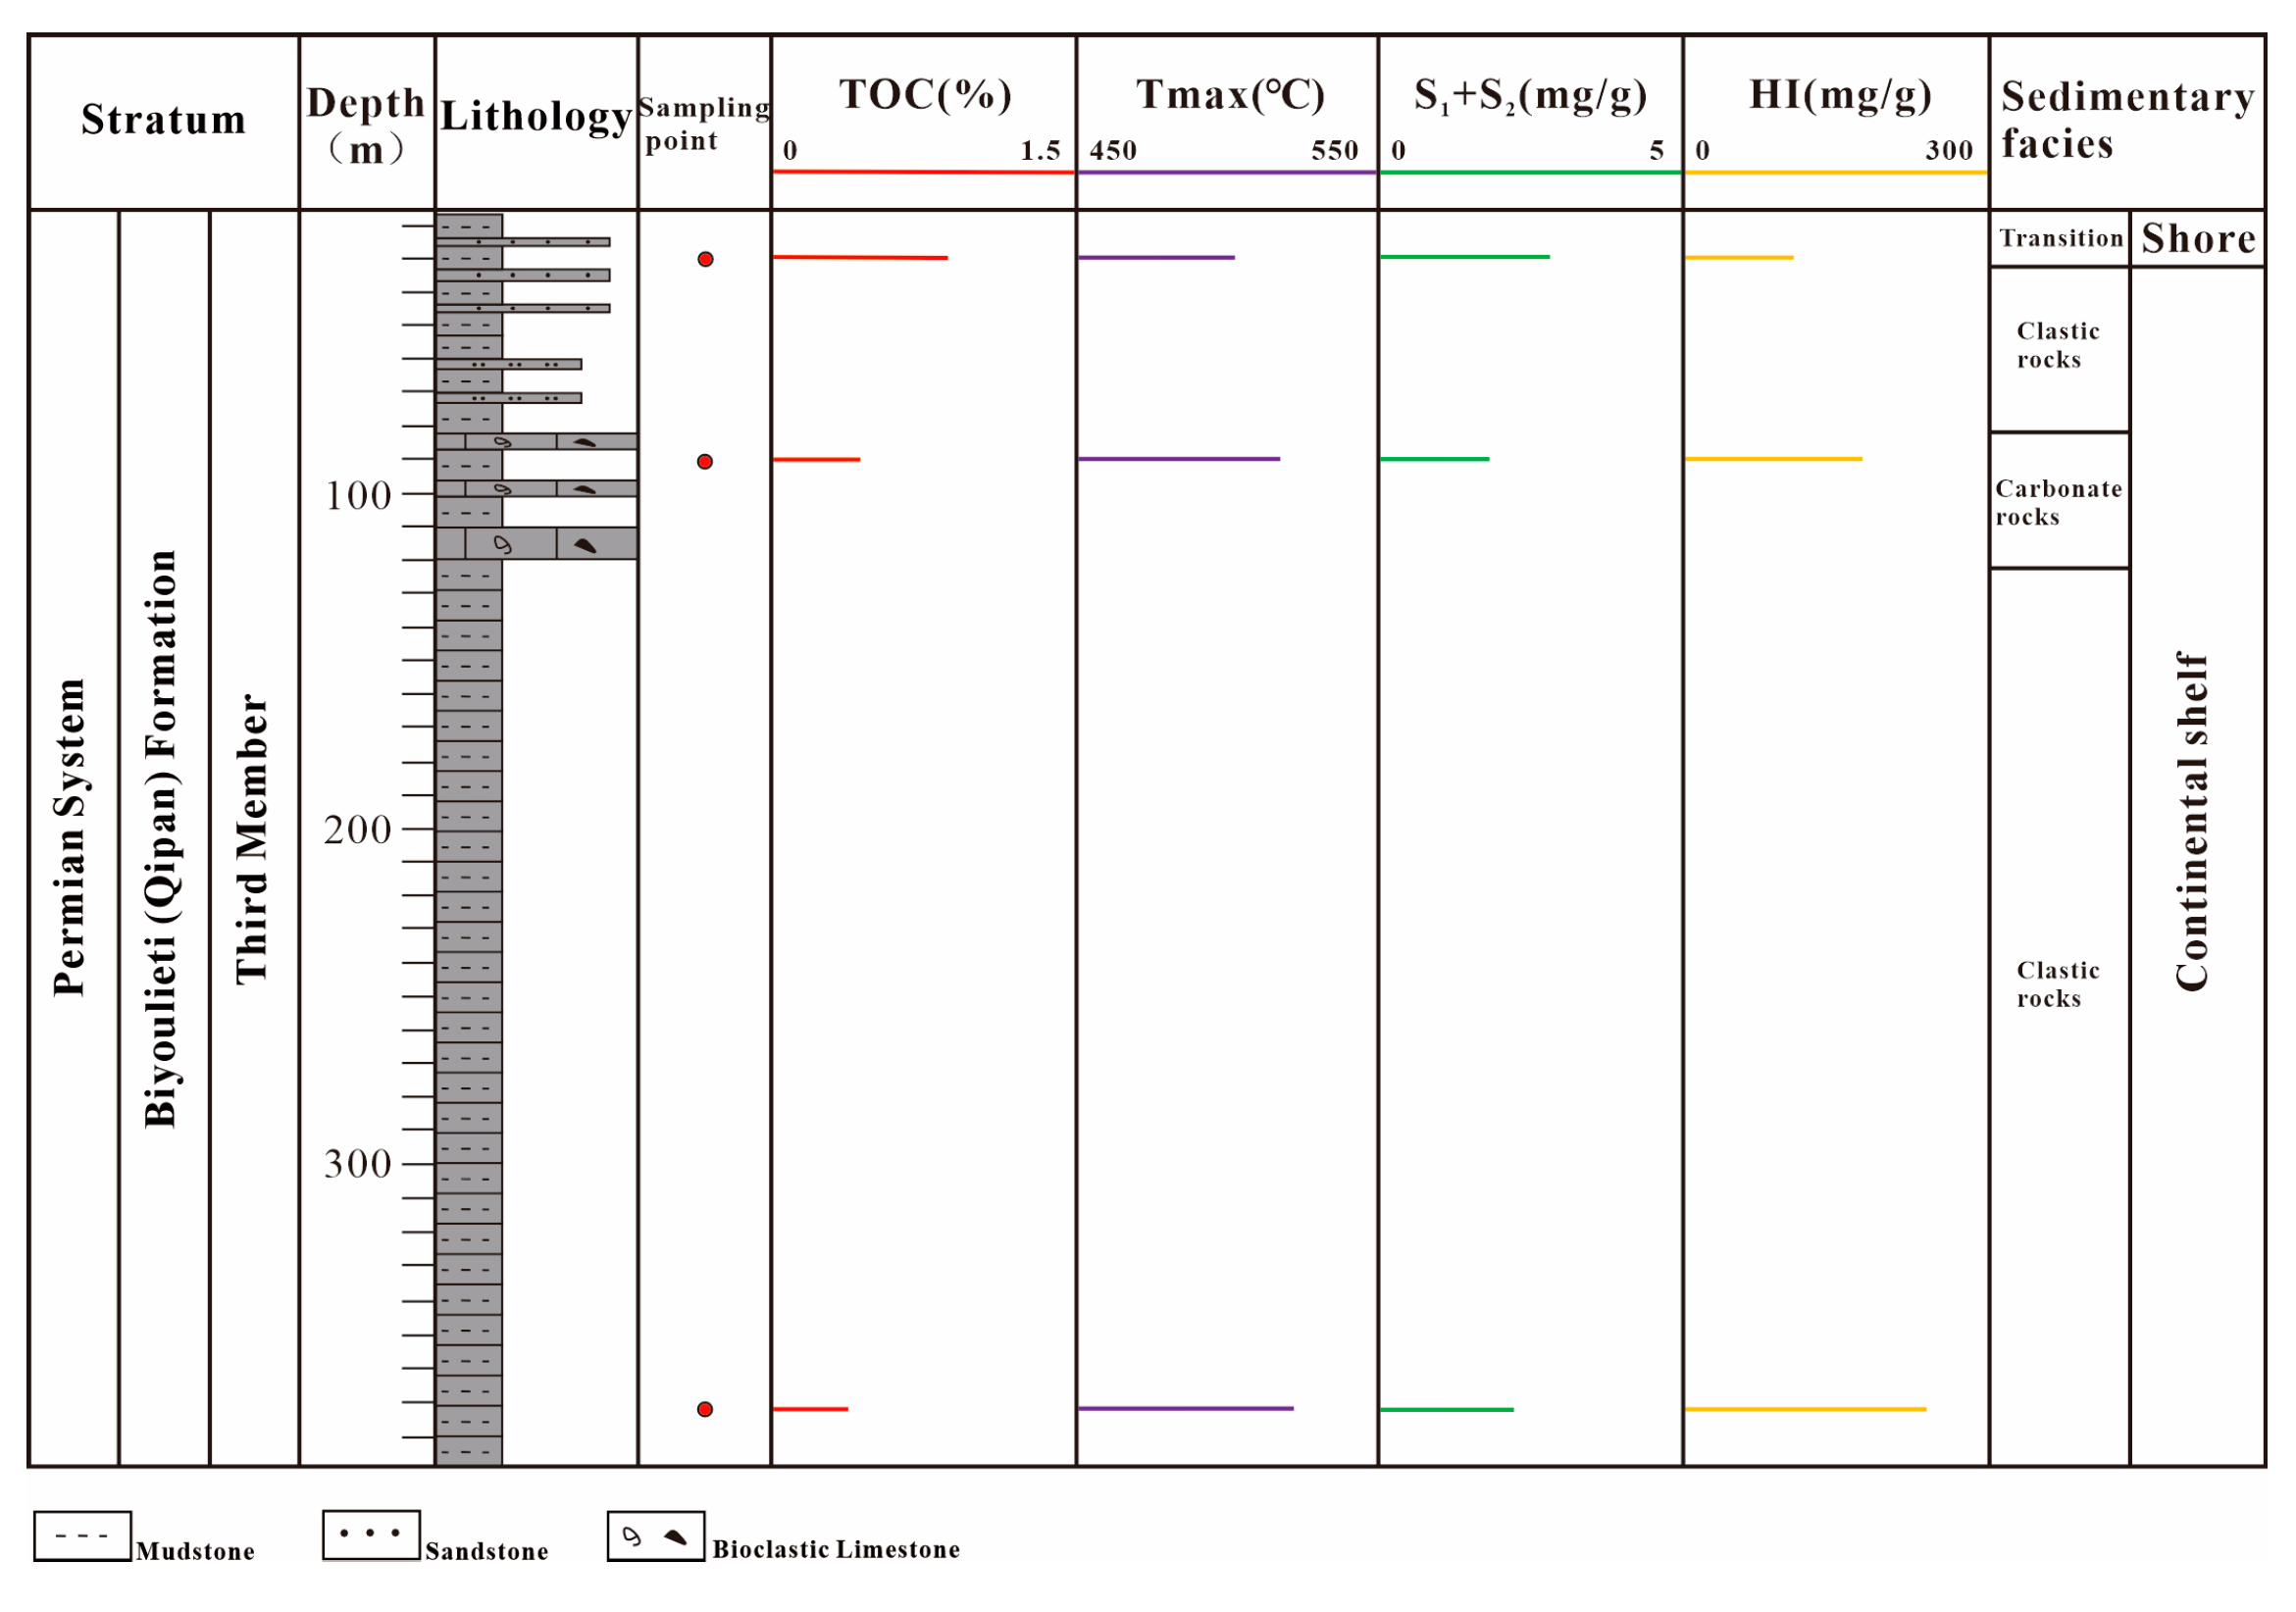
4.2. TOC and Tock-Eval Pyrolysis Evaluation

The analysis of organic matter abundance in hydrocarbon source rocks is a crucial method that employs the results of the TOC and pyrolysis tests on rocks [42,43]. This study utilizes the TOC and hydrocarbon generation potential of the S1 + S2 to evaluate the abundance of organic matter [44,45,46].
The TOC contents of 117 mudstone samples from P1-2q in Qimeigan section analyzed range from 0.27 to 2.56%, with an average value of 1.75%. The S1 + S2 values range from 0.63 to 4.96 mg/g, with an average value of 1.94 mg/g. The HI values range from 108 to 212 mg/g and the Tmax values range from 313 to 596 °C. The TOC contents of 50 mudstone samples from P1-2q in the Qiemugan section analyzed range from 0.28 to 2.15%, with an average value of 1.05%. The S1 + S2 values range from 0.6 to 4.8 mg/g, with an average value of 2.17 mg/g. The HI values range from 110.5 to 330 mg/g and the Tmax values range from 333 to 593 °C. The TOC contents of 176 mudstone samples from P1-2q in the Well Qiatan-1 analyzed range from 0.1 to 2.77%, with an average value of 1.04%. The S1 + S2 values range from 0.11 to 1.3 mg/g, with an average value of 0.59 mg/g. The HI values range from 15 to 104 mg/g and the Tmax values range from 437 to 633 °C (Figure 9).

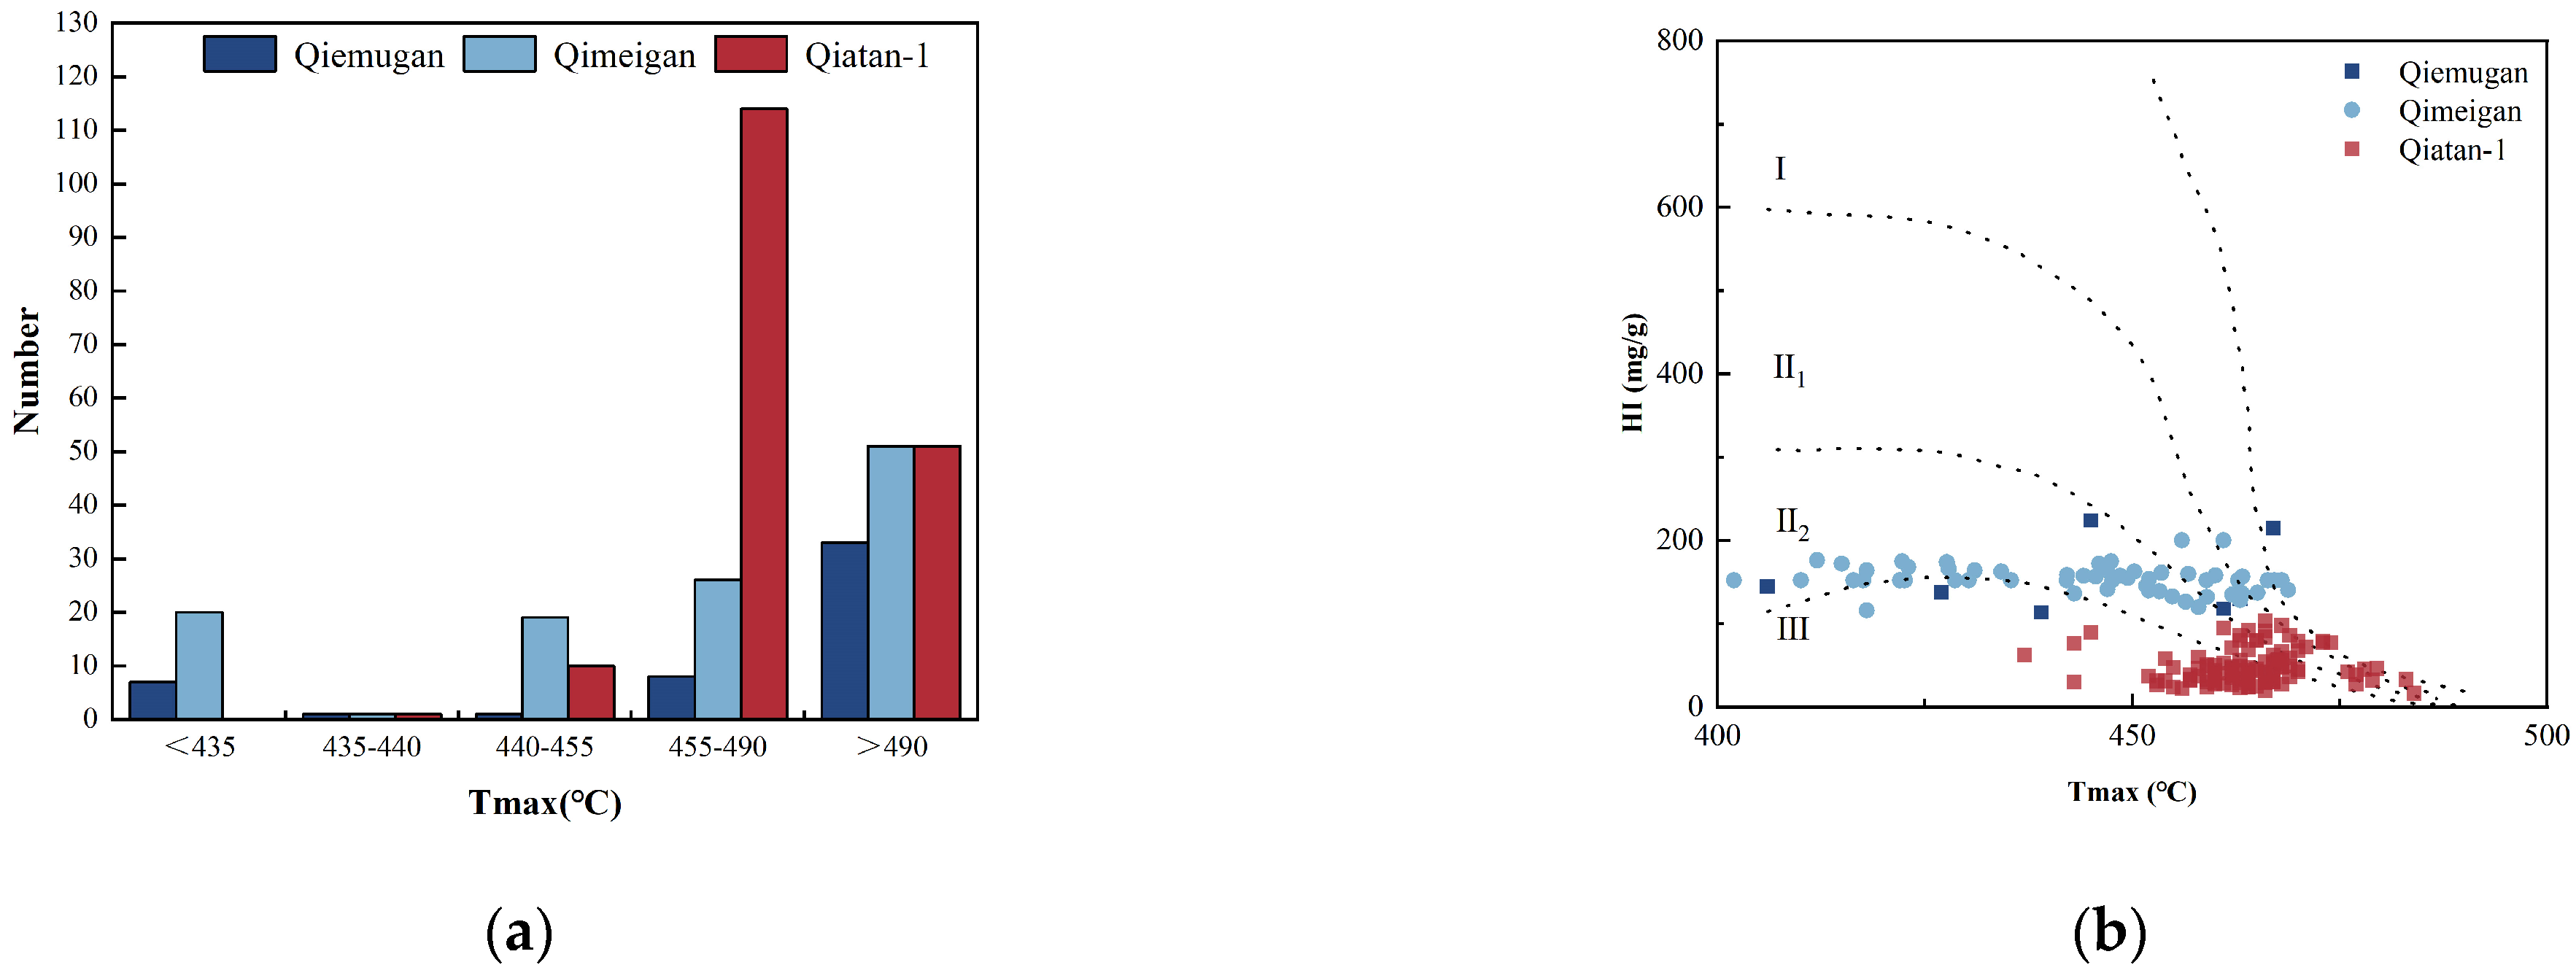
4.3. Kerogen Type and Maturation

A clear correlation exists between the type of organic matter and the hydrogen index (HI), which allows for the classification of organic matter based on this index [31,44,45,47,48,49]. The identification of different kerogen types can be discerned through the examination of hydrogen index (HI) and oxygen index (OI) values within specific formations [45,47,49]. However, when the degree of thermal evolution of organic matter is high, the generation and excretion of hydrocarbons consume hydrogen and oxygen elements, leading to the loss of reference significance for HI-OI identification of organic matter types [50]. The type of kerogen determines the hydrocarbon production capacity and hydrocarbon products of organic matter [51]. The kerogen pyrolysis results indicate low values for the HI and the value of Tmax is excessive (Figure 9a). Following the removal of anomalies with excessive Tmax, the organic matter types present in P1-2q are predominantly Type III and Type II2, with a minor presence of Type II1 and Type I (Figure 9b). However, the hydrocarbon source rocks of P1-2q exhibit a high degree of thermal evolution and a shift in pyrolysis parameters, making it challenging to determine the kerogen type.
The thermal maturity of source rocks can effectively be determined by Ro, Tmax, and production index (PI) [44,52,53]. The vitrinite reflectance is a useful indicator of the stage of thermal evolution and organic matter maturity of casein [54,55]. The Ro distribution of P1-2q in the Qimeigan section exhibits a range of values between 1.14% and 1.16%, with an average value of 1.15% [28]. The Ro distribution of P1-2q in the Heshilafu section exhibits a range of values between 0.90% and 1.95%, with an average value of 1.43%. The Ro distribution of P1-2q in the Aitegou section ranges from 1.50% to 2.00%, with an average value of 1.95% [19]. In conjunction with the aforementioned factors, the Permian hydrocarbon source rocks in the piedmont of southwestern Tarim Basin have already reached a mature stage, with the organic matter exhibiting a high degree of evolution.

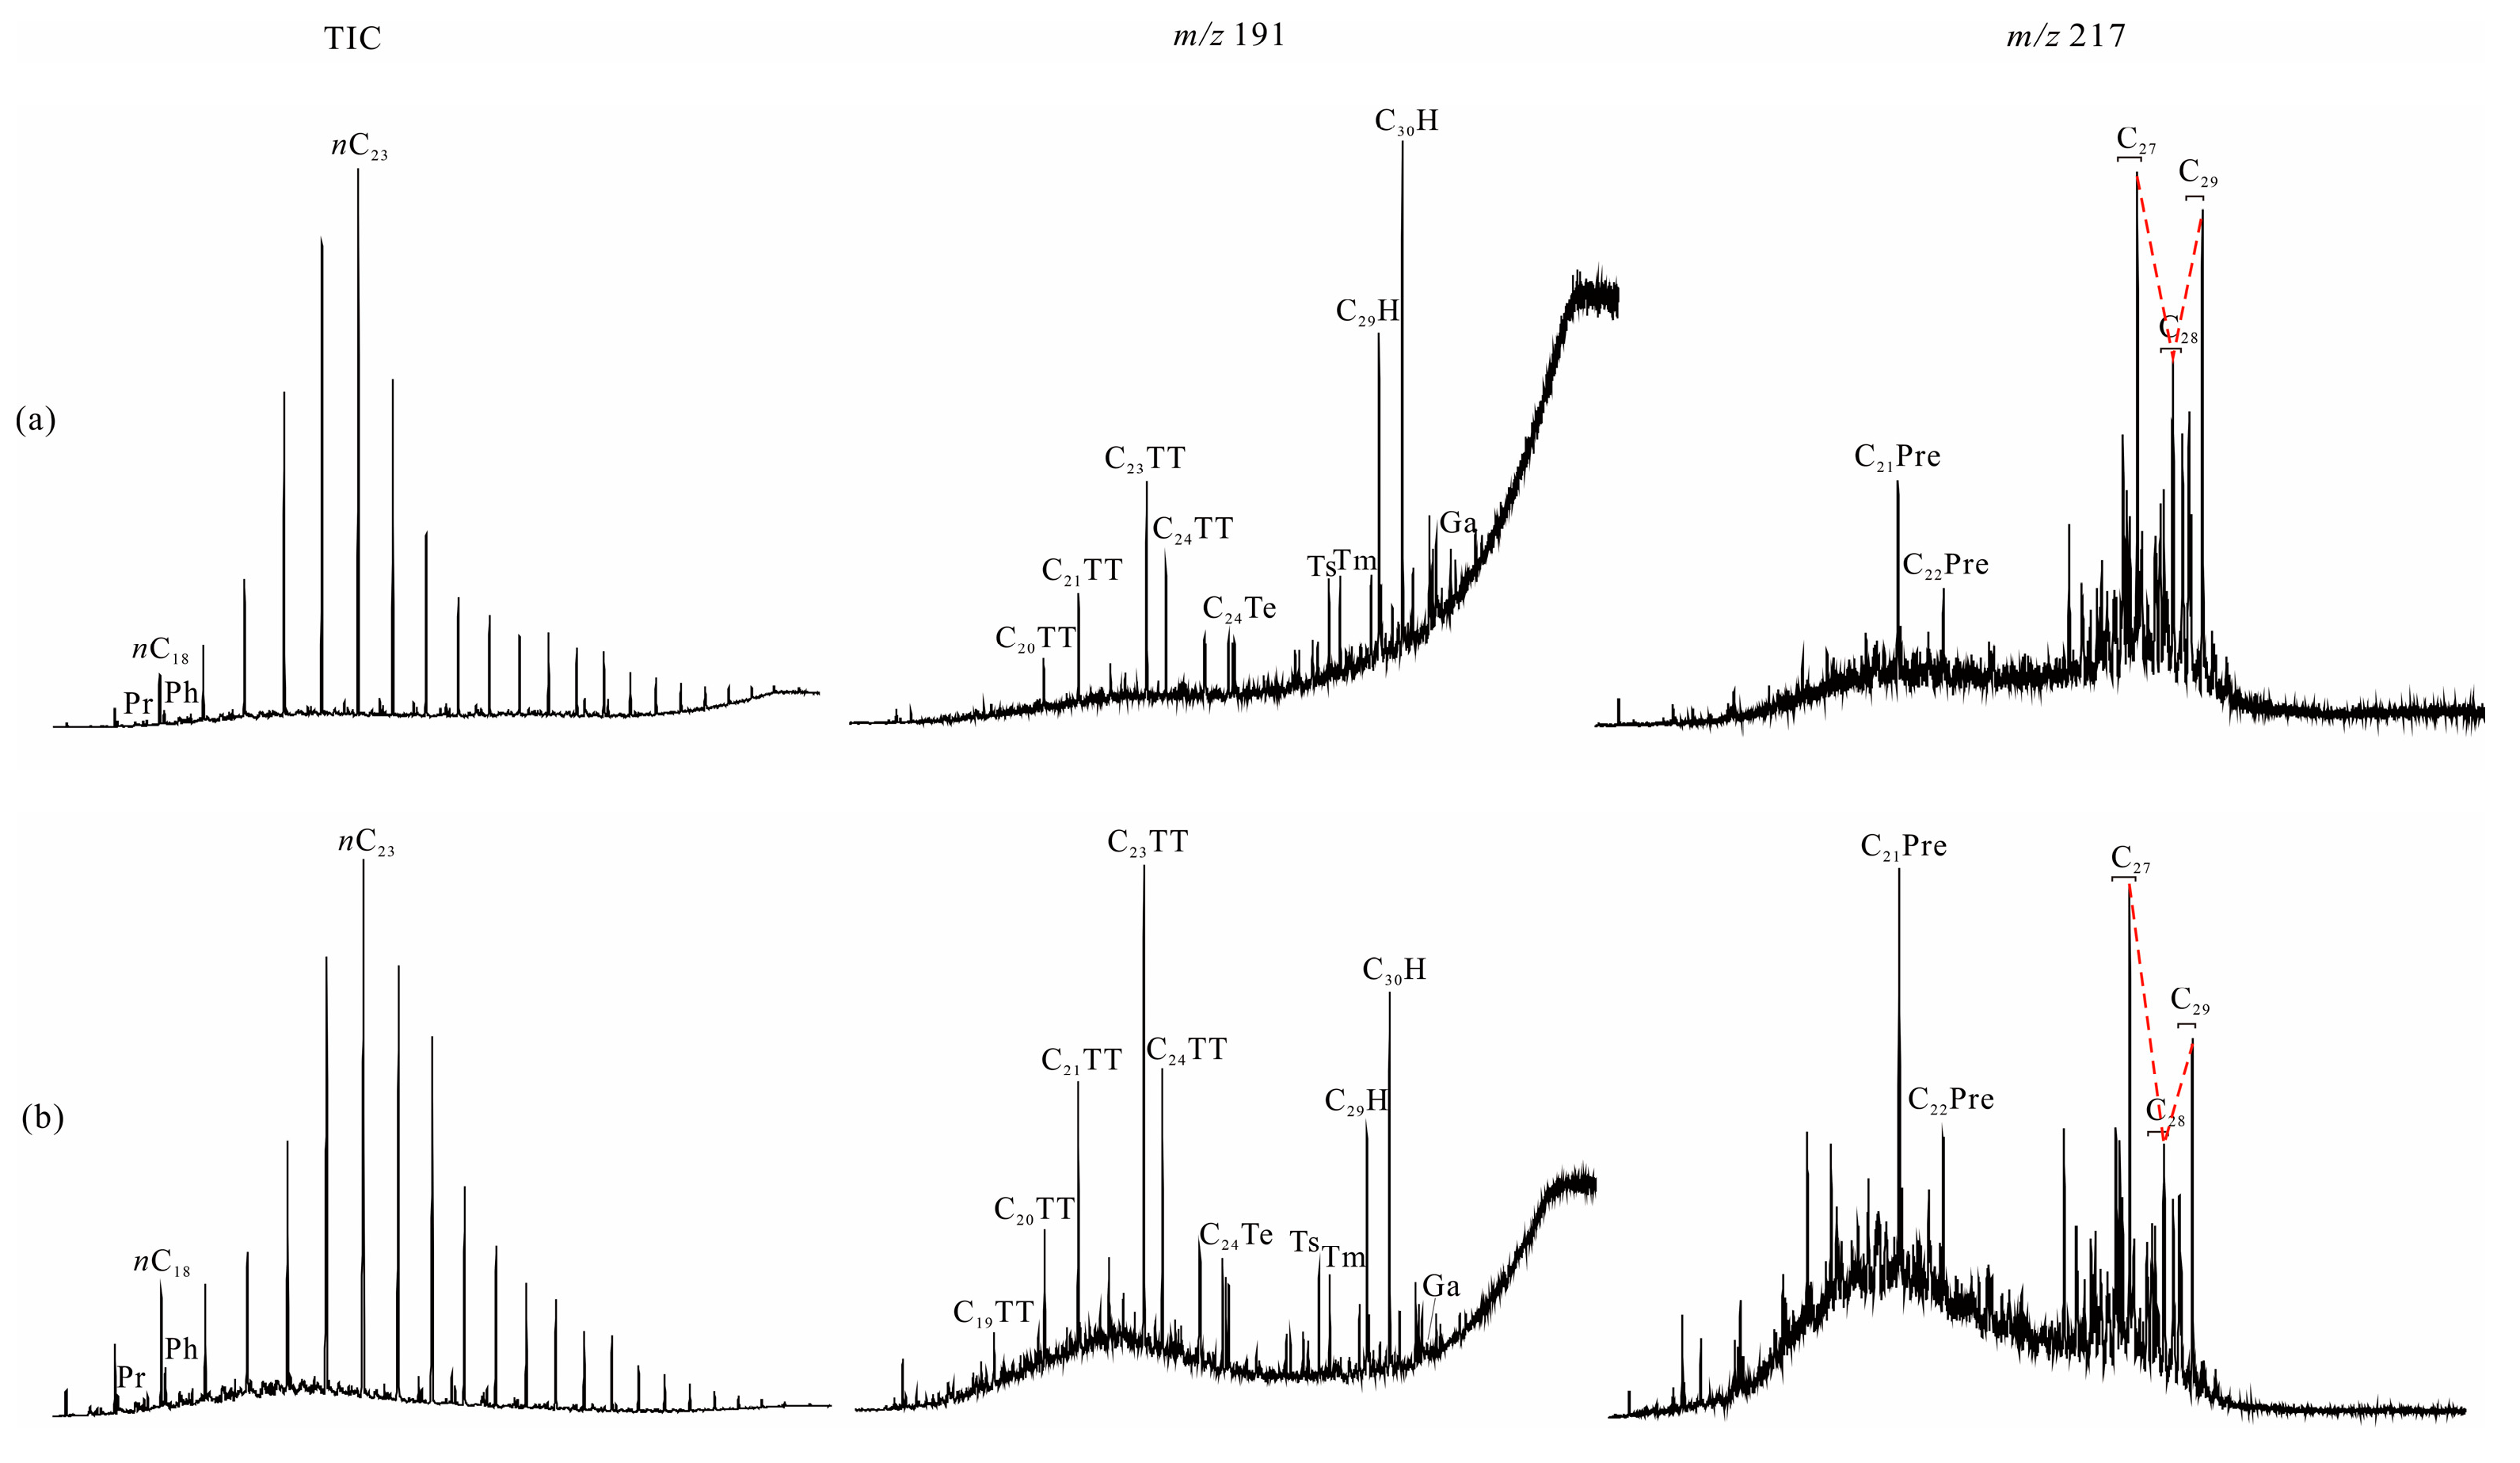
4.4. GC–MS Biomarker Analysis

Among the sterane compounds, the principal sources of C27 steranes are algae and lower plankton, while C29 steranes are derived from algae or higher plants of terrestrial origin [56].
The biomarker compounds of P1-2q mudstone samples from Qiemugan and Qimeigan sections exhibit a similar distribution (Figure 10), with a single-peak distribution of n-alkanes, the main peak carbon being n-C23, and a greater abundance of high-carbon n-alkanes than low-carbon n-alkanes, with no clear parity dominance. The distribution of the n-alkanes also demonstrates phytocarbane dominance, with Pr/Ph < 1.0. In the terpene alkane series, the Qiemugan section exhibited a greater abundance of pentacyclic triterpene alkanes than tricyclic terpene alkanes. The most prominent terpene peak was identified as C30H hopanoid. In contrast, Qimeigan section tricyclic terpene alkanes exhibit a clear dominance over pentacyclic triterpene alkanes. The principal terpene alkane peak is C23TT, with a proximity in abundance between Ts and Tm. In comparison, the gammacerane content is lower, while the relative abundance of C24Te is higher. The C27-C29 regular sterols in the Qiemugan section were arranged in a more symmetrical “V” shape, with a smaller relative abundance gap between C27 and C29 sterols. However, C27 sterols remained dominant, and the contents of pregnanes (C21Pre) and ascending pregnanes (C22Pre) were lower in abundance. The C27-C29 regular steroids in the Qimeigan section were arranged in an asymmetric “V” shape, with C27 steroids exhibiting a clear content advantage, and progestanes and ascending progestanes demonstrating a higher content.

5. Discussion

5.1. Source Rock Evaluation

The evaluation of hydrocarbon source rocks is dependent upon three key factors: organic matter abundance, kerogen type, and organic matter thermal maturity [31,45,51,57,58,59,60]. It should be noted that the field samples are susceptible to the natural environment, which may affect the results of the experimental analyses. Nevertheless, the overall TOC distribution trend is largely consistent with the core data, with the majority of values situated between 0.5% and 1.0%, followed by the 1.0% to 2.0% interval (Figure 11a). In accordance with the hydrocarbon source rock evaluation criteria [51], the muddy hydrocarbon source rocks of P1-2q in the piedmont of southwestern Tarim Basin are deemed to be fair–good hydrocarbon source rocks (Figure 11b).
The overall Tmax values of P1-2q hydrocarbon source rocks are notably elevated, with the majority exceeding 490 °C or falling between 455 °C and 490 °C (Figure 9a). The kerogen exhibited a dark coloration, with minimal or no fluorescence observed from the vitrinite (Figure 12). It can be concluded that P1-2q hydrocarbon source rocks have reached a mature stage, with the organic matter having undergone a high level of evolution. The hydrocarbon-generating parent material of the P1-2q Formation muddy hydrocarbon source rock in the Well Qiatan-1 is algae and amorphism (Figure 9), and the type of organic matter is Type I. The microcomponents of P1-2q argillaceous hydrocarbon source rocks in Qimeigan section are only observable as vitrinite. The organic matter is derived from higher plants.
The muddy hydrocarbon source rock of P1-2q, which was drilled in the Well Qiatan-1, was developed from a marine environment. The hydrocarbon-generating parent material was algae and amorphous (Figure 10), and the organic matter type was I-II1. Conversely, as a consequence of the late Permian sea retreat, the southwest depression gradually became an inland basin, and the region developed a deltaic phreatic zone with a sea-land transition environment. Moreover, the majority of the organic matter in the samples of P1-2q in the Qimeigan section were derived from land-sourced clastic material. Isotopic analyses of kerogen carbon in samples from P1-2q in Qimeigan section indicated a range of −21.6% to −23.5%, with the organic matter type identified as Type III.
The distribution of saturated hydrocarbon n-alkane peak shapes, the number of main peak carbons, and the content of C27 to C29 rule sterane in biomarker compounds, which are organic compounds that can be used to identify the type of organic matter present. Among the sterane compounds, the principal sources of C27 steranes are algae and plankton, while C29 steranes are derived from algae or terrigenous higher plants [56]. The ortho-alkane peak shapes of the mud hydrocarbon source rocks of P1-2q are all single peaks, with a reduction in the high-carbon fraction after n-C23. This suggests that the source of organic matter is likely to be lower planktonic organisms. The asymmetric ‘V’ arrangement of the C27-C29 regular steranes indicates that the hydrocarbon parent material is predominantly derived from algae or aquatic organisms, with varying degrees of mixing with organic matter of terrestrial origin. The organic matter types of the muddy hydrocarbon source rocks of P1-2q in the piedmont of southwestern Tarim Basin can be classified as Type III, Type II2, and partly Type I. These types differ in different tectonic units and depositional environments.

5.2. Sources of Organic Matter

The Permian period saw the continuation of the palaeogeographical and palaeomorphological patterns observed during the late Carboniferous. Terrestrial deposits were present in the eastern region, and two sets of volcanic strata were deposited within the depression as a consequence of the volcanic activity that occurred in the northeastern and eastern areas. On the southwestern margin, the Aertashi section to the Sangzhu river area and the Akeqi section exhibit evidence of deeper seawater deposition during continental shelf facies and slope facies. The late early Permian witnessed an increase in terrestrial debris, which resulted in the formation of a mixed sedimentary system comprising marine clastic rocks and carbonate rocks assemblages. In the late Permian, the seawater had entirely withdrawn from the southwest depression, becoming a completely inland basin. The remainder of the extensive southwestern Tarim Basin region is characterized by deltaic deposits, with alluvial fans also being a prominent feature of the premontane belt (Figure 13).
During the stratigraphic depositional period of P1-2q, large-scale lagoon deposits were developed in the piedmont of the South Kunlun Mountains, and fan delta deposits were developed along the edge of the lagoon on the shore deposits. The piedmont of the southern Tianshan Mountains exhibits notable differences from the southern Kunlun Mountains in terms of depositional environments. The former is characterized by the development of broad continental shelf facies, slope facies, and platform margin facies. The Kashi sag and the Yecheng-Hetian sag are primarily deposited in alluvial plain, with scattered alluvial fan and sand dam situated around the periphery, and shore-shallow lacustrine sediments in the Hetian area (Figure 14).
Biomarker compounds indicate that the water bodies in the palaeoenvironment of P1-2q in Qiemugan and Qimeigan sections are deeper; the hydrocarbon-forming environments are characterized by a greater degree of reduction. The salinity is elevated, predominantly marine. The petrographic palaeogeography of P1-2q indicates that the organic matter parent environment during this period was predominantly marine facies, with a transition facies of seacontinent. The organic matter of the hydrocarbon source rocks was primarily derived from algae and plankton, with a minor terrestrial organic matter input (Figure 11).
The TOC-S-Fe relationship indicates that the sedimentary waters of the hydrocarbon source rocks of P1-2q are predominantly slightly oxygen-rich, with a minor anoxic component (Figure 15b). The ratio of strontium to barium (Sr/Ba) and the ratio of boron to gallium (B/Ga) can be used to indicate the salinity of water bodies. The Sr/Ba values for the P1-2q hydrocarbon source rock samples from the Qimeigan section exhibit a range from 0.46 to 2, with a mean value of 0.91. Similarly, the B/Ga values range from 0.6 to 8.91, with a mean value of 5.42. The combined Sr/Ba and B/Ga salinity indexes [60,61] indicate that the salinity of the water bodies during the depositional period of the hydrocarbon source rocks of P1-2q was comparable and high for a semi-saline-brine environment (Figure 16).
The hydrocarbon source rocks of P1-2q exhibit a high content of detrital materials, followed by lime fractions (Figure 15a). Furthermore, the correlation between TiO2 and Al2O3 of P1-2q sediments in the Qimeigan section is satisfactory (R2 = 0.7894), whereas the correlation between TiO2 and Al2O3 of P1-2q sediments in the Paojianggou section is unsatisfactory (R2 = 0.4507). This evidence indicates that the source of detrital material during the depositional period of P1-2q was unstable (Figure 17). Furthermore, the distribution of sedimentary phases in the studied region suggests that P1-2q was deposited in a mixed environment.

6. Conclusions

(1)
The organic matter abundance of the hydrocarbon source rocks of the Permian Qipan Formation in the piedmont of southwestern Tarim Basin was evaluated as medium–good hydrocarbon source rocks. The hydrocarbon source rocks are mature, with the organic matter having reached a stage of high or over-mature evolution. The koregen types are predominantly Type III, Type II2, and a portion Type I.
(2)
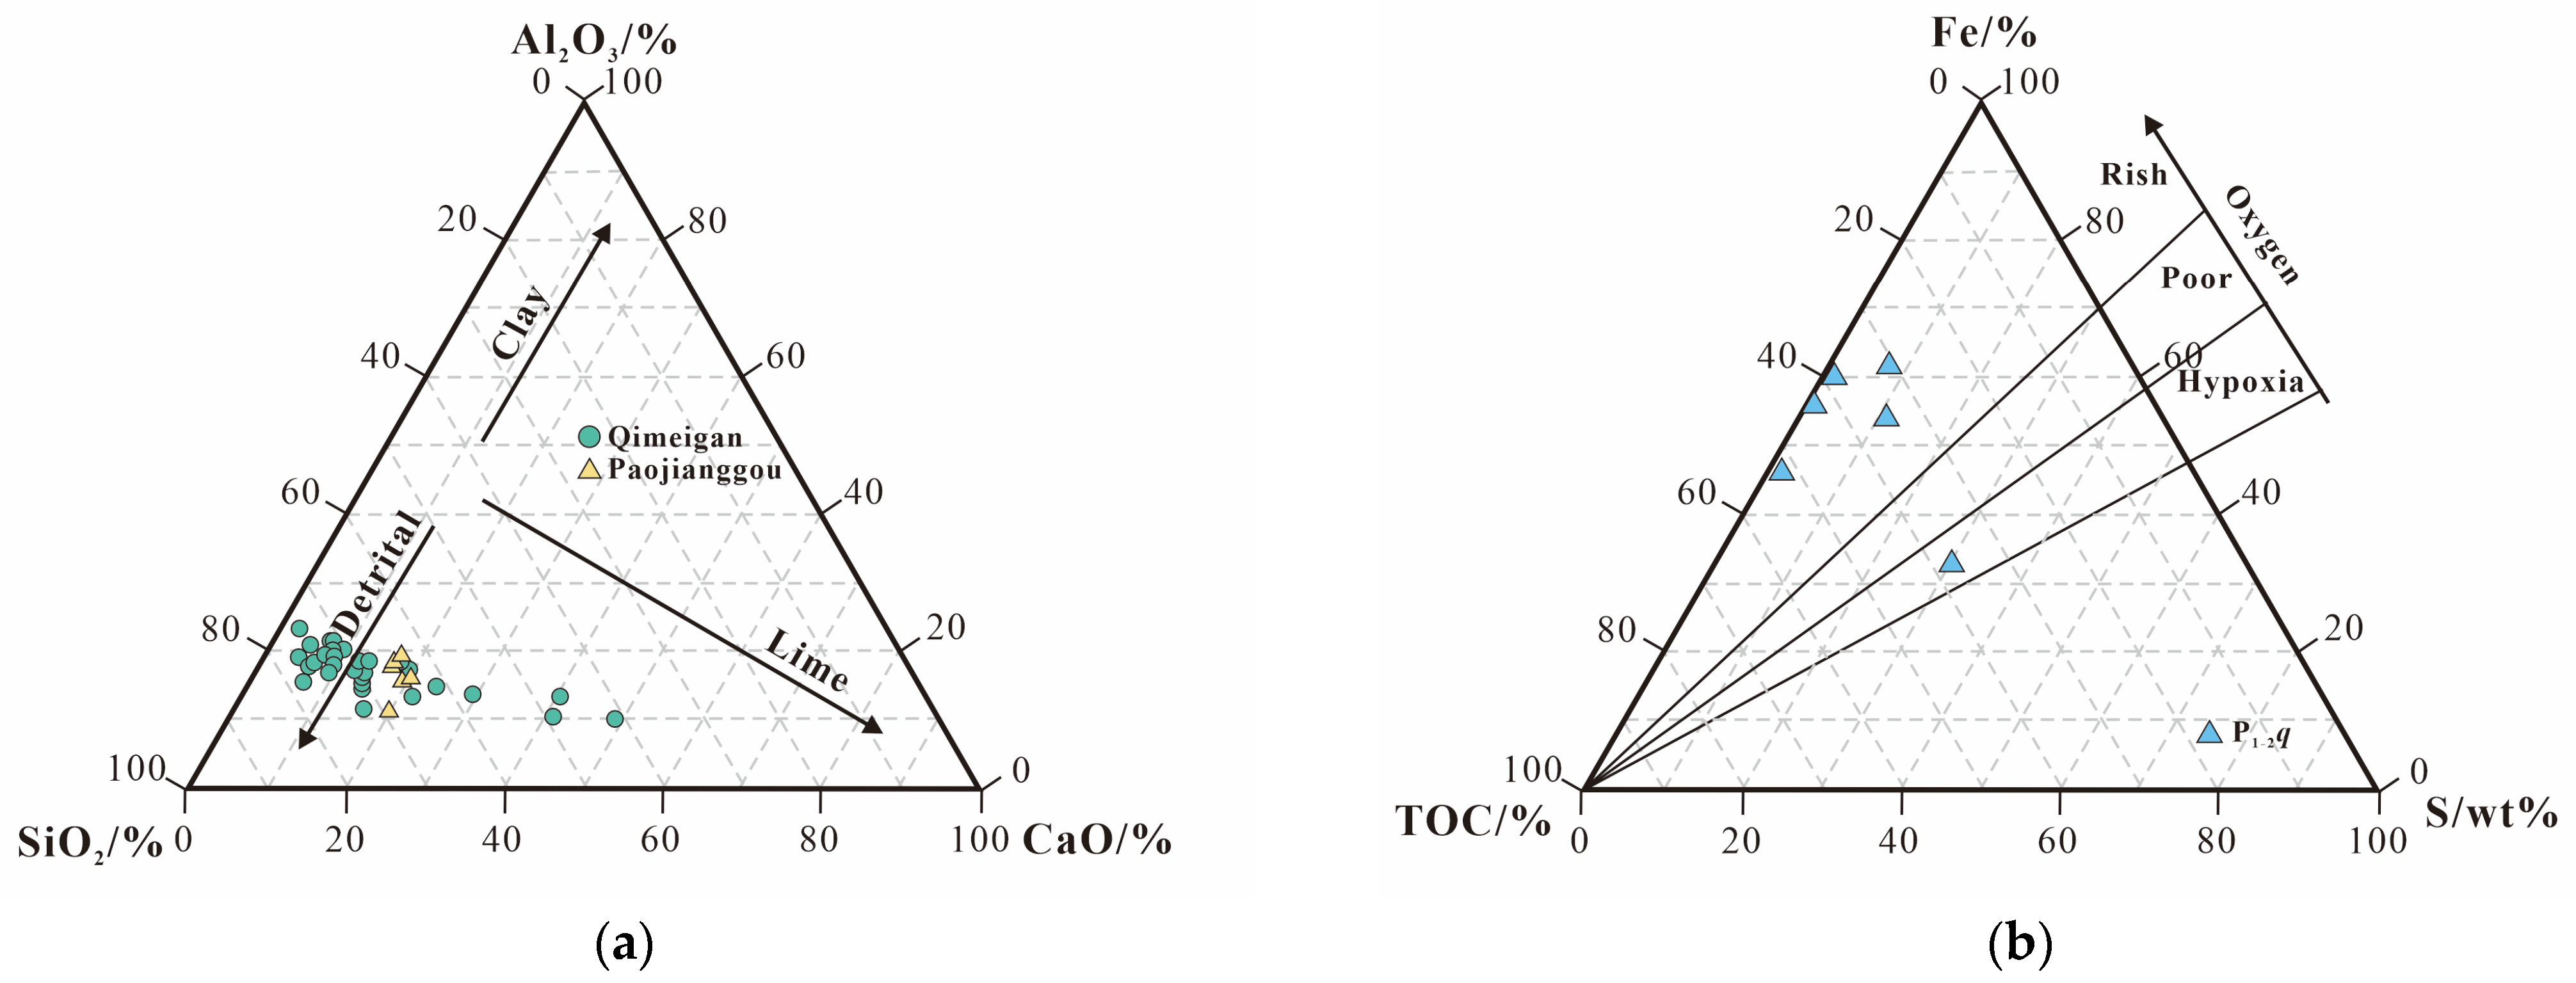
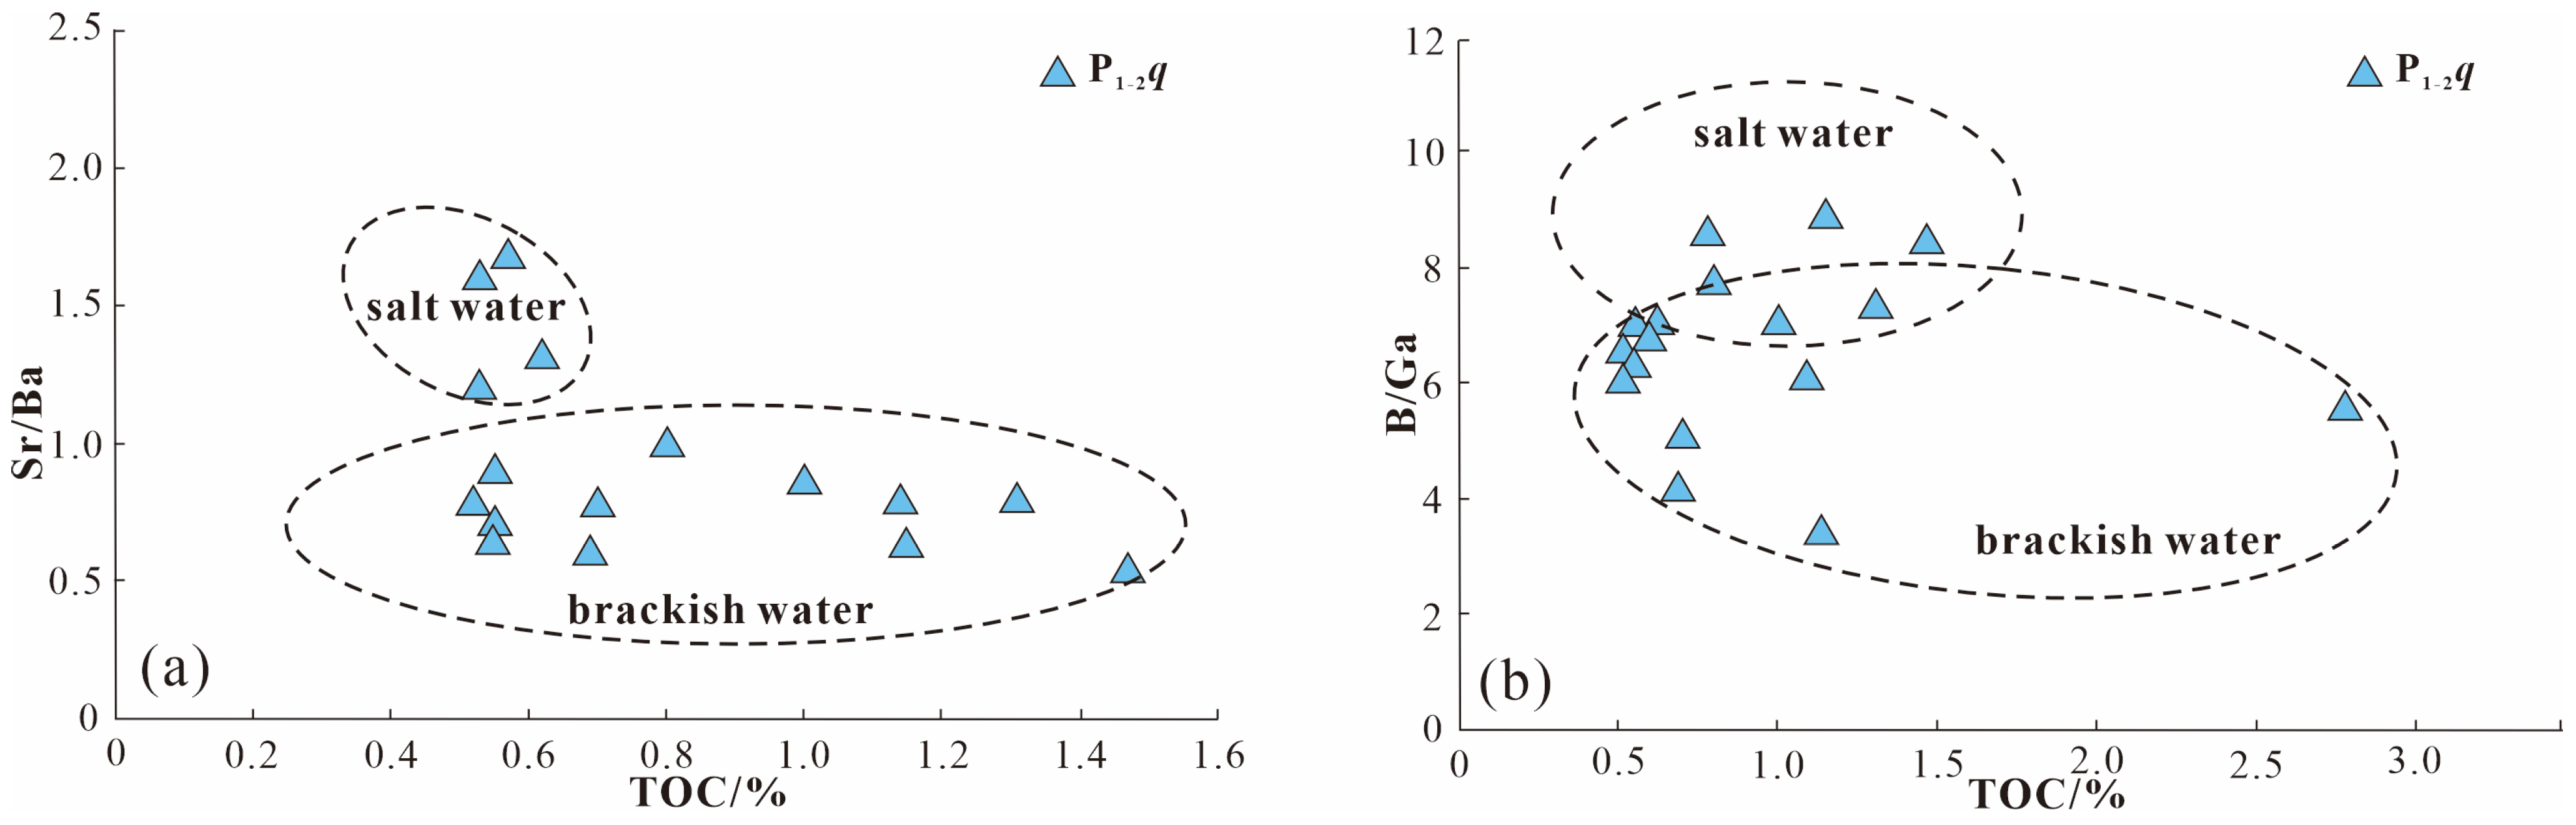
The sedimentary waters of the hydrocarbon source rocks of the Permian Qipan Formation in the piedmont of southwestern Tarim Basin are predominantly oxygen-rich, with a lesser degree of anoxia. The salinity of the water bodies is comparable and high in semi-saline environments. The detrital material that formed the hydrocarbon source rocks of the Qipan Formation was derived from an unstable source and originated from an amphibolite environment. This also indicates that the organic matter types of the hydrocarbon source rocks of the Qipan Formation exhibit differences depending on the depositional environment.
(3)
The type of organic matter present in the hydrocarbon source rocks varies due to differences in the depositional environments. The depositional environments in the vicinity of Wuqia County are predominantly marine, comprising open continental shelf facies, slope facies, and shore facies. The organic matter present is predominantly Type I, with a minor component Type II. In the vicinity of the Qiemugan section in the northwestern of the Kashi sag, the lagoon facies, the shore facies, and fan delta facies are developed. The organic matter is mostly of mixed source, mainly of Type II. In addition to marine environments such as lagoon facies and shore facies, the southwestern part in the piedmont of southwestern Tarim Basin also developed sea–land transitional phase deposits such as fan deltas facies and barrier facies. Influenced by terrestrial sources of organic matter, Type II and some Type III organic matter were formed.

Author Contributions

Conceptualization, L.Y. and G.Z.; methodology, J.Y.; software, G.Z.; validation, G.Z. and Q.W.; formal analysis, Q.W.; investigation, L.Y.; resources, Z.W.; data curation, Q.W.; writing—original draft preparation, Q.W.; writing—review and editing, Q.W.; visualization, Q.W.; supervision, Z.W.; project administration, Z.W.; funding acquisition, Z.W. All authors have read and agreed to the published version of the manuscript.

Funding

This research received no external funding.

Institutional Review Board Statement

Not applicable.

Informed Consent Statement

Not applicable.

Data Availability Statement

The data presented in this study are available on request from the corresponding author.

Conflicts of Interest

Exploration and Author Guoxiao Zhou was employed by the company Development Research Institute of PetroChina Changqing Oilfield Company. The remaining authors declare that the research was conducted in the absence of any commercial or financial relationships that could be construed as a potential conflict of interest.

References

  1. Liu, C.P.; Luo, L.; Qi, J.F.; Yu, H.Z. Geological and Hydrocarbon Accumulation Characteristics in Piedmont Zone. Geosicience 2013, 10, 1034–1041. [Google Scholar]
  2. He, D.F.; Zhao, W.Z. Dynamic Evolution of Sedimentary Basins and Petroleum System Cycles in Northwest China; Petroleum Industry Press: Beijing, China, 1999; pp. 1–181. [Google Scholar]
  3. Zhao, M.J.; Xia, X.F.; Qin, S.F.; Song, Y. Gas Source Study of Ake Well 1 Resource in Tarim Basin. Nat. Gas Ind. 2003, 23, 31–33. [Google Scholar]
  4. Xiao, Z.Y.; Tang, Y.J.; Hou, D.J.; Zhang, Q.C. Study on Oil Source of Kekeya Condensate Oil-Gas Pool. Acta Sedimentol. Sinic. 2002, 20, 716–720. [Google Scholar]
  5. Hou, D.J.; Xiao, Z.Y.; Tang, Y.J.; Zhu, J.Z.; Li, X.Q. Geochemical Characterization of Mixing Natural Gas in Kekeya Field, Tarim Basin, China. Nat. Gas Geosci. 2003, 14, 474–479. [Google Scholar]
  6. Du, J.H.; Wang, Z.M.; Lei, G.L.; Hu, J.F. A Discovery in Well Kedong-1 and Its Exploration Significance. Explor. Strategy 2011, 16, 1–5. [Google Scholar]
  7. Yang, H.J.; Wang, B.Q.; Yang, Z.L.; Lei, G.L.; Wei, H.X. Structure modeling and hydrocarbon exploration of Kedong structural belt in southwestern Tarim Basin. Chin. J. Geol. 2011, 46, 456–465. [Google Scholar]
  8. He, D.F.; Li, D.S.; He, J.Y.; Wu, X.Z. Comparison in petroleum geology between Kuqa depression and Southwest depression in Tarim Basin and its exploration significance. Acta Pet. Sin. 2013, 34, 201–214. [Google Scholar]
  9. Wang, Q.; Peng, P.A.; Zeng, J.; Zou, Y.R. Oil source of condensates from Well Kedong 1 and crude oil from Kekeya in Yecheng depression. Geochimica 2014, 34, 470–476. [Google Scholar]
  10. Du, Z.L.; Zeng, C.M.; Qiu, H.J.; Yang, Y.X.; Zhang, L. Key Formation of the Permian Hydrocarbon source rocks and Oil-Source Correlation of well KD1 in Yecheng Depression of Southwestern Tarim Basin. J. Jilin Univ. Earth Sci. Ed. 2016, 46, 652–659. [Google Scholar]
  11. Huang, W.Y.; Pan, C.C.; Yu, S.; Zang, H.Z.; Xiao, Z.Y. Oil source and charging process of Well FS4 in the Kedong structural belt, Southwest Tarim Basin Depression. Nat. Gas Geosci. 2022, 33, 1837–1847. [Google Scholar]
  12. Wang, Q.H.; Xu, Z.P.; Zhang, Y.H.; Yang, H.J.; Yang, X.Z. New fields, new types of hydrocarban explorations and their resource potentials in Tarim Basin. Acta Pet. Sin. 2024, 45, 15–29. [Google Scholar]
  13. Wang, Q.H.; Yang, H.J.; Li, Y.; Cai, Z.Z.; Yang, X.Z. Major breakthrough in the Carboniferous-Permian in Well Qiatan 1 and exploration prospect in the piedmont southwestern Tarim Basin. China Pet. Explor. 2023, 28, 34–44. [Google Scholar]
  14. Venkatesan, M.I.; Kaplan, I.R. The lipid geochemistry of antarctic marine sediments: Bransfield strait. Mar. Chem. 1987, 21, 347–375. [Google Scholar]
  15. Makky, A.F.; El Sayed, M.I.; El-Ata, A.S.A.; Abd El-Gaied, I.M.; Abdel-Fattah, M.I.; AbdAllah, Z.M. Source rock evaluation of some upper and lower cretaceous sequences, West Beni Suef concession, Western Desert, Egypt. Egypt. J. Petrol. 2014, 23, 135e149. [Google Scholar]
  16. Rocha, Y.S.; Rosana, C.; Lopes, P.; Joao, G.M.F. Geochemical assessment of oils from the mero field, Santos basin, Brazil. Org. Geochem. 2019, 130, 1–13. [Google Scholar]
  17. Soliman, S.R.; Salama, Y.F.; El-Sayed, M.I.; Abdel-Fattah, M.I.; Abd-Allah, Z.M. Assessment of mineralogical and geochemical composition of oligocene/eocene black shale deposits in beni suef area, Egypt. Adv. Mater. Sci. Eng. 2022, 2022, 1606431. [Google Scholar]
  18. El-Shafeiy, M.; Birgel, D.; El-Kammar, A.; El-Barkooky, A.; Wagreich, M.; Mohamed, O.; Peckmann, J. Palaeoecological and post-depositional changes recorded in campanian-maastrichtian black shales, abu tartur plateau, Egypt. Cretac. Res. 2014, 50, 38–51. [Google Scholar]
  19. Abd-Allah, Z.M.; Abdullah, W.H.; Abdel-Fattah, M.I. Assessment of Eocene, Paleocene and cretaceous source rocks in the west Feiran area, offshore Gulf of Suez, Egypt. J. Pet. Sci. Eng. 2019, 180, 756–772. [Google Scholar]
  20. Peters, K.E.; Walters, C.C.; Moldowan, J.M. The Biomarker Guide, Biomarkers and Isotopes in Petroleum Exploration and Earth History; CUP: New York, NY, USA, 2005; Volume 2, p. 1155. [Google Scholar]
  21. Saito, H.; Suzuki, N. Distributions and sources of hopanes, hopanoic acids and hopanols in miocene to recent sediments from ODP leg 190, nankai trough. Org. Geochem. 2007, 38, 1715–1728. [Google Scholar] [CrossRef]
  22. Thiel, V.; Hoppert, M. Fatty acids and other biomarkers in two early jurassic concretions and their immediate host rocks (lias δ buttenheim clay pit, bavaria, Germany). Org. Geochem. 2018, 120, 42–55. [Google Scholar] [CrossRef]
  23. Wang, J.B.; Gao, Z.Q.; Kang, Z.H.; Yang, Y.X.; Wei, R.; Qin, N.T. The sedimentary environment and geochemical characteristics of the source rocks in the Pusige Formation Sag, southwestern Tarim Basin, China. Nat. Gas Geosci. 2017, 28, 1723–1732. [Google Scholar]
  24. Hou, Q.D.; Ren, S.M.; Guo, T.X.; Zhou, Z.; Jin, J.H. Analysis of Geological Conditions of Permian Shale Oil and Gas in the Southwestern Depression of the Tarim Basin, Northwest China. Northwest. Geol. 2020, 53, 168–176. [Google Scholar]
  25. Liu, J.; Tian, L.; Yang, L.S.; Dai, D.D.; Zang, J.J. Particularity of Paleozoic hydrocarbon accumulation conditions in the Southwest Tarim Depression and its implications for petroleum exploration. Nat. Gas Ind. 2023, 43, 61–70. [Google Scholar]
  26. Cheng, X.G.; Huang, Z.B.; Chen, H.L.; Du, Z.L.; Li, K. Fault characteristics and division of tectonic units of the thrust belt in the front of the West Kunlun Mountains. Acta Petrol. Sin. 2012, 28, 2591–2601. [Google Scholar]
  27. Fang, W.X.; Wang, L.; Lu, J.; Li, T.C.; Jia, R.X. Mesozoic-Cenozoic Sedimentary Basin, Foreland Fold-and-Thrust Meralization Reglarities of Copper-lead-zinc-celesite-uranium-coal in Wulagen, Xinjiang, China. Geotecton. Metallog. 2020, 44, 882–908. [Google Scholar]
  28. Xie, X.M.; Hu, X.; Wang, Z.H.; Zhao, Y.; Xiao, Q.L. Geochemical characteristics and depositional environment of two sets of hydrocarbon source rocks in Qimeigan section, Permian system, Southwest Tarim Basin. J. Yangte Univ. Nat. Sci. Ed. 2024. [Google Scholar]
  29. Han, H.Y.; Kang, Z.H.; Deng, P.; Fu, K.N.; Qin, N.T. Comprehensive Analysis of Sedimentary Characteristics of Qipan Formation in Southwest Margin of Tarim Basin. Coal Technol. 2018, 37, 122–124. [Google Scholar]
  30. Behar, F.; Beaumont, V.; Penteado, H.L.D.B. RockEval 6 technology: Performances and developments. Oil Gas Sci. Technol. 2001, 56, 111–134. [Google Scholar] [CrossRef]
  31. Carvajal-Ortiz, H.; Gentzis, T. Critical considerations when assessing hydrocarbon plays using Rock-Eval pyrolysis and organic petrology data: Data quality revisited. Int. J. Coal Geol. 2015, 152, 113–122. [Google Scholar] [CrossRef]
  32. Mukhopadhyay, P.K.; Hatcher, P.G. Composition of Coal. In Hydrocarbons from Coal; Law, B.E., Rice, D.D., Eds.; American Association of Petroleum Geologists: Oklahoma City, OK, USA, 1993; Volume 36, pp. 79–118. [Google Scholar]
  33. Law, C.A. Evaluating Source Rocks. In Treatise Petroleum Geology/Handbook of Petroleum Geology: Exploring for Oil and Gas Traps; Beaumont, E.A., Foster, N.H., Eds.; American Association of Petroleum Geologists: Oklahoma City, OK, USA, 1999; pp. 6–41. [Google Scholar]
  34. Wilkins, R.W.T.; George, S.C. Coal as a source rock for oil: A review. Int. J. Coal Geol. 2002, 50, 317–361. [Google Scholar] [CrossRef]
  35. Philp, R.P.; Lewis, C.A. Organic geochemistry of biomarkers. Annu. Rev. Earth Planet Sci. 1987, 15, 363–395. [Google Scholar] [CrossRef]
  36. SY/T 5124-2012; Method for Determining Microscopically the Reflectance of Vitrinite in Sedimentary. China Research Institute of Petroleum Exploration and Development: Beijing, China, 2012.
  37. SY/T 6414-2014; Maceral Identification and Statistical Methods on Polished Surfaces of Whole Rocks. China Research Institute of Petroleum Exploration and Development: Beijing, China, 2014.
  38. GB/T 14506.30-2010; Methods for chemical analysis of silicate rocks—Part 30: Determination of 44 elements. SAC: Beijing, China, 2010.
  39. GB/T 14506.28-2010; Methods for chemical analysis of silicate rocks—Part 28: Determination of 16 major and minor elements content. SAC: Beijing, China, 2010.
  40. Simoneit, B.R.T. Molecular indicators (biomarkers) of past life. Anat. Rec. 2002, 268, 186–195. [Google Scholar] [CrossRef] [PubMed]
  41. Moustafa, Y.M.; Morsi, R.E. Biomarkers. In Chromatography and its Applications; Dhanarasu, S., Ed.; InTechOpen: London, UK, 2012; pp. 165–186. [Google Scholar]
  42. Peters, K.E.; Moldowan, J.M.; Schoell, M.; Hempkins, W.B. Petroleum isotopic and biomarker composition related to source rock organic matter and depositional environment. Org. Geochem. 1986, 10, 17–27. [Google Scholar] [CrossRef]
  43. Awan, R.S.; Liu, C.; Gong, H.; Dun, C.; Tong, C.; Chamssidini, L.G. Paleo-sedimentary environment in relation to enrichment of organic matter of early Cambrian black rocks of Niutitang formation from Xiangxi area China. Mar. Pet. Geol. 2020, 112, 104057. [Google Scholar] [CrossRef]
  44. Peters, K.E. Guidelines for evaluating petroleum source rock using programmed pyrolysis. AAPG Bull. 1986, 70, 318–329. [Google Scholar]
  45. Peters, K.E.; Cassa, M.R. Applied Source Rock Geochemistry. In The Petroleum System—From Source to Trap; Magoon, L.B., Dow, W.G., Eds.; American Association of Petroleum Geologists: Tulsa, OK, USA, 1994; Memoir 60; pp. 93–120. [Google Scholar]
  46. Burton, Z.; Dafov, L.N. Testing the sediment organic contents required for biogenic gas hydrate formation: Insights from synthetic 3-D basin and hydrocarbon system modelling. Fuels 2022, 3, 555–562. [Google Scholar] [CrossRef]
  47. Waples, D.W. Geochemistry in Petroleum Exploration; International Human Resources Development Corporation: Boston, MA, USA, 1985; p. 232. [Google Scholar]
  48. Baskin, D.K. Atomic H/C ratio of kerogen as an estimate of thermal maturity and organic matter conversion. AAPG Bull. 1997, 81, 1437–1450. [Google Scholar]
  49. Gonzalez, M.B.; Barrionuevo, S.; Peralba, C.M.; Kalkreuth, W. Geochemical characterization of Jurassic source rocks from Cuba: 2 Constancia formation in onshore Varadero oils fields. Energy Explor. Exploit. 2014, 32, 847–872. [Google Scholar] [CrossRef]
  50. Shi, J.P.; Zhao, C.Y.; Liu, H.T.; Li, C.M. Discussion on several problems about source-rock evaluation. Nat. Gas Explor. Dev. 2021, 44, 13–21. [Google Scholar]
  51. Tissot, B.P.; Welte, D.H. Petroleum Formation and Occurrence, 2nd ed.; Springer: New York, NY, USA, 1984; p. 699. [Google Scholar]
  52. Awan, R.S.; Liu, C.; Aadil, N.; Yasin, Q.; Salaam, A.; Hussain, A.; Yang, S.; Jadoon, A.K.; Wu, Y.; Gul, M.A. Organic geochemical evaluation of cretaceous Talhar shale for shale oil and gas potential from lower Indus Basin, Pakistan. J. Pet. Sci. Eng. 2021, 200, 108404. [Google Scholar] [CrossRef]
  53. Gao, G.; Titi, A.; Yang, S.; Tang, Y.; Kong, Y.; He, W. Geochemistry and depositional environment of fresh lacustrine source rock: A case study from the Triassic Baijiantan formation shales in Junggar Basin, northwest China. Org. Geochem. 2017, 113, 75–89. [Google Scholar]
  54. Armagnac, C.; Bucci, J.; Kendall, G.; Lerche, I. Estimating the Thickness of Sediment Removed at an Unconformity Using Vitrinite Reflectance Data; Springer: New York, NY, USA, 1989; pp. 217–238. [Google Scholar]
  55. Lerche, I.; Yarzab, R.F.; Kendall, C. Determination of paleoheat flux from vitrinite reflectance data. AAPG Bull. 1984, 68, 1704–1717. [Google Scholar]
  56. Volkman, J.K.; Maxwell, J.R. Acyclic Isoprenoids as Biological Markers. In Biological Markers in the Sedimentary Record; Johns, R.B., Ed.; Elsevier: Amsterdam, The Netherlands, 1986. [Google Scholar]
  57. El-Mansey, I.M.; Shehata, M.G.; Massoud, M.A.; Awad, S.A. Geochemical studies on subsurface Paleozoic Sediments from some wells in Siwa-Faghur basin, Western Desert, Egypt. Egypt. J. Petrol. 2004, 13, 91–106. [Google Scholar]
  58. Mamdouh, M.; Reda, M.; Raef, A.; Zein El Din, M.Y.; Abdelhafeez, T.H.; AlHashim, M.H. Reservoir Quality, Lithotypes Assessment, and Geochemical Source Rocks Analysis: Insights from Well Logs and Pyrolysis Data, Karama Field. North-Western Desert, Egypt. Geofluids 2024, 2024, 1235792. [Google Scholar]
  59. Hunt, J.H. Petroleum Geochemistry and Geology; W.H. Freeman: San Francisco, CA, USA, 1979; p. 617. [Google Scholar]
  60. Wang, J.B. Geochemical Characteristics of Source Rocks of the Jurassic Poplar Leaf Formation in the Kashgar sag in Southwest Taxi; China University of Geosciences: Beijing, China, 2017. [Google Scholar]
  61. Huang, Z.S.; Wang, X.Z.; Yang, X.Y. Constraints of sedimentary environment on organic matter enrichment in shale: A case study of Wufeng Formation-Longmaxi Formation in southern Shunan. J. Sedimentol. 2021, 39, 631–644. [Google Scholar]
Figure 1. The study area was located in the southwestern part of the Tarim Basin in China. (a) Geological map of Tarim Basin and the (b) structural division of piedmont southwestern in Tarim Basin and (c) stratigraphic column in the study area (adapted from [22,25]).
Applsci 14 08634 g001
Figure 2. (a) NE-trending profile through Kashi anticline and (b) NE-trending profile through Qimeigan anticline showing the stratigraphic framework of piedmont southwestern in Tarim Basin.
Applsci 14 08634 g002
Figure 3. (a) Outcrop exposures of the Permian Qipan Formation in Qiemugan section. (b) Outcrop exposures of the Akeqi section. (c,d) Outcrop exposures of the Qimeigan section. (e) Satellite map showing the lateral trace of outcrop sections of piedmont southwestern in the Tarim Basin.
Applsci 14 08634 g003
Figure 4. Lithology, geochemical characteristics, and sedimentary facies in the Permian Qipan Formation of Qimeigan outcrop section.
Applsci 14 08634 g004
Figure 5. The images present the lithological characteristics of the hydrocarbon source rocks of the Permian Qipan Formation. (a) Dark gray mudstone in Qimeigan section. (b) Calcareous sandstone and mudstone in Qimeigan section. (c) Dark mudstone at the bottom of P1-2q in Qimeigan section. (d,e) Mudstone interbedded with siltstone at the top of the P1-2q in Qimeigan section. (f) Black mudstone thin layer mudstone crystal limestone in Qiemugan section. (g) Thin layer dark gray calcareous mudstone in Qiemugan section. (h) Gray green mudstone sandstone in Qiemugan section. (i) Black mudstone in Qiemugan section. (j) Dark gray mudstone in Qiemugan section. (k) Large scale dark mudstone in Akeqi section. (l) Bioclastic limestone in Akeqi section.
Applsci 14 08634 g005
Figure 6. The images present the sedimentary characteristic of the Permian Qipan Formation. (a) Frontal delta mud in Qimeigan section. (b) Tributary bay in Qiemugan section. (c,d) Channel deposits in Qiemugan section. (e) Tabular cross-bedding in Qiemugan section. (f) Riverbed rhythmic sedimentation in Qiemugan section. (g) Riverbed retention and erosion surface in Qiemugan section. (h) Bouma sequence in Akeqi section. (i) Sandstone flute cast in Akeqi section.
Applsci 14 08634 g006
Figure 7. Lithology, geochemical characteristics, and sedimentary facies in the Permian Qipan Formation of Qiemugan outcrop section.
Applsci 14 08634 g007
Figure 8. Lithology, geochemical characteristics, and sedimentary facies in the Permian Qipan Formation of Akeqi outcrop section.
Applsci 14 08634 g008
Figure 9. Tmax distribution (a) and organic matter types (b) of Permian Qipan Formation hydrocarbon source rocks in the piedmont southwestern Tarim Basin.
Applsci 14 08634 g009
Figure 10. TIC, m/z 191, and m/z 217 mass chromatograms of the Permian Qipan Formation in the piedmont southwestern Tarim Basin. (a) Sample from Qiemugan outcrop section; (b) sample from Qimeigan outcrop section.
Applsci 14 08634 g010
Figure 11. TOC distribution (a) and plot of TOC vs. S1 + S2 (b) of Permian Qipan Formation source rocks in the piedmont southwestern Tarim Basin.
Applsci 14 08634 g011
Figure 12. Representative photomicrographs for hydrocarbon source rocks of Permian Qipan Formation in the piedmont southwestern Tarim: (af) Hydrocarbon source socks from the Qimeigan section. (g) Hydrocarbon source socks from the Akeqi section. (h,i) Hydrocarbon source socks from the Well Qiatan-1.
Applsci 14 08634 g012
Figure 13. Comparison profile of Qipan Formation in the piedmont southwestern Tarim Basin (location of outcrop is shown in Figure 1b).
Applsci 14 08634 g013
Figure 14. Sedimentary facies map of Permian Qipan Formation in the piedmont southwestern Tarim Basin (adapted from [22]).
Applsci 14 08634 g014
Figure 15. (a) The relative proportions of SiO2, Al2O3, and CaO were determined by triangulation. (b) The relative proportions of TOC, S, and Fe were determined by triangulation.
Applsci 14 08634 g015
Figure 16. Identification map of paleosalinity. (a) Scatterplot of TOC content versus Sr/Ba. (b) Scatterplot of TOC content versus B/Ga.
Applsci 14 08634 g016
Figure 17. TiO2 and Al2O3 correlation indicator map. (a) P1-2q in Qimeigan section. (b) P1-2q in Paojianggou section.
Applsci 14 08634 g017
Disclaimer/Publisher’s Note: The statements, opinions and data contained in all publications are solely those of the individual author(s) and contributor(s) and not of MDPI and/or the editor(s). MDPI and/or the editor(s) disclaim responsibility for any injury to people or property resulting from any ideas, methods, instructions or products referred to in the content.

