Review

Rock Wettability Alteration Induced by the Injection of Various Fluids: A Review

by
Darezhat Bolysbek
1,2,3,
Kenbai Uzbekaliyev
1,2 and
Bakytzhan Assilbekov
1,2,*
1
U.A. Joldasbekov Institute of Mechanics and Engineering, Almaty 050013, Kazakhstan
2
Laboratory of Computational Modeling and Information Technologies, Satbayev University, Almaty 050013, Kazakhstan
3
Department of Mechanics, Al-Farabi Kazakh National University, Almaty 050040, Kazakhstan
*
Author to whom correspondence should be addressed.
Appl. Sci. 2024, 14(19), 8663; https://doi.org/10.3390/app14198663
Submission received: 28 August 2024 / Revised: 19 September 2024 / Accepted: 20 September 2024 / Published: 26 September 2024
(This article belongs to the Section Earth Sciences)

Abstract

:
Wettability is a key parameter that determines the distribution and behavior of fluids in the porous media of oil reservoirs. Understanding and controlling wettability significantly impacts the effectiveness of various enhanced oil recovery (EOR) methods and CO2 sequestration. This review article provides a comprehensive analysis of various methods for measuring and altering wettability, classifying them by mechanisms and discussing their applications and limitations. The main methods for measuring wettability include spontaneous imbibition methods such as Amott–Harvey tests and USBM, contact angle measurement methods, and methods based on the characteristics of imbibed fluids such as infrared spectroscopy (IR) and nuclear magnetic resonance (NMR). These methods offer varying degrees of accuracy and applicability depending on the properties of rocks and fluids. Altering the wettability of rocks is crucial for enhancing oil recovery efficiency. The article discusses methods such as low-salinity water flooding (LSWF), the use of surfactants (SAAs), and carbonated water injection (CWI). LSWF has shown effectiveness in increasing water wettability and improving oil displacement. Surfactants alter interfacial tension and wettability, aiding in better oil displacement. CWI also contributes to altering the wettability of the rock surface to a more water-wet state. An important aspect is also the alteration of wettability through the dissolution and precipitation of minerals in rocks. The process of dissolution and precipitation affects pore structure, capillary pressure, and relative permeabilities, which in turn alters wettability and oil displacement efficiency.

1. Introduction

The wettability of rock formations is a fundamental parameter that determines the interaction between fluids and the solid phase surface, hydrogeological processes, and water resource management. This property has a significant impact on single- or multiphase fluid flow in porous media during such processes as the production of hydrocarbons from oil and gas reservoirs, carbon capture and storage into a geological aquifer, and the monitoring of the quality of underground water. In the production of hydrocarbons, wettability dictates the efficiency of displacement of hydrocarbons by water or other agents, directly influencing the hydrocarbon recovery factor. Understanding and controlling wettability is crucial for optimizing oil and gas production, as well as for developing new enhanced oil recovery (EOR) techniques [1,2].
The wettability of rock surfaces depends on a multitude of factors, including the mineral composition of the rock, the types of fluids present, and the pore structures. These factors can vary significantly depending on geological conditions and reservoir characteristics, making the task of controlling wettability complex and multifaceted [3,4]. Additionally, changes in wettability can occur both naturally and as a result of the application of various technological methods.
The methods for evaluating rock wettability are diverse and offer unique advantages. The Amott–Harvey and USBM tests measure the rock’s ability to absorb fluids and are widely used in practice [5,6,7,8,9,10,11,12,13]. Contact angle measurement provides information on surface wettability. Advanced techniques, such as micro-CT and SEM, provide detailed data at the microscopic level [14,15,16,17,18,19,20,21,22,23]. Methods like IR spectroscopy and NMR allow for the analysis of chemical composition and wettability changes [24,25,26,27,28,29,30,31,32,33,34,35]. Analytical approaches, including the Lakh method and its modifications, assess wettability based on relative permeability curves [36,37,38].
Altering the wettability of rocks is a key process in an enhanced oil recovery. Several methods for changing wettability are actively being studied and utilized in the oil industry. One of the most promising methods is the low-salinity water flooding (LSWF) technique. Reducing the salinity of injected water can increase the water wettability of the rock and improve oil displacement. Studies have shown that LSWF promotes the desorption of ions from the rock surface and reduces interfacial tension, ultimately leading to increased oil recovery [39,40,41,42,43,44,45,46,47].
Another important method involves the use of surfactants, which can significantly alter interfacial tension and wettability [48,49,50]. Surfactants are capable of reducing the surface tension between oil and water, thereby facilitating improved oil displacement [51,52,53,54,55,56]. Cationic and anionic surfactants interact with rock surfaces in various ways, facilitating control over wettability and an increase in the oil recovery factor [26,57,58,59,60,61,62].
Carbonated water injection (CWI) is yet another method that has gained popularity in recent years. Introducing CO2 into the injected water can alter the wettability of the rock, making it more water-wet and thereby enhancing oil recovery [63,64]. An additional advantage of this method is the reduction in greenhouse gas emissions, as CO2 is sequestered in underground reservoirs [65,66,67,68,69,70].
Furthermore, chemical reactions occurring between the rock surface and reactants can significantly influence the wettability of the rock surface. The dissolution and blockage of minerals in rocks alter the pore structure, which affects phase distribution and, consequently, the relative permeability and oil recovery factor [71,72]. Studies have shown that the introduction of certain chemical reagents can promote the stability of the pore structure and precipitation [71,72].
Thus, understanding the mechanisms and factors influencing rock wettability is crucial for developing effective strategies for managing multiphase fluid flows in porous media. Unlike previous studies that have focused on individual methods in isolation, this review integrates the latest findings on the interplay between wettability, pore structure, and fluid dynamics. The aim of this review paper is to provide a comprehensive overview of various methods for measuring and altering rock wettability. Furthermore, this paper introduces a method for the evaluation of wettability alteration, considering factors such as mineral dissolution and pore precipitation, which have been relatively underexplored in the literature. To calculate the wettability index (WI) [36], relative phase permeability data in [71,72] were used according to two mechanisms, namely dissolution and precipitation, and the effects of sample properties and pore structure on wettability were studied.

2. Wettability Measurement Methods

The choice of a wettability measurement method depends on the properties of the fluid and surface, the accuracy required, and the equipment available. In this paper, we have roughly divided wettability measurement methods into four categories based on their underlying mechanisms: methods that take into account the effect of the spontaneous absorption of liquid by the rock, methods that measure the contact angle between the rock surface and the liquid droplet, methods that take into account the characteristics of liquids absorbed by the rock, and analytical methods for determining wettability with already available relative phase permeability curve data.
It is important to note that methods based on contact angle measurements reflect the local wettability of the sample, which depends on surface roughness and chemistry. Other methods indicate the apparent wettability.

2.1. Methods Based on Spontaneous Absorption of Liquid by Rock and Capillary Pressure

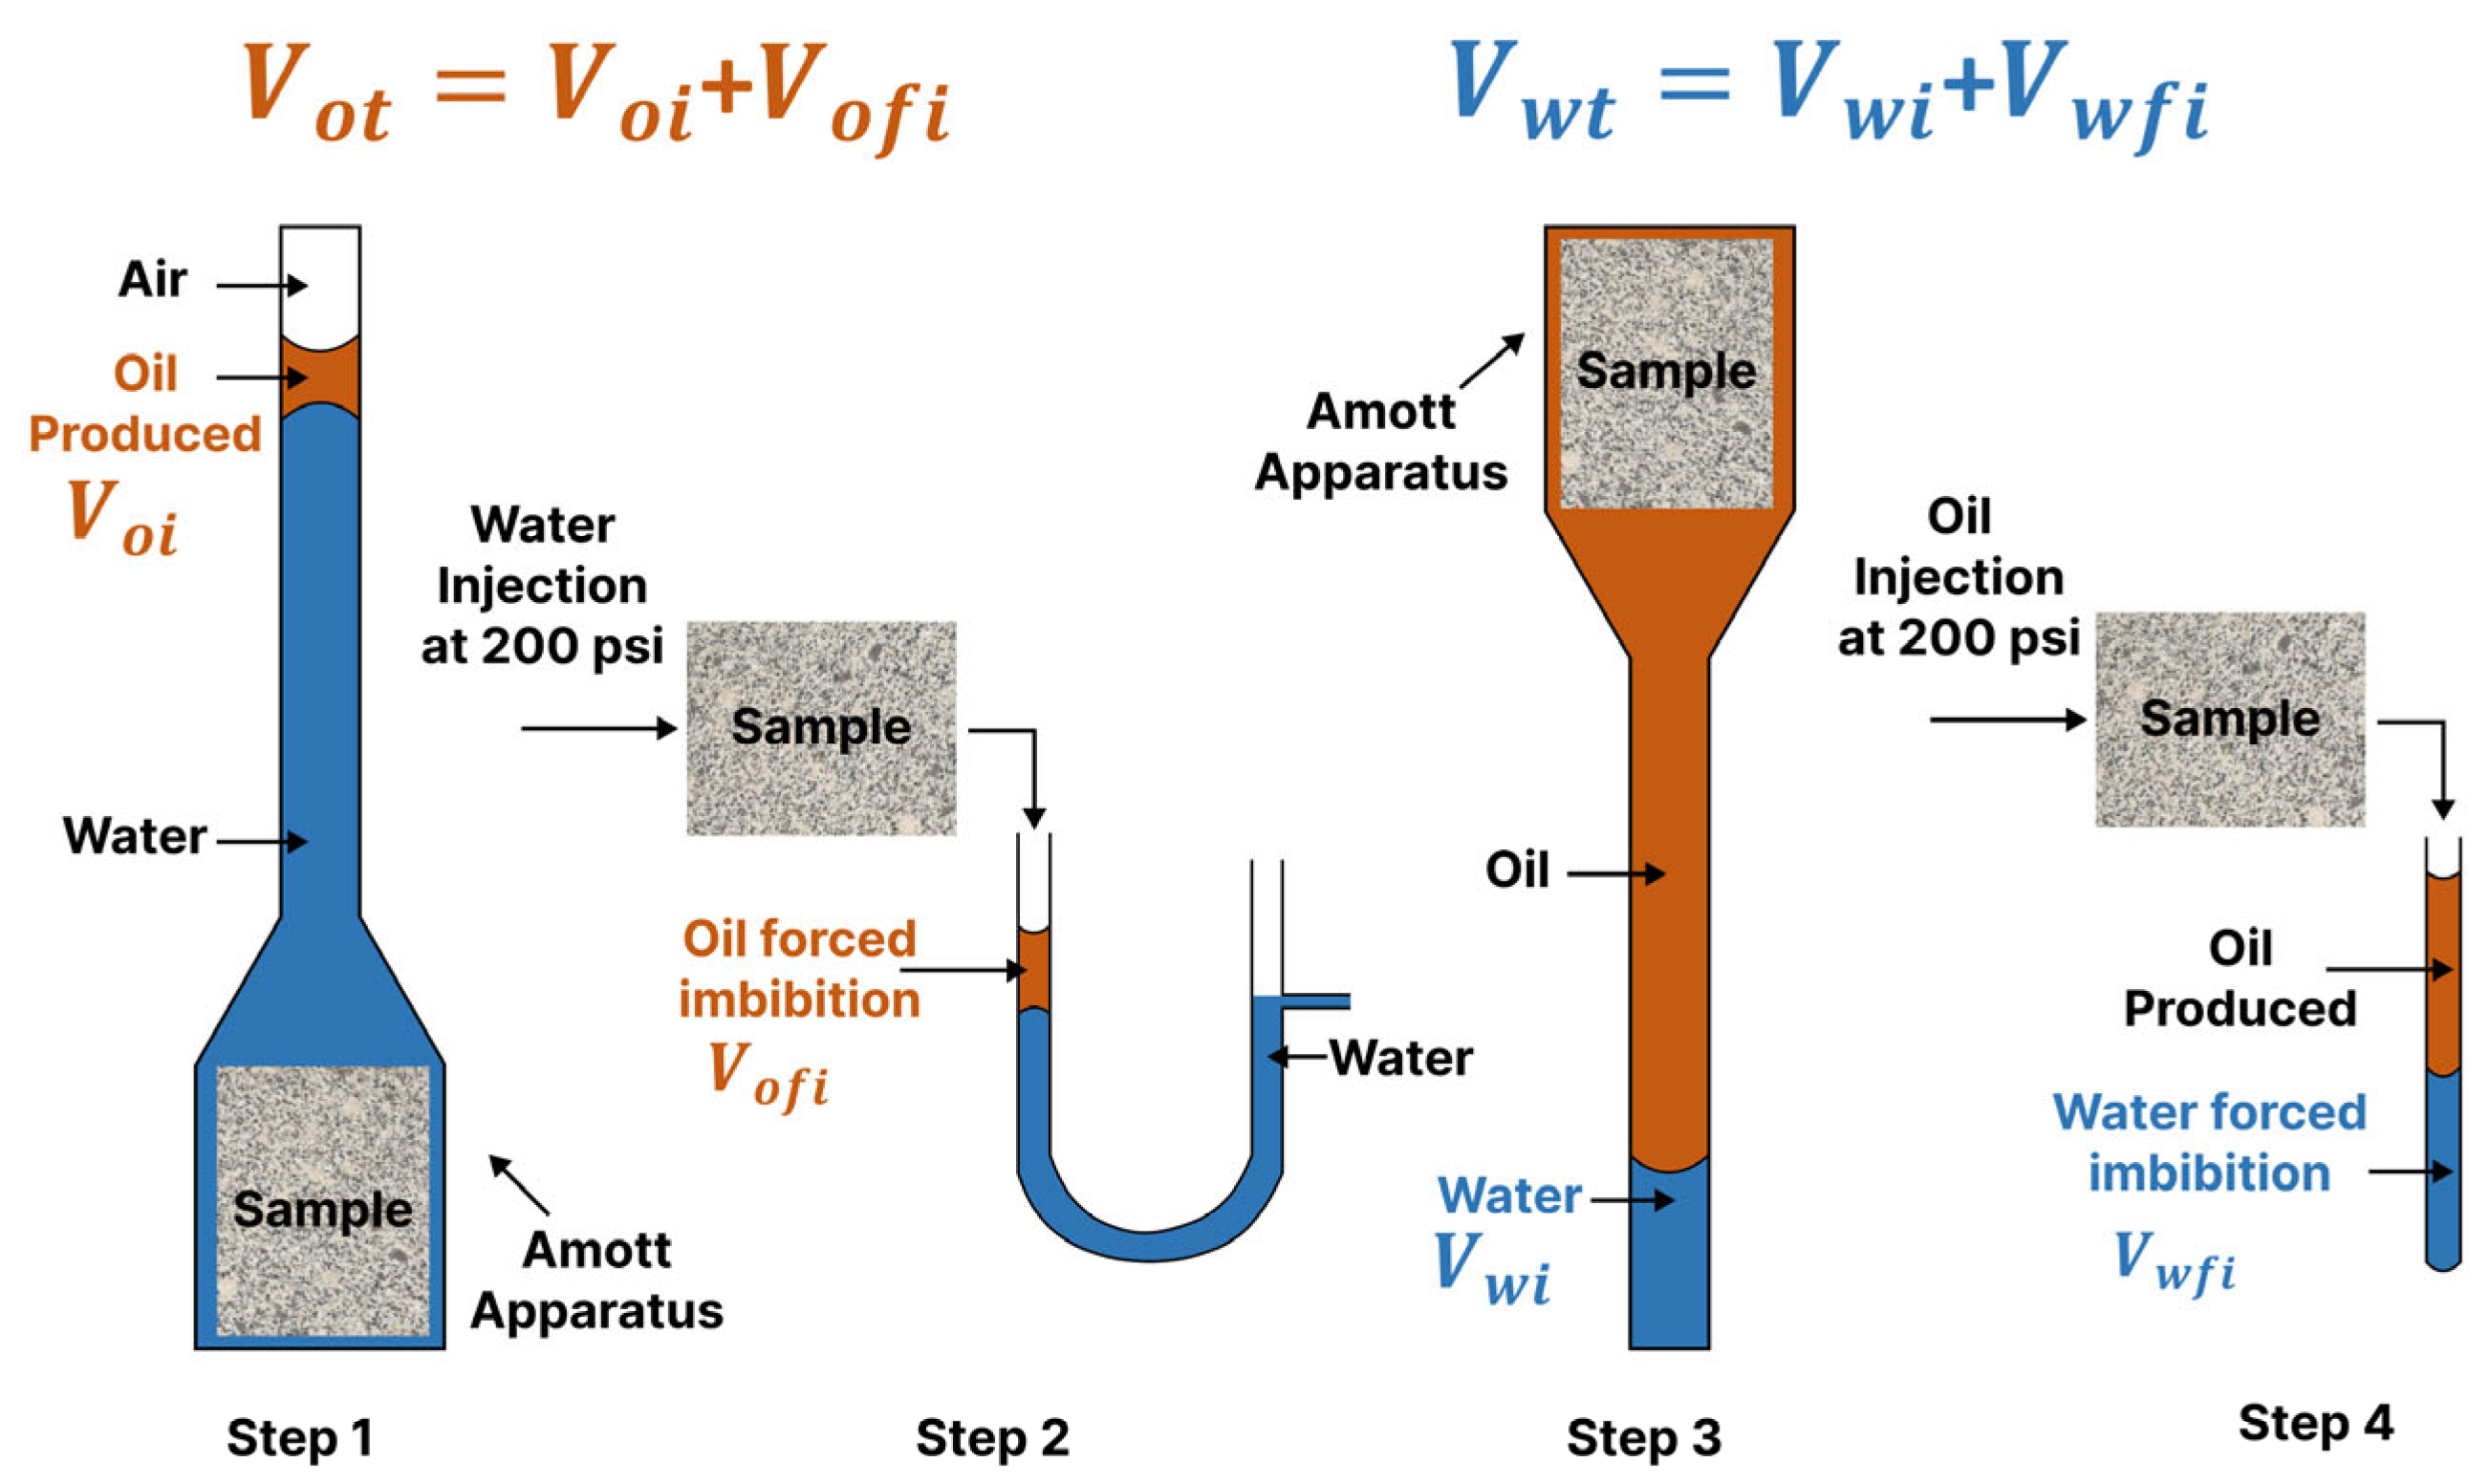
2.1.1. Amott–Harvey Test

The Amott–Harvey test is a reliable method for determining the wettability of reservoir rocks at the core scale and consists of four steps aimed at assessing wettability. Two of these stages involve spontaneous imbibition processes (Figure 1: steps 1 and 3), while the other two involve forced displacement processes (Figure 1: steps 2 and 4) [6,7]. First, a sample pre-saturated with oil is immersed in the Amott apparatus for an extended period, and the volume of oil spontaneously displaced by water is measured (Figure 1: steps 1). Next, water is forcibly injected into the core using a centrifuge, and the total volume of displaced oil is recorded (Figure 1: steps 2). In steps 3 and 4, the procedure is repeated, but this time, the fluids are reversed: oil is first spontaneously imbibed into the sample, followed by its forced injection to displace water.
The injection pressure plays a critical role in ensuring the correct execution of the test. It must be high enough to ensure efficient fluid displacement from the rock but not so high as to damage the sample or create improper flow conditions [73,74]. During forced imbibition, it is important to control the injection pressure to achieve a fluid flow rate that accurately reflects reservoir conditions. This allows for more effective modeling of real conditions and the acquisition of reliable data on fluid displacement and wettability indices.
The test can be described by the conduction of two Amott measurements in which the Amott water ( I w ) and oil ( I o ) indices are determined as follows [6]:
I w = V o i V o t ,     I o = V w i V w t
where V o i is the volume of oil displaced by spontaneous imbibition of water, and V o t denotes the total volume of oil displaced by spontaneous and forced imbibition of water; ( V w i ) and ( V w t ) represent the volume of water displaced by the spontaneous imbibition of oil and the total volume of water displaced by the spontaneous and forced imbibition of oil, respectively (Figure 1). The Amott–Harvey wettability index I A H is defined as the difference between ( I w ) and ( I o ) [6]:
I A H = I w I o
The values of the Amott–Harvey wettability index I A H , calculated by Equation (1), are depicted in Table 1. The Amott–Harvey wettability index I A H ranges from −1 to 1 describing strongly oil-wet ( I A H = 1 ), strongly water-wet ( I A H = 1 ) and mixed-wet ( I A H from 0.3 to 0.3 ) rocks.
The main limitation of the Amott–Harvey test is its insensitivity to the wettability of samples with values close to neutral [75]. Additionally, this test is time-consuming, as there is no clear criterion for determining the endpoint of the spontaneous imbibition stage for either water or oil. In some experiments, this stage may take around 20 h, but in several studies, the imbibition time extended up to 10 days [8,76,77]. Insufficient exposure of samples during the spontaneous imbibition stage can lead to the underestimation of their wettability [75,78].

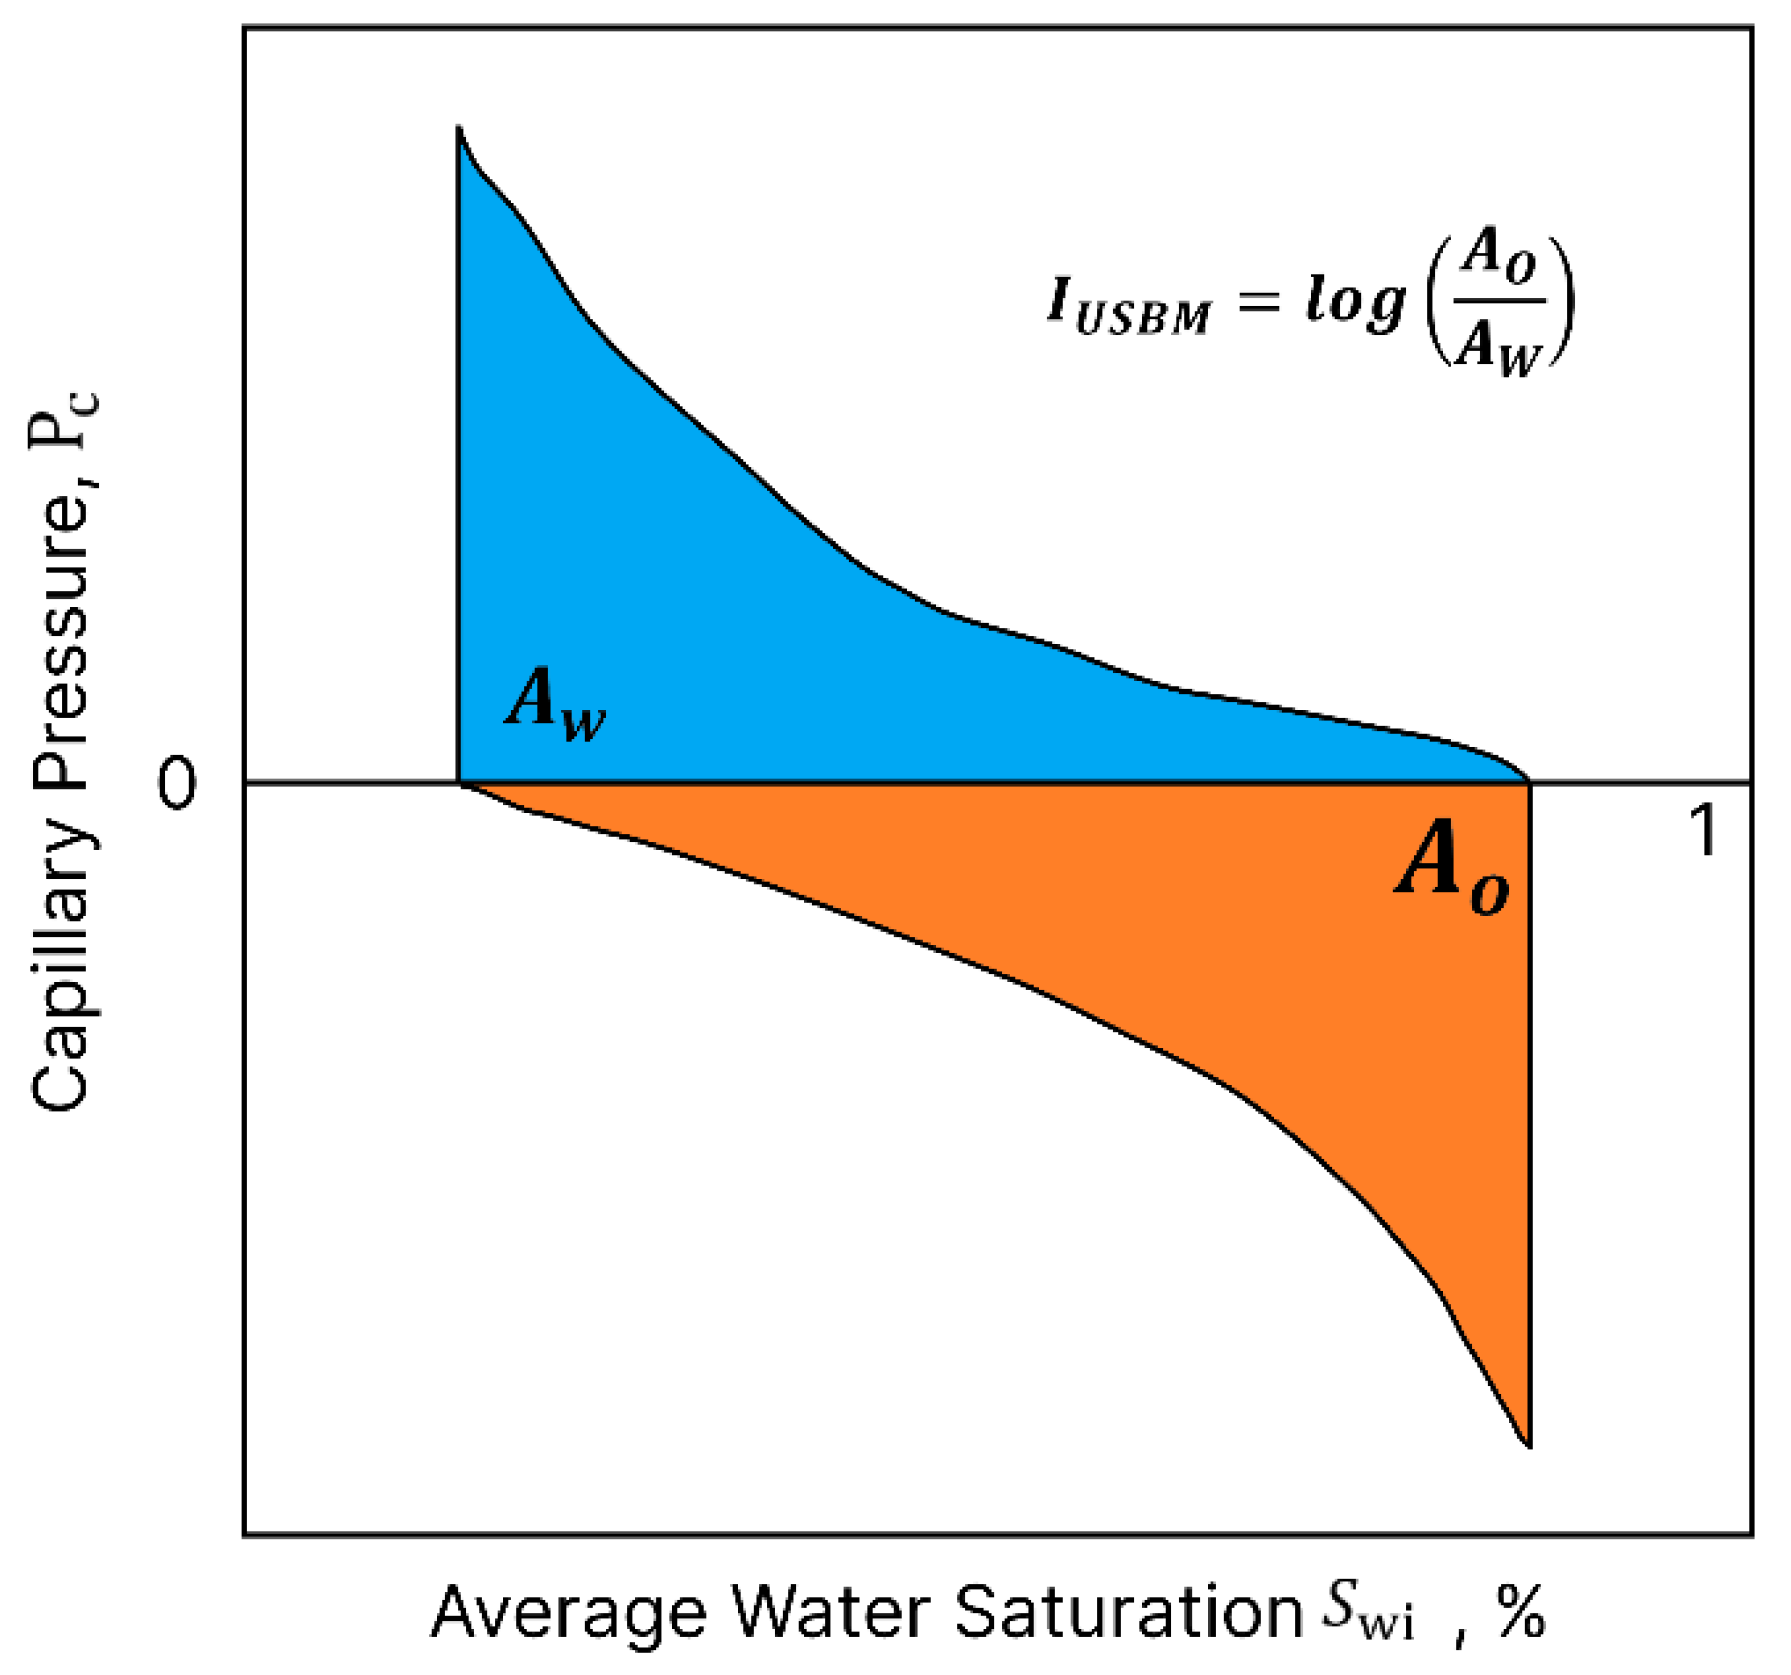
2.1.2. United States Bureau of Mines (USBM) Method

The USBM wettability evaluation method follows the same steps as the Amott–Harvey test. The USBM index is defined as the logarithmic ratio between the area under the capillary pressure curve of the oil displacement curve A O and the area under the water displacement curve A W (see Figure 2) using Equation (3) [9] as follows:
I U S B M = l o g A O A W
The USBM wettability index values are most often in the range from −2 to 2 [10]. The results of the assessment of rock wettability according to the USBM wettability index value are presented in Table 2. The USBM method as well as the Amott–Harvey method allow for the determination of core wettability, and they are reliable, but the former allows for the determination of wettability values close to neutral. The limitation of this method is its cost, complexity, and relative slowness, as it takes 1–2 days.
The USBM method differs from the Amott–Harvey test in that it does not involve the spontaneous imbibition of the sample. This accelerates the process of obtaining wettability results and makes the method more sensitive to samples with neutral wettability [75]. It cannot be definitively stated that one method is superior to the other, as each has its own limitations. Therefore, in practice, both methods are often used simultaneously to provide a more accurate assessment of sample wettability [76,77].

2.1.3. Flotation Test

The flotation test is based on the preference of a solid material for one liquid over another [79]. When rock particles are water-wet, they tend to adhere more strongly to water than to oil, causing them to sink in the oil phase, as they prefer contact with water. Conversely, if the particles are oil-wet, they will exhibit a stronger affinity for oil. This results in the particles floating on the surface of the water phase, as they preferentially adhere to the oil. To determine wettability using the flotation test, the rock sample is crushed to a known particle size. The crushed particles are then placed in a two-phase liquid system and gently agitated. After some time, the volume of particles floating in each liquid is measured, as shown in Figure 3 [11,12].
This method is convenient and quick, but it has limitations. Crushing the sample destroys its porous structure, and the test works best in systems with high wettability. The results are also influenced by the size, density, and composition of the particles, which can distort the assessment of wettability [13,75].

2.2. Methods Based on Contact Angle Measurement

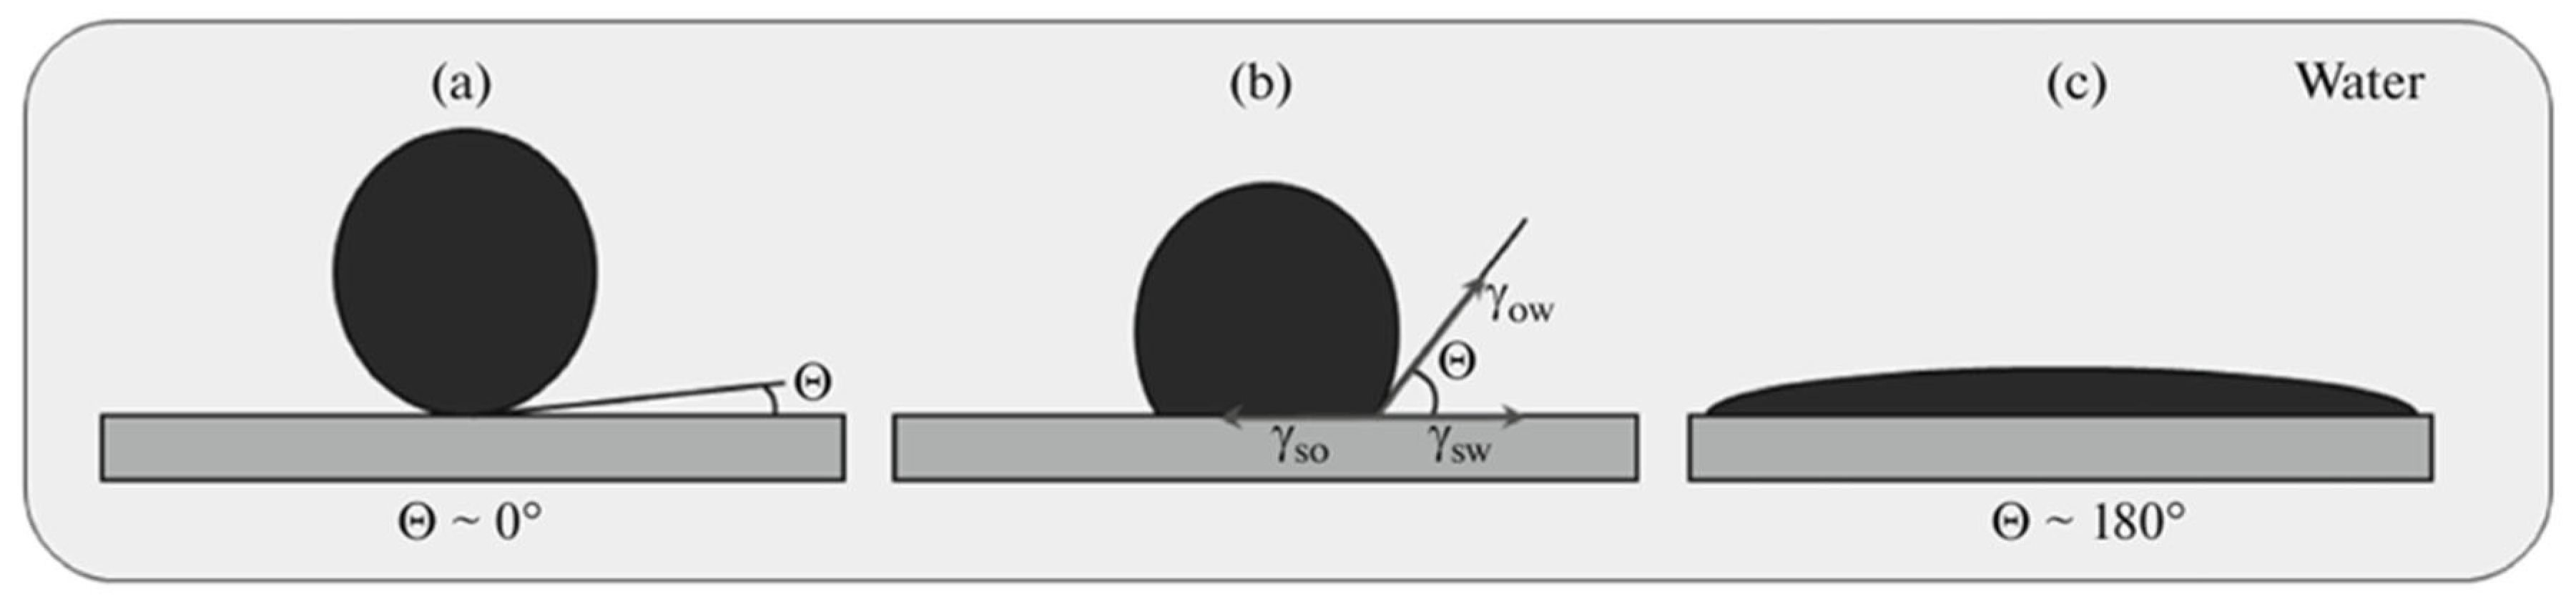
2.2.1. Visual Contact Angle Measurement Method

Contact angle measurement techniques are widely used to determine the wettability of rock. A drop of liquid is applied to a cleaned and dried rock sample using a needle. The droplet lying on the surface of the sample is captured with a camera, and the software measures the angle between the droplet and the rock surface, as shown in Figure 2 [14]. The contact angle value serves as a criterion for assessing the wettability, as shown in Table 3. A schematic illustration is provided in Figure 4 [15].
The visual contact angle measurement method quickly and conveniently determines wettability at the surface but does not report information about wettability within the sample [16].

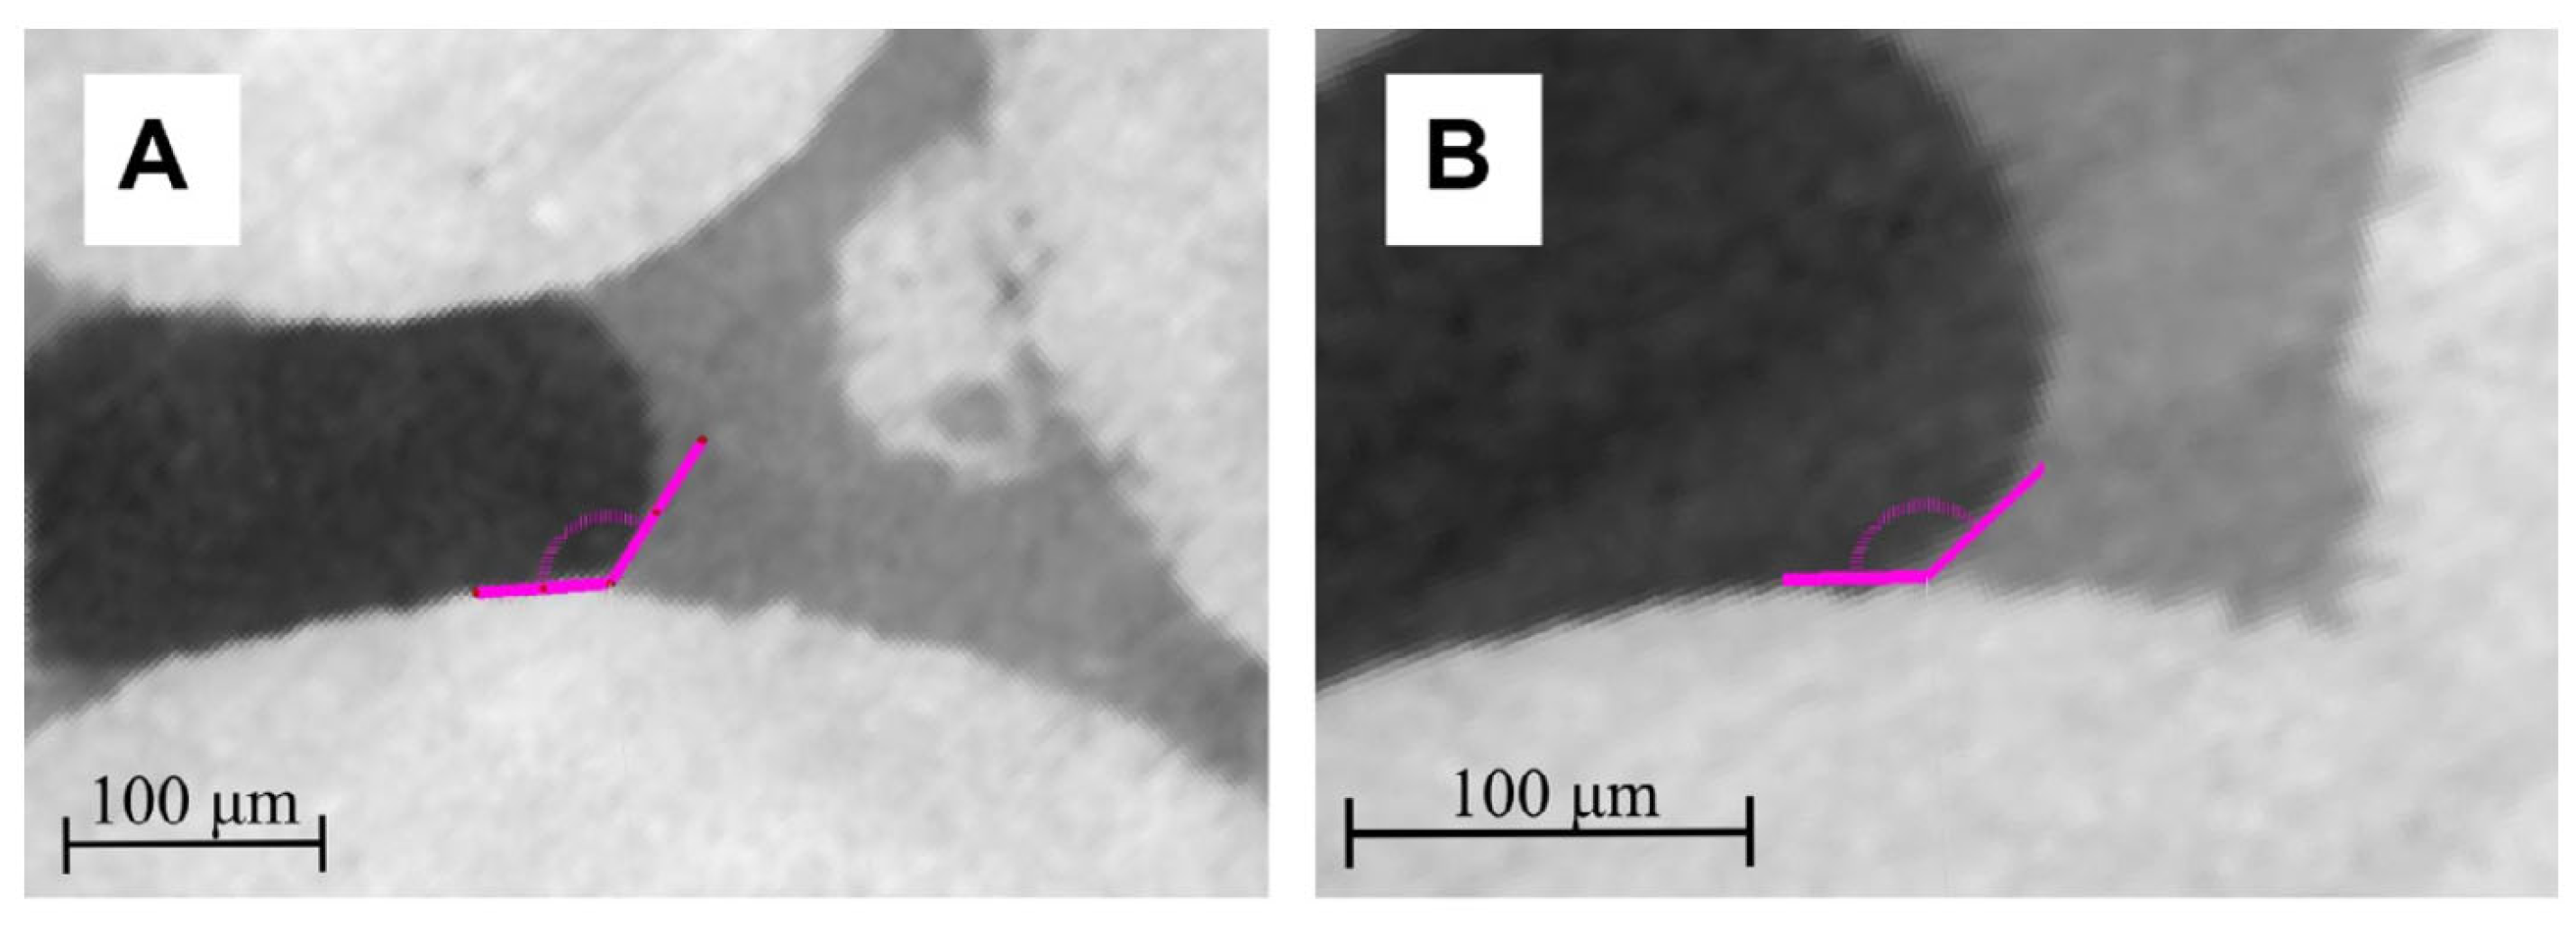
2.2.2. Contact Angle Measurement Using micro-CT

With the help of microcomputed tomography (micro-CT), it is possible to obtain a three-dimensional visualization of rocks, which makes it possible to extract information about oil and water distribution in pore structures, as well as pore distribution, interfacial tension, and absolute permeability [18]. In order to correct the mapping of pore space, filtration and segmentation operations are carried out in which water and oil saturation are used. Additionally, wettability is determined through contact angle, as shown in Figure 5.
When scanning a sample with micro-CT, the integrity of the rock is not destroyed, which is an advantage. Limitations of this method are its accuracy, which depends on the resolution of micro-CT; errors during data segmentation; heterogeneity of wettability measured at different points of the sample; and its high cost [18,19].

2.2.3. Contact Angle Measurement Using SEM

The idea of bombarding the surface of samples with beams of high-energy electrons appeared in the 1930s. At this stage of technology development, scanning electron microscopy (SEM) is used to analyze the crystal structure, chemical composition, and surface topography of samples under various conditions [21]. The use of SEM in combination with X-ray mapping for different rock types helps to understand the wetting heterogeneity at the micro level [22,23]. Figure 4 shows the surface images of carbonate rock before (Figure 6a) and after (Figure 6b) soaking it under palmatine acid. Correspondingly, the measured contact angles before and after soaking are shown in Figure 6c and Figure 6d, respectively. With SEM, it is possible to obtain high-quality images of the sample surface, which requires a corresponding computational power. This implies the costliness of this method and the lack of information about the wettability within the rock matrix.

2.3. Methods That Consider the Characteristics of Liquid Absorption

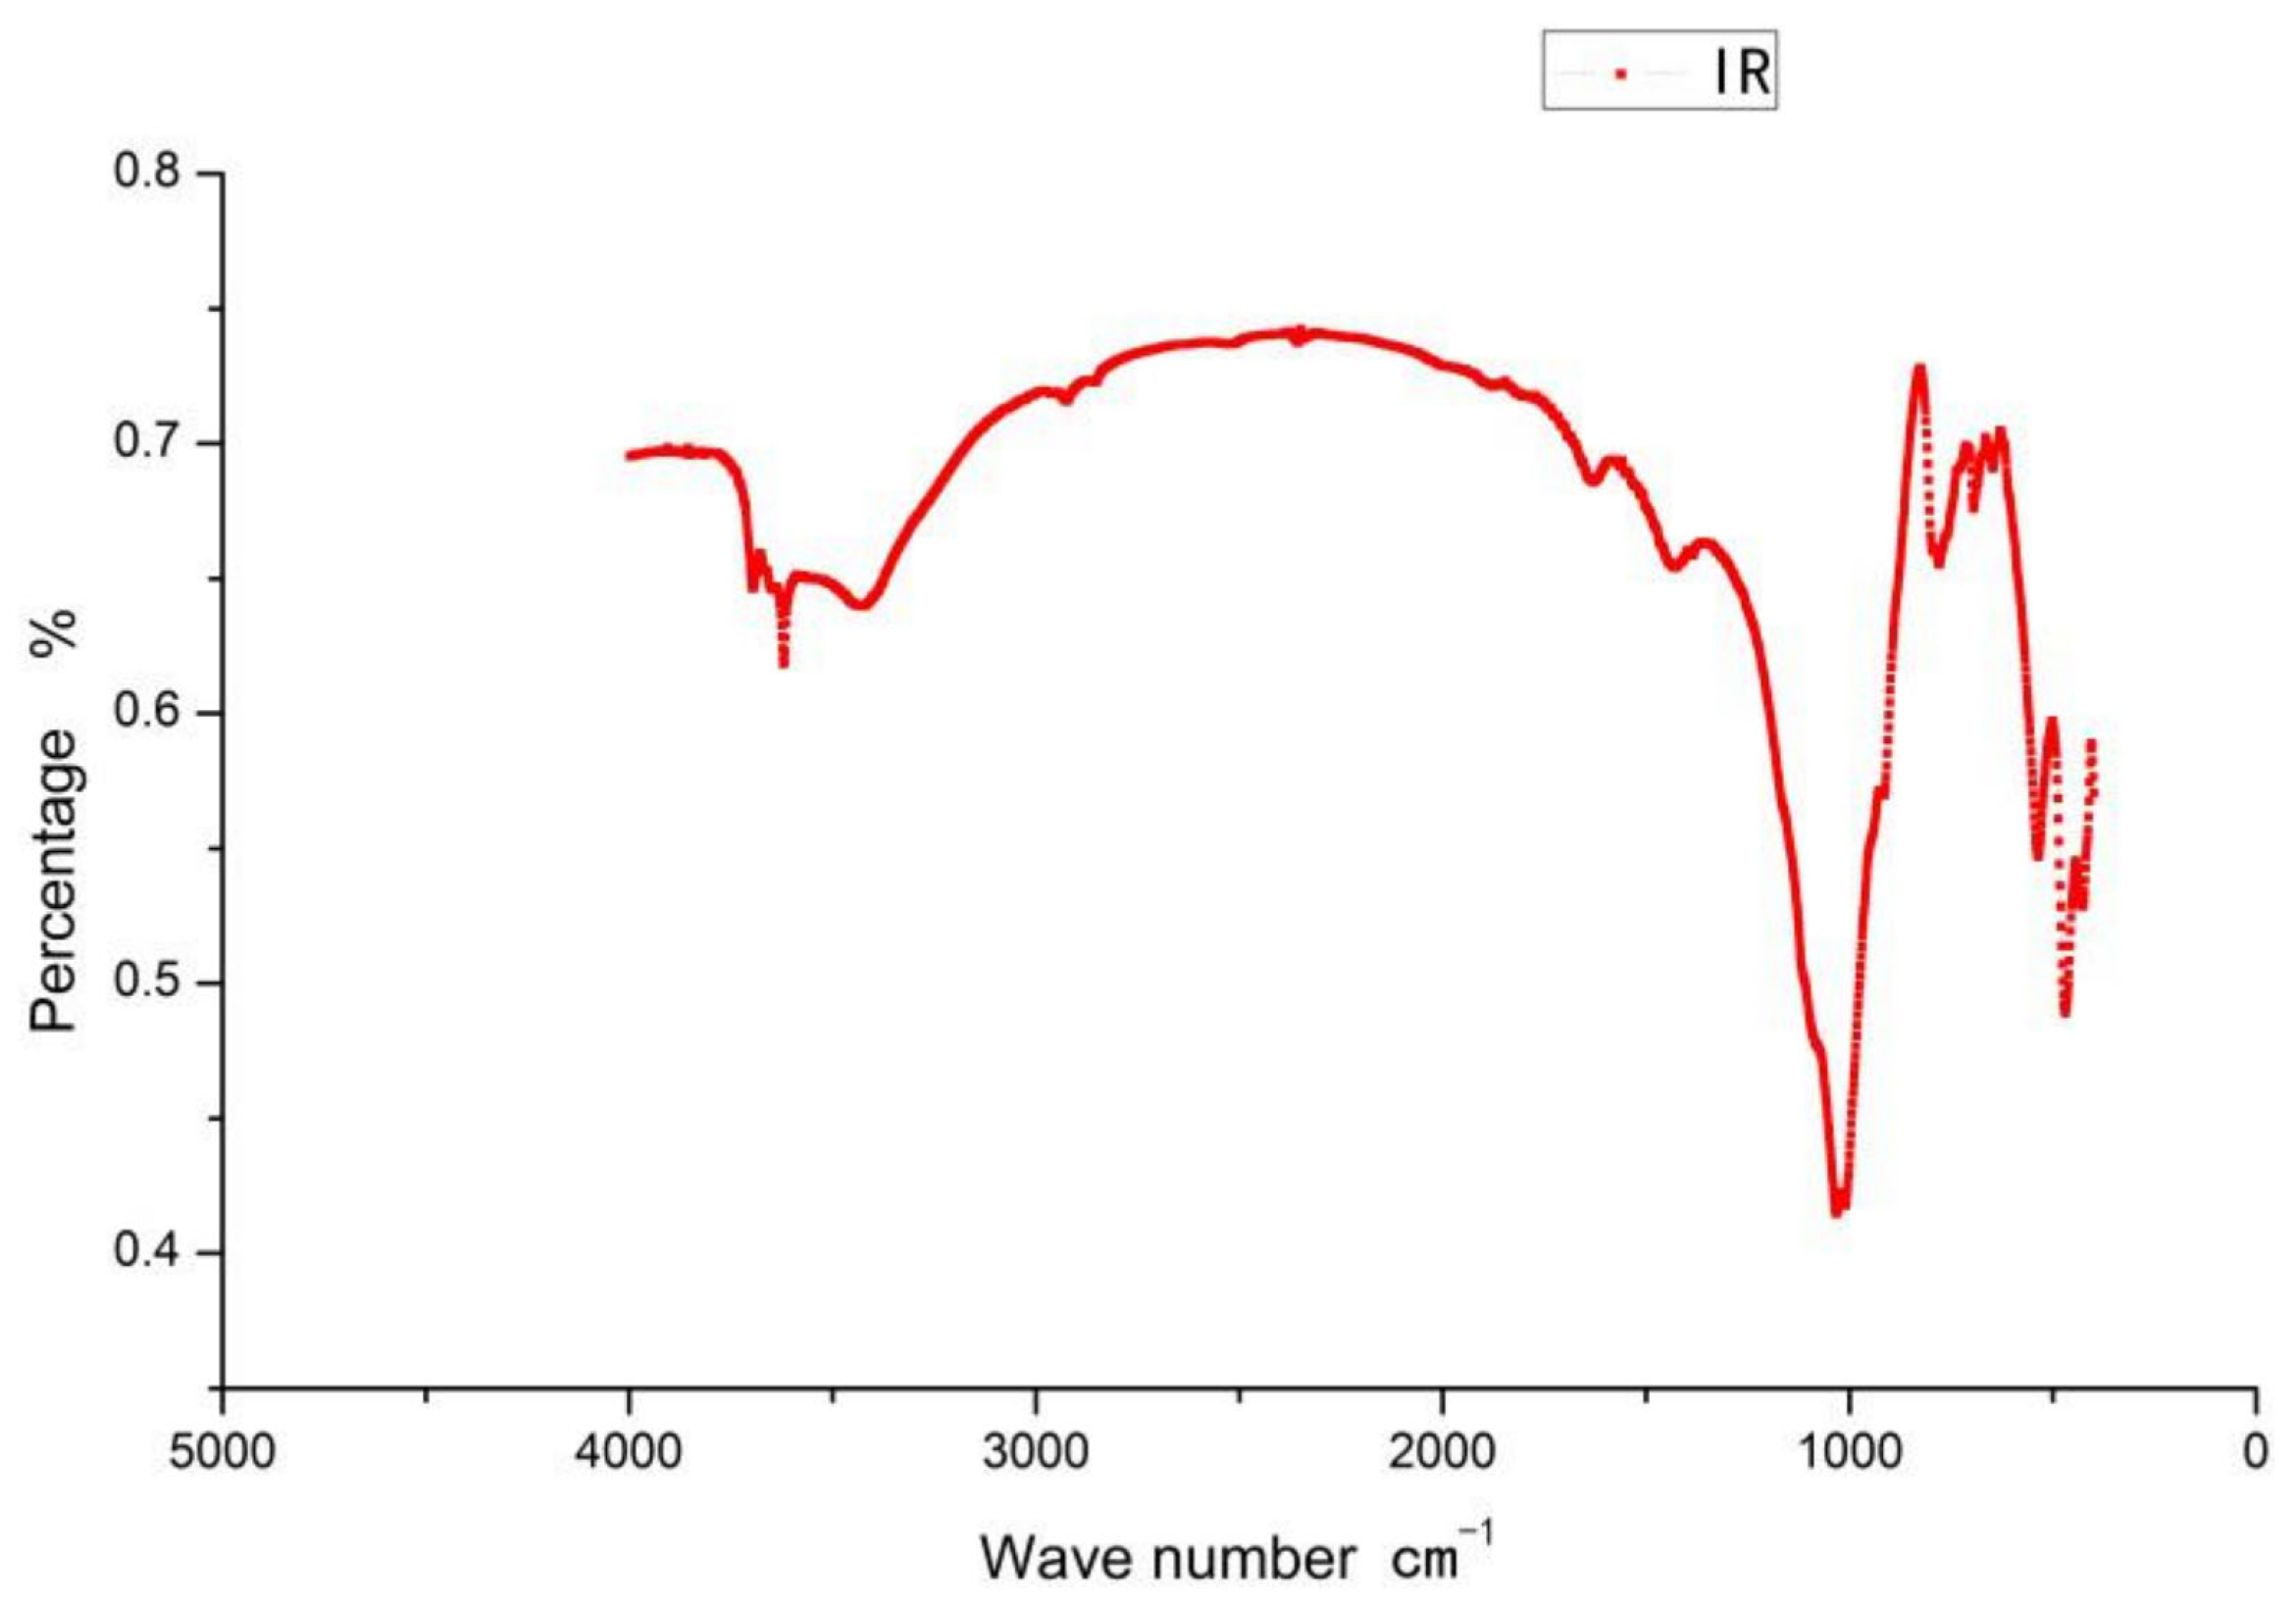
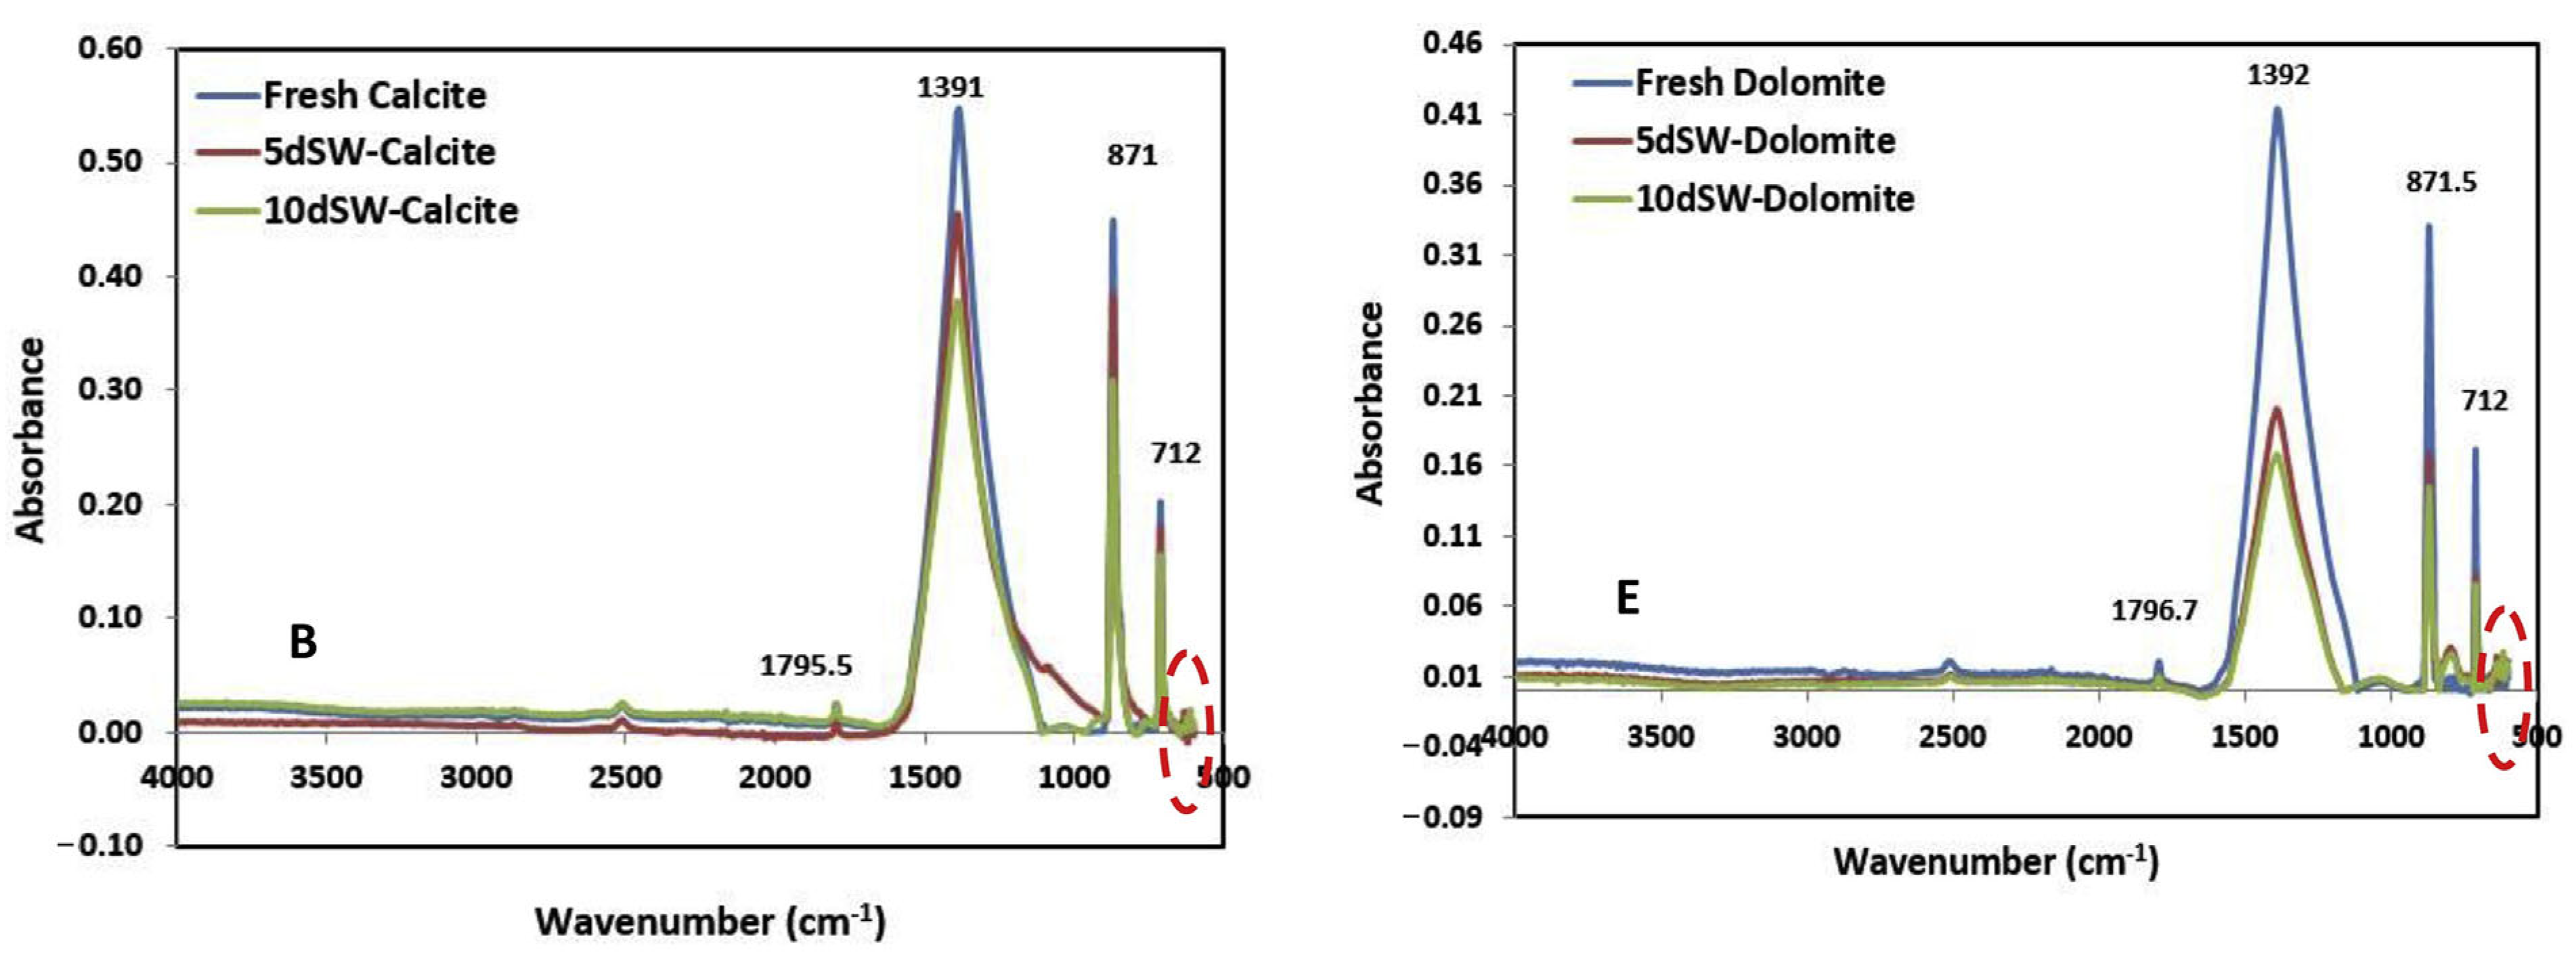
2.3.1. Infrared Spectroscopy (IR)

The wettability of samples depends on numerous factors, including the chemical composition of their surface [80,81]. This aspect can be investigated using infrared spectroscopy (IR spectroscopy), which is based on the absorption of infrared radiation by molecules of the substance. Absorption occurs due to the vibrational movements of molecules, leading to a reduction in the intensity of transmitted light. Fourier transform infrared spectroscopy (FT-IR) allows for the characterization of this attenuation through wavenumbers, as shown in Figure 7 [24]. Different chemical bonds in the sample produce peak intensities at various wavenumbers.
The advantage of this method is its ability to analyze chemical bonds on a sub-pore scale, as well as the relatively quick execution of the experiment. It should be noted, however, that IR spectroscopy is expensive to perform. Although primarily used for qualitative analysis and not for the direct quantitative measurement of chemical bond concentrations, IR spectroscopy provides valuable information on chemical changes in the sample after treatment with various substances [25,26,27,28,29]. For example, Figure 8 presents the IR spectra of calcite and dolomite before and after exposure to solutions with different concentrations of seawater. Despite the identical number of peaks, the differences in absorption intensity between fresh and treated samples indicate changes in their chemical and wettability properties [25].

2.3.2. Nuclear Magnetic Resonance (NMR)

The method for determining rock wettability using nuclear magnetic resonance is based on the fact that water has different relaxation times in the volume and surface of the sample. Water exists in the rock as separately as in the oil. At least three parameters are determined by NMR: T1, T2, and diffusion. Wettability affects all these parameters, which means there is no universal method to extract wettability data using NMR [30]. For example, the authors of [31] proposed a model to determine wettability based on T2. This model works well in sandstones under intermediate and water-wettable conditions. In a subsequent study, the NMR wettability of quartz-rich sandstone was investigated for CO2 displacement by water in this rock, and it was found that CO2 significantly reduces the hydrophilicity of sandstone [32].
The NMR test can be performed under different temperature and pressure conditions; the method itself is fast, but it is difficult and expensive to perform.

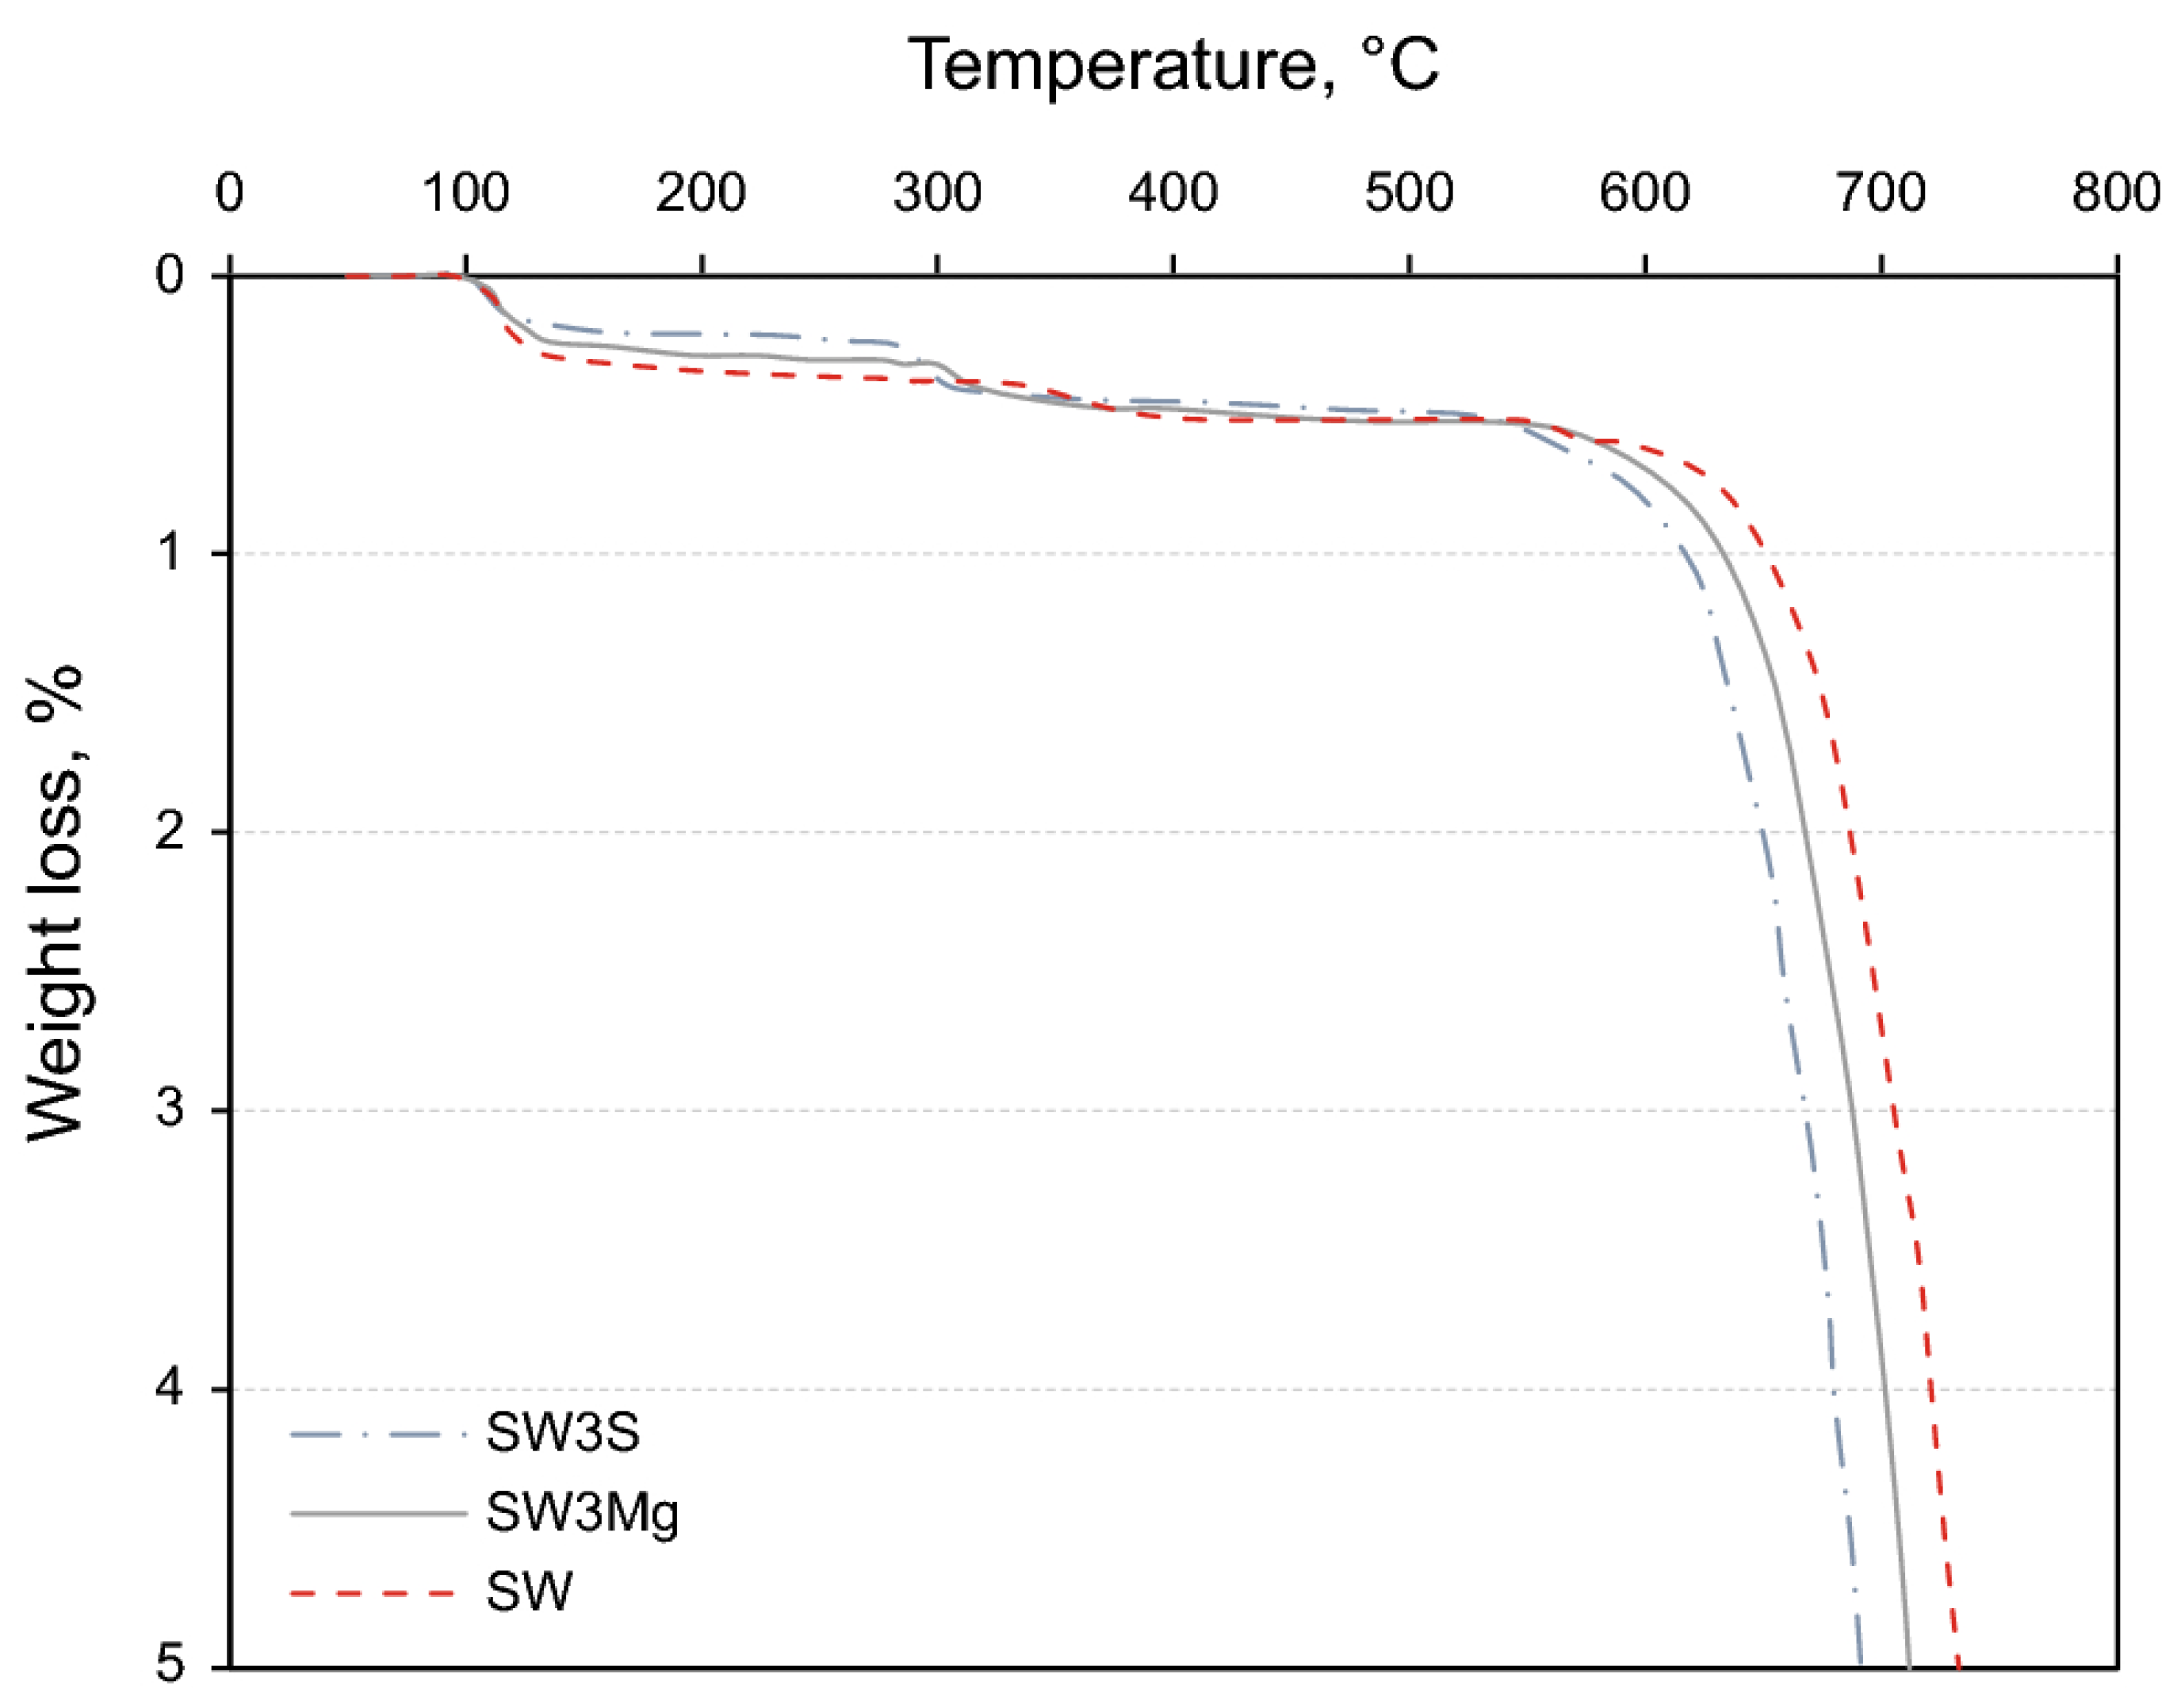
2.3.3. Thermogravimetric Analysis (TGA)

The thermogravimetric method is based on the change in the sample’s mass during heating. Under the influence of temperature, adsorbates will evaporate from the surface of the sample [33]. The result of TGA is a graph of the sample’s mass loss as a function of time or temperature, as shown in Figure 9. This figure presents the TGA results of carbonate rock aged in oil and treated with various brines. The mass loss in the sample can be divided into three stages: physically adsorbed substances (30–120 °C), chemically adsorbed materials (210–400 °C), and rock decomposition (T > 570 °C). The smaller the change in the sample’s mass, the more effectively the brine altered the rock’s wettability [34,35]. TGA is considered an expensive and destructive method, thus limiting the possibility of experiment repeatability.

2.4. Analytical Methods

Given the available relative phase permeability curves for the two-phase fluid system, it is possible to determine the wettability of the rock without additional experiments [36,37]. Craig’s triple rules [38] were used to study wettability based on the relative phase permeability curves.

2.4.1. Lak Method

Mirzaei-Paiaman et al. modified Craig’s second rule, excluded the third, and combined the first and second rules to create a wettability index ( I L ) for determining average wettability. The I L value ranges from −1 to +1, with positive values indicating water-wet rocks and negative values indicating oil-wet rocks. The ( I L ) values close to zero indicate rocks with neutral wettability. The wettability index ( I L ) is defined using Equation (4) [36].
I L = α 0.3 k r w @ S o r 0.3 + β 0.5 k r @ S o r 0.5 + C S R C S 1 S o r S w i r ,
where ( k r w @ S o r ) is the maximum relative permeability to water measured at residual oil saturation, ( C S ) is the water saturation at the crossover point of the relative permeability curves, ( S w i r ) is the irreducible water saturation, and ( S o r ) is the residual oil saturation. Constants (α) and (β) are determined with Equation (5).
k r w @ S o r < 0.3 ,   t h e n   α = 0.5 ,   β = 0 I f 0.3 k r w @ S o r 0.5 ,   t h e n   α = β = 0 k r w @ S o r > 0.5 ,   t h e n   α = 0 ,   β = 0.5
R C S is the half of the connected pore space where the wettability alteration occurs and is determined using Equation (6) as follows:
R C S = 1 2 + S w i r S o r 2 .

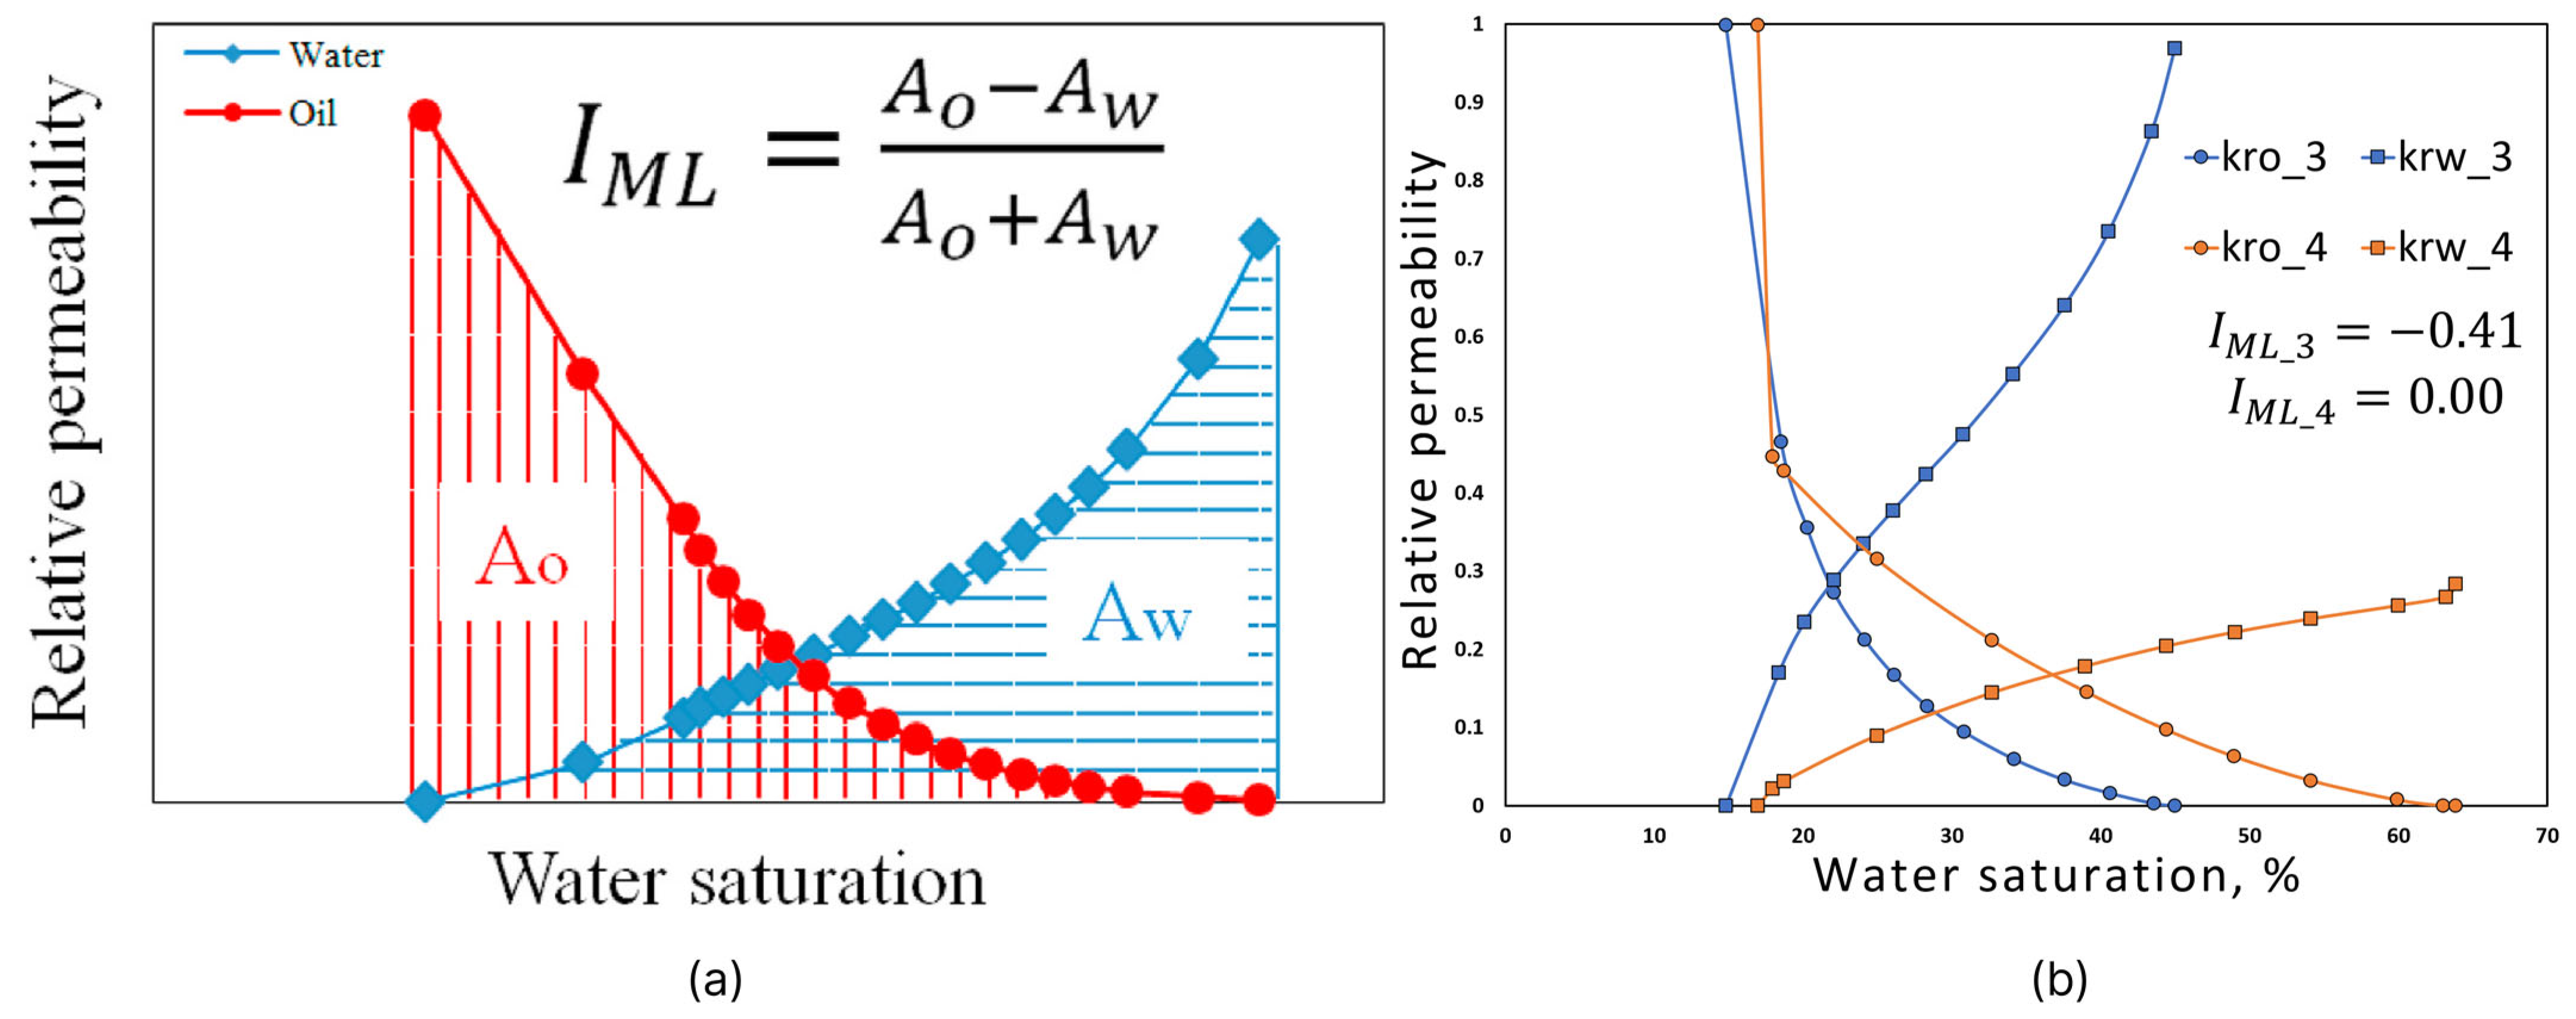
2.4.2. Modified Lak Method

The wettability index utilizes certain characteristics of the relative permeability curves. Mirzaei-Paiaman et al. proposed a modified Lak method to determine wettability using the area under the relative permeability curves, as described in Equation (7) [37].
I M L = A o A w A o + A w ,
where A o is the area under the oil relative permeability curve, and ( A w ) is the area under the water relative permeability curve. The values of the modified Lak method range from −1 to +1. An index value ( I M L > 0 ) indicates a water-wet rock, while ( I M L < 0 ) suggests an oil-wet rock. An I M L value close to 0 indicates a neutral wettability with respect to both water and oil. Figure 10a provides a schematic demonstration of the modified Lak method. For example, Figure 10b shows the data obtained from real samples for the calculation of the I M L index. For samples 3 and 4 from the first set, the wettability calculated using the modified Lak method was ( I M L = 0.41 ) and I M L = 0 , respectively [37].
Mirzaei-Paiaman et al. tested the modified Lak method on 20 carbonate samples, divided into two groups, and compared it with other methods such as Amott–Harvey, USBM, and Lak. Figure 11 shows the correlations between the indices. As observed, the modified Lak method exhibits a good correlation with the Amott–Harvey index ( R 2 = 0.65 ) and the Lak method ( R 2 = 0.85 ) , while it shows a moderately good correlation with the USBM index ( R 2 = 0.45 ) . The Lak method also demonstrates a good correlation with the USBM index ( R 2 = 0.59 ) and the Amott–Harvey index ( R 2 = 0.80 ) [37].
As demonstrated by the examples, the advantage of analytical methods is their exceptional convenience in determining the average wettability of a rock when the relative permeability curves are known [37].
The limitations of these methods include the quality of the data obtained under varying experimental conditions for determining the relative permeabilities of rock samples. The modified Lak method is better suited for stationary experimental conditions and normal breakthrough scenarios, while the Lak method is applicable for unsteady-state experiments and late breakthrough conditions. Additionally, wettability determination can be influenced by pore geometry, interfacial tension, and fluid viscosities. Therefore, these methods are best applied under similar fluid viscosities as those tested in these studies [36,37].

3. Wettability Alteration

3.1. Injection of Low-Salinity Water

The study of rock wettability alteration, particularly in the context of hydrocarbon reservoirs, represents a key aspect in the field of enhanced oil recovery (EOR). For instance, the analysis of the wettability of carbonate rocks is of particular importance, given their strong oil-wet characteristics. These changes can significantly impact the efficiency of oil extraction processes, such as water flooding and injections of saline solutions or CO2.
One of the intriguing aspects in this field is the effect of low-salinity water flooding (LSWF), which has become a focus of active research. Some experimental studies have demonstrated that changes in the composition and salinity of water can positively influence oil recovery from carbonate rocks. However, the underlying mechanisms of this effect remain unclear [39,40].
Mahani et al. conducted experiments to study the behavior of oil droplets on the surfaces of limestone and dolomite in various salt solutions [41]. Their results indicate that in formation water (FW), the shape of oil droplets stabilizes over time, reaching an equilibrium state where the contact angle remains constant. When switching to seawater (SW), after 40 h, the contact angles for the oil droplets on both limestone and dolomite decreased by approximately 5–17 degrees. This is illustrated in Figure 12.
Tang and Morrow [41] conducted a study revealing that a decrease in water salinity leads to increased permeability in sandstone formations and improved oil recovery. In their work, Nasralla et al. [42] noted an increase in oil recovery when using low-salinity water (LSW) for injection. They experimented by varying the salinity of water from 0 to 17,400 mg/L in oil-saturated sandstones, using mica sheets. Changes in the mica’s wettability angle suggest a possible influence of low-salinity water on its wettability. Figure 13 shows images of the contact angles of crude oil on mica in various brines at a pressure of 1000 psi and a temperature of 212 °F.
Recent studies on the process of spontaneous water injection with varying salinities have shown that both the imbibition rate and ultimate oil recovery are higher when using LSW [43,44]. According to the authors, changes in salinity may play a key role in altering the wettability of sandstone formations under the influence of LSW, particularly when clay components dictate oil wettability.
The mechanisms of wettability alteration are crucial for understanding the effectiveness of LSWF in carbonate and sandstone reservoirs. Despite the growing interest in this topic, significant disagreements remain regarding the underlying mechanisms. Alomair et al. suggest that wettability changes may be a dominant mechanism, yet their quantitative impact on increased oil recovery remains unclear [40].
To quantitatively assess the impact of low-salinity waterflooding on rock wettability and enhanced oil recovery, a series of tests were conducted using a petroleum product on clay-free Berea sandstone samples. The experimental results confirmed a slight shift in wettability toward more favorable conditions with decreasing water salinity [40]. Alomair et al. demonstrated that reducing water salinity from 85,000 to 4000 ppm led to an increase in the USBM index from approximately 0.26 to 0.38 on average (see Figure 14) [40]. Thus, the studies by Alomair et al. provide insights into the impact of low-salinity waterflooding on wettability alteration and enhanced oil recovery in clean sandstone formations.
The modeling of rock wettability is another important aspect of research. Kallel et al. (2023) have demonstrated progress in understanding the mechanisms of wettability alteration, including the impact of pore space structure on this process [45].
It is also important to consider that different research models show mixed results in predicting the effectiveness of wettability alteration and its impact on enhanced oil recovery. For instance, the model developed by Boampong et al. (2023) incorporates several mechanisms of wettability alteration, such as surface charge, calcite dissolution, and ion exchange, and successfully reproduces experimental data. This model enables the prediction of oil recovery efficiency using low-salinity solutions, which is crucial for the practical implementation of such methods [46].
The study by Mahsa et al. provides insights into the effect of diethylenetriamine penta-acetic acid seawater (DTPA-SW) on wettability alteration in sandstone and enhanced oil recovery [47]. The introduction of a 5% DTPA-SW solution resulted in a significant reduction in the contact angle between the rock and oil phases, as well as a decrease in potential, shifting the rock wettability from an oil-wet state to a strongly water-wet state (see Figure 15). The tests also demonstrated a 39.6% increase in oil recovery with the use of the DTPA-SW solution. These results enhance the understanding of the effectiveness of DTPA in altering rock wettability and its impact on improving the oil recovery process [47].

3.2. Injection of Surfactants and Ionized Fluids

Surfactants are a unique group of chemical compounds capable of altering the interfacial tension between different phases, such as oil and water. The primary goal of using surfactants is to reduce this interfacial tension to minimal values, which is a crucial aspect of efforts to alter oil wettability.
Positively charged surfactant particles interact electrostatically with negatively charged carbonates in crude oil, forming ionic pairs [48]. This interaction of ionic pairs is reinforced by hydrophobic interactions between the surfactants and the tails of the oil components [49].
Since the formation of ionic pairs is associated with intense interactions between them, it is assumed that the desorption of organic material and the alteration of wettability occur [50]. When a surfactant interacts with Mg2⁺ ions, it leads to the removal of adsorbed carbonates from the surface, resulting in a more water-wet surface due to the action of the surfactant (see Figure 16).
The study by Tabatabai et al. [51] demonstrated that the adsorption of cationic surfactants on carbonates is lower compared to anionic surfactants with similar hydrophilic chain lengths. This effect can be enhanced by adding multivalent cations. Additionally, it was found that the addition of alkali significantly reduces the adsorption of anionic surfactants on carbonate surfaces, as noted by Seethepalli et al. [52].
Concentrations of the cationic surfactant C12TAB equal to or exceeding the critical micelle concentration (CMC) can alter the wettability of carbonate rocks more effectively than anionic surfactants, as established by other researchers [53]. However, Wu et al. [54] did not find a clear correlation between oil recovery and CMC.
Studies have shown that anionic surfactants have a minor impact on wettability alteration, even when efforts are made to shift it toward a more water-wet state [26,55].
Various ions present in the injected water, such as Na⁺, Ca2⁺, Mg2⁺, and SO42⁻, play a crucial role in altering wettability toward a water-wet state, leading to a significant increase in additional oil recovery [56].
Sulfate (SO42⁻) plays a dominant role in altering wettability in carbonate rocks at high temperatures [57]. An increase in sulfate concentration enhances oil recovery [58]. However, studies have shown that sulfate alone does not significantly affect wettability without the introduction of magnesium [59,60]. In high-salinity brine solutions, sulfate is not suitable as a modifier due to the potential for CaSO4 precipitation, which can lead to precipitation [61].
Sakthivel studied the effect of various imidazolium-based ionic liquids on wettability alteration by measuring contact angles [62]. He systematically investigated parameters such as rock type, type and concentration of fluids, temperature, pressure, and salinity. The results revealed significant changes in static wettability angles upon the addition of ionic liquids (ILs), indicating a shift toward a more water-wet state, particularly noticeable in oil-saturated samples [62]. Figure 17 illustrates the effects of different ionic liquids on contact angles when interacting with oil, rock, and seawater for (a) brine-saturated and (b) oil-saturated rocks at 25 °C.

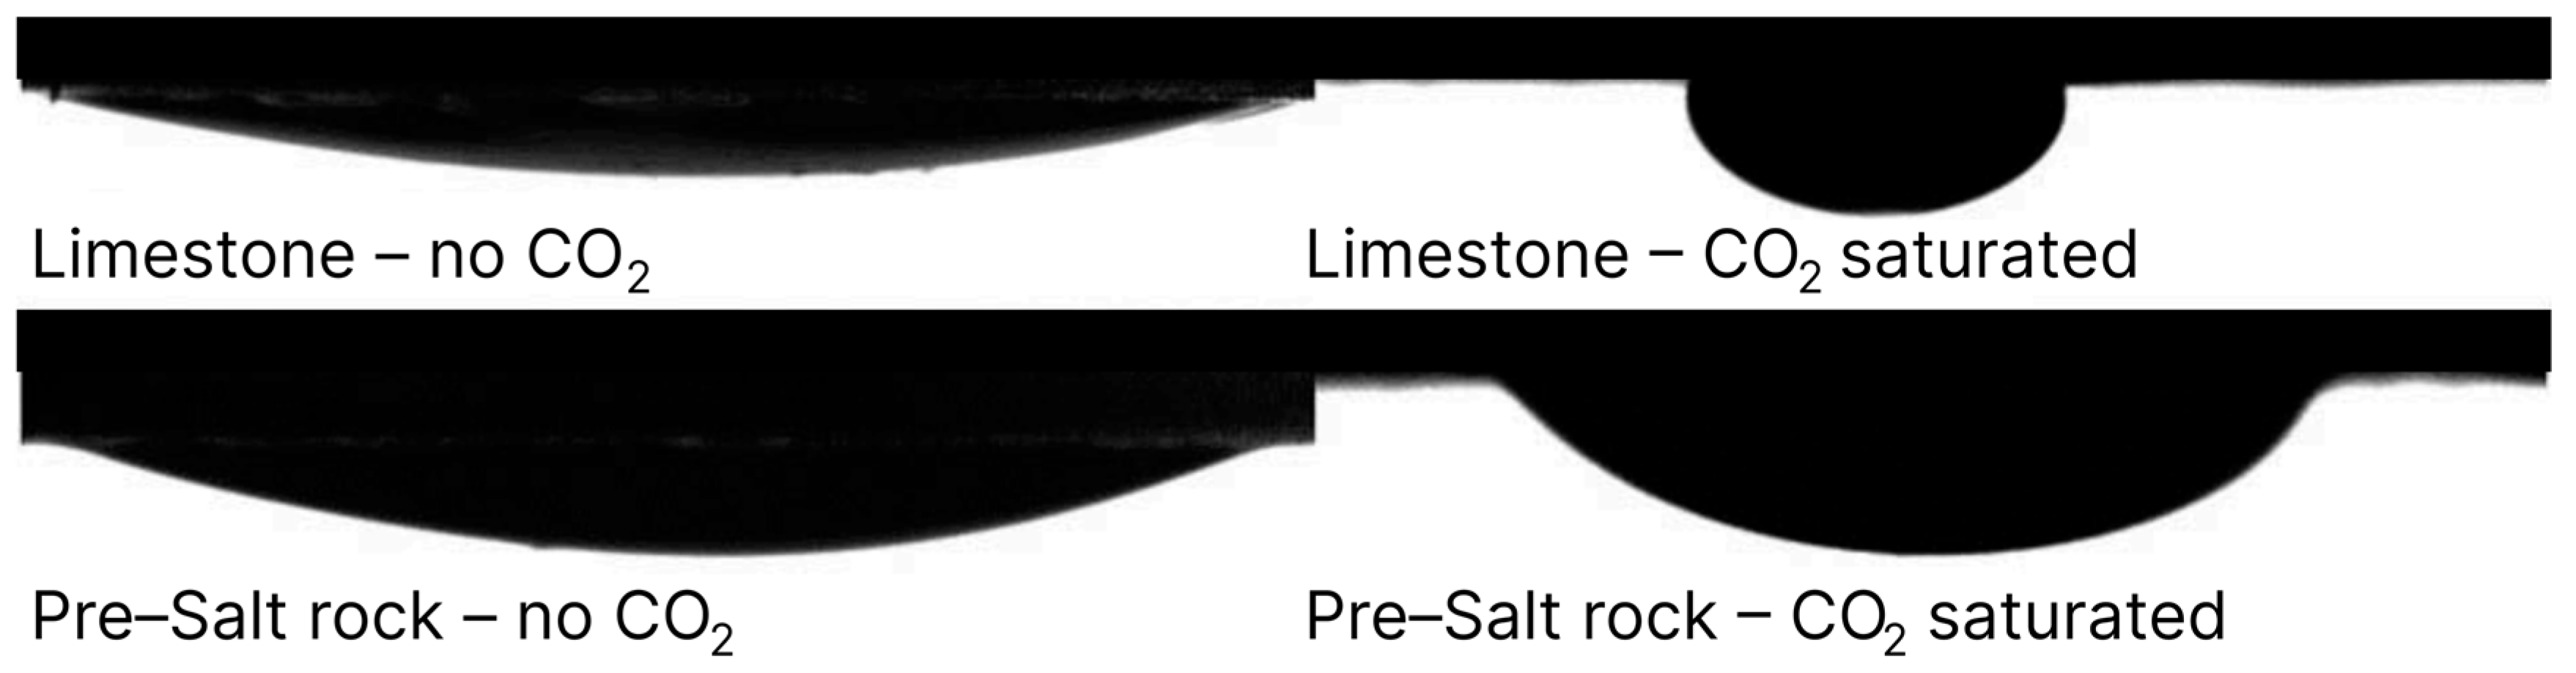
3.3. Injection of Carbonated Water

Other studies focus on the role of CO2 in altering rock wettability. Research indicates that the introduction of CO2 into water can reduce oil wettability and increase oil recovery in carbonate reservoirs [65,66,67]. Drexler et al. demonstrated that the addition of CO2 to water reduces the contact angle in limestone, shifting wettability from oil-wet to water-wet, which positively impacts oil recovery (see Figure 18) [65].
When carbonated water is injected into carbonate reservoir rocks, it can alter the wettability of the rock surface, shifting it toward a more water-wet state. This mechanism of wettability alteration has been shown to enhance oil recovery by increasing oil permeability [65].
Studies on surface complexation modeling have shown that during the injection of carbonated water, wettability shifts toward more water-wet conditions, ultimately affecting the overall wettability of the system [68]. Understanding and managing wettability changes resulting from carbonated water injection can significantly impact oil recovery processes in carbonate reservoirs.
Arjomand et al. investigated the alteration of sandstone wettability using supercritical CO2 silicification and demonstrated its ability to modify the wettability of the pore space in reservoir formations [69]. Studies show that silicification using scCO2 can provide similar or more effective chemical surface coatings compared to traditional silicification methods, due to the enhanced mass transfer and diffusion rates characteristic of this approach. This improved surface coating leads to a more significant wettability alteration of the rock, which is assessed through contact angle measurements [69].
Nowrouzi et al. investigated the mechanisms of wettability alteration in carbonate reservoirs using contact angle measurements and imbibition experiments [70]. They demonstrated the effectiveness of carbonated water in enhancing oil recovery through wettability alteration. They also emphasized the importance of ion management in smart water injection for controlling the mechanisms of wettability change in carbonate rocks.

4. Wettability Alteration Due to Rock Dissolution and Precipitation

In this section, calculations are performed to determine wettability and the influencing factors. Data on relative permeabilities from two studies [71,72] were used to calculate wettability before and after dissolution or pore precipitation using the Lak method, as described in Section 2.4.1.

4.1. Wettability Alteration Due to Rock Dissolution

A previous study [71] investigated how mineral dissolution affects multiphase flow properties in carbonate rocks, demonstrating changes in relative phase permeability. Two distinct carbonate rocks, Ketton and Estaillades, were used based on their different pore structures. High-resolution X-ray imaging and mercury porosimetry were employed to characterize their properties, which are shown in Table 4. In the study, nitrogen (N2) was used as the non-wetting phase, and deionized water was used as the wetting phase. Eight stages of dissolution were considered, during which 0.5% of the mineral volume was uniformly dissolved into the core sample using an acid solution at a controlled temperature.
According to the relative phase permeability curves (Figure 19), the wettability index was calculated using the Lak method. The wettability index ranges from 0.177 to 0.401. Values close to 0.3 indicate a neutral-wet or weakly water-wet rock.
To study the impact of porosity on wettability, a graph was plotted showing the relationship between the Lak index and porosity (Figure 20). The highest Lak index value (0.40) is observed at stage 8 of dissolution, corresponding to the highest porosity (0.25). This suggests an increase in wettability at high dissolution stages (Figure 20). This is also evident from the relative phase permeability curves, as the residual oil saturation shifts to lower values (Figure 19).
This behavior can be attributed to changes in pore structure in the sample. In the Ketton carbonate rock, a decrease in the proportion of pores with throat sizes r > 3.16 µm was observed with increasing dissolution, while the proportion of pores with throat sizes r < 0.1 µm increased (Figure 21). The mineral dissolution process led to an increase in the proportion of the smallest pores and a decrease in the proportion of the largest pores, which resulted in increased overall porosity. This change in rock structure created new pathways for the flow of the non-wetting phase in areas that were previously blocked, thereby enhancing relative permeability and bringing the rock’s wettability closer to a more water-wet state.
Porosity gradually increased with advancing dissolution stages for Estaillades. This indicates that the dissolution process of Estaillades rock leads to an increase in porosity.
The wettability index calculated from the relative permeability curves (Figure 19) ranges from −0.032 to 0.286 (Figure 22). These values indicate varying degrees of wettability: a negative value at stage 0 suggests weak oil-wet conditions, while positive values at other stages indicate neutral wettability.
The mineral dissolution process led to a reduction in the proportion of both the smallest and largest pore size groups, while the proportion of medium-sized pores increased (Figure 21). Consequently, the separation of wetting and non-wetting phases became less effective in both fine and large pore networks, as evidenced by changes in the wettability index.
Figure 23 shows changes in the Land trapping coefficient as a function of porosity for Ketton carbonates (top) and Estaillades carbonates (bottom). Notably, there is a similarity in the behavior of residual trapping and wettability with respect to porosity. In Ketton carbonate, a moderate but consistent decrease in residual trapping is observed with an increase in porosity (Figure 23). The dissolution of minerals primarily affects small pores, increasing their average size (Figure 21), which likely alters wettability. The trapping of the wetting phase occurs through layers on the walls of rock pores. As pressure on the wetting phase increases, these layers swell, aiding in the separation and isolation of individual droplets of the non-wetting phase. Conversely, in Estaillades carbonate, residual trapping remains virtually unchanged with increasing porosity, as shown in Figure 23.
The dissolution process not only alters the pore structure but also creates changes in capillary barriers within the porous medium, which significantly affect two-phase displacement and wettability characteristics. Recent studies, such as those by Meng et al. and Darezhat et al., have investigated these dynamic interactions at the pore scale, focusing particularly on how changes in pore geometry influence the behavior of non-wetting and wetting fluids [82,83]. These findings provide a broader context for understanding the role of dissolution in altering the fluid distribution and the overall wettability characteristics of the porous medium.

4.2. Wettability Alteration Due to Precipitation

Another study [72] investigated the impact of carbonate precipitation on pore structure and two-phase fluid flow in porous media. To examine changes in porosity and relative permeability caused by carbonate precipitation, a pore-scale numerical model was developed and applied to real rock microstructures. The geometric model of these rocks was created based on micro-CT scans of Berea sandstone samples. Direct flow simulations were conducted on the reconstructed rock space model. By analyzing changes in pore structure resulting from deposition, permeability changes can be assessed. The scanned images of Berea sandstone have a resolution of up to 3.2 μm. The entire dataset comprises 396 slices. In the study, nitrogen (CO2) was used as the non-wetting phase, while water served as the wetting phase.
Two clogging models were used to study the impact of carbonate precipitation on pore structure and relative permeability in porous media. The first model employed chemical reaction theory to assess local changes in sediment volume and introduced a mass variable to track the amount of deposited carbonate. The second model adjusted the grayscale threshold to modify sediment structure, effectively narrowing the pore space and reducing porosity, thereby eliminating the need to calculate the Ca2⁺ concentration field.
Figure 24 shows the results of modeling two-phase flow through Berea sandstone, specifically the relative permeability curves for the two clogging models.
Using the relative phase permeability data, the wettability index was calculated using the Lak method for various porosity values due to precipitation. Figure 25 shows the results of the wettability changes as a function of porosity reduction for the first model. Overall, it was observed that the wettability of the rock remained closer to neutral across all porosity values. As porosity decreased, the wettability index trended toward a more strongly neutral state.
The reactive precipitation model focuses on the concentration of reactive components, with advection and diffusion of the concentration field being regulated by the flow, pore structure, and pore connectivity. Thus, changes in wettability caused by precipitation depend on both the distribution of flow velocity and modifications in pore geometry.
Wettability behavior is related to changes in pore structure due to carbonate precipitation (Figure 26), which resulted in a significant reduction in the absolute permeability of the porous medium. Absolute permeability decreased from 769 mD to 169 mD and 11 mD at porosities of 21% and 10.3%, respectively [72]. During two-phase flow simulations, the relative permeability of the non-wetting phase was significantly reduced after precipitation, affecting the liquid flow properties (Figure 24).
Figure 27 shows the results of the wettability index as a function of porosity change according to the second model. At both maximum and minimum porosities, it can be observed that the wettability index remained practically unchanged, despite the fact that absolute permeability decreased from 769 mD to 268 mD and 103 mD at porosities of 21% and 10.3%, respectively [72].
Such minimal change is attributed to the fact that in the threshold adjustment model, the pore space contracts along the edge walls, and the artificially added particles attain uniformity (Figure 28).
The wettability index shows different values in the two models. The reactive transport precipitation model exhibits significantly lower permeability due to the uneven distribution of deposits [72]. Some of the sediment partially blocks the pores, dividing the pore spaces into smaller regions and disrupting the uniformity of Berea sandstone. This transition from uniformity to non-uniformity results in changes in wettability (Figure 24). In contrast, the threshold adjustment precipitation model maintains uniformity, with only the relative permeability of the non-wetting phase decreasing due to the reduction in pore space.
Pore blockage caused by precipitation can have significant consequences for fluid flow and wettability in reservoir rocks. Studies by Meng et al. highlight the critical role of capillary forces and their interaction with pore geometry and fluid viscosity, particularly in low-permeability systems [84]. These studies emphasize the importance of considering localized capillary effects resulting from pore blockage, providing further insights into how sedimentation can alter fluid flow and apparent wettability.
The role of pore structure in capillary effects remains a key aspect when evaluating wettability characteristics. According to Ning and co-authors, capillary barriers caused by dual porosity can significantly impact two-phase flows in porous media. This, in turn, leads to changes in apparent wettability, as local capillary effects are determined by both the fluid properties and the porous structure. In particular, in low-permeability rocks, as shown in different studies [82], viscosity and capillary forces play a crucial role in phase distribution and must be considered when assessing wettability properties. These effects highlight the need for further investigation into the influence of pore structure on apparent wettability characteristics.

5. Conclusions

A review of methods for measuring and altering wettability highlights the importance of this parameter for optimizing hydrocarbon extraction processes and improving the efficiency of oil field development. Various methods for measuring the wettability index include Amott–Harvey and USBM tests, contact angle measurements, infrared spectroscopy, and nuclear magnetic resonance, each with its own advantages and limitations.
This study examined four categories of methods for measuring rock wettability: spontaneous fluid imbibition, contact angle measurement, characteristics of imbibed fluids, and analytical methods. Methods based on spontaneous imbibition and capillary pressure are effective but time-consuming and expensive. Contact angle measurement provides rapid results but is limited to the surface of samples. Methods that consider the characteristics of imbibed fluids and analytical methods require sophisticated equipment but provide a detailed understanding of wettability. The choice of method depends on the research objective, the required accuracy, and the available equipment.
Wettability alteration methods, such as low-salinity water flooding, the use of surfactants, and the injection of carbonated water, have proven effective in both laboratory and field conditions. Low-salinity water flooding enhances water wettability and improves oil displacement, which is associated with ion desorption and changes in capillary forces. Surfactants reduce interfacial tension and alter wettability, thereby improving oil displacement. The injection of carbonated water also contributes to the wettability modification of the rock surface, transitioning it to a more water-wet state and enhancing oil recovery efficiency.
This review has highlighted the critical role of wettability alteration in enhancing oil recovery, offering a detailed assessment of various methods for both measuring and changing wettability. Among the methods reviewed, low-salinity water flooding (LSWF) and the use of surfactants emerged as highly effective in laboratory and field conditions. LSWF, for instance, is relatively low-cost and environmentally friendly, though its effectiveness can be influenced by the specific mineralogical composition of the reservoir. Surfactant flooding, while providing more precise control over wettability, comes with higher operational costs and potential environmental concerns due to chemical usage.
Carbonated water injection (CWI) is a less conventional method that shows promise in altering wettability while simultaneously reducing CO2 emissions. However, the long-term effects of CWI on reservoir performance require further investigation.
Section 4 of the review focused on the impacts of mineral dissolution and pore precipitation on wettability. Mineral dissolution increases porosity and modifies pore structure, which affects relative permeabilities. These processes create new flow pathways for fluids and contribute to improved oil displacement. It was found that dissolution can lead to significant changes in the pore structure, thereby affecting fluid flow and wettability. The results of wettability calculations during these phenomena underscore the importance of carefully balancing the benefits and drawbacks of wettability alteration methods.

Author Contributions

Conceptualization, B.A. and D.B.; methodology, D.B.; software, K.U.; validation, B.A., D.B. and K.U.; formal analysis, D.B.; investigation, D.B.; resources, K.U.; data curation, B.A.; writing—original draft preparation, D.B.; writing—review and editing, K.U.; visualization, K.U.; supervision, B.A.; project administration, D.B.; funding acquisition, B.A. All authors have read and agreed to the published version of the manuscript.

Funding

This study was funded by the Committee of Science of the Ministry of Science and Higher Education of the Republic of Kazakhstan under the project BR18574136 “Development of deep learning and predictive analysis methods for solving complex problems in mechanics”.

Institutional Review Board Statement

Not applicable.

Informed Consent Statement

Not applicable.

Data Availability Statement

All data presented in this article are publicly available, as the article is based on the analysis of previously published sources. No new experimental data were used in the article, and all information was obtained from open scientific publications.

Conflicts of Interest

The authors declare no conflicts of interest.

References

  1. Aslanidis, P. Experimental Reproduction of Wettability for Core Analysis. Ph.D. Thesis, Universitetet i Stavanger, Stavanger, Norway, 2022. ISBN 9788284391106. [Google Scholar]
  2. Wang, Z.; Chu, Y.; Zhao, G.; Yin, Z.; Kuang, T.; Yan, F.; Zhang, L.; Zhang, L. Study of Surface Wettability of Mineral Rock Particles by an Improved Washburn Method. ACS Omega 2023, 8, 15721–15729. [Google Scholar] [CrossRef] [PubMed]
  3. Xie, L.; Lu, S.; Li, J.; Hu, Y.; Zhang, P.; Chen, J.; Zhang, P. Experimental Investigations of the Mineral Wettability in Shale and Its Influence Factors. Acta Geol. Sin. Engl. Ed. 2015, 89, 170–171. [Google Scholar] [CrossRef]
  4. Kułynycz, V. The Influence of Wettability on the Petrophysical Parameters of Reservoir Rocks. AGH Drill. Oil Gas 2017, 34, 775. [Google Scholar] [CrossRef]
  5. Faramarzi-Palangar, M.; Mirzaei-Paiaman, A.; Ghoreishi, S.A.; Ghanbarian, B. Wettability of Carbonate Reservoir Rocks: A Comparative Analysis. Appl. Sci. 2021, 12, 131. [Google Scholar] [CrossRef]
  6. Amott, E. Observations Relating to the Wettability of Porous Rock. Trans. AIME 1959, 216, 156–162. [Google Scholar] [CrossRef]
  7. Glover, P.W.J. Formation Evaluation MSc Course Notes; Department of Geologyand Petroleum Geology University of Aberdeen UK CiNii Labs. Available online: https://homepages.see.leeds.ac.uk/~earpwjg/PG_EN/CD%20Contents/Formation%20Evaluation%20English/Contentsfinal.pdf (accessed on 3 December 2023).
  8. Morrow, N.R. Wettability and Its Effect on Oil Recovery. J. Pet. Technol. 1990, 42, 1476–1484. [Google Scholar] [CrossRef]
  9. Donaldson, E.C.; Thomas, R.D.; Lorenz, P.B. Wettability Determination and Its Effect on Recovery Efficiency. Soc. Pet. Eng. J. 1969, 9, 13–20. [Google Scholar] [CrossRef]
  10. Amirpour, M.; Shadizadeh, S.R.; Esfandyari, H.; Ahmadi, S. Experimental Investigation of Wettability Alteration on Residual Oil Saturation Using Nonionic Surfactants: Capillary Pressure Measurement. Petroleum 2015, 1, 289–299. [Google Scholar] [CrossRef]
  11. Ahmadi, M.A.; Galedarzadeh, M.; Shadizadeh, S.R. Wettability Alteration in Carbonate Rocks by Implementing New Derived Natural Surfactant: Enhanced Oil Recovery Applications. Transp. Porous Media 2015, 106, 645–667. [Google Scholar] [CrossRef]
  12. Sohal, M.A.; Thyne, G.; Søgaard, E.G. Novel Application of the Flotation Technique to Measure the Wettability Changes by Ionically Modified Water for Improved Oil Recovery in Carbonates. Energy Fuels 2016, 30, 6306–6320. [Google Scholar] [CrossRef]
  13. Ghosh, B.; Belhaj, H.; Alhashmi, H.; Idachaba, F.; Joshi, P.; Rahman, M.M.; Haroun, M. Standardization of Particle Size for Floating Particle Wettability Measurement for Carbonate Rocks. ACS Omega 2023, 8, 11837–11851. [Google Scholar] [CrossRef] [PubMed]
  14. Shedid, S.A.; Ghannam, M.T. Factors Affecting Contact-Angle Measurement of Reservoir Rocks. J. Pet Sci. Eng. 2004, 44, 193–203. [Google Scholar] [CrossRef]
  15. Ivanova, A.A.; Mitiurev, N.A.; Shilobreeva, S.N.; Cheremisin, A.N. Experimental Methods for Studying the Wetting Properties of Oil Reservoirs: A Review. Izv. Phys. Solid Earth 2019, 55, 496–508. [Google Scholar] [CrossRef]
  16. Deng, X.; Kamal, M.S.; Patil, S.; Hussain, S.M.S.; Zhou, X. A Review on Wettability Alteration in Carbonate Rocks: Wettability Modifiers. Energy Fuels 2020, 34, 31–54. [Google Scholar] [CrossRef]
  17. Wang, Y.; Xu, H.; Yu, W.; Bai, B.; Song, X.; Zhang, J. Surfactant Induced Reservoir Wettability Alteration: Recent Theoretical and Experimental Advances in Enhanced Oil Recovery. Pet Sci. 2011, 8, 463–476. [Google Scholar] [CrossRef]
  18. Zou, S.; Sun, C. X-ray Micro-Computed Imaging of Wettability Characterization for Multiphase Flow in Porous Media: A Review. Capillarity 2020, 3, 36–44. [Google Scholar] [CrossRef]
  19. Blunt, M.J.; Lin, Q.; Akai, T.; Bijeljic, B. A Thermodynamically Consistent Characterization of Wettability in Porous Media Using High-Resolution Imaging. J. Colloid Interface Sci. 2019, 552, 59–65. [Google Scholar] [CrossRef]
  20. Andrew, M.; Bijeljic, B.; Blunt, M.J. Pore-Scale Contact Angle Measurements at Reservoir Conditions Using X-Ray Microtomography. Adv. Water Resour 2014, 68, 24–31. [Google Scholar] [CrossRef]
  21. Ali, A.; Zhang, N.; Santos, R.M. Mineral Characterization Using Scanning Electron Microscopy (SEM): A Review of the Fundamentals, Advancements, and Research Directions. Appl. Sci. 2023, 13, 12600. [Google Scholar] [CrossRef]
  22. Deglint, H.J.; Clarkson, C.R.; DeBuhr, C.; Ghanizadeh, A. Live Imaging of Micro-Wettability Experiments Performed for Low-Permeability Oil Reservoirs. Sci. Rep. 2017, 7, 4347. [Google Scholar] [CrossRef]
  23. Ivanova, A.; Orekhov, A.; Markovic, S.; Iglauer, S.; Grishin, P.; Cheremisin, A. Live Imaging of Micro and Macro Wettability Variations of Carbonate Oil Reservoirs for Enhanced Oil Recovery and CO2 Trapping/Storage. Sci. Rep. 2022, 12, 1262. [Google Scholar] [CrossRef] [PubMed]
  24. Song, L.; Ning, Z.F.; Li, N.; Zhang, B.; Ding, G.Y. Microscopic Surface Wettability Electrochemical Characterization of Tight Sandstone with Infrared Spectra Testing. In Proceedings of the IOP Conference Series: Earth and Environmental Science, Qingdao, China, 26–29 June 2017; Institute of Physics Publishing: Bristol, UK, 2017; Volume 82. [Google Scholar]
  25. Al-Khafaji, A.; Wen, D. Quantification of Wettability Characteristics for Carbonates Using Different Salinities. J. Pet Sci. Eng. 2019, 173, 501–511. [Google Scholar] [CrossRef]
  26. Jarrahian, K.; Seiedi, O.; Sheykhan, M.; Sefti, M.V.; Ayatollahi, S. Wettability Alteration of Carbonate Rocks by Surfactants: A Mechanistic Study. Colloids Surf. A Physicochem. Eng. Asp. 2012, 410, 1–10. [Google Scholar] [CrossRef]
  27. Hu, Y.; Zhang, Q.; Zhou, G.; Wang, H.; Bai, Y.; Liu, Y. Influence Mechanism of Surfactants on Wettability of Coal with Different Metamorphic Degrees Based on Infrared Spectrum Experiments. ACS Omega 2021, 6, 22248–22258. [Google Scholar] [CrossRef]
  28. Wang, H.; Zhang, L.; Wang, D.; He, X. Experimental Investigation on the Wettability of Respirable Coal Dust Based on Infrared Spectroscopy and Contact Angle Analysis. Adv. Powder Technol. 2017, 28, 3130–3139. [Google Scholar] [CrossRef]
  29. Kim, T.W.; Kovscek, A.R. Wettability Alteration of a Heavy Oil/Brine/Carbonate System with Temperature. Energy Fuels 2013, 27, 2984–2998. [Google Scholar] [CrossRef]
  30. Valori, A.; Nicot, B. A Review of 60 Years of NMR Wettability. Petrophysics SPWLA J. Form. Eval. Reserv. Descr. 2019, 60, 255–263. [Google Scholar] [CrossRef]
  31. Al-Garadi, K.; El-Husseiny, A.; Elsayed, M.; Connolly, P.; Mahmoud, M.; Johns, M.; Adebayo, A. A Rock Core Wettability Index Using NMR T2 Measurements. J. Pet Sci. Eng. 2022, 208, 109386. [Google Scholar] [CrossRef]
  32. Baban, A.; Al-Yaseri, A.; Keshavarz, A.; Amin, R.; Iglauer, S. CO2—Brine—Sandstone Wettability Evaluation at Reservoir Conditions via Nuclear Magnetic Resonance Measurements. Int. J. Greenh. Gas Control. 2021, 111, 103435. [Google Scholar] [CrossRef]
  33. Legens, C.; Palermo, T.; Toulhoat, H.; Fafet, A.; Koutsoukos, P.; Malmaison, R.; Francé, F.F. Carbonate Rock Wettability Changes Induced by Organic Compound Adsorption. J. Pet Sci. Eng. 1998, 20, 277–282. [Google Scholar] [CrossRef]
  34. Ahmadi, S.; Hosseini, M.; Tangestani, E.; Mousavi, S.E.; Niazi, M. Wettability Alteration and Oil Recovery by Spontaneous Imbibition of Smart Water and Surfactants into Carbonates. Pet. Sci. 2020, 17, 712–721. [Google Scholar] [CrossRef]
  35. Li, Z.; Xu, Z.; Ayirala, S.; Yousef, A. Smart Water Effects on Wettability, Adhesion, and Oil Liberation in Carbonates. SPE J. 2020, 25, 1771–1783. [Google Scholar] [CrossRef]
  36. Mirzaei-Paiaman, A. New Methods for Qualitative and Quantitative Determination of Wettability from Relative Permeability Curves: Revisiting Craig’s Rules of Thumb and Introducing Lak Wettability Index. Fuel 2021, 288, 119623. [Google Scholar] [CrossRef]
  37. Mirzaei-Paiaman, A.; Faramarzi-Palangar, M.; Djezzar, S.; Kord, S. A New Approach to Measure Wettability by Relative Permeability Measurements. J. Pet. Sci. Eng. 2022, 208, 109191. [Google Scholar] [CrossRef]
  38. Craig, F.F. The Reservoir Engineering Aspects of Waterflooding; Monograph Series; Society of Petroleum Engineers (SPE)CiNii Labs: Calgary, AB, Canada, 1971. [Google Scholar]
  39. Mahani, H.; Keya, A.L.; Berg, S.; Bartels, W.B.; Nasralla, R.; Rossen, W.R. Insights into the Mechanism of Wettability Alteration by Low-Salinity Flooding (LSF) in Carbonates. Energy Fuels 2015, 29, 1352–1367. [Google Scholar] [CrossRef]
  40. Alomair, O.; Al-Dousari, M.; Azubuike, N.; Garrouch, A.A. Evaluation of the Impact of Low-Salinity Water on Wettability Alteration and Oil Recovery in Berea Sandstones. Fuel 2023, 337, 127151. [Google Scholar] [CrossRef]
  41. Tang, G.Q.; Morrow, N.R. Salinity, Temperature, Oil Composition, and Oil Recovery by Waterflooding. SPE Reserv. Eng. 1997, 12, 269–276. [Google Scholar] [CrossRef]
  42. Nasralla, R.A.; Bataweel, M.A.; Nasr-El-Din, H.A. Investigation of Wettability Alteration and Oil-Recovery Improvement by Low-Salinity Water in Sandstone Rock. J. Can. Pet. Technol. 2013, 52, 144–154. [Google Scholar] [CrossRef]
  43. Morrow, N.; Buckley, J.; Morrow, N.R. Improved Oil Recovery by Low-Salinity Waterflooding. J. Pet. Technol. 2011, 63, 106–112. [Google Scholar] [CrossRef]
  44. Rezaeidoust, A.; Puntervold, T.; Strand, S.; Austad, T. Smart Water as Wettability Modifier in Carbonate and Sandstone: A Discussion of Similarities/Differences in the Chemical Mechanisms. Energy Fuels 2009, 23, 4479–4485. [Google Scholar] [CrossRef]
  45. Kallel, W.; van Dijke, M.I.J.; Sorbie, K.S.; Wood, R.; Jiang, Z.; Harland, S. Modelling the Effect of Wettability Distributions on Oil Recovery from Microporous Carbonate Reservoirs. Adv. Water Resour. 2016, 95, 317–328. [Google Scholar] [CrossRef]
  46. Boampong, L.O.; Rafati, R.; Haddad, A.S. Modelling of Carbonate Rock Wettability Based on Surface Charge and Calcite Dissolution. Fuel 2023, 331, 125856. [Google Scholar] [CrossRef]
  47. Keradeh, M.P.; Tabatabaei-Nezhad, S.A. Investigation of the Effect of Diethylene Triamine Pentaacetic Acid Chelating Agent as an Enhanced Oil Recovery Fluid on Wettability Alteration of Sandstone Rocks. Pet. Explor. Dev. 2023, 50, 675–687. [Google Scholar] [CrossRef]
  48. Standnes, D.C.; Nogaret, L.A.D.; Chen, H.L.; Austad, T. An Evaluation of Spontaneous Imbibition of Water into Oil-Wet Carbonate Reservoir Cores Using a Nonionic and a Cationic Surfactant. Energy Fuels 2002, 16, 1557–1564. [Google Scholar] [CrossRef]
  49. Chen, P. Enhanced Oil Recovery in Fractured Vuggy Carbonates. Ph.D. Thesis, The University of Texas at Austin, Austin, TX, USA, 2014. [Google Scholar]
  50. Karimi, M.; Al-Maamari, R.S.; Ayatollahi, S.; Mehranbod, N. Mechanistic Study of Wettability Alteration of Oil-Wet Calcite: The Effect of Magnesium Ions in the Presence and Absence of Cationic Surfactant. Colloids Surf. A Physicochem. Eng. Asp. 2015, 482, 403–415. [Google Scholar] [CrossRef]
  51. Ahmadali, T.; Gonzalez, M.V.; Harwell, J.H.; Scamehorn, J.F. Reducing Surfactant Adsorption in Carbonate Reservoirs. SPE Reserv. Eng. 1993, 8, 117–122. [Google Scholar] [CrossRef]
  52. Seethepalli, A.; Adibhatla, B.; Mohanty, K.K. Physicochemical Interactions During Surfactant Flooding of Fractured Carbonate Reservoirs. SPE J. 2004, 9, 411–418. [Google Scholar] [CrossRef]
  53. Golabi, E.; Seyedeyn-Azad, F.; Ayatollahi, S.; Hosseni, S.; Dastanian, M. Experimental Study of Anionic and Cationic Surfactants Effects on Reduce of IFT and Wettability Alteration in Carbonate Rock. Int. J. Sci. Eng. Res. 2008, 3, 1–8. [Google Scholar]
  54. Wu, Y.; Shuler, P.J.; Blanco, M.; Tang, Y.; Goddard, W.A. An Experimental Study of Wetting Behavior and Surfactant EOR in Carbonates with Model Compounds. SPE J. 2008, 13, 26–34. [Google Scholar] [CrossRef]
  55. Kubelka, J.; Bai, S.; Piri, M. Effects of Surfactant Charge and Molecular Structure on Wettability Alteration of Calcite: Insights from Molecular Dynamics Simulations. J. Phys. Chem. B 2021, 125, 1293–1305. [Google Scholar] [CrossRef]
  56. Bordeaux Rego, F.; Mehrabi, M.; Sanaei, A.; Sepehrnoori, K. Improvements on Modelling Wettability Alteration by Engineered Water Injection: Geochemical Pore-Scale Approach. In Proceedings of the SPE Improved Oil Recovery, Virtual, 30 August 2020. [Google Scholar]
  57. Gupta, R.; Mohanty, K.K. Wettability Alteration of Fractured Carbonate Reservoirs. In Proceedings of the SPE Symposium on Improved Oil Recovery, Tulsa, OK, USA, 20–23 April 2008; pp. 19–23. [Google Scholar]
  58. Zahid, A.; Stenby, E.H.; Shapiro, A.A. Improved Oil Recovery in Chalk: Wettability Alteration or Something Else? In Proceedings of the SPE EUROPEC/EAGE Annual Conference and Exhibition, Barcelona, Spain, 14–17 June 2010; pp. 14–17. [Google Scholar]
  59. Gupta, R.; Mohanty, K.K. Wettability Alteration Mechanism for Oil Recovery from Fractured Carbonate Rocks. Transp. Porous Media 2011, 87, 635–652. [Google Scholar] [CrossRef]
  60. Abdallah, W.; Gmira, A. Wettability Assessment and Surface Compositional Analysis of Aged Calcite Treated with Dynamic Water. Energy Fuels 2014, 28, 1652–1663. [Google Scholar] [CrossRef]
  61. Høgnesen, E.J.; Strand, S.; Austad, T. Waterflooding of Preferential Oil-Wet Carbonates: Oil Recovery Related to Reservoir Temperature and Brine Composition. In Proceedings of the SPE Europec/EAGE Annual Conference, Madrid, Spain, 13–16 June 2005. [Google Scholar]
  62. Sakthivel, S. Wettability Alteration of Carbonate Reservoirs Using Imidazolium-Based Ionic Liquids. ACS Omega 2021, 6, 30315–30326. [Google Scholar] [CrossRef] [PubMed]
  63. Li, Q.; Wang, Y.; Wang, F.; Wu, J.; Usman Tahir, M.; Li, Q.; Yuan, L.; Liu, Z. Effect of Thickener and Reservoir Parameters on the Filtration Property of CO2 Fracturing Fluid. Energy Sources Part A Recovery Util. Environ. Eff. 2020, 42, 1705–1715. [Google Scholar] [CrossRef]
  64. Li, Q.; Cheng, Y.; Li, Q.; Zhang, C.; Ansari, U.; Song, B. Establishment and Evaluation of Strength Criterion for Clayey Silt Hydrate-Bearing Sediments. Energy Sources Part A Recovery Util. Environ. Eff. 2018, 40, 742–750. [Google Scholar] [CrossRef]
  65. Drexler, S.; Hoerlle, F.; Godoy, W.; Boyd, A.; Couto, P. Wettability Alteration by Carbonated Brine Injection and Its Impact on Pore-Scale Multiphase Flow for Carbon Capture and Storage and Enhanced Oil Recovery in a Carbonate Reservoir. Appl. Sci. 2020, 10, 6496. [Google Scholar] [CrossRef]
  66. Drexler, S.; Silveira, T.M.G.; De Belli, G.; Couto, P. Experimental Study of the Effect of Carbonated Brine on Wettability and Oil Displacement for EOR Application in the Brazilian Pre-Salt Reservoirs. Energy Sources Part A Recovery Util. Environ. Eff. 2021, 43, 3282–3296. [Google Scholar] [CrossRef]
  67. Ruidiaz, E.M.; Winter, A.; Trevisan, O. V Oil Recovery and Wettability Alteration in Carbonates Due to Carbonate Water Injection. J. Pet. Explor. Prod. Technol. 2018, 8, 249–258. [Google Scholar] [CrossRef]
  68. Mehdiyev, F.; Erzuah, S.; Omekeh, A.; Fjelde, I. Surface Complexation Modelling of Wettability Alteration during Carbonated Water Flooding. Energies 2022, 15, 20. [Google Scholar] [CrossRef]
  69. Arjomand, E.; Easton, C.D.; Myers, M.; Tian, W.; Saeedi, A.; Wood, C.D. Changing Sandstone Rock Wettability with Supercritical CO2-Based Silylation. Energy Fuels 2020, 34, 2015–2027. [Google Scholar] [CrossRef]
  70. Nowrouzi, I.; Manshad, A.K.; Mohammadi, A.H. Effects of Ions and Dissolved Carbon Dioxide in Brine on Wettability Alteration, Contact Angle and Oil Production in Smart Water and Carbonated Smart Water Injection Processes in Carbonate Oil Reservoirs. Fuel 2019, 235, 1039–1051. [Google Scholar] [CrossRef]
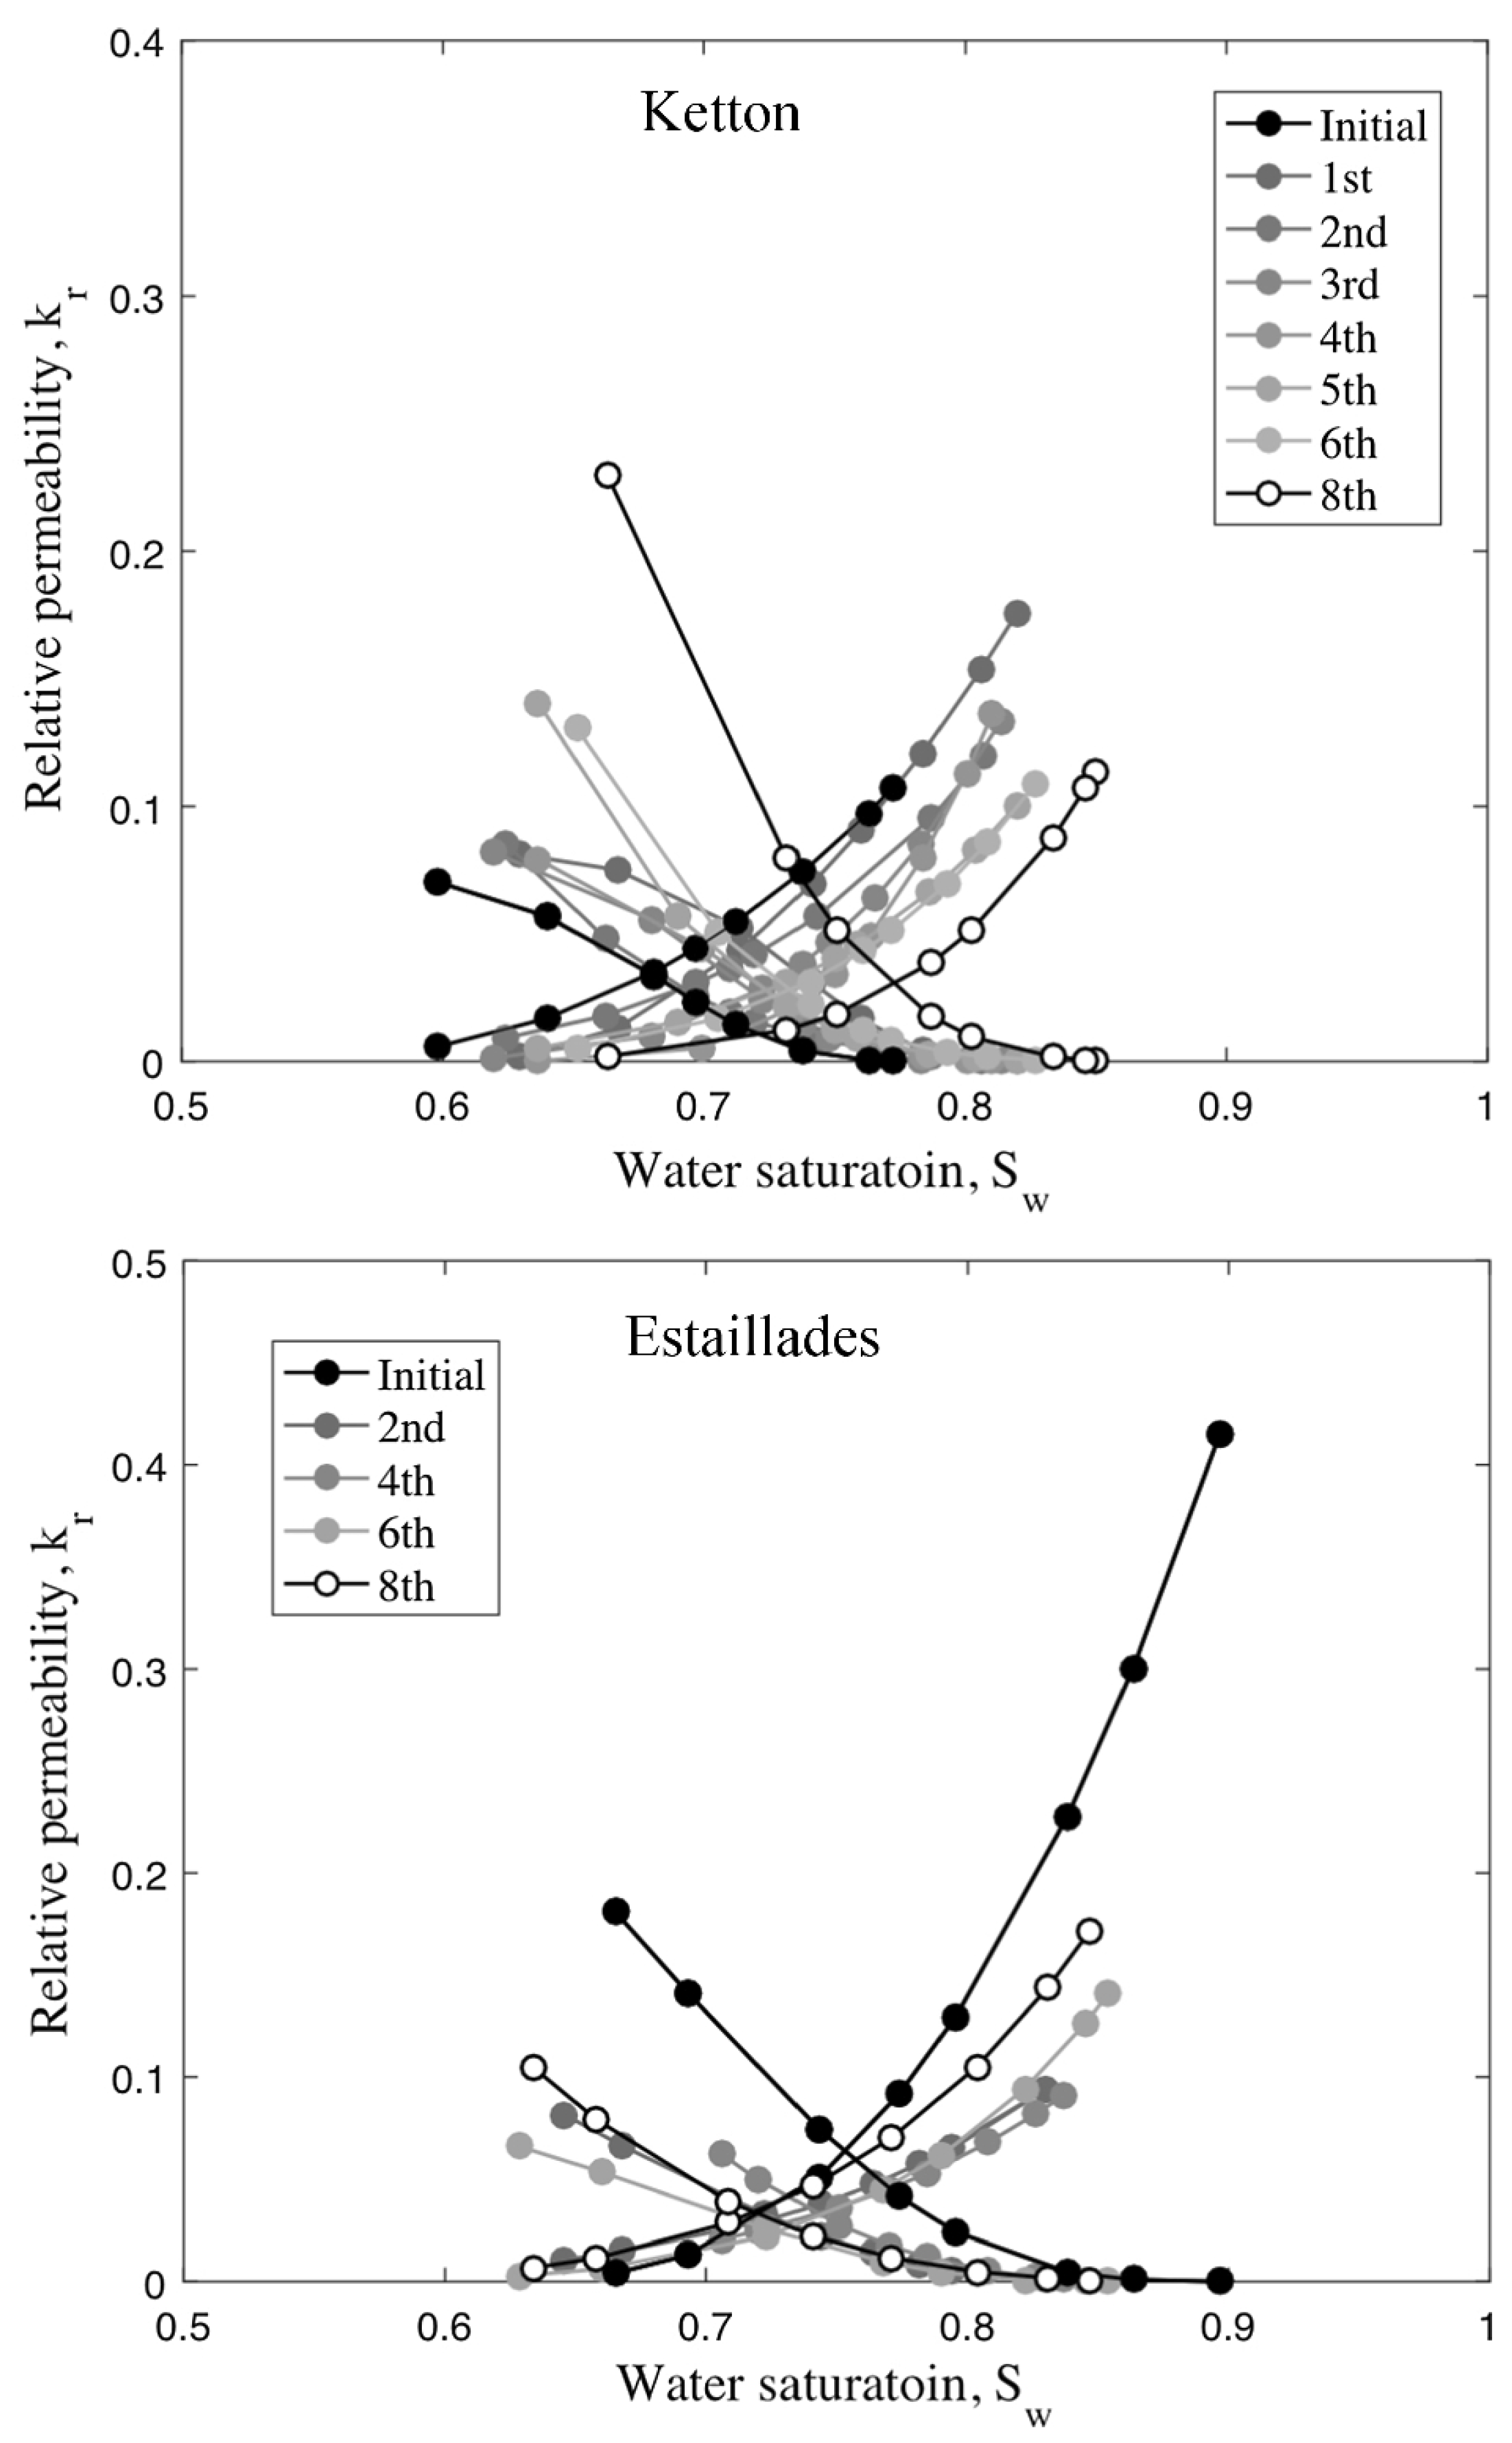
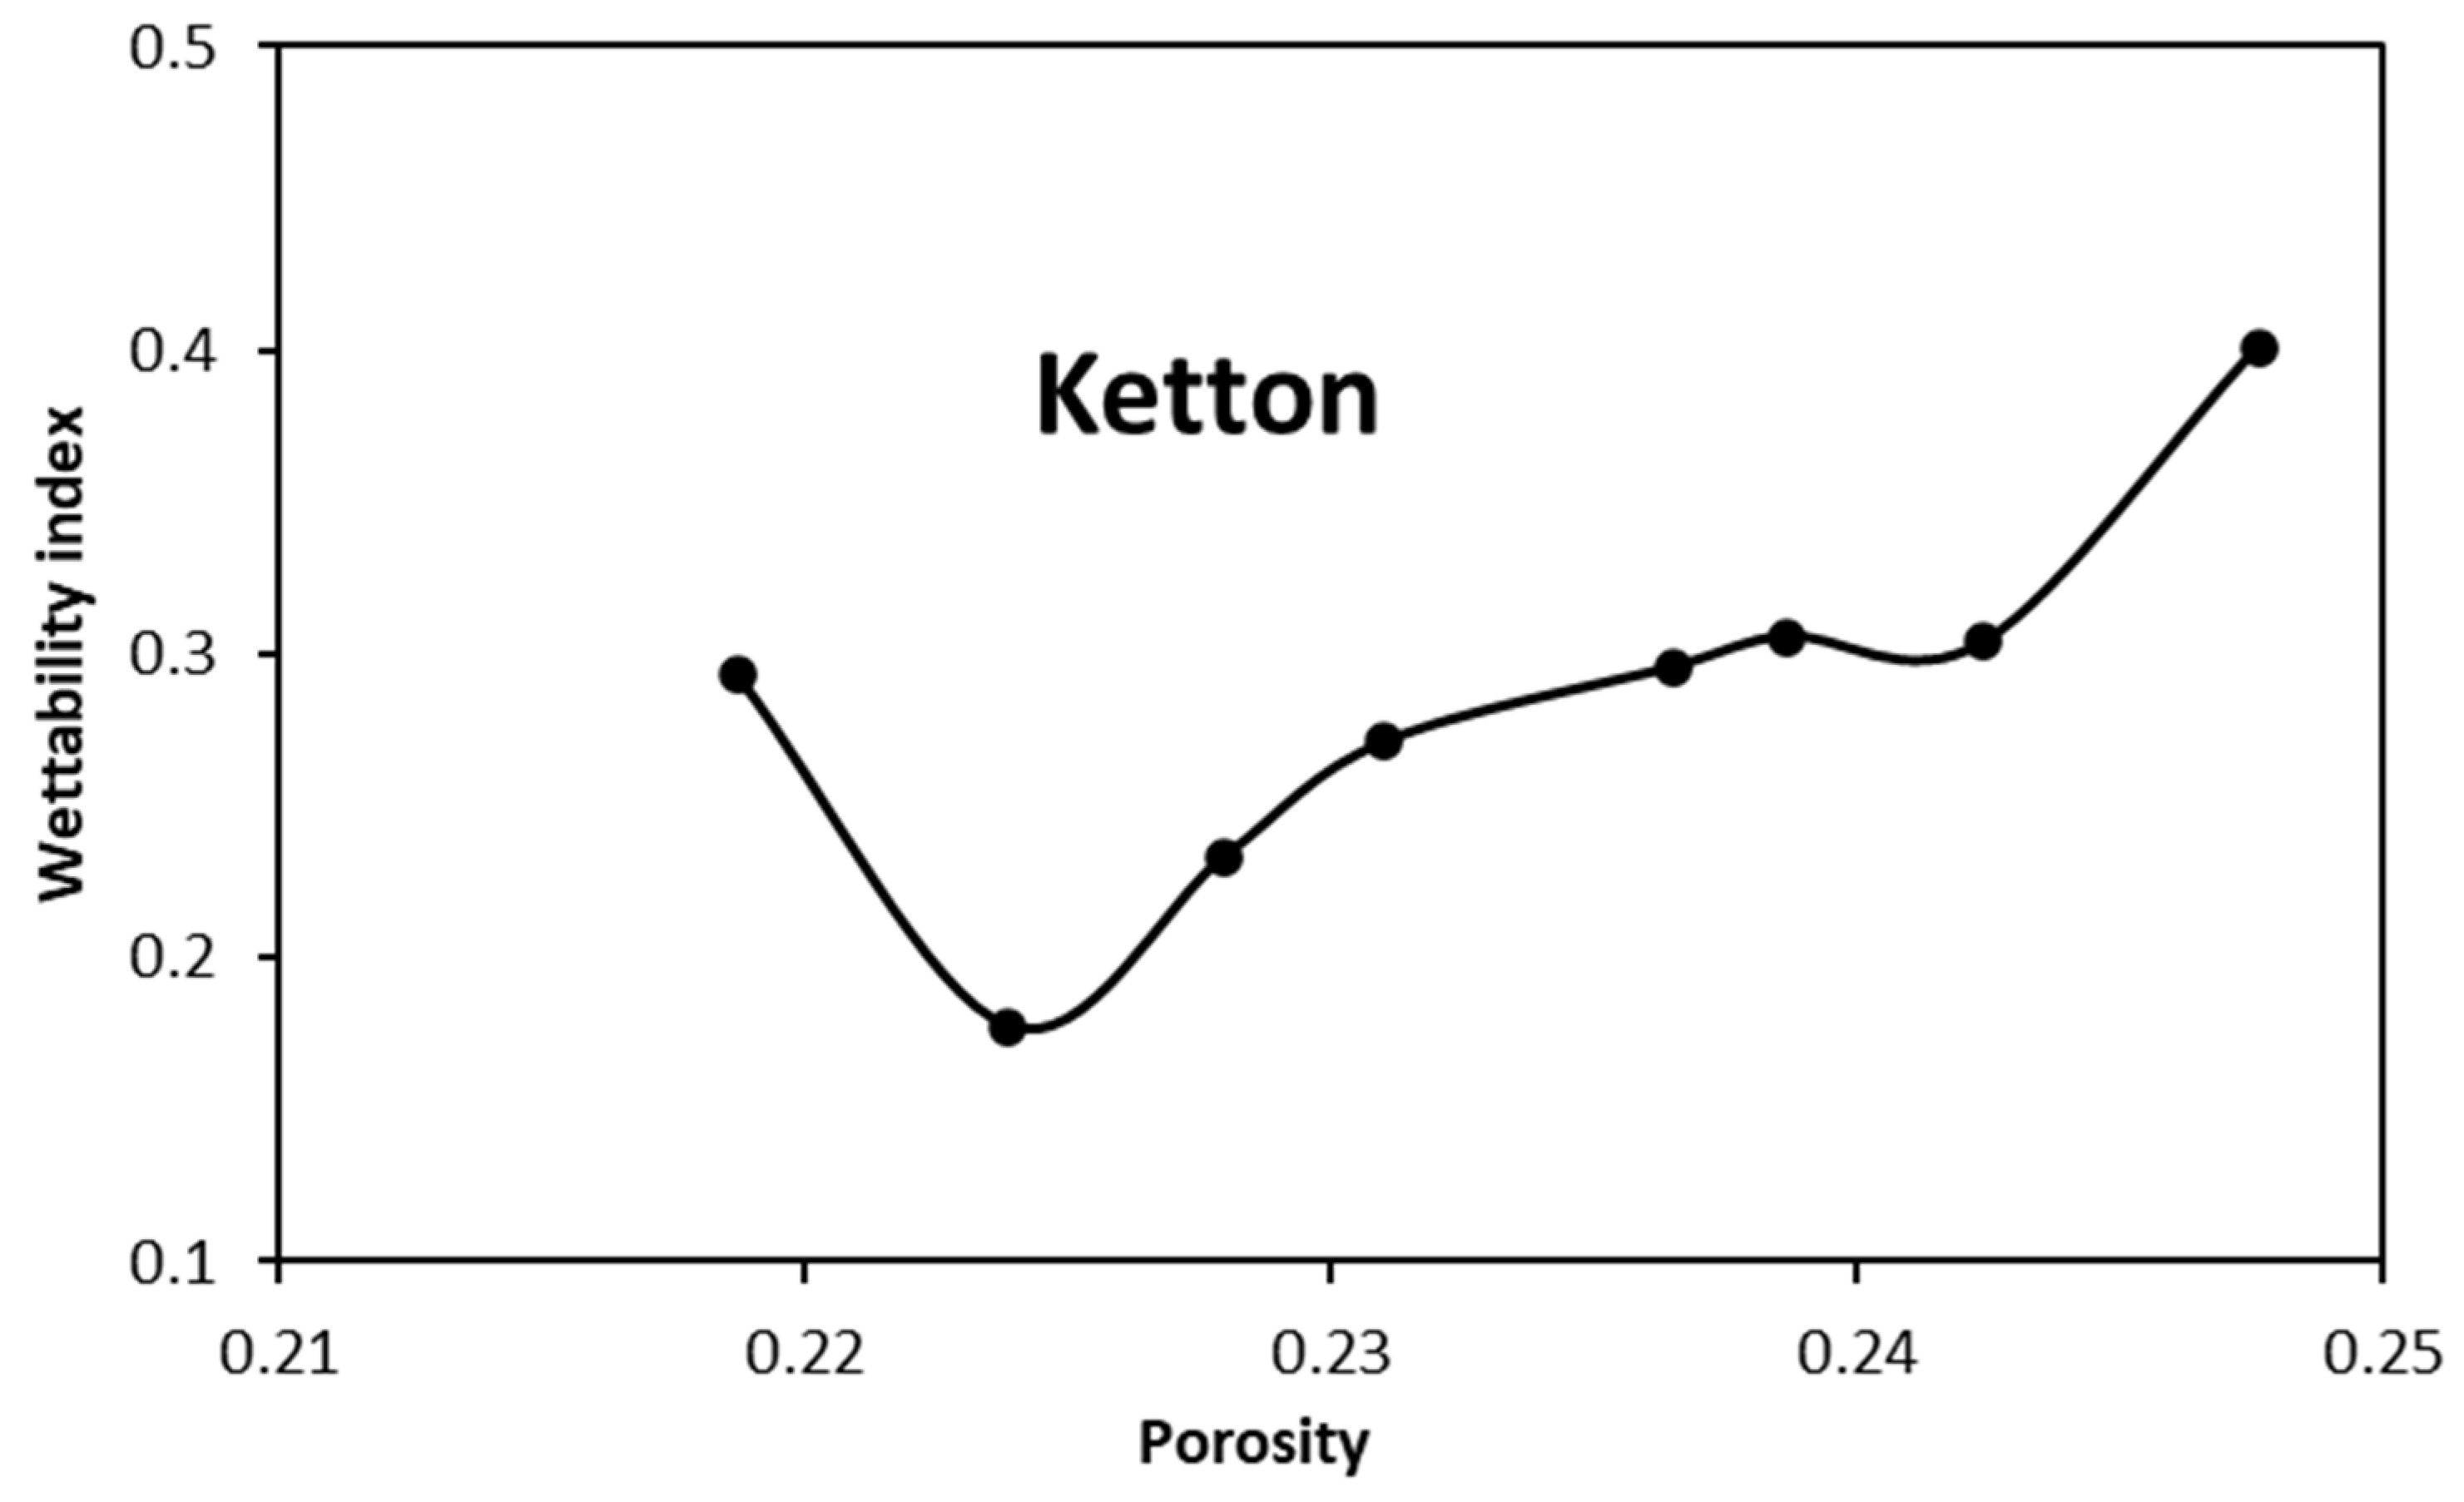
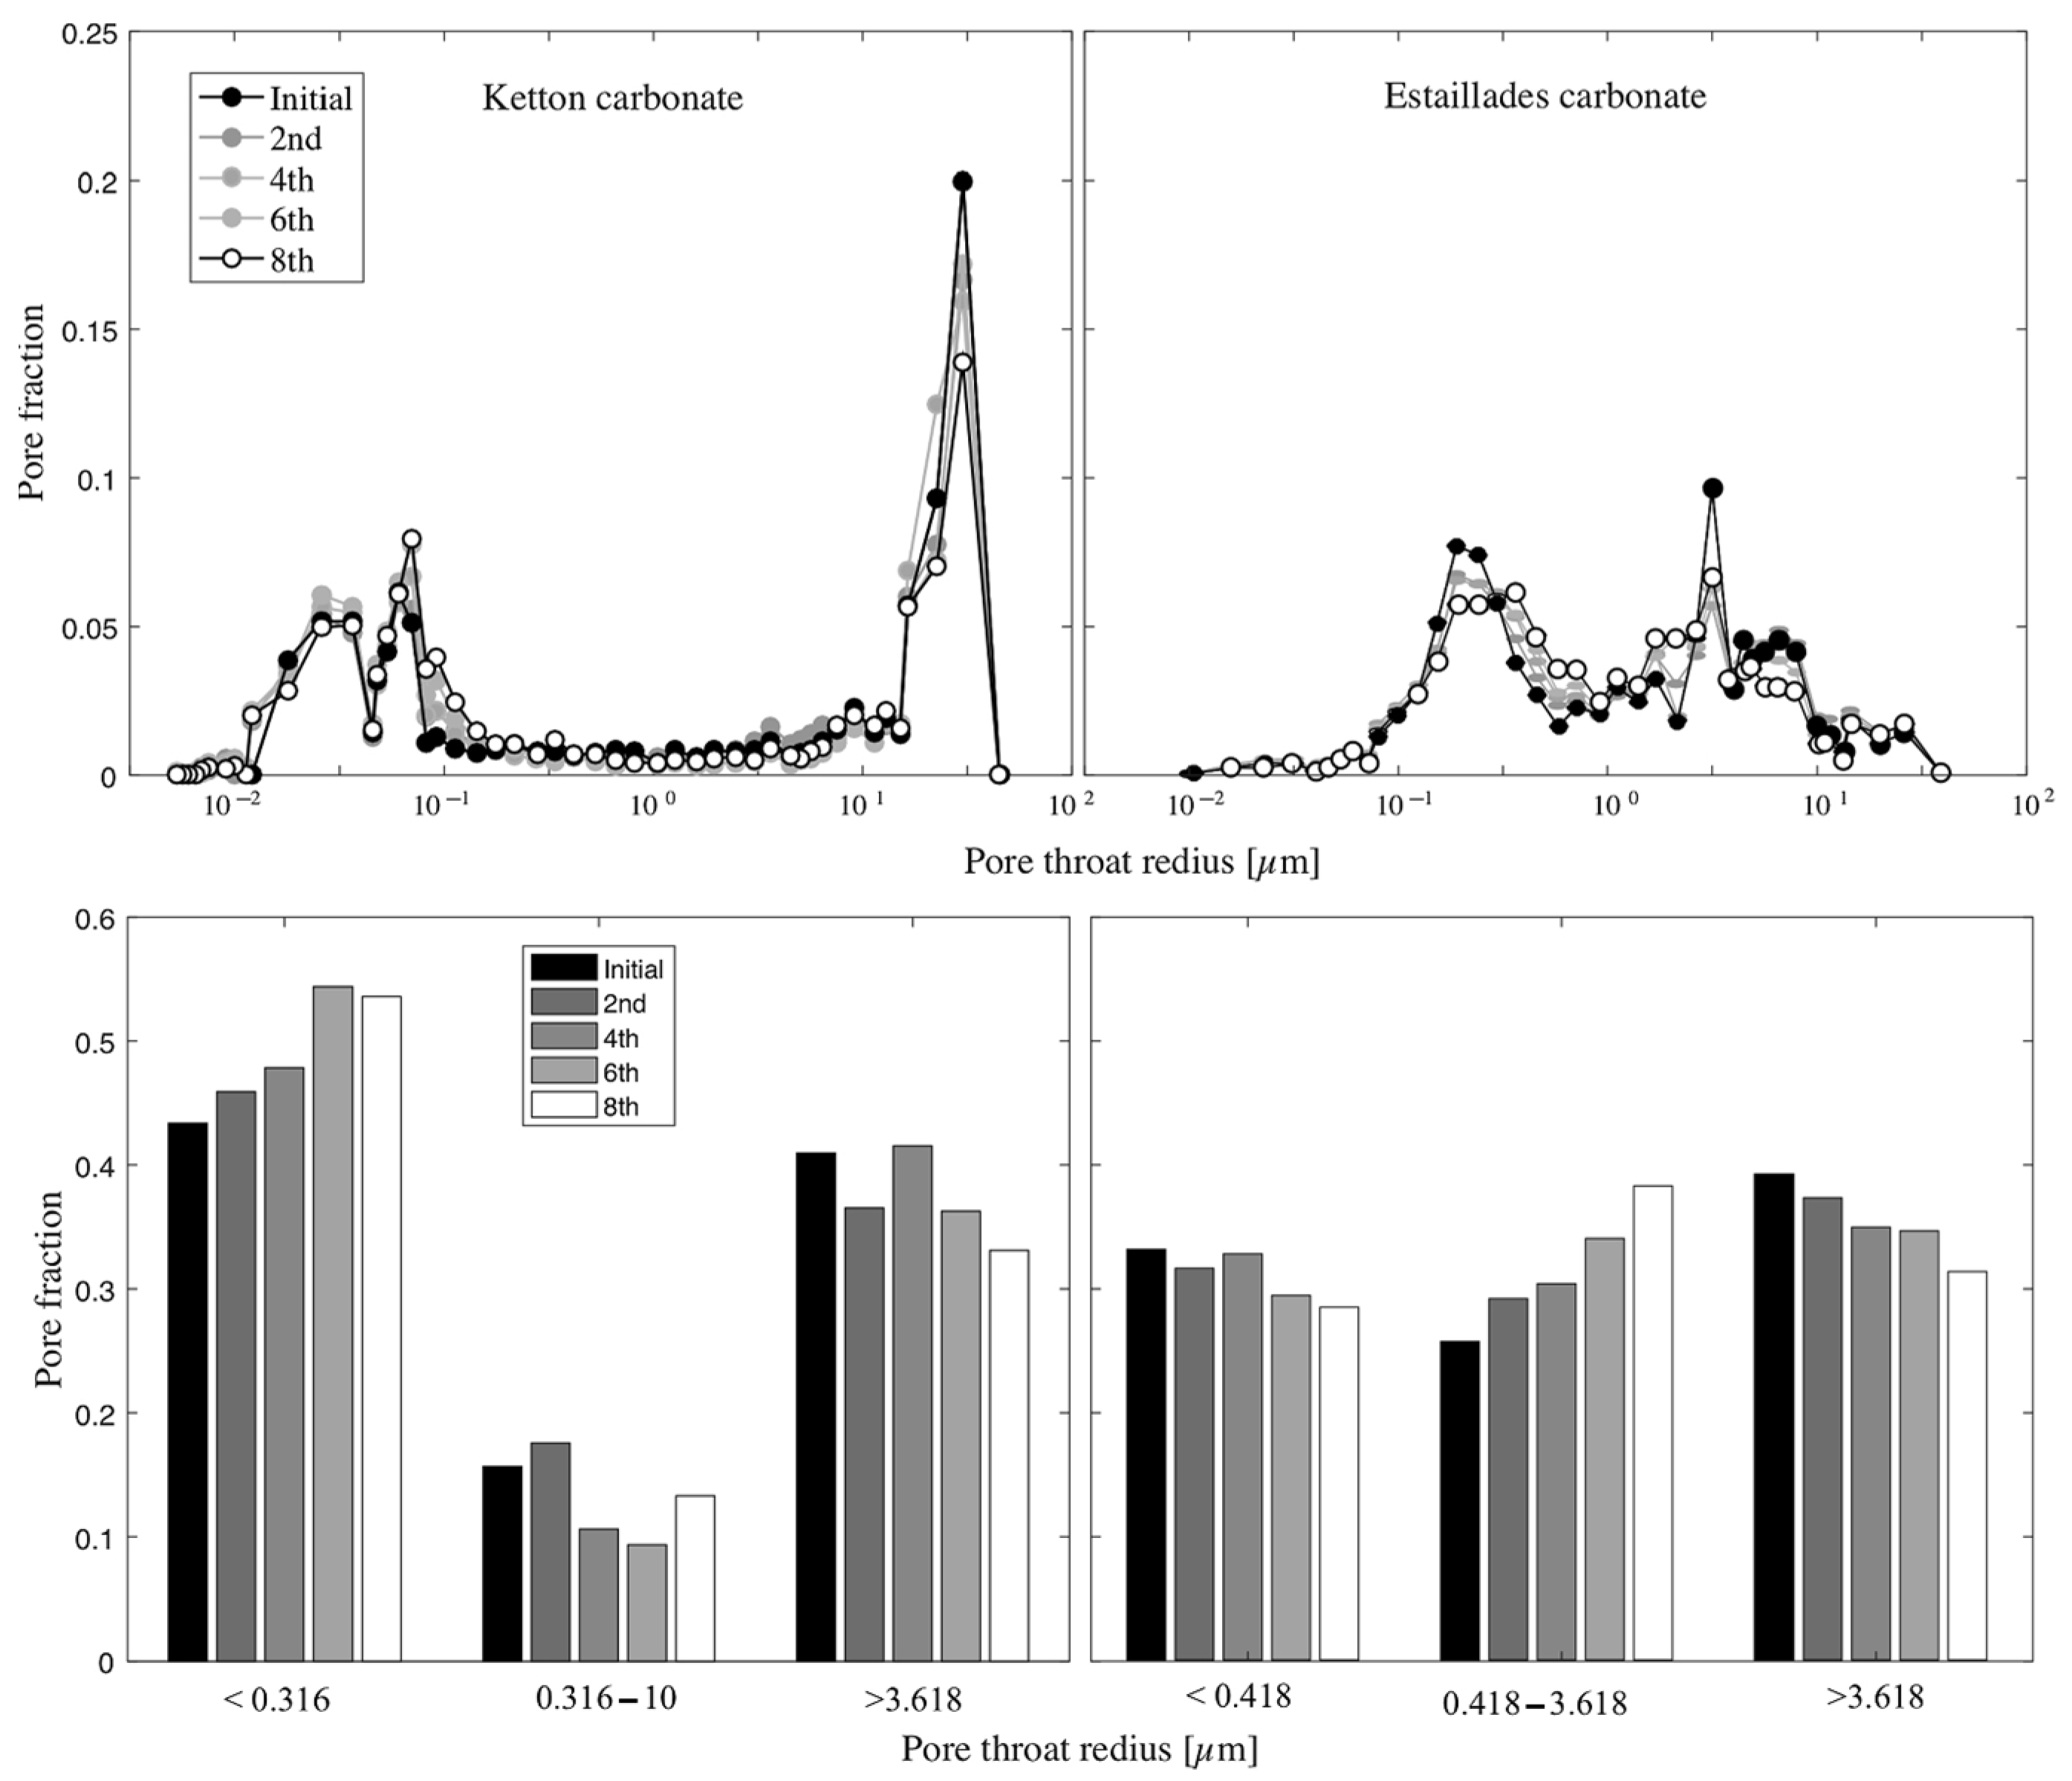
  71. Niu, B.; Krevor, S. The Impact of Mineral Dissolution on Drainage Relative Permeability and Residual Trapping in Two Carbonate Rocks. Transp. Porous Media 2020, 131, 363–380. [Google Scholar] [CrossRef]
  72. Jiang, F.; Tsuji, T. Changes in Pore Geometry and Relative Permeability Caused by Carbonate Precipitation in Porous Media. Phys. Rev. E Stat. Nonlin Soft Matter Phys. 2014, 90, 053306. [Google Scholar] [CrossRef] [PubMed]
  73. McPhee, C.; Reed, J.; Zubizarreta, I. Wettability and Wettability Tests; Elsevier: Amsterdam, The Netherlands, 2015; pp. 313–345. [Google Scholar]
  74. Sagbana, P.I.; Sarkodie, K.; Nkrumah, W.A. A Critical Review of Carbonate Reservoir Wettability Modification during Low Salinity Waterflooding. Petroleum 2023, 9, 317–330. [Google Scholar] [CrossRef]
  75. Anderson, W. Wettability Literature Survey—Part 2: Wettability Measurement. J. Pet. Technol. 1986, 38, 1246–1262. [Google Scholar] [CrossRef]
  76. Abdallah, W.; Buckley, J.S.; Carnegie, A.; Edwards, J.; Herold, B.; Fordham, E.; Graue, A.; Habashy, T.; Seleznev, N.; Signer, C.; et al. Fundamentals of Wettability. Technology 1986, 38, 1125–1144. [Google Scholar]
  77. León Pabón, J.A.; Mejía Pilonieta, T.J.; Carrillo Moreno, L.F.; Buendía Lombana, H.; Zapata, J.F.; Díaz Prada, C.A. Experimental Comparison for the Calculation of Rock Wettability Using the Amott-Harvey Method and a New Visual Method. CTF Cienc. Tecnol. Y Futuro 2014, 5, 5–22. [Google Scholar] [CrossRef]
  78. Thyne, G.D. A Review of the Measurement of Wettability. Available online: https://www.researchgate.net/publication/283055682_A_review_of_the_measurement_of_wettability (accessed on 3 December 2023).
  79. Rücker, M.; Bartels, W.-B.; Garfi, G.; Shams, M.; Bultreys, T.; Boone, M.; Pieterse, S.; Maitland, G.C.; Krevor, S.; Cnudde, V.; et al. Relationship between Wetting and Capillary Pressure in a Crude Oil/Brine/Rock System: From Nano-Scale to Core-Scale. J. Colloid Interface Sci. 2020, 562, 159–169. [Google Scholar] [CrossRef]
  80. Isah, A.; Arif, M.; Mahmoud, M.; Kamal, M.S. Influence of Rock Permeability and Surface Conditioning on Carbonate Wettability: A Link between Contact Angle and Amott-Index. Geoenergy Sci. Eng. 2023, 227, 211892. [Google Scholar] [CrossRef]
  81. Chau, T.T.; Bruckard, W.J.; Koh, P.T.L.; Nguyen, A.V. A Review of Factors That Affect Contact Angle and Implications for Flotation Practice. Adv. Colloid Interface Sci. 2009, 150, 106–115. [Google Scholar] [CrossRef]
  82. Meng, W.; Zhang, Y.; Pei, H.; Yu, J.; Hu, Y.; Gu, Z.; Su, J. Pore-Scale Investigation on the Effect of Capillary Barrier on Two-Phase Displacement in Dual-Structure Porous Media. Phys. Fluids 2024, 36, 012003. [Google Scholar] [CrossRef]
  83. Bolysbek, D.A.; Kuljabekov, A.B.; Uzbekaliyev, K.S.; Assilbekov, B.K. Effect of Rock Dissolution on Two-Phase Relative Permeabilities: Pore-Scale Simulations Based on Experimental Data. Appl. Sci. 2023, 13, 11385. [Google Scholar] [CrossRef]
  84. Ning, T.; Xi, M.; Hu, B.; Wang, L.; Huang, C.; Su, J. Effect of Viscosity Action and Capillarity on Pore-Scale Oil–Water Flowing Behaviors in a Low-Permeability Sandstone Waterflood. Energies 2021, 14, 8200. [Google Scholar] [CrossRef]
Figure 1. Amott wetting technique [7].
Applsci 14 08663 g001
Figure 2. The capillary pressure curves for the USBM method [9].
Applsci 14 08663 g002
Figure 3. Separation test for materials: (a) oil-wet; (b) water-wet [11].
Applsci 14 08663 g003
Figure 4. Schematic of surface wetting angles Θ. γ S O , γ O W and γ S W are surface energies between surface and oil, oil and water, and surface and water, respectively. Here (a) the surface is water-wet, (b) intermediate-wet, (c) strongly oil-wet [15].
Applsci 14 08663 g004
Figure 5. Measured wetting angles on the processed image from micro-CT. Angles were measured through the non-wetting phase (scCO2) and are shown by the pink arc. Angles indicated are additions measured through the wetting gray phase: (A) 53°; (B) 42° [20].
Applsci 14 08663 g005
Figure 6. SEM images of the calcite surface before (a) and after (b) soaking in palmitic acid. Examples of wetting angle measurements on the calcite surface before (c) and after soaking (d) in palmitic acid [23].
Applsci 14 08663 g006
Figure 7. Infrared spectra of the dense sandstone Chang 7 [24].
Applsci 14 08663 g007
Figure 8. Infrared spectra of fresh and treated calcite and dolomite particles [25].
Applsci 14 08663 g008
Figure 9. TGA results of oil-wet carbonate samples after treatment with modified seawater: SW3S, SW3Mg, and SW [34].
Applsci 14 08663 g009
Figure 10. (a) A schematic representation of the areas under the relative permeability curves for water and oil, as well as the determination of the modified wettability index using the Lak method; (b) the imbibition relative permeability data of the tested samples 3 and 4 of the first dataset [37].
Applsci 14 08663 g010
Figure 11. Correlations between various wettability indices for the carbonate samples: (A) I U S B M vs. I A H ; (B) I A H vs. I M L ; (C) I U S B M vs. I M L ; (D) I L vs. I M L ; (E) I A H vs. I L ; (F) I U S B M vs. I L [37].
Applsci 14 08663 g011
Figure 12. The contact angle of oil droplets on limestone at high salinities of FW and SW. L 1 and L 2 represent the diameters of the droplets, which decrease as the contact angle increases [39].
Applsci 14 08663 g012
Figure 13. Images of the contact angles of crude oil on mica in various brines at a pressure of 1000 psi and a temperature of 212 °F. These images are magnified, with actual dimensions of 4.5 ± 0.5 mm by 4.5 ± 0.5 mm [42].
Applsci 14 08663 g013
Figure 14. Average USBM index values obtained for rock samples I, II, and III as a function of water mineralization level [40].
Applsci 14 08663 g014
Figure 15. The wettability angle of sandstone and oil in the presence of solutions with varying mass fractions [47].
Applsci 14 08663 g015
Figure 16. Proposed mechanisms of wettability alteration for oil-wet calcite surfaces after treatment with magnesium chloride solution: (a) magnesium ions may replace calcium ions on the surface and desorb the Ca2⁺–carboxylate complex, thereby altering the surface wettability; (b) magnesium ions may interact with adsorbed carboxylate, bind with the carboxylate group, and remove the carboxylate from the surface [50].
Applsci 14 08663 g016
Figure 17. The effect of concentrations of ionic liquid [C12mim]⁺[Cl] on the wettability angle of the oil–rock–seawater system at 25 °C for (a) brine-saturated and (b) oil-saturated rocks [62].
Applsci 14 08663 g017
Figure 18. Effect of carbon dioxide on droplet shape and contact angle on limestone surface [65].
Applsci 14 08663 g018
Figure 19. Relative permeabilities for Ketton (top) and Estaillades (bottom) carbonates at different dissolution stages [71].
Applsci 14 08663 g019
Figure 20. Changes in wettability index with respect to porosity during dissolution for the Ketton sample.
Applsci 14 08663 g020
Figure 21. Pore size distribution for Ketton (left) and Estaillades (right) carbonates at different dissolution stages. The top row shows the raw data, while the bottom row presents pore sizes divided into three categories to more clearly illustrate trends in pore structure evolution [71].
Applsci 14 08663 g021
Figure 22. Changes in wettability index with respect to porosity during dissolution for the Estaillades sample.
Applsci 14 08663 g022
Figure 23. Changes in the Land trapping coefficient as a function of porosity for Ketton carbonates (top) and Estaillades carbonates (bottom) [71].
Applsci 14 08663 g023
Figure 24. The evolution of relative permeability with changes in porosity (0.210–0.103) of Berea sandstone due to precipitation under the first (left) and second (right) clogging models [72].
Applsci 14 08663 g024
Figure 25. Changes in wettability as a function of porosity during carbonate precipitation according to the first model.
Applsci 14 08663 g025
Figure 26. The evolution of pore structure due to precipitation according to the first model at cross-sections perpendicular to the flow direction (light gray, initial; dark red, plugged areas) [72].
Applsci 14 08663 g026
Figure 27. Changes in wettability as a function of porosity during carbonate precipitation according to the second model.
Applsci 14 08663 g027
Figure 28. The evolution of pore space distribution in the second clogging model (light gray, initial; dark red, plugged areas) [72].
Applsci 14 08663 g028
Table 1. Rock wettability and the Amott–Harvey index.
TypeAmott–Harvey Wettability Index
water-wet0.3–1
mixed-wet−0.3–0.3
oil-wet−1~−0.3
Table 2. Rock wettability and the USBM index.
TypeUSBM Wettability Index
water-wet>0
mixed-wet~0
oil-wet<0
Table 3. Dependence of wettability estimation on contact angle value [17].
TypeContact Angle (deg.)
water-wet0–80
intermediate-wet80–100
oil-wet100–160
strongly oil-wet160–180
Table 4. Properties of the samples [71].
RockDiameter (cm)Length (cm)PorosityPermeability (mD)
Ketton3816.40.2182840
Estaillades3816.50.279196
Disclaimer/Publisher’s Note: The statements, opinions and data contained in all publications are solely those of the individual author(s) and contributor(s) and not of MDPI and/or the editor(s). MDPI and/or the editor(s) disclaim responsibility for any injury to people or property resulting from any ideas, methods, instructions or products referred to in the content.

