Modeling and Optimization of Wireless Signal Transmission Characteristics of Mine Roadway Based on 3D Ray-Tracing Method

 ,
,
Abstract
:1. Introduction
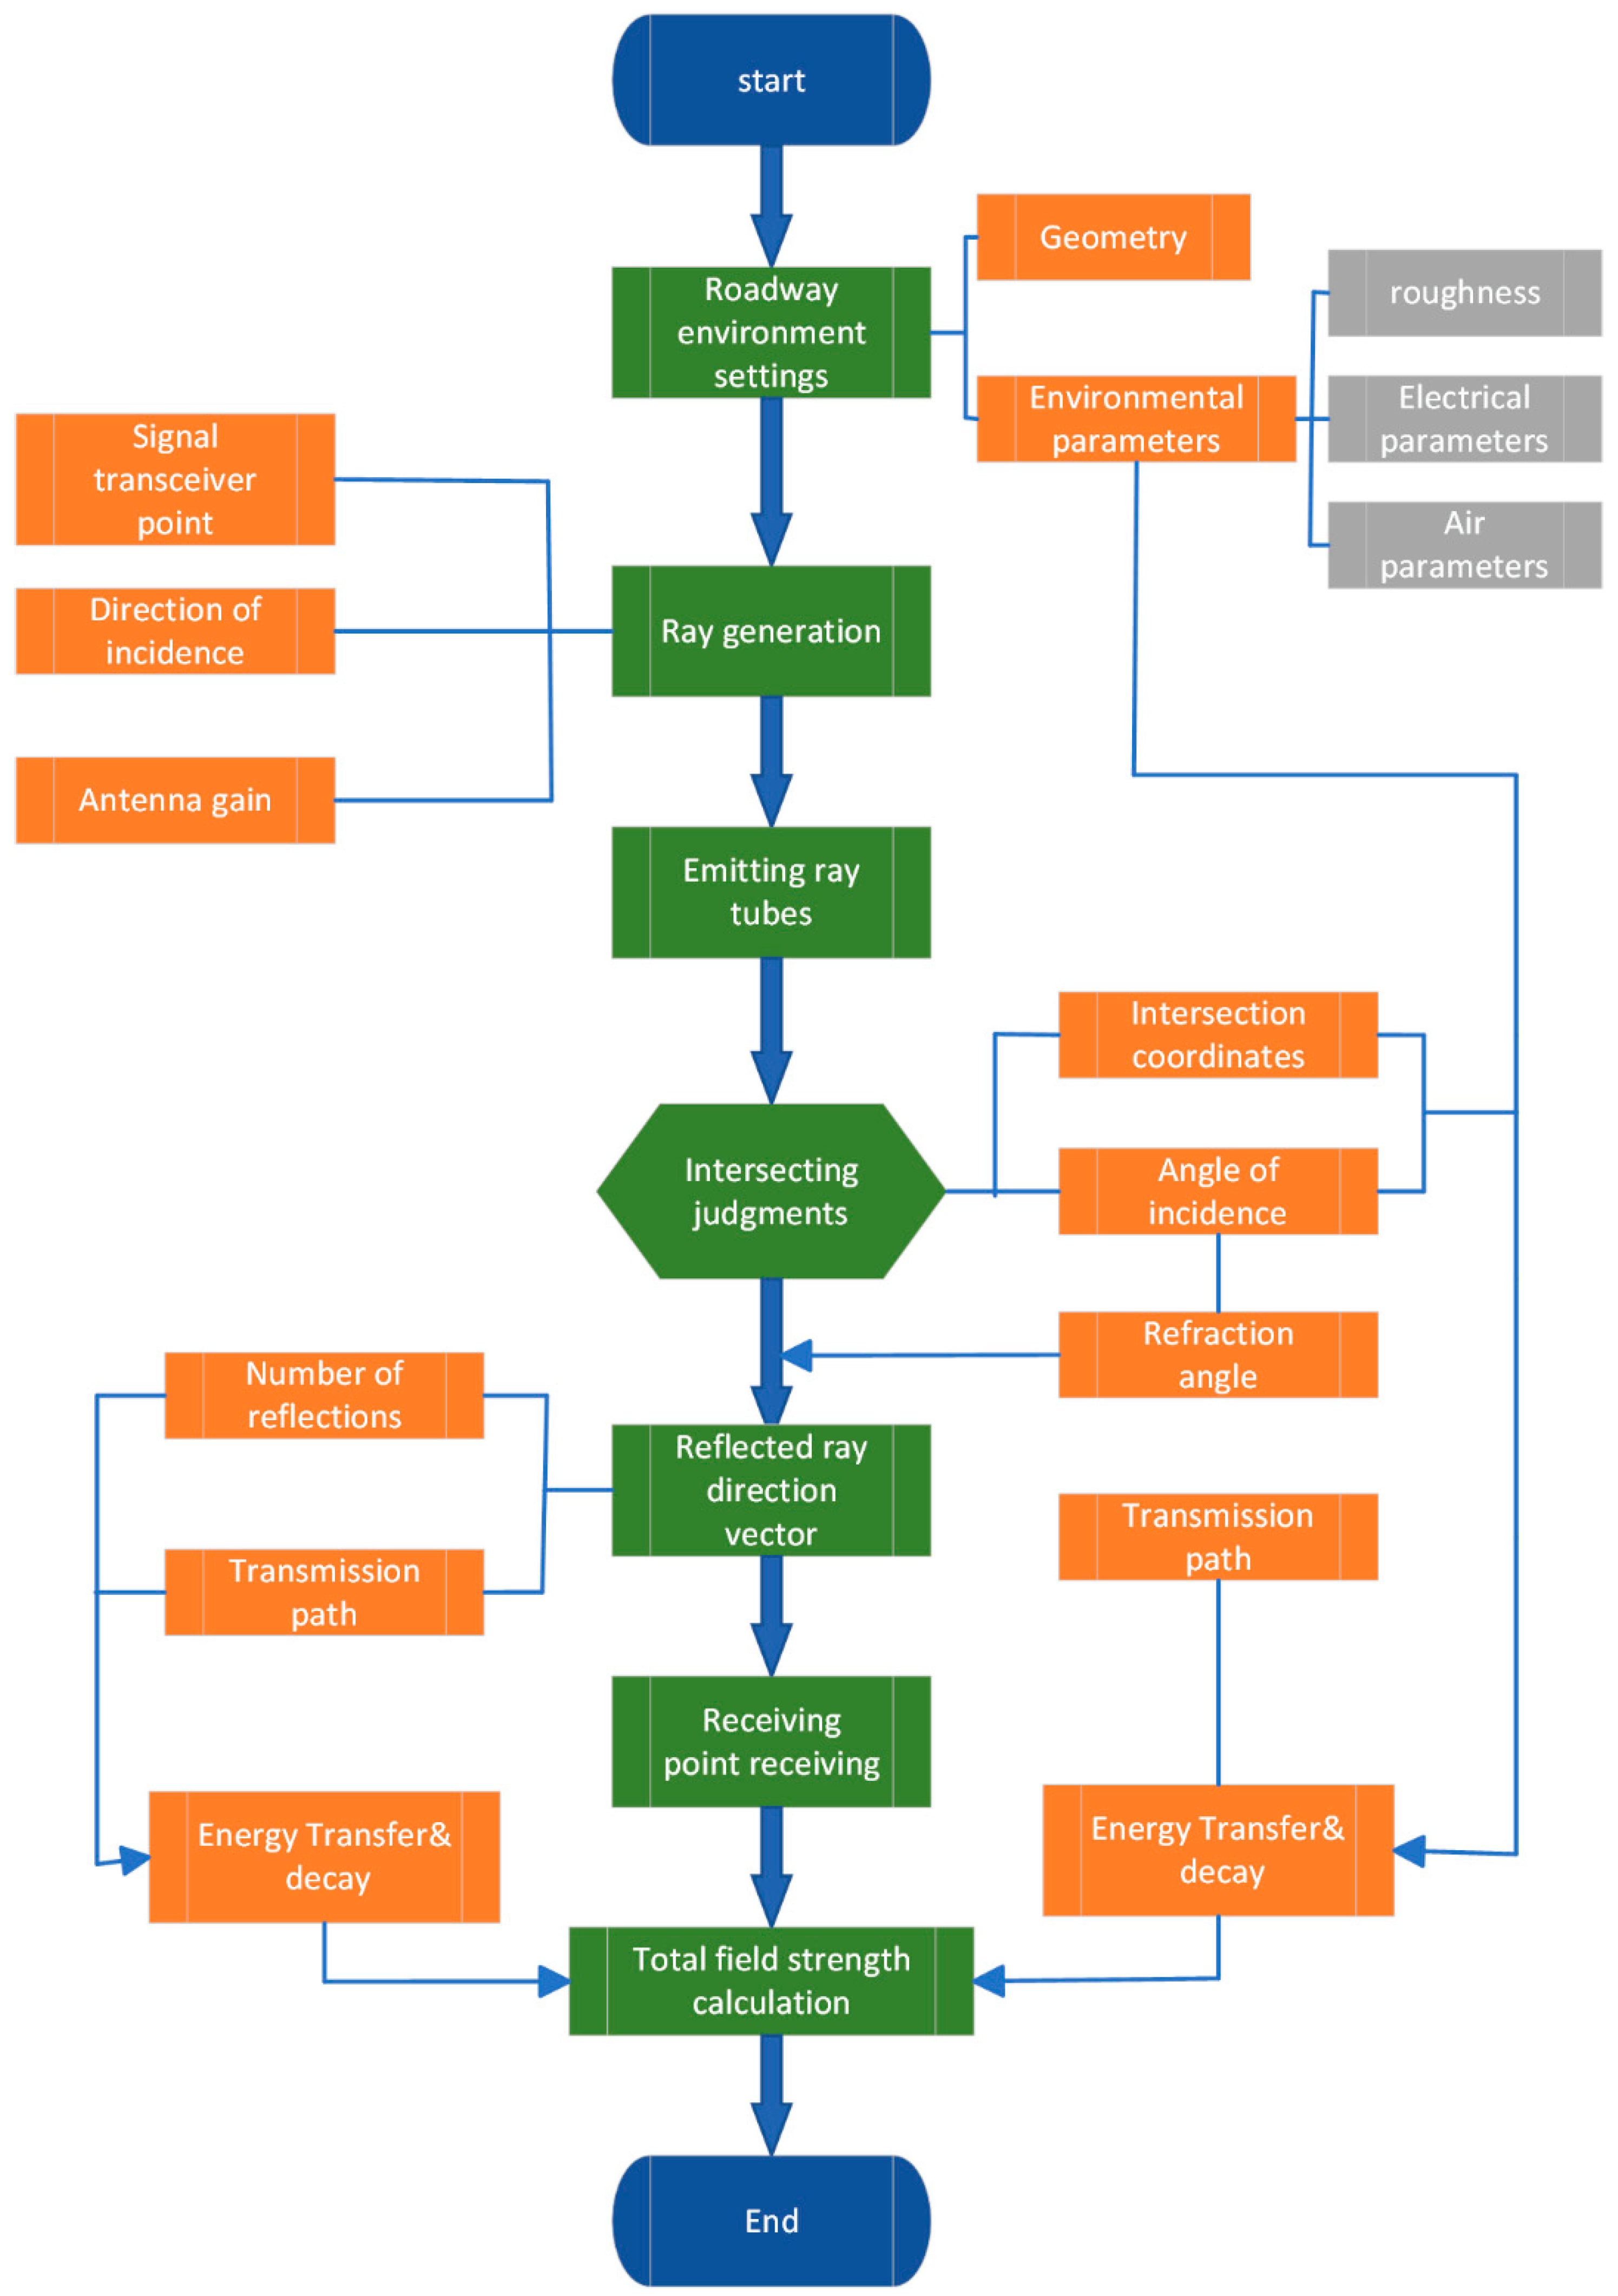
2. Three-Dimensional Ray-Tracing Model
2.1. Three-Dimensional Ray-Tracing and Acceleration Algorithm
2.2. Total Transmission Loss
2.3. Path Correction of the Multipath Transmission Model
3. Simulation Testing
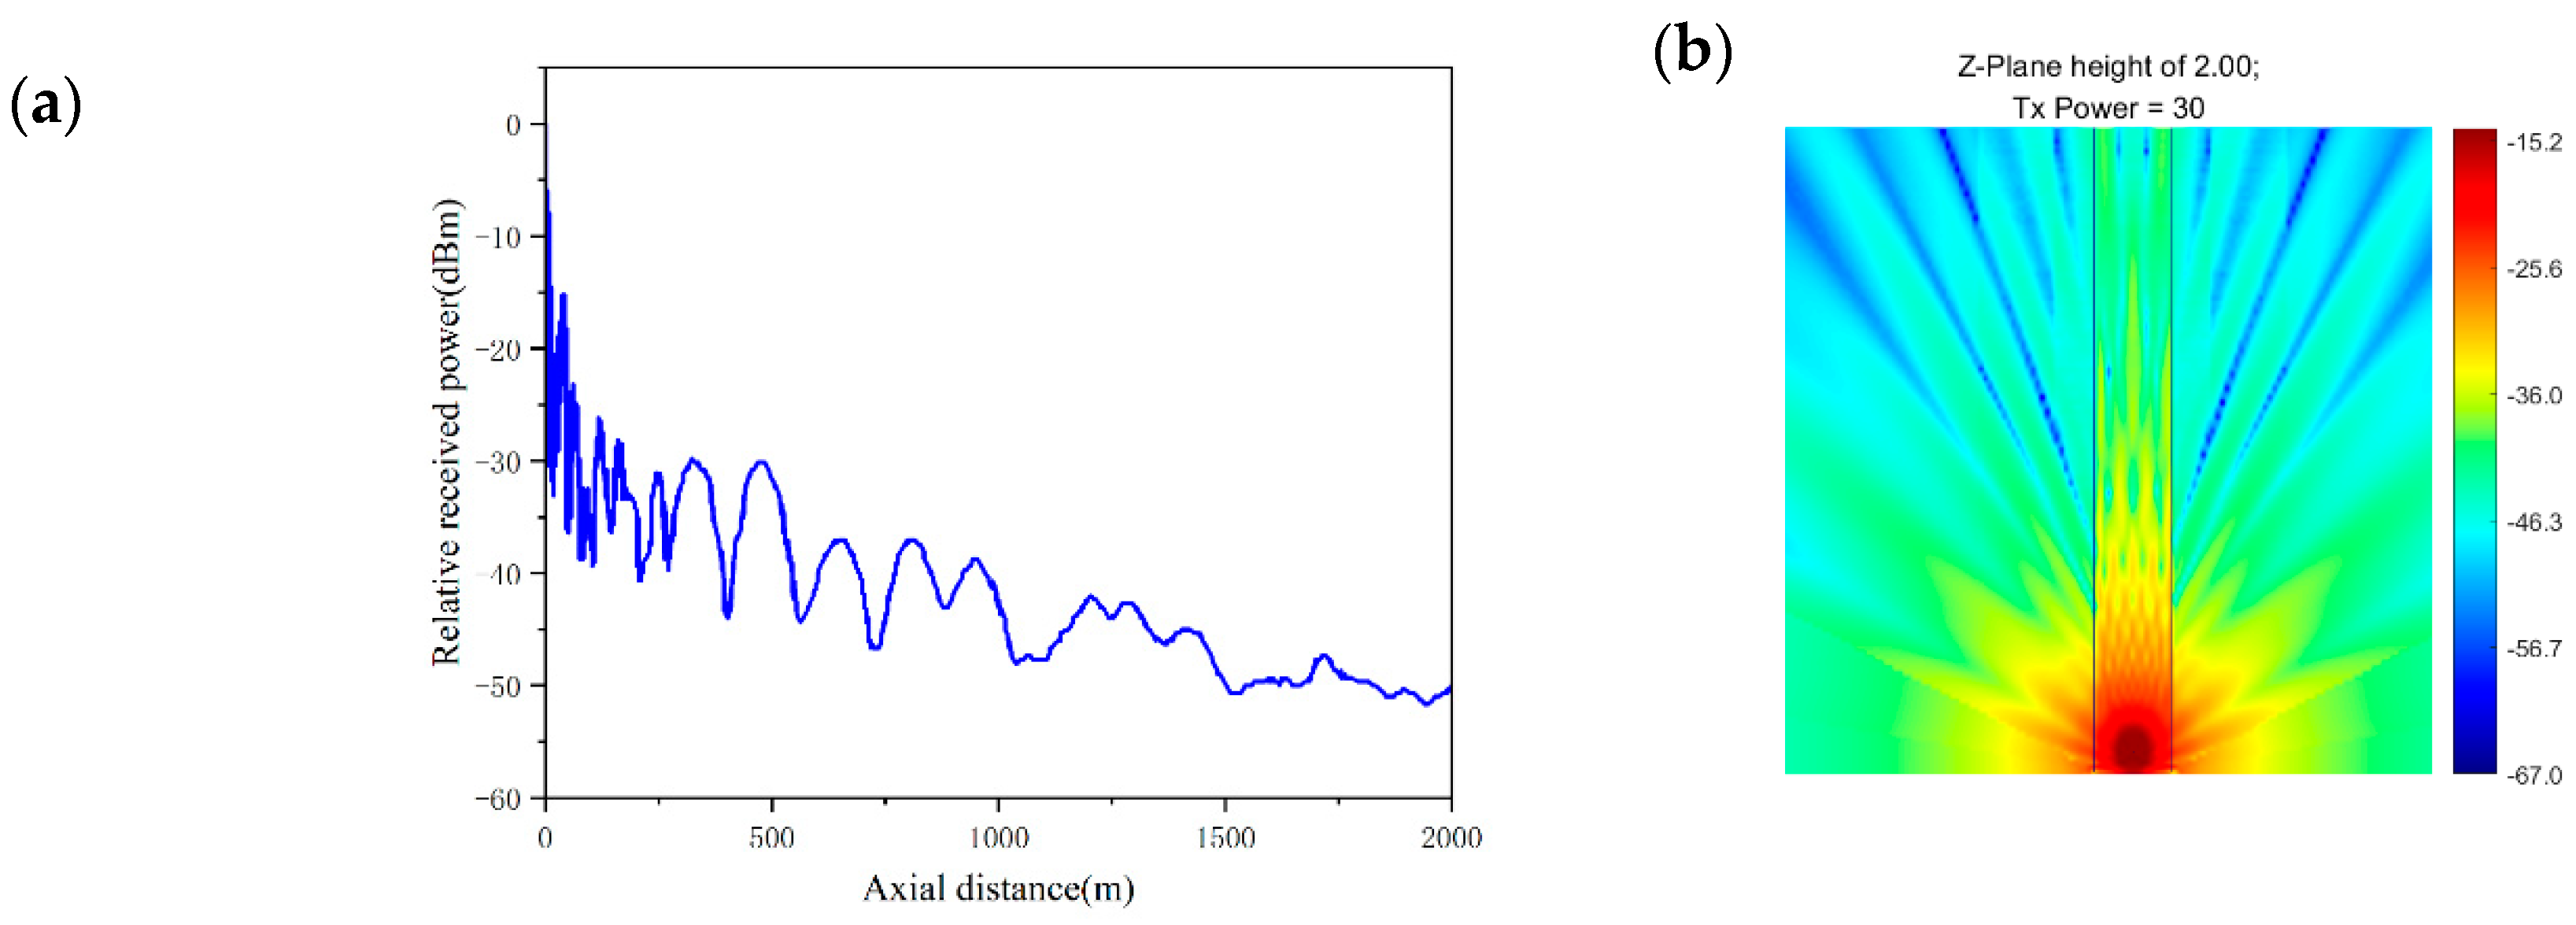
- Signal frequency
- 2.
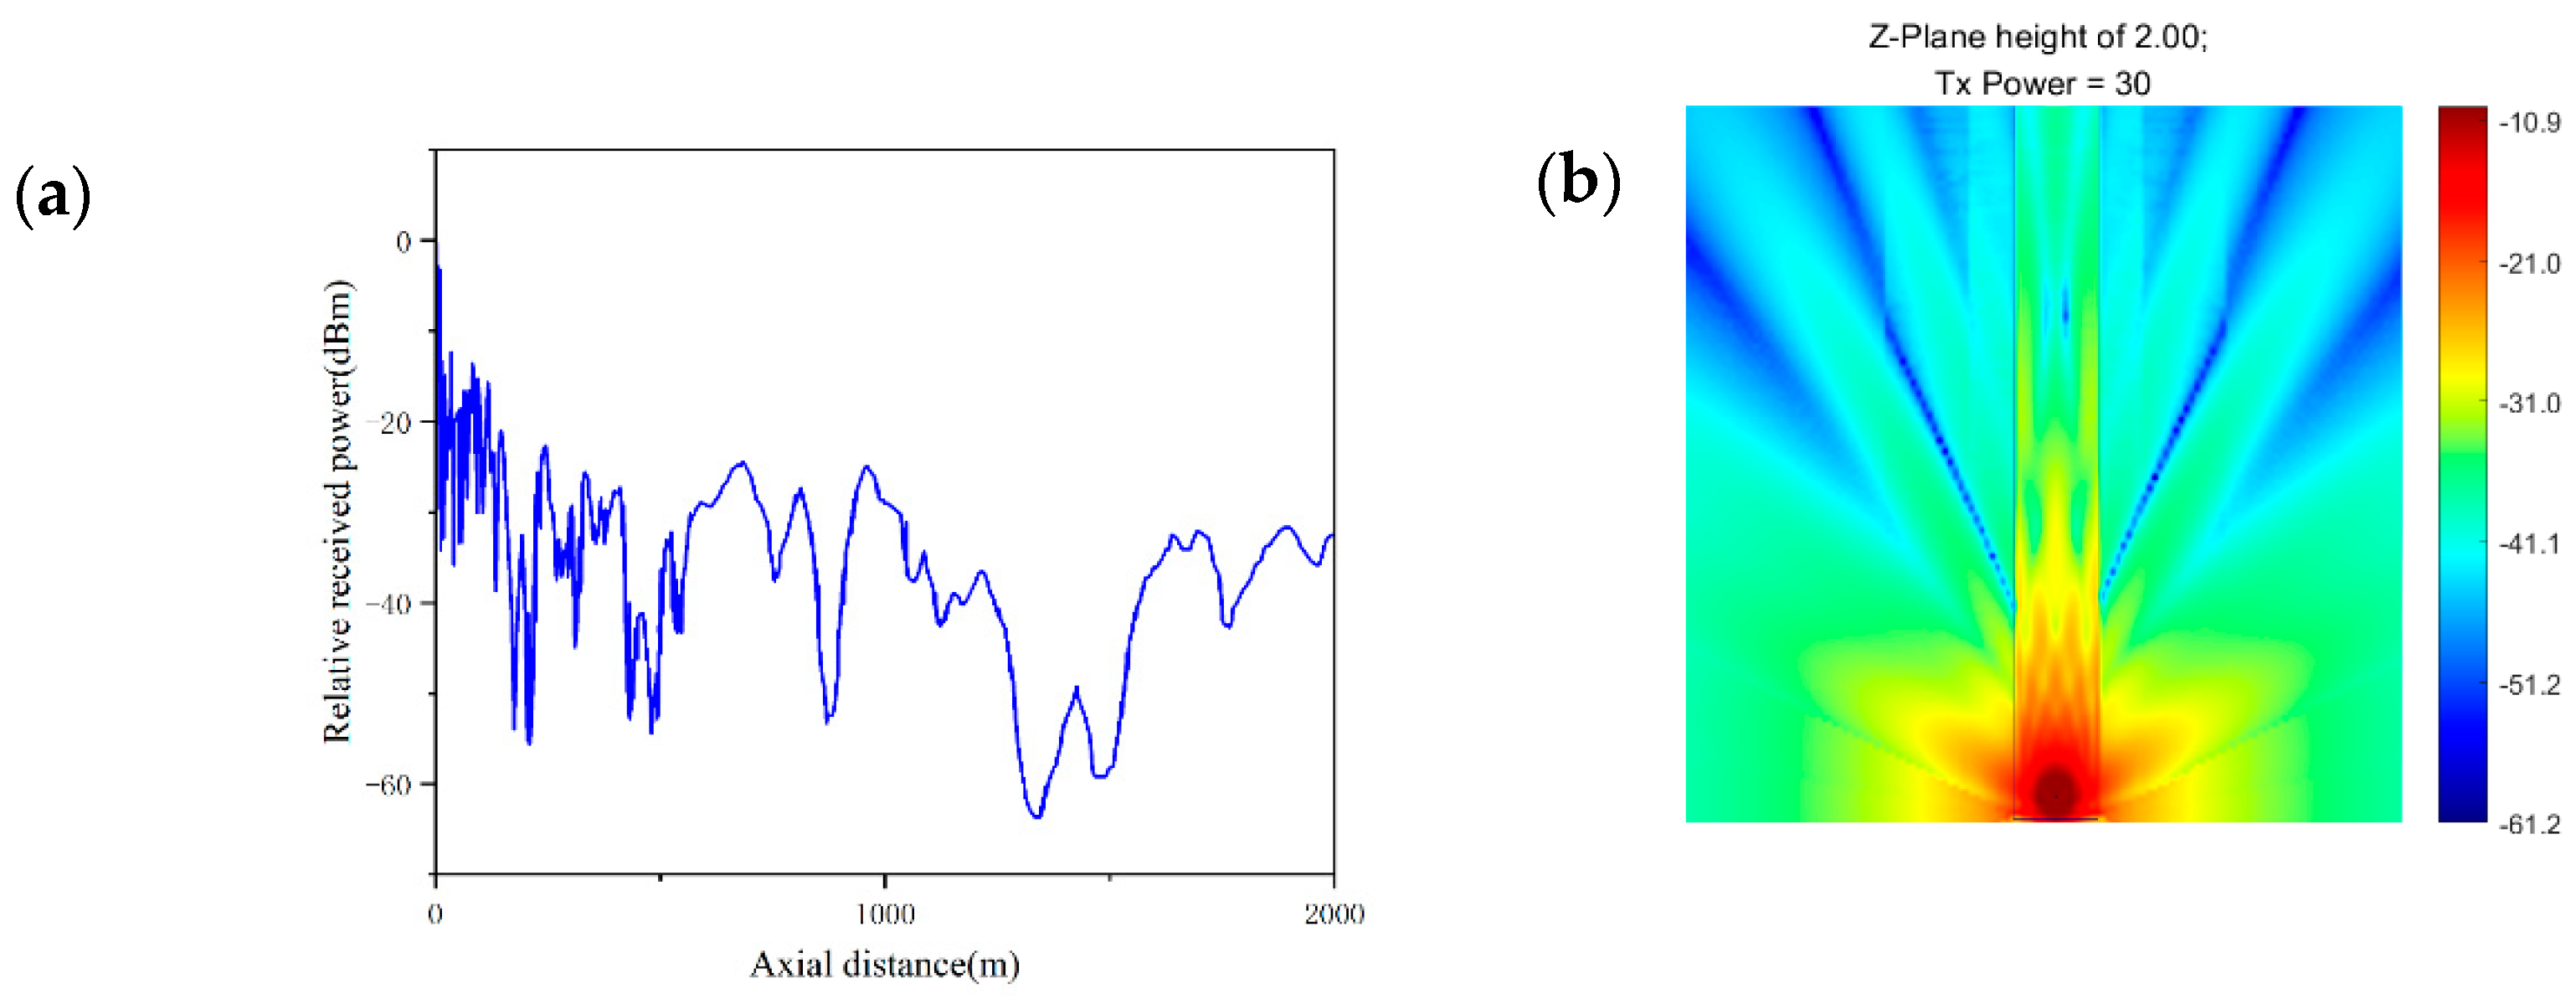
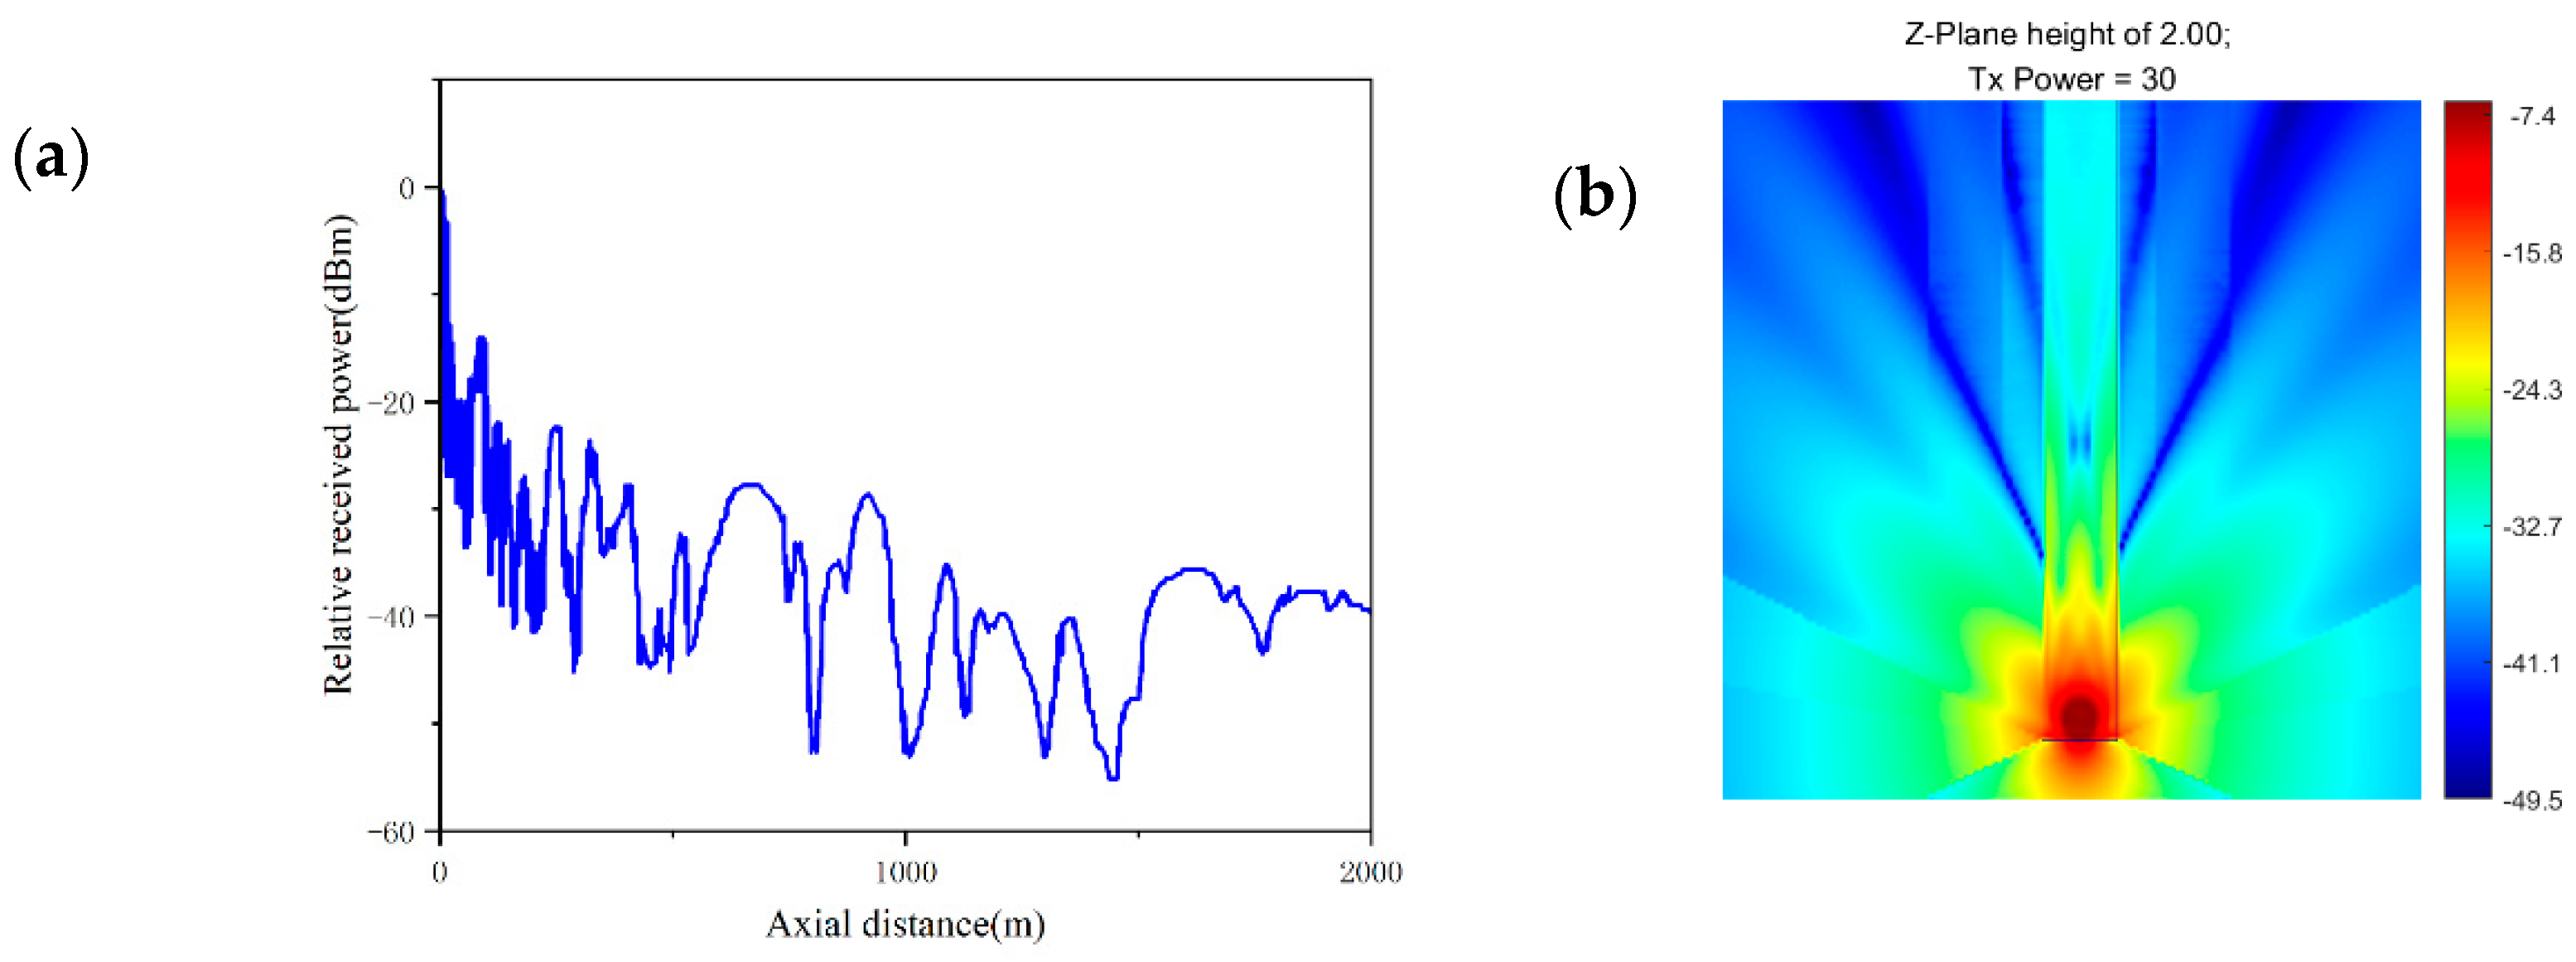
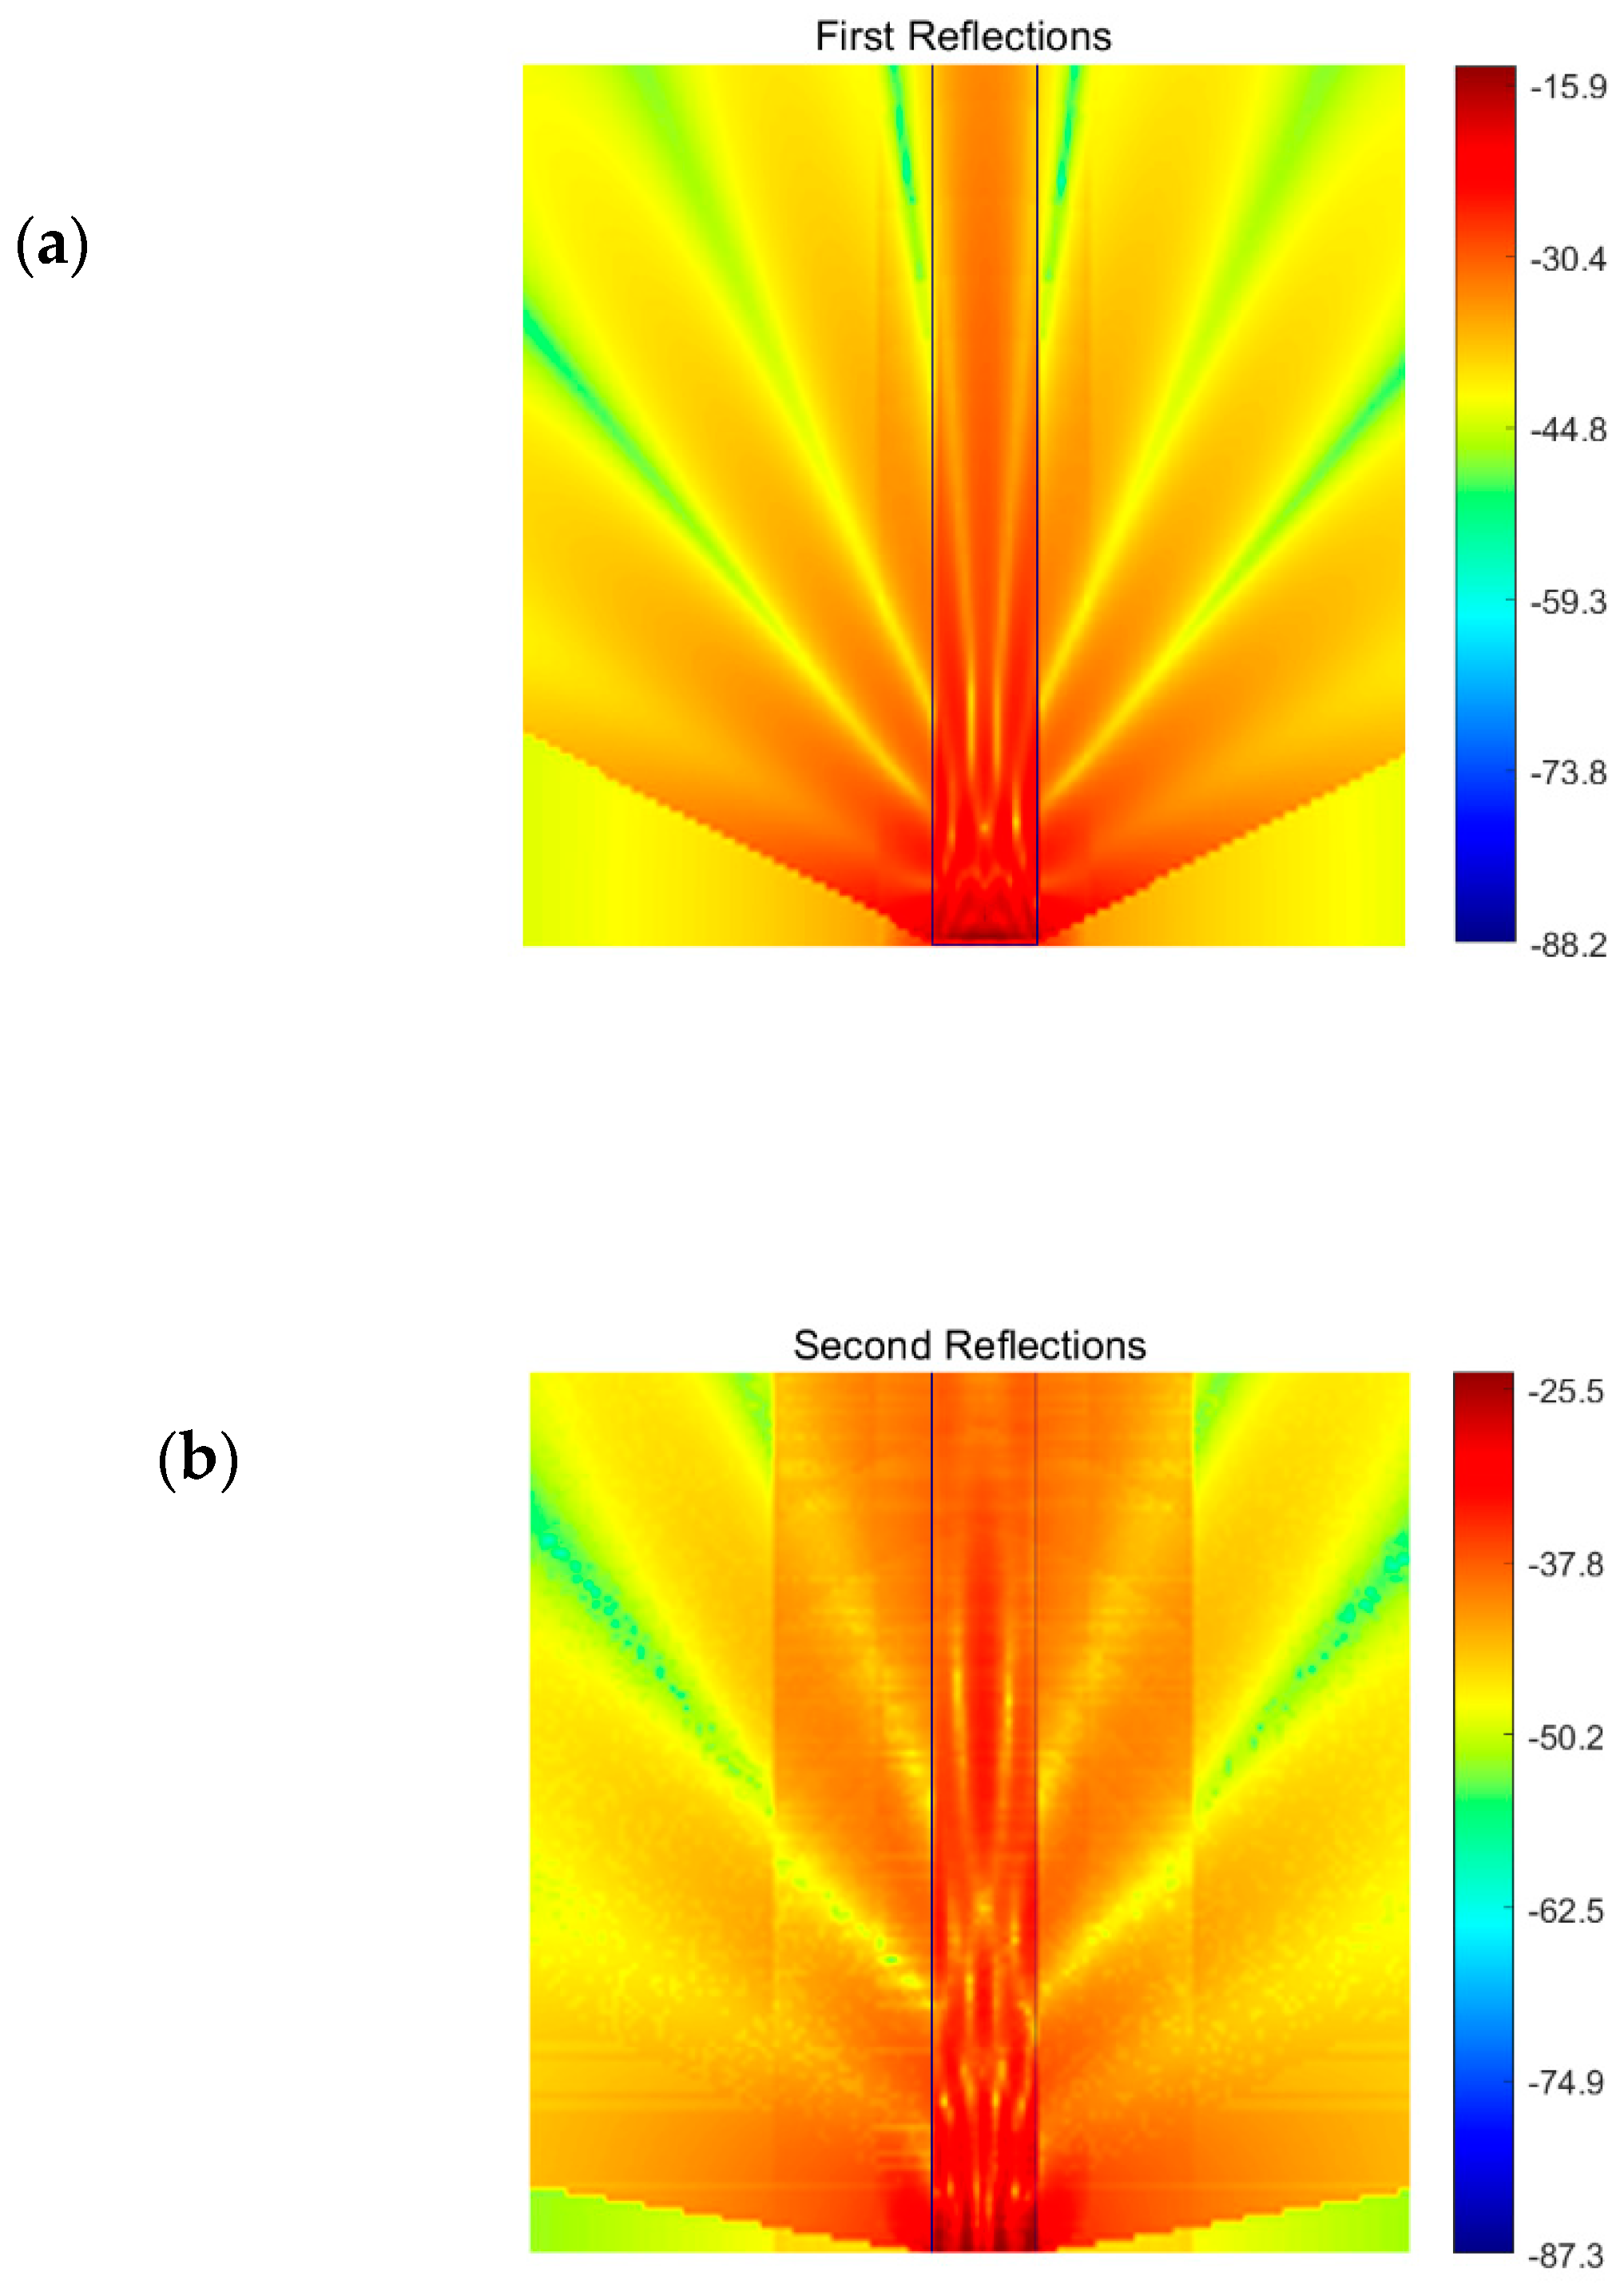
- Comparison of the two signal reflections
- 3.
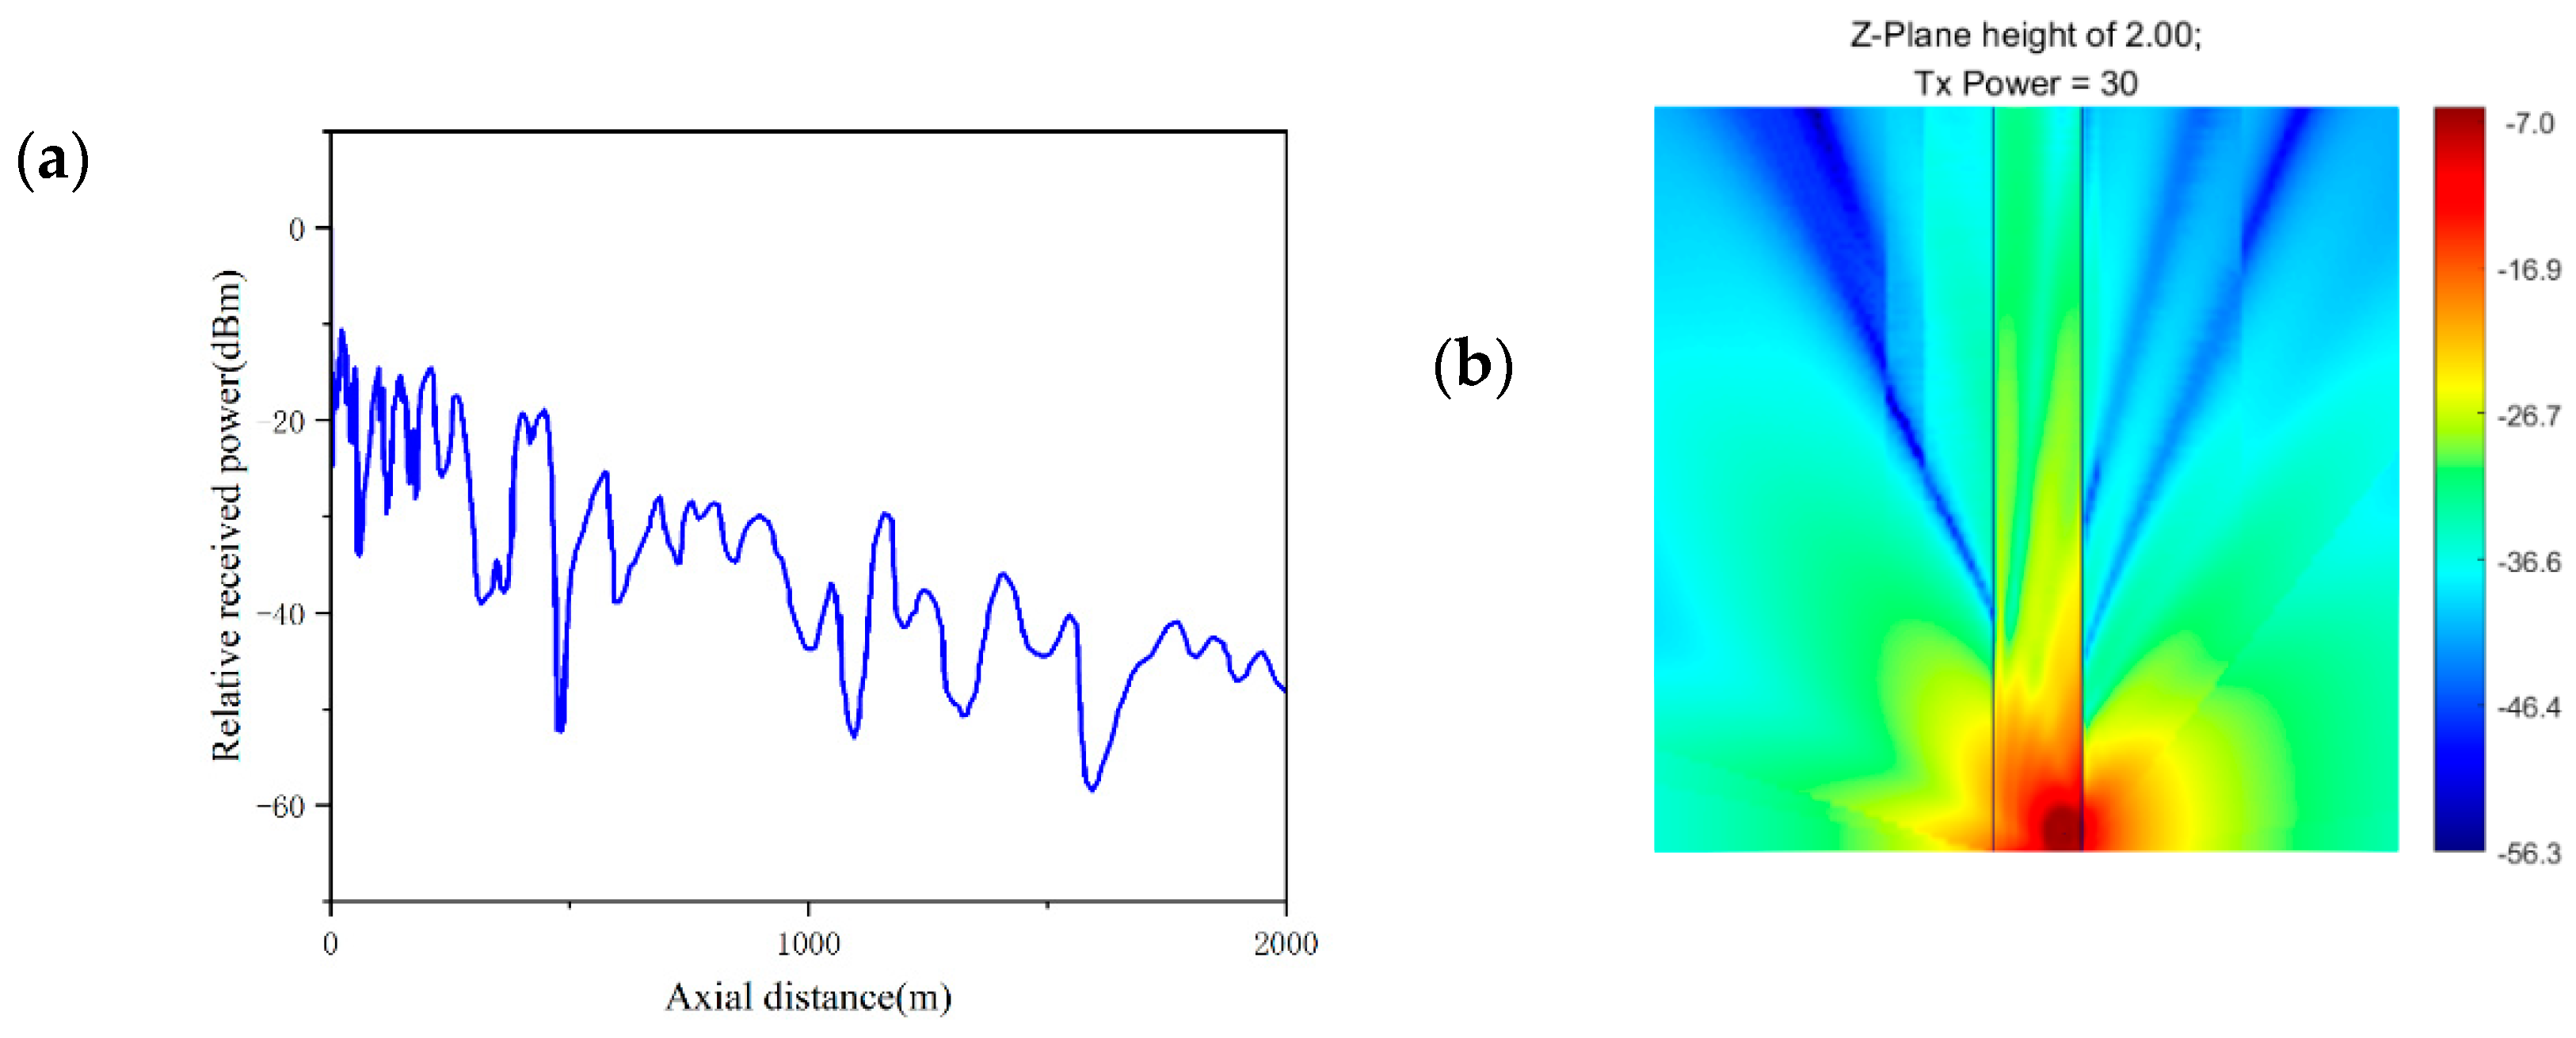
- Antenna location
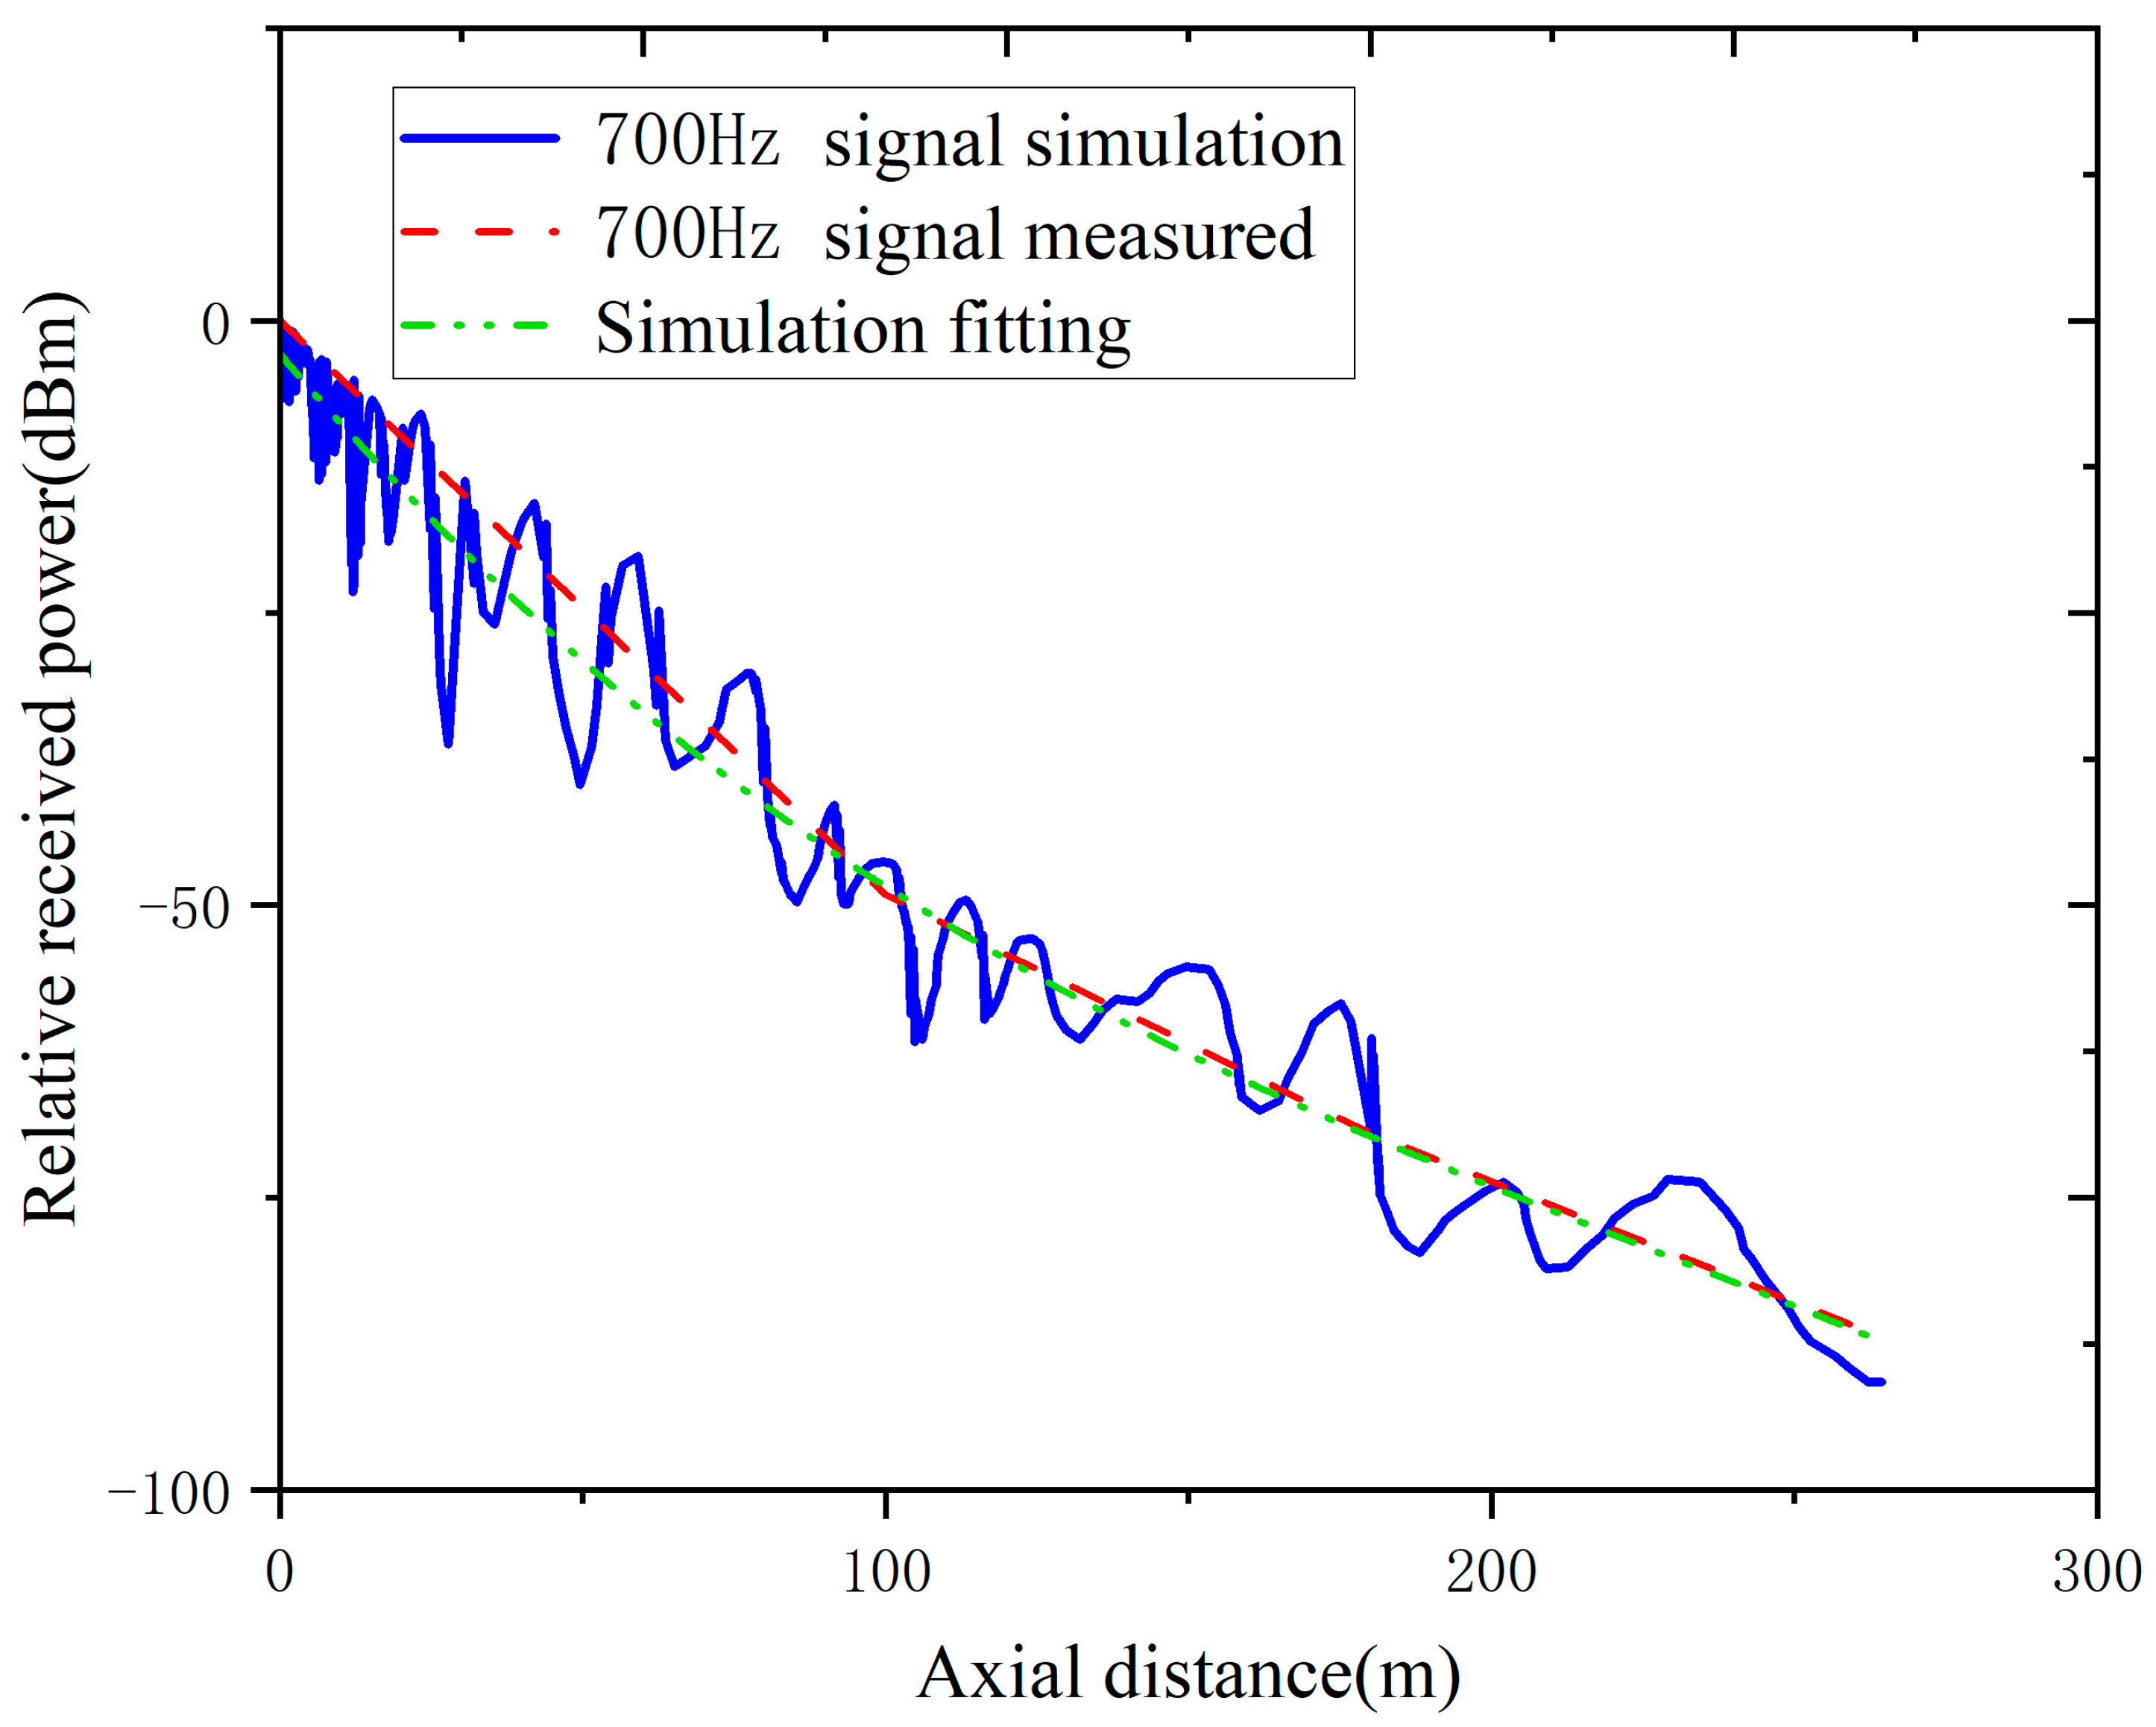
4. Experimental Results
5. Conclusions
- The spatial segmentation-based acceleration algorithm is used to segment the roadway model, which reduces the number of collisions during the path search process and improves the computational efficiency of the 3D ray-tracing method.
- The results show that, for a wireless signal with a frequency of 700 MHz, the model can accurately reflect the waveform change and attenuation of the wireless signal during signal transmission in the roadway. However, the simulation model only considers relatively basic rectangular, long, straight roadways. In actual production operations, the cross-sectional shapes are trapezoidal and arched, and the roadway has L-shaped right angles and curvatures. This 3D ray tracing only includes the direct and reflected rays, and scattering and diffraction are not taken into consideration. Improvement of the roadway model and the propagation method of wireless signals in the 3D tracking method needs to be carried out in the future.
Author Contributions
Funding
Institutional Review Board Statement
Informed Consent Statement
Data Availability Statement
Acknowledgments
Conflicts of Interest
References
- Arnold, B. A review of element partitioning in coal preparation. Int. J. Coal Geol. 2023, 274, 104296. [Google Scholar] [CrossRef]
- Wang, C.; Cheng, Y. Role of coal deformation energy in coal and gas outburst: A review. Fuel 2023, 332, 126019. [Google Scholar] [CrossRef]
- Raul, R.N.; Palit, S.; Maity, T. Challenges and Viability of Use of PLC for Personal Communication in Underground Coal Mines. IETE Tech. Rev. 2021, 38, 418–428. [Google Scholar] [CrossRef]
- Wu, X.; Li, H.; Wang, B.; Zhu, M. Review on Improvements to the Safety Level of Coal Mines by Applying Intelligent Coal Mining. Sustainability 2022, 14, 16400. [Google Scholar] [CrossRef]
- Wu, B.; Wang, J.; Zhong, M.; Xu, C.; Qu, B. Multidimensional Analysis of Coal Mine Safety Accidents in China—70 Years Review. Min. Metall. Explor. 2023, 40, 253–262. [Google Scholar] [CrossRef]
- Fan, Q.; Yan, X.; Zhang, Y. Design and Realization of the Safety Production Scheduling System. Res. J. Appl. Sci. Eng. Technol. 2013, 5, 639–645. [Google Scholar] [CrossRef]
- Zhang, Y.; Yang, W.; Han, D.; Kim, Y.-I. An integrated environment monitoring system for underground coal mines—Wireless sensor network subsystem with multi-parameter monitoring. Sensors 2014, 14, 13149–13170. [Google Scholar] [CrossRef] [PubMed]
- Dohare, Y.S.; Maity, T.; Das, P.S.; Paul, P.S. Wireless communication and environment monitoring in underground coal mines—Review. IETE Tech. Rev. 2015, 32, 140–150. [Google Scholar] [CrossRef]
- Singh, A.; Kumar, D.; Hötzel, J. IoT Based information and communication system for enhancing underground mines safety and productivity: Genesis, taxonomy and open issues. Ad Hoc Netw. 2018, 78, 115–129. [Google Scholar] [CrossRef]
- Kilinc, F.S.; Monaghan, W.D.; Powell, J.B. A review of mine rescue ensembles for underground coal mining in the United States. J. Eng. Fibers Fabr. 2014, 9, 155892501400900120. [Google Scholar] [CrossRef]
- Khanzode, V.V.; Maiti, J.; Ray, P.K. A methodology for evaluation and monitoring of recurring hazards in underground coal mining. Saf. Sci. 2011, 49, 1172–1179. [Google Scholar] [CrossRef]
- Li, M.; Liu, Y. Underground coal mine monitoring with wireless sensor networks. ACM Trans. Sens. Netw. 2009, 5, 10. [Google Scholar] [CrossRef]
- Ranjan, A.; Sahu, H.B.; Misra, P. Modeling and measurements for wireless communication networks in underground mine environments. Measurement 2020, 149, 106980. [Google Scholar] [CrossRef]
- Zhao, H.; Yang, W. An emergency rescue communication system and environmental monitoring subsystem for underground coal mine based on wireless mesh network. Int. J. Distrib. Sens. Netw. 2018, 14, 1550147718805935. [Google Scholar] [CrossRef]
- Moridi, M.A.; Kawamura, Y.; Sharifzadeh, M.; Chanda, E.K.; Wagner, M.; Jang, H.; Okawa, H. Development of underground mine monitoring and communication system integrated ZigBee and GIS. Int. J. Min. Sci. Technol. 2015, 25, 811–818. [Google Scholar] [CrossRef]
- Zhao, Y.P.; Zhang, J.; Li, J.X.; Tan, Z.H. Simulation of wireless channel in tunnel environment based on improved ray tracing method. J. Beijing Jiaotong Univ. 2014, 38, 12–18. (In Chinese) [Google Scholar]
- Mi, G.S.; Yang, W. Prediction of electromagnetic wave propagation field strength in semi-circular arch mine roadway based on mirror image principle. J. China Coal Soc. 2020, 45 (Suppl. S2), 1089–1099. (In Chinese) [Google Scholar] [CrossRef]
- Yao, S.H. Multipath channel model of electromagnetic wave in mine tunnel based on mirror method. J. Mine Autom. 2017, 43, 46–49. (In Chinese) [Google Scholar] [CrossRef]
- Chen, S.-H.; Jeng, S.-K. SBR image approach for radio wave propagation in tunnels with and without traffic. IEEE Trans. Veh. Technol. 1996, 45, 570–578. [Google Scholar] [CrossRef]
- Wang, A.; Ren, C. Prediction of receiving field strength based on SVM-LSTM hybrid model in the coal mine. In Proceedings of the 2021 International Conference on Communications, Information System and Computer Engineering (CISCE), Beijing, China, 14–16 May 2021; pp. 813–816. [Google Scholar]
- Wang, A.; Lei, S. Research on modeling of underground path loss prediction based on SA-SVM. J. Phys. Conf. Ser. 2022, 2245, 012016. [Google Scholar] [CrossRef]
- Sun, Z.; Akyildiz, I.F. Channel modeling and analysis for wireless networks in underground mines and road tunnels. IEEE Trans. Commun. 2010, 58, 1758–1768. [Google Scholar] [CrossRef]
- Kasdorf, S.; Troksa, B.; Key, C.; Harmon, J.; Notaros, B.M. Advancing accuracy of shooting and bouncing rays method for ray-tracing propagation modeling based on novel approaches to ray cone angle calculation. IEEE Trans. Antennas Propag. 2021, 69, 4808–4815. [Google Scholar] [CrossRef]
- Wu, M.; Ma, Y.; Zhu, Z. Ray Tracing-Based Wireless Channel Modeling in Room-and-Pillar Mines. In Proceedings of the 2021 IEEE Wireless Communications and Networking Conference (WCNC), Nanjing, China, 29 March–1 April 2021; pp. 1–6. [Google Scholar]
- Zheng, X.; Wang, H.; Wen, H.; Guo, J. Propagation characteristics of electromagnetic waves in mine roadways. J. Appl. Geophys. 2020, 173, 103922. [Google Scholar] [CrossRef]
- Mahmoud, S.F.; Wait, J.R. Geometrical optical approach for electromagnetic wave propagation in rectangular mine tunnels. Radio Sci. 1974, 9, 1147–1158. [Google Scholar] [CrossRef]
- Chauhan, V.K.; Dahiya, K.; Sharma, A. Problem formulations and solvers in linear SVM: A review. Artif. Intell. Rev. 2019, 52, 803–855. [Google Scholar] [CrossRef]
- Chen, P.; Xie, Y.; Jin, P.; Zhang, D. A wireless sensor data-based coal mine gas monitoring algorithm with least squares support vector machines optimized by swarm intelligence techniques. Int. J. Distrib. Sens. Netw. 2018, 14, 1550147718777440. [Google Scholar] [CrossRef]
- Sun, J.P.; Zhang, G.M. Research on 5G frequency band selection and antenna optimization setting for mine. J. Mine Autom. 2020, 46, 1–7. (In Chinese) [Google Scholar] [CrossRef]


| 700 HMz | Downlink Received Power | Downlink Data Throughput | Uplink Received Power | Upstream Data Throughput |
|---|---|---|---|---|
| T1 | −49.1 dBm | 14.6 Mbps | −50.9 dBm | 14.0 bps |
| T2 | −69.5 dBm | 8.1 Mbps | −70.7 dBm | 8.1 bps |
| T3 | −86.0 dBm | 4.7 Mbps | −88.0 dBm | 4.8 bps |
| T4 | N/A | N/A | N/A | N/A |
| T5 | N/A | N/A | N/A | N/A |
Disclaimer/Publisher’s Note: The statements, opinions and data contained in all publications are solely those of the individual author(s) and contributor(s) and not of MDPI and/or the editor(s). MDPI and/or the editor(s) disclaim responsibility for any injury to people or property resulting from any ideas, methods, instructions or products referred to in the content. |
© 2024 by the authors. Licensee MDPI, Basel, Switzerland. This article is an open access article distributed under the terms and conditions of the Creative Commons Attribution (CC BY) license (https://creativecommons.org/licenses/by/4.0/).
Share and Cite
Li, B.; Ding, T.; Wu, Y.; Nie, Z.; Wu, Q.; Shi, Y.; Zheng, M. Modeling and Optimization of Wireless Signal Transmission Characteristics of Mine Roadway Based on 3D Ray-Tracing Method. Appl. Sci. 2024, 14, 1534. https://doi.org/10.3390/app14041534
Li B, Ding T, Wu Y, Nie Z, Wu Q, Shi Y, Zheng M. Modeling and Optimization of Wireless Signal Transmission Characteristics of Mine Roadway Based on 3D Ray-Tracing Method. Applied Sciences. 2024; 14(4):1534. https://doi.org/10.3390/app14041534
Chicago/Turabian StyleLi, Boyu, Tao Ding, Yanhui Wu, Zhen Nie, Qian Wu, Yannan Shi, and Mianping Zheng. 2024. "Modeling and Optimization of Wireless Signal Transmission Characteristics of Mine Roadway Based on 3D Ray-Tracing Method" Applied Sciences 14, no. 4: 1534. https://doi.org/10.3390/app14041534