Power Collection from Wave Energy Farms

1
Fred. Olsen / Norwegian University of Science and Technology, Fred. Olsens Gate 2, N0152 Oslo, Norway
2
Department of Electric Power Engineering, Norwegian University of Science and Technology, O. S. Bragstads plass 2E, N-7034 Trondheim, Norway
*
Author to whom correspondence should be addressed.
Appl. Sci. 2013, 3(2), 420-436; https://doi.org/10.3390/app3020420
Submission received: 7 January 2013
/
Revised: 12 March 2013
/
Accepted: 13 March 2013
/
Published: 2 April 2013
(This article belongs to the Special Issue Renewable Energy)
Abstract
:Most Wave Energy Converters (WECs) produce highly distorted power due to the reciprocal motion induced by ocean waves. Some WEC systems have integrated energy storage that overcomes this limitation, but add significant expenses to an already costly system. As an alternative approach, this article investigates the direct export option that relies on aggregate smoothing among several WECs. By optimizing the positioning of the WEC devices with respect to the incoming waves, fluctuations may be mutually canceled out between the devices. This work is based on Fred. Olsen’s WEC system Lifesaver, and a WEC farm consisting of 48 devices is designed in detail and simulated. The major cost driver for the electrical export system is the required oversize factor necessary for transfer of the average power output. Due to the low power quality, this number can be as high as 20 at the entry point of the electrical system, and it is thus crucial to quickly improve the power quality so that the downstream power system is efficiently utilized. The simulations undertaken in this work indicate that a high quality power output can be achieved at the farm level, but that a significant oversize factor will be required in the intermediate power system within the farm.
1. Introduction
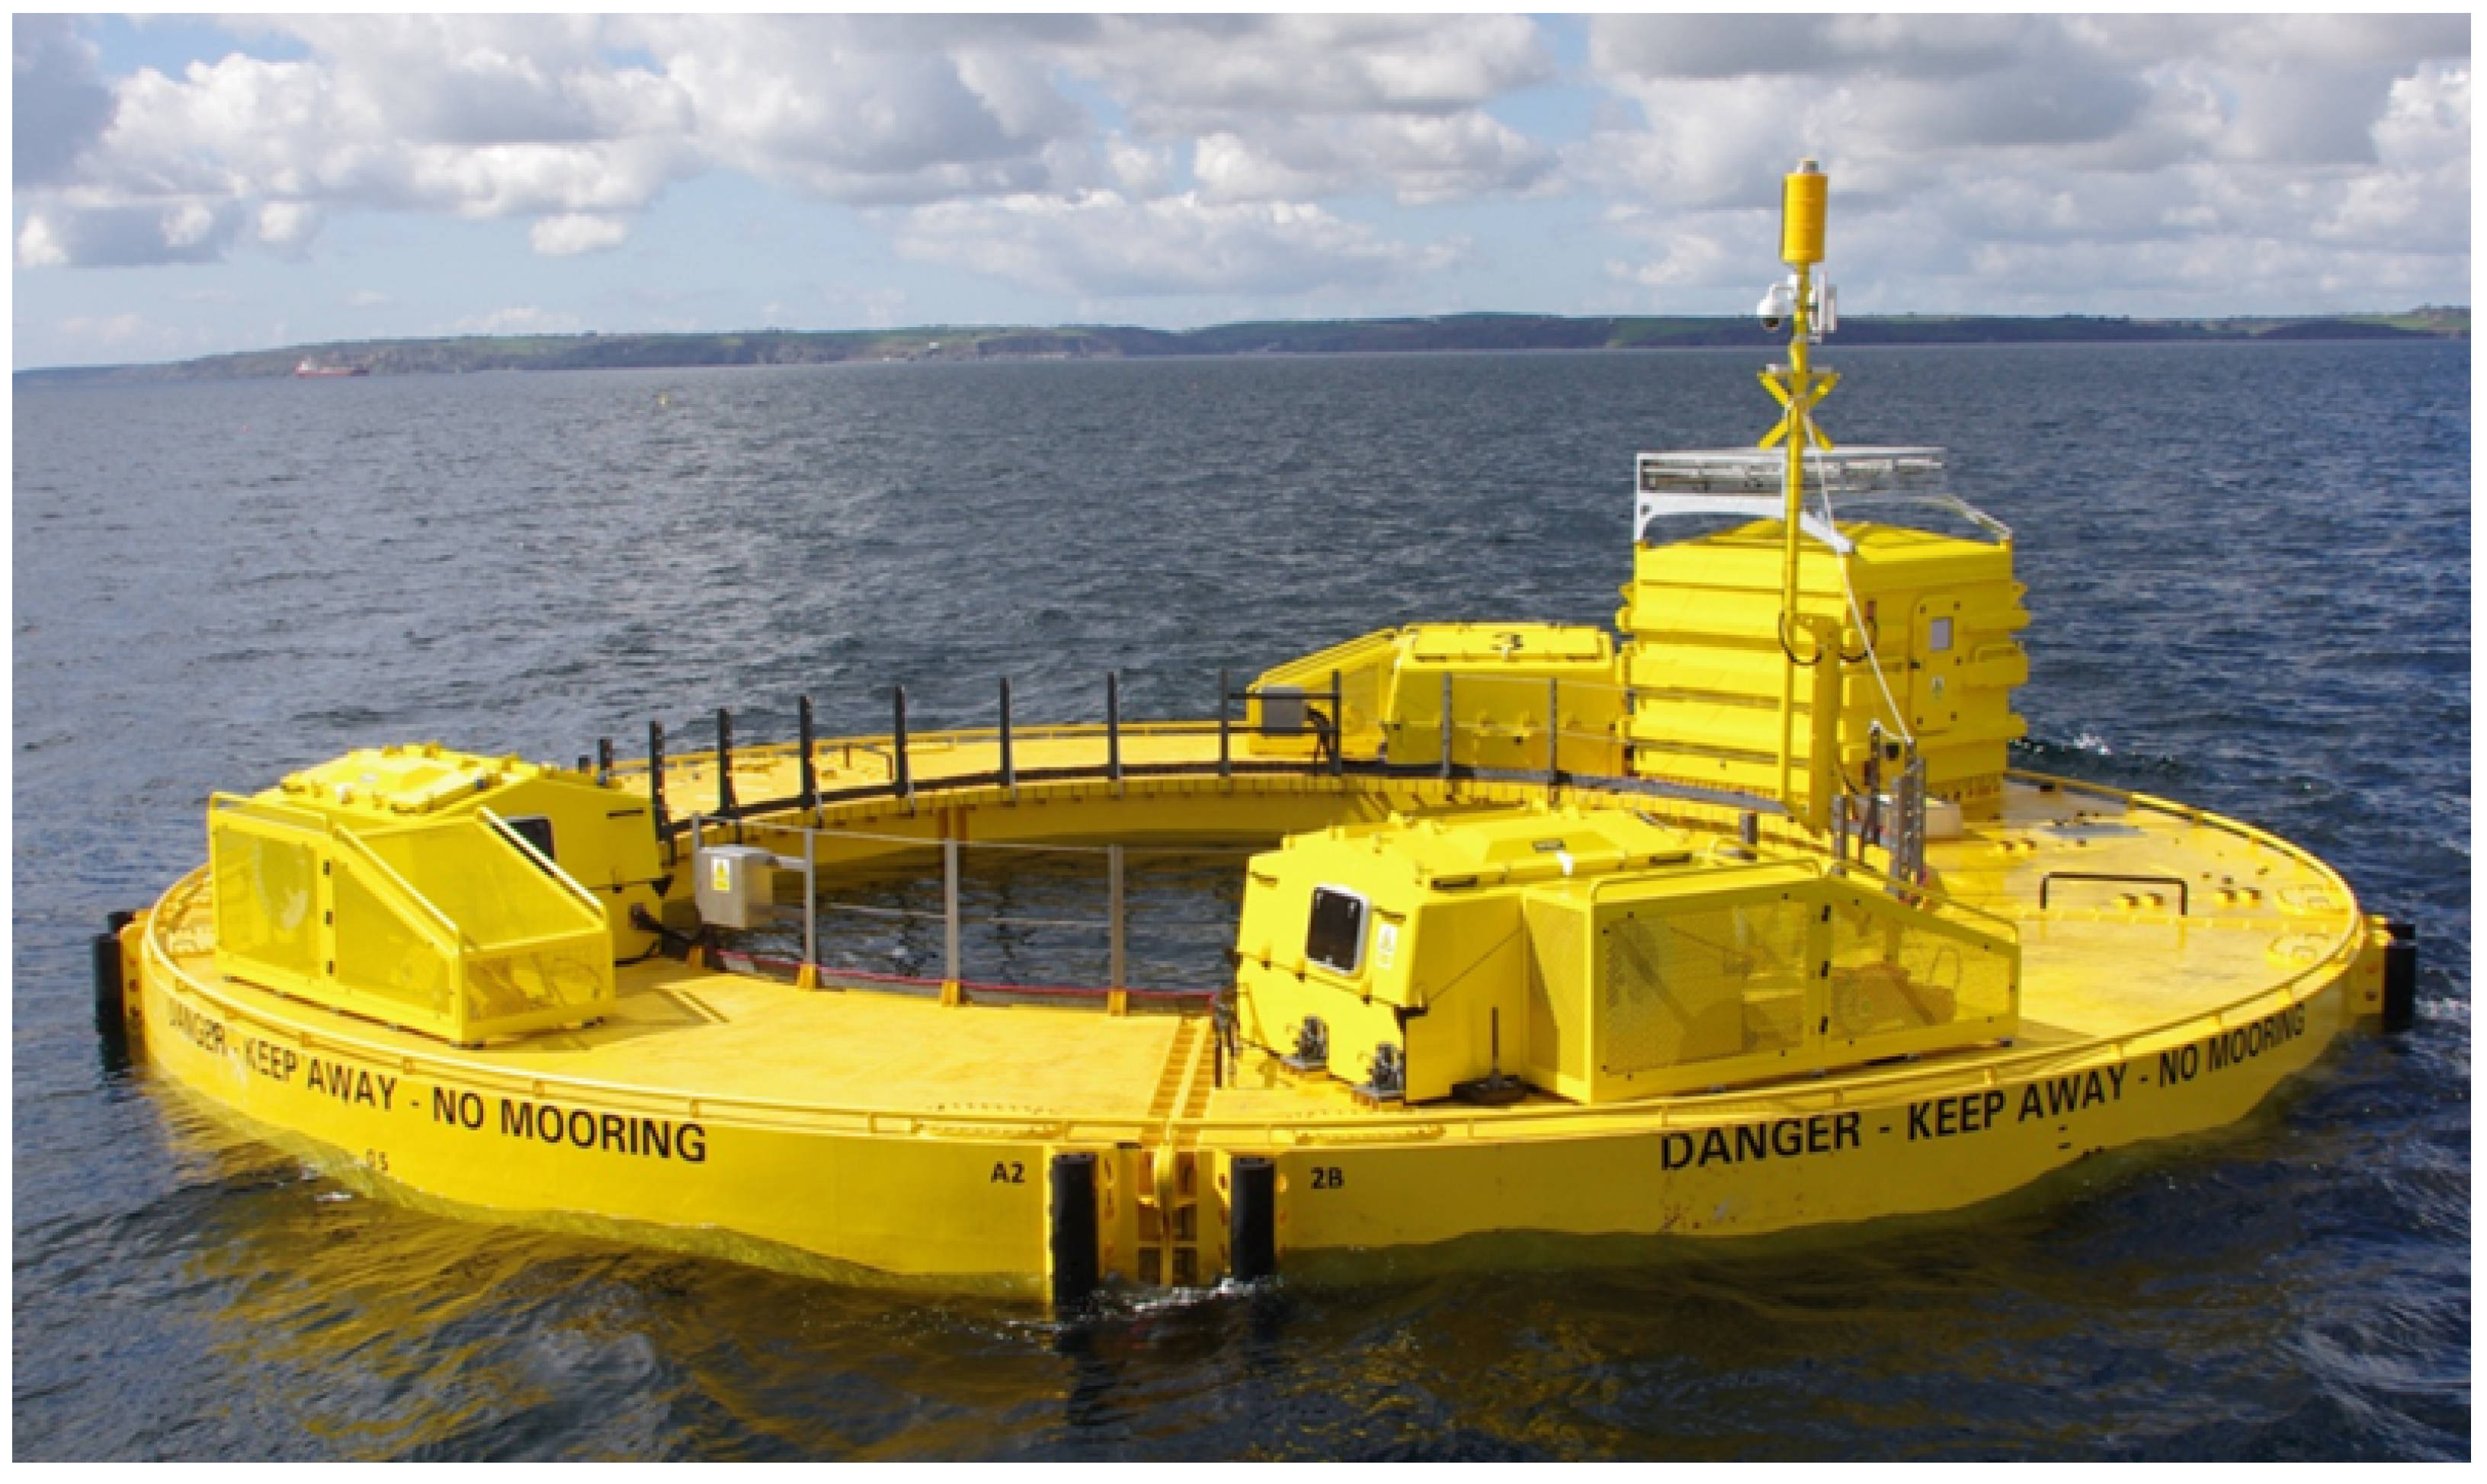
Wave Energy Converters (WECs) are different from most other energy producers in that the prime mover operates with a sinusoidal velocity. When such a producer is directly connected to its generator, the output power is continuously fluctuating with zero crossings in every wave, resulting in a high peak-to-average power ratio. Fred. Olsen’s (FO) power plant Lifesaver, pictured in Figure 1, illustrates this typical behavior, as plotted in Figure 2. This level of power distortion is unlikely to be suitable for export to the grid as the utilization of installed power capacity is very low. In this article, the method of aggregate power smoothing from multiple WECs in order to improve the power quality will be investigated. As the incoming wave energy is close to constant when averaged over longer periods of time, the power production can be equally averaged by covering a large distance of the incoming wave. Substantial work has previously been performed within this topic, and the articles (Tissandier et al., 2008) [1], (Kavanagh et al., 2011) [2] and (Blavette et al., 2012) [3] demonstrate successful integration of WECs into a farm system. The focus of this work is the specific integration of Lifesaver into a WEC farm system, and the potential for economical optimization of the power transfer chain from wave to wire.
Figure 1.
Lifesaver on site outside Falmouth, England.

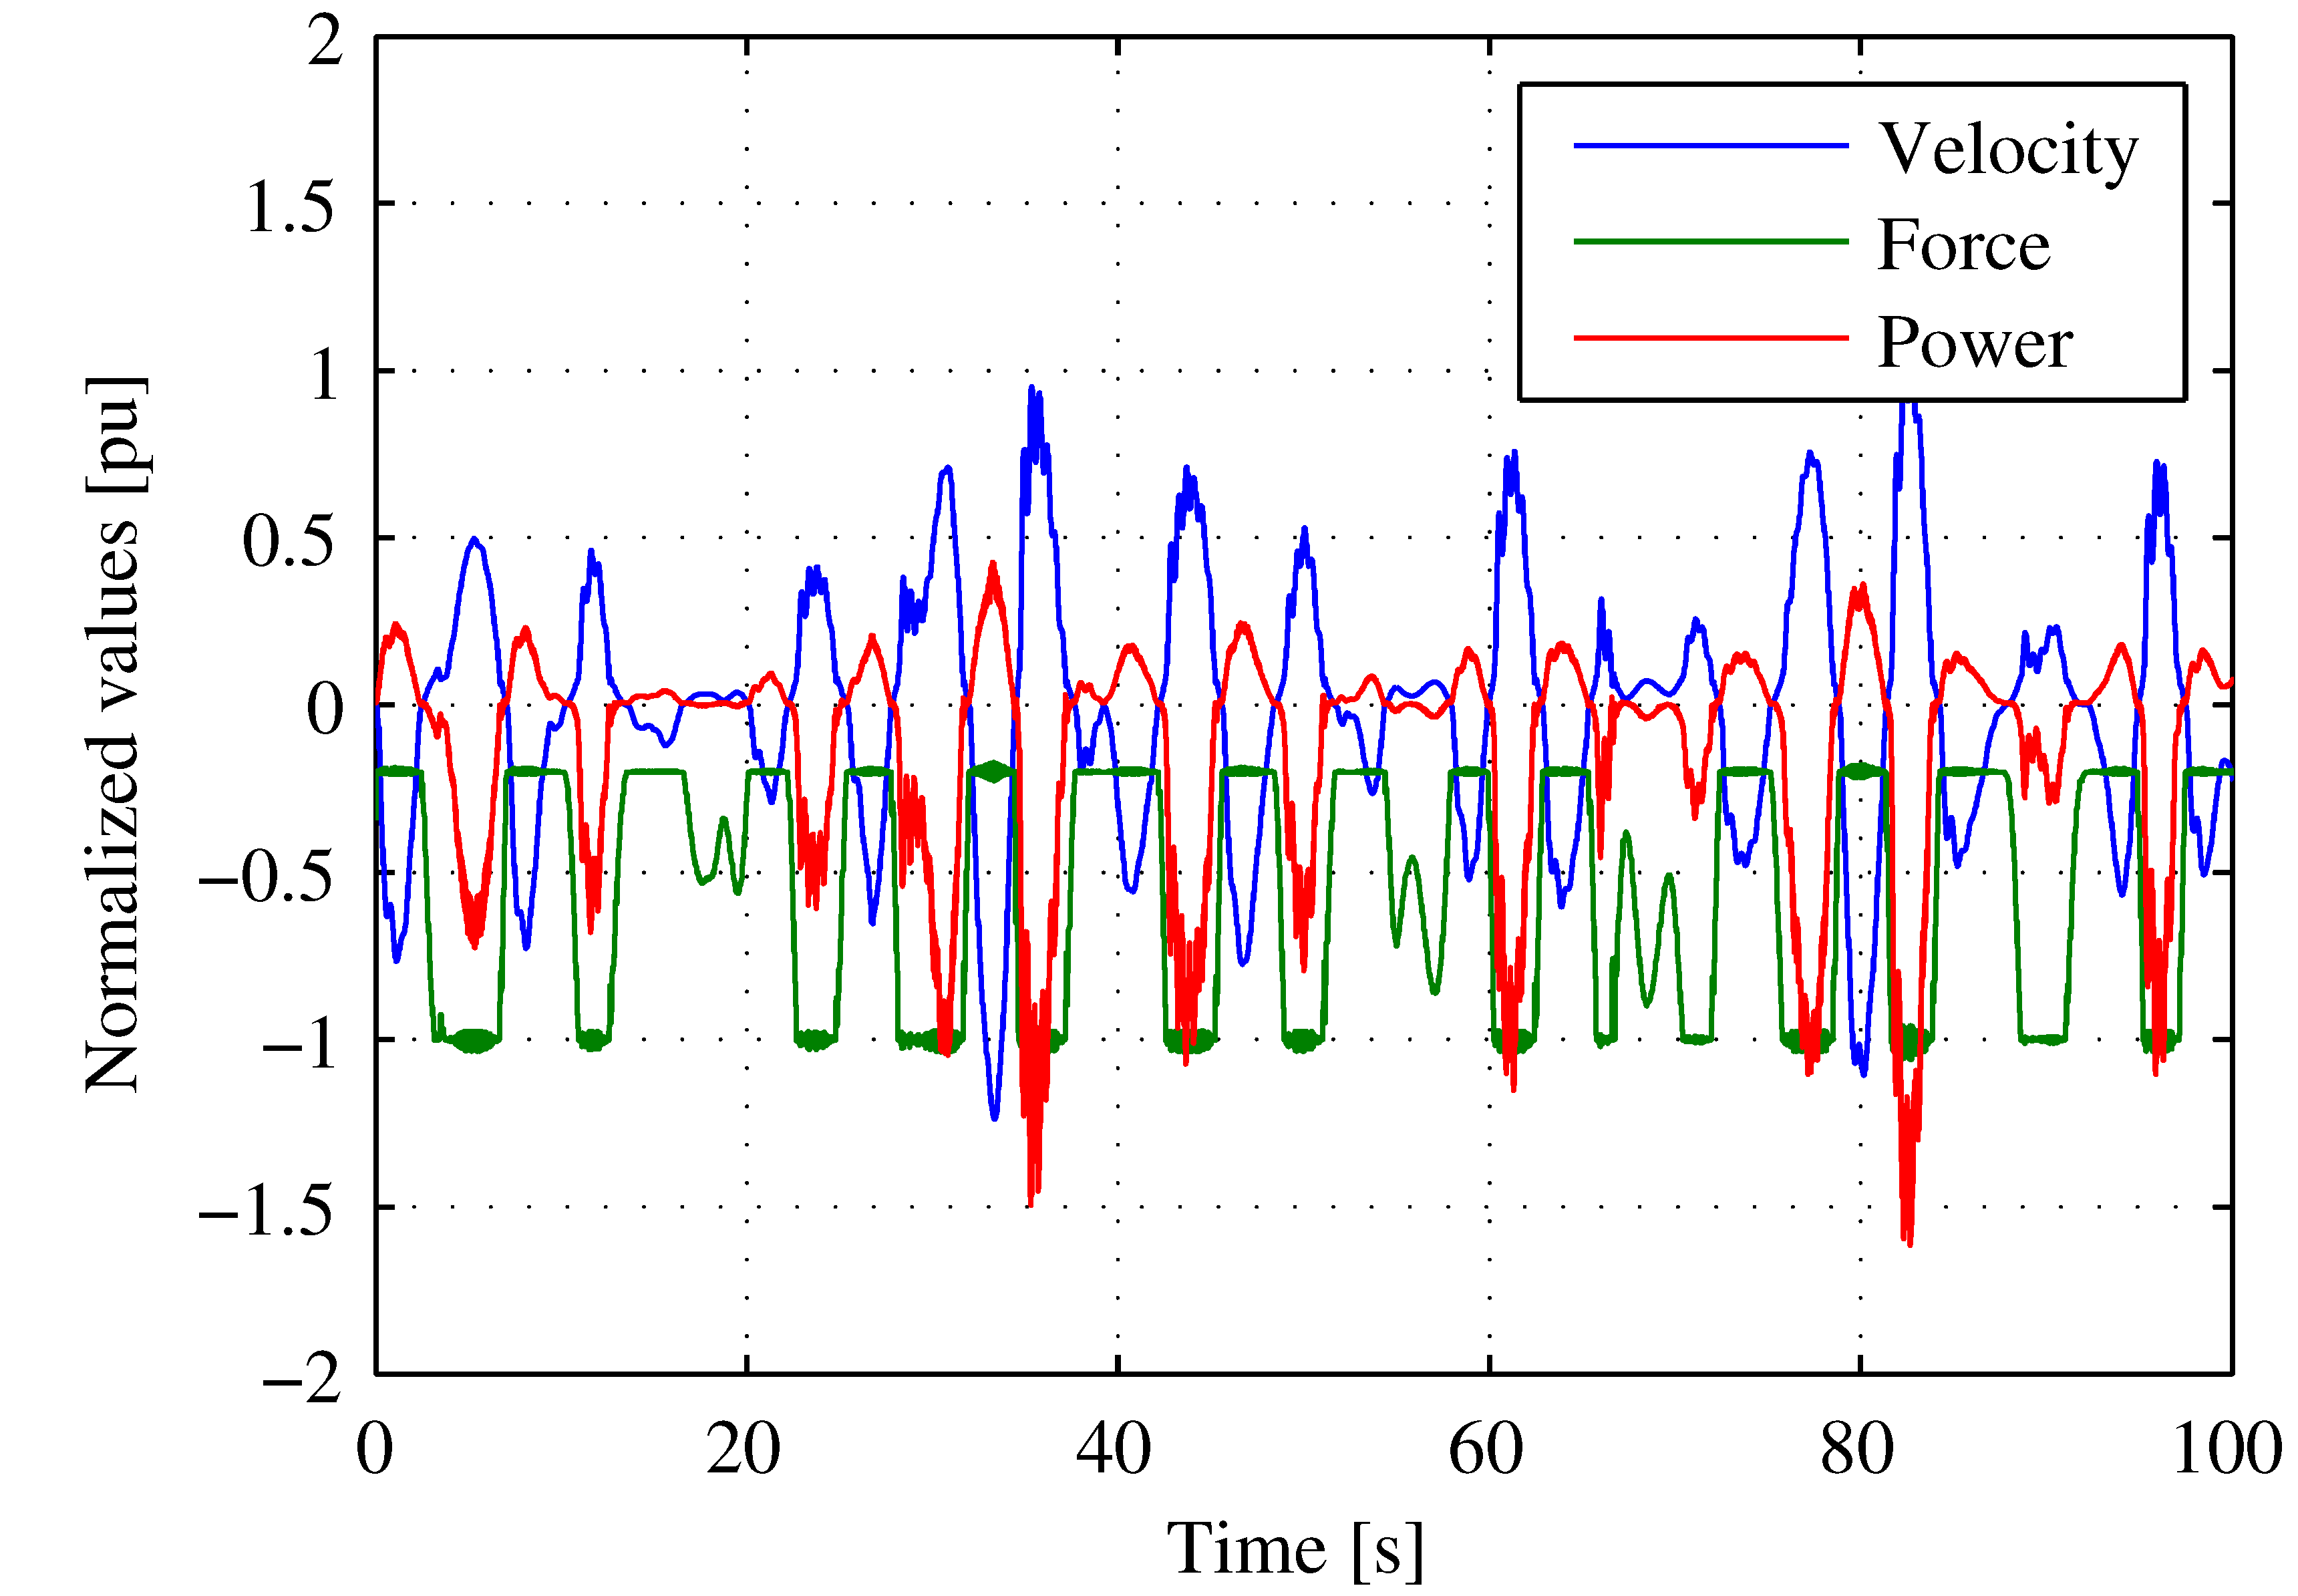
The power quality is very poor when the wave energy enters the WEC, mainly due to two factors. Firstly, the sinusoidal shape of the incoming wave causes a sinusoidal movement of the power take-off (PTO) system, and does not allow the PTO to run constantly at rated speed. Secondly, waves tend to group into wave trains that consist of series of waves with similar amplitude (Salter, 1988) [4]. This adds subharmonic fluctuations with respect to the incoming wave period and further reduces the utilization factor of installed PTO power. Moreover, WEC systems that utilize the mooring line as a production force can only extract power during the upwards motion. This unidirectional production pattern adds another doubling to the peak-to-average ratio. This can subsequently add up to a total peak-to-average ratio in the high tens, depending on the system configuration.
Figure 2.
Actual production and system operation measured with Lifesaver.

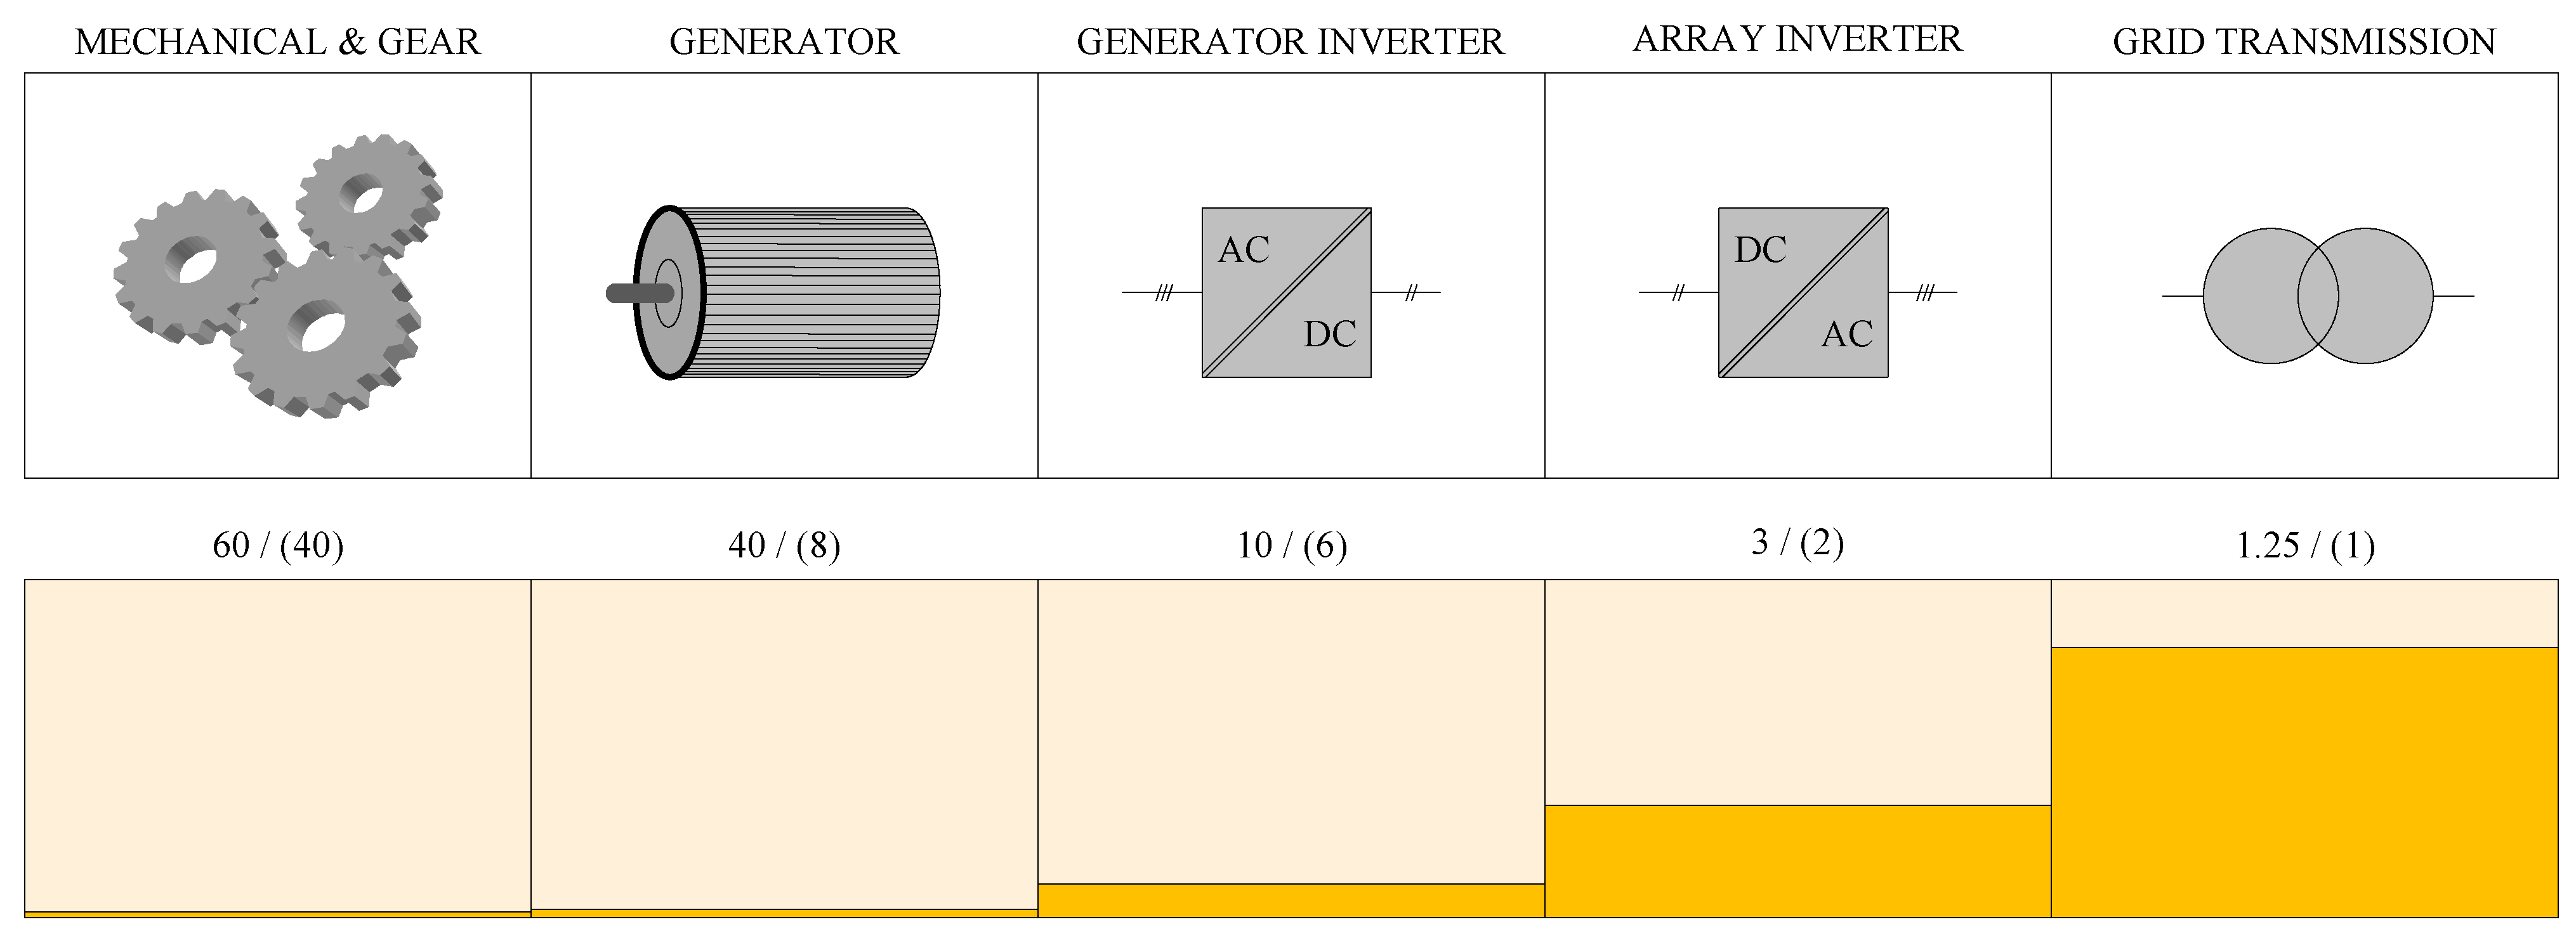
Figure 3.
Illustration of the improved power quality through the power transfer chain. The power quality is given as the peak-to-average ratio and illustrated with orange bars. The nominal oversize factor is denoted with parentheses (i.e., the name plate rating on the generator divided by the average produced power).

Lifesaver has a peak-to-average ratio of approximately 60 on the entry point of mechanical wave power. Thus, in the design wave state, the PTO is designed for power peaks up to 60 per unit (pu), while only 1 pu is transferred on average. If the PTO was constantly operated at rated speed and rated force, on average 60 pu of power could be transferred. This exceptionally low utilization factor is a major challenge for the profitability of WECs and must be managed carefully. Moreover, it is important to quickly reduce the peak-to-average ratio in the downstream power system towards the grid. The poor mechanical utilization factor is not necessarily an issue in and of itself, as the mechanical transmission cost can be low compared to the cost of the total system. However, it is important that this poor utilization factor not be carried forward to the rest of the system. Figure 3 illustrates the gradual increase in power quality that is required from an economical point of view, and is the focus of this work. The underlying details of the figure will be explained and analyzed in detail in the following sections.
1.1. The FO Wave Energy Project
FO started with Wave Energy in 2000, and, in 2004, the Wave Energy Converter Buldra, built as a platform with multiple point absorbers, was launched. Since then, FO has tested out various concepts and built several different prototypes, all based on the point absorber concept. The series of experiments have led to the single body point absorber concept, as realized by our latest prototype Lifesaver. Point absorbers are not the most efficient when measured in terms of captured energy, but have nonetheless proven to be successful on total performance and energy costs.
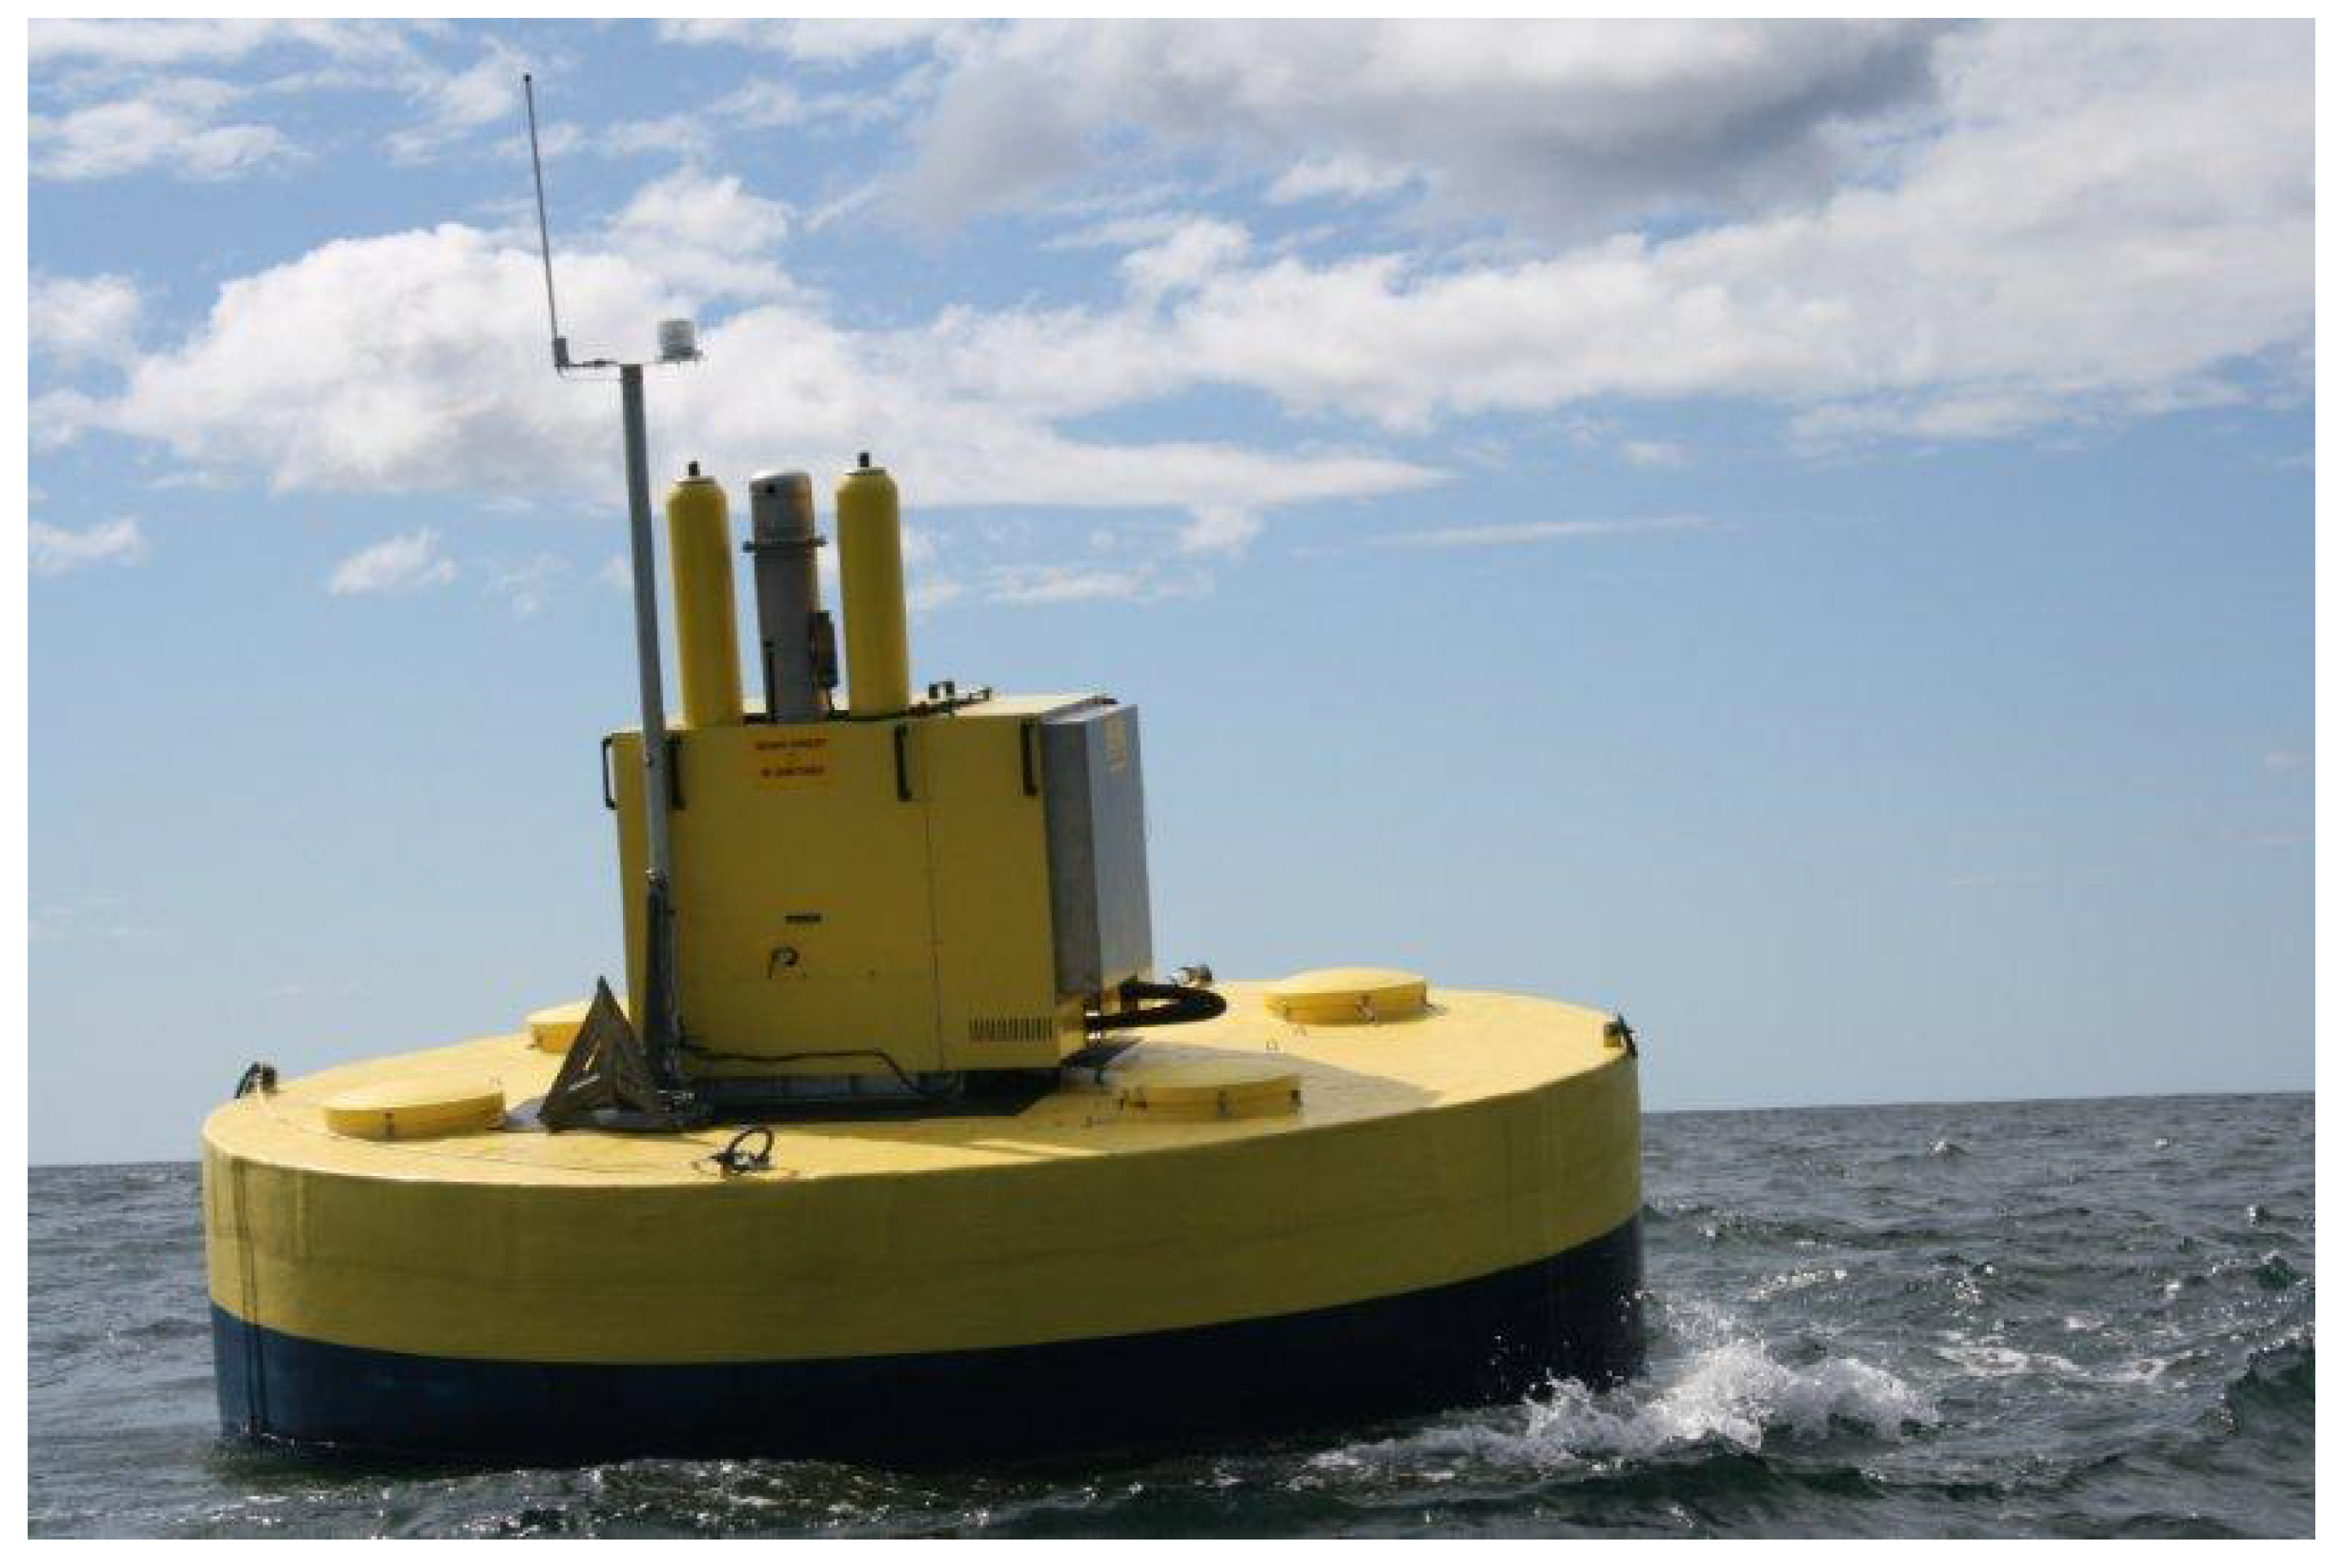
Until now, FO has operated four WECs based on the single body point absorber in real sea conditions. The first, named B33, was a small proof-of-concept device that was operated outside Akland, Norway during the autumn of 2007 and the winter of 2008. B33 showed good results, leading to the second device, named B22, which was equipped with a full-scale control, communication and production system. B22 was operated outside Risør, Norway from the summer of 2008 until the spring of 2009. Based on these experiences, FO started the next development phase in collaboration with a selected few European companies and universities through the Sustainable Economically Efficient Wave Energy Converter (SEEWEC) project. This work led to the full-scale system Bolt® Bolt that was installed outside Risør, Norway in June 2009. Bolt is pictured in Figure 4 on site and has, since 22 December 2010, produced 3360 kWh of energy (Bjerke et al.) [5].
Figure 4.
FO’s Wave Energy Converter Bolt®, located outside Risør, Norway has been in operation since June 2009.
Figure 4.
FO’s Wave Energy Converter Bolt®, located outside Risør, Norway has been in operation since June 2009.

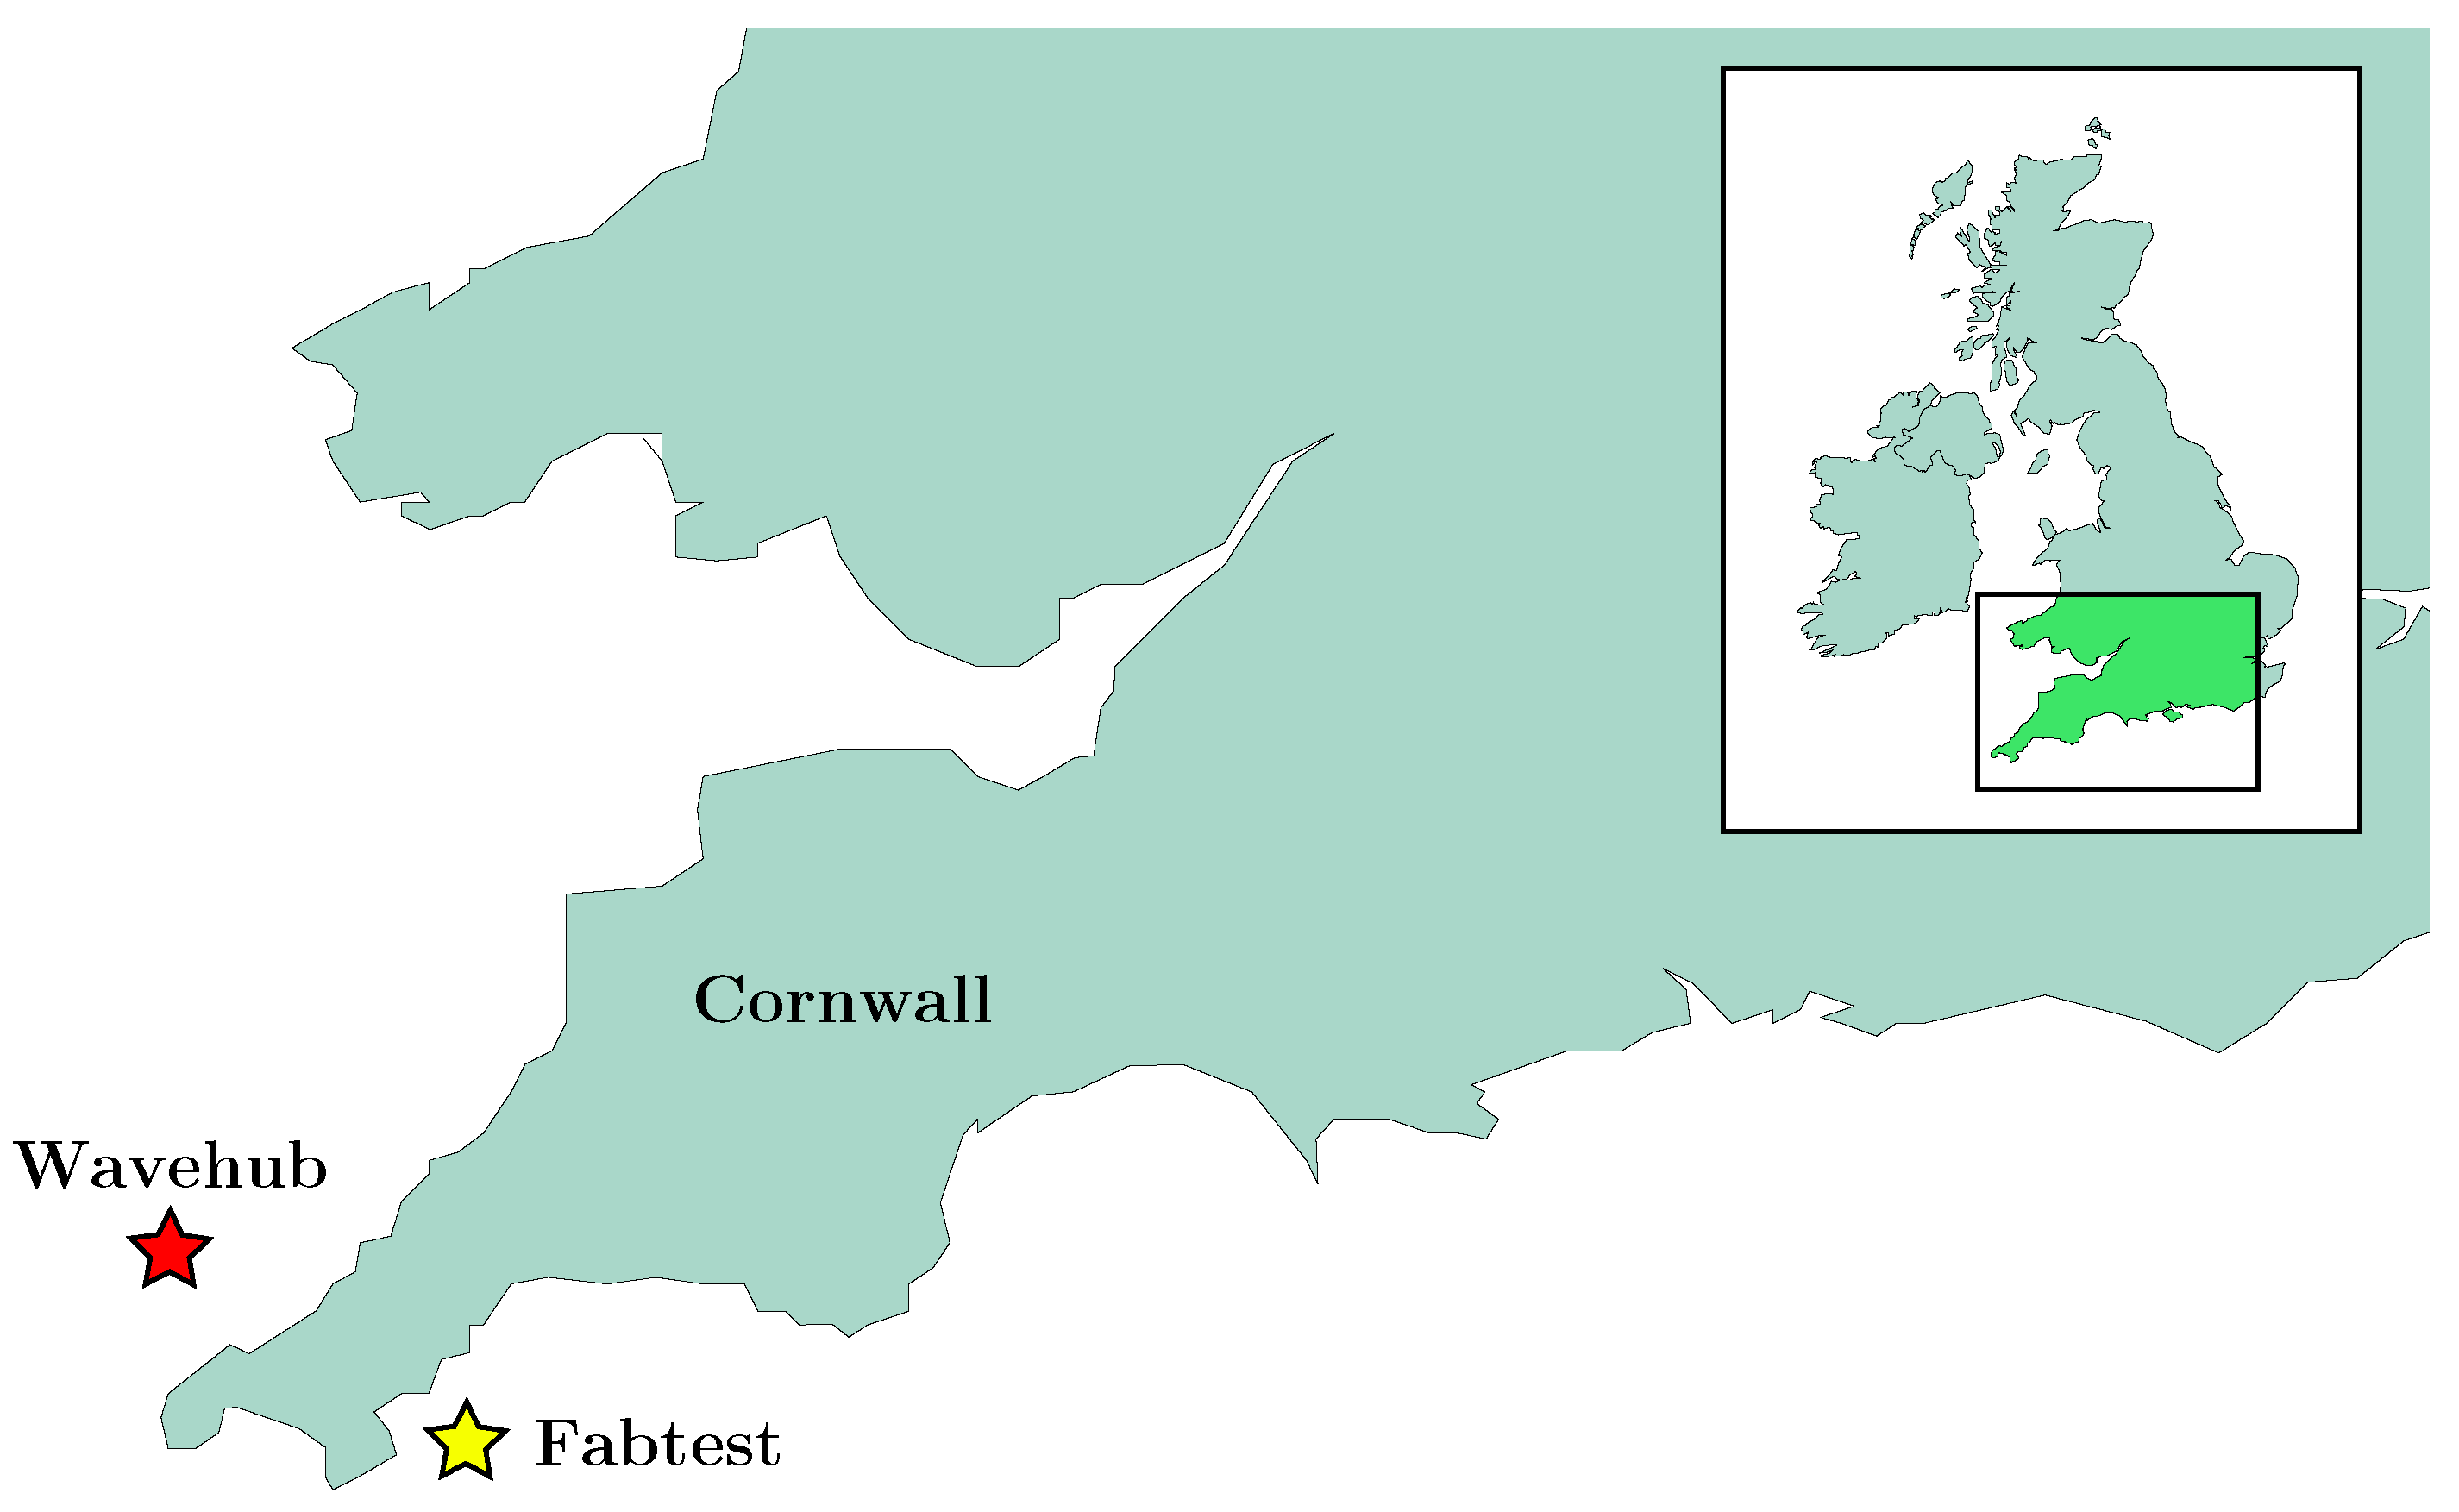
Based on the success of Bolt®, FO decided to use the knowledge and experience gained so far to proceed to the next generation of design. An agreement with several UK companies was made with funding from the UK Technology Strategy Board (TSB). The goal of the project was to improve the Bolt® concept towards a commercial level where it can be launched at Wavehub [6], and hence the project name Bolt2Wavehub. The project resulted in the full-scale system Lifesaver, consisting of a 16 m toroidal floater with five individual all-electric PTO systems. Lifesaver was installed on the test site Fabtest in April 2012 and is planned to be in operation until March 2013, when it has to be brought ashore due to the strict UK regulations. Fabtest is a UK test site for pre-commercial WEC concepts located in Falmouth Bay outside of Cornwall, England. The exact location of Fabtest is shown in Figure 5.
Figure 5.
Location of the UK test sites Wavehub and Fabtest.

Thus far, FO has not had a single serious event with any of the WEC systems, which has allowed for continuous long-term testing in real sea conditions. This has proved invaluable for building a knowledge base with wave energy. However, the problems and issues that arise in real sea conditions are multifaceted and thus exceed the scope of the undertaken tests.
2. System Description
FO’s WEC concept is based on the point absorber principle, which is well described in the literature (Falnes et al., 2003, 2012) [7,8] and has been extensively researched. FO has designed a floater structure with high surface area and low mass that is cost efficient with respect to absorbed power. This geometry results in a high resonance frequency and thus leads to a Response Amplitude Operator (RAO) (Falnes, 2002) [9] close to unity for most of the relevant wave states. The system is therefore quite rigid and well suited for power production by passive damping control. The absorber is tightly moored to the sea floor with a PTO system that produces power from the heaving motion. The point absorber system is independent of wave direction, which simplifies the mooring system and makes the system robust in mixed directional waves.
2.1. Power Take-Off (PTO)
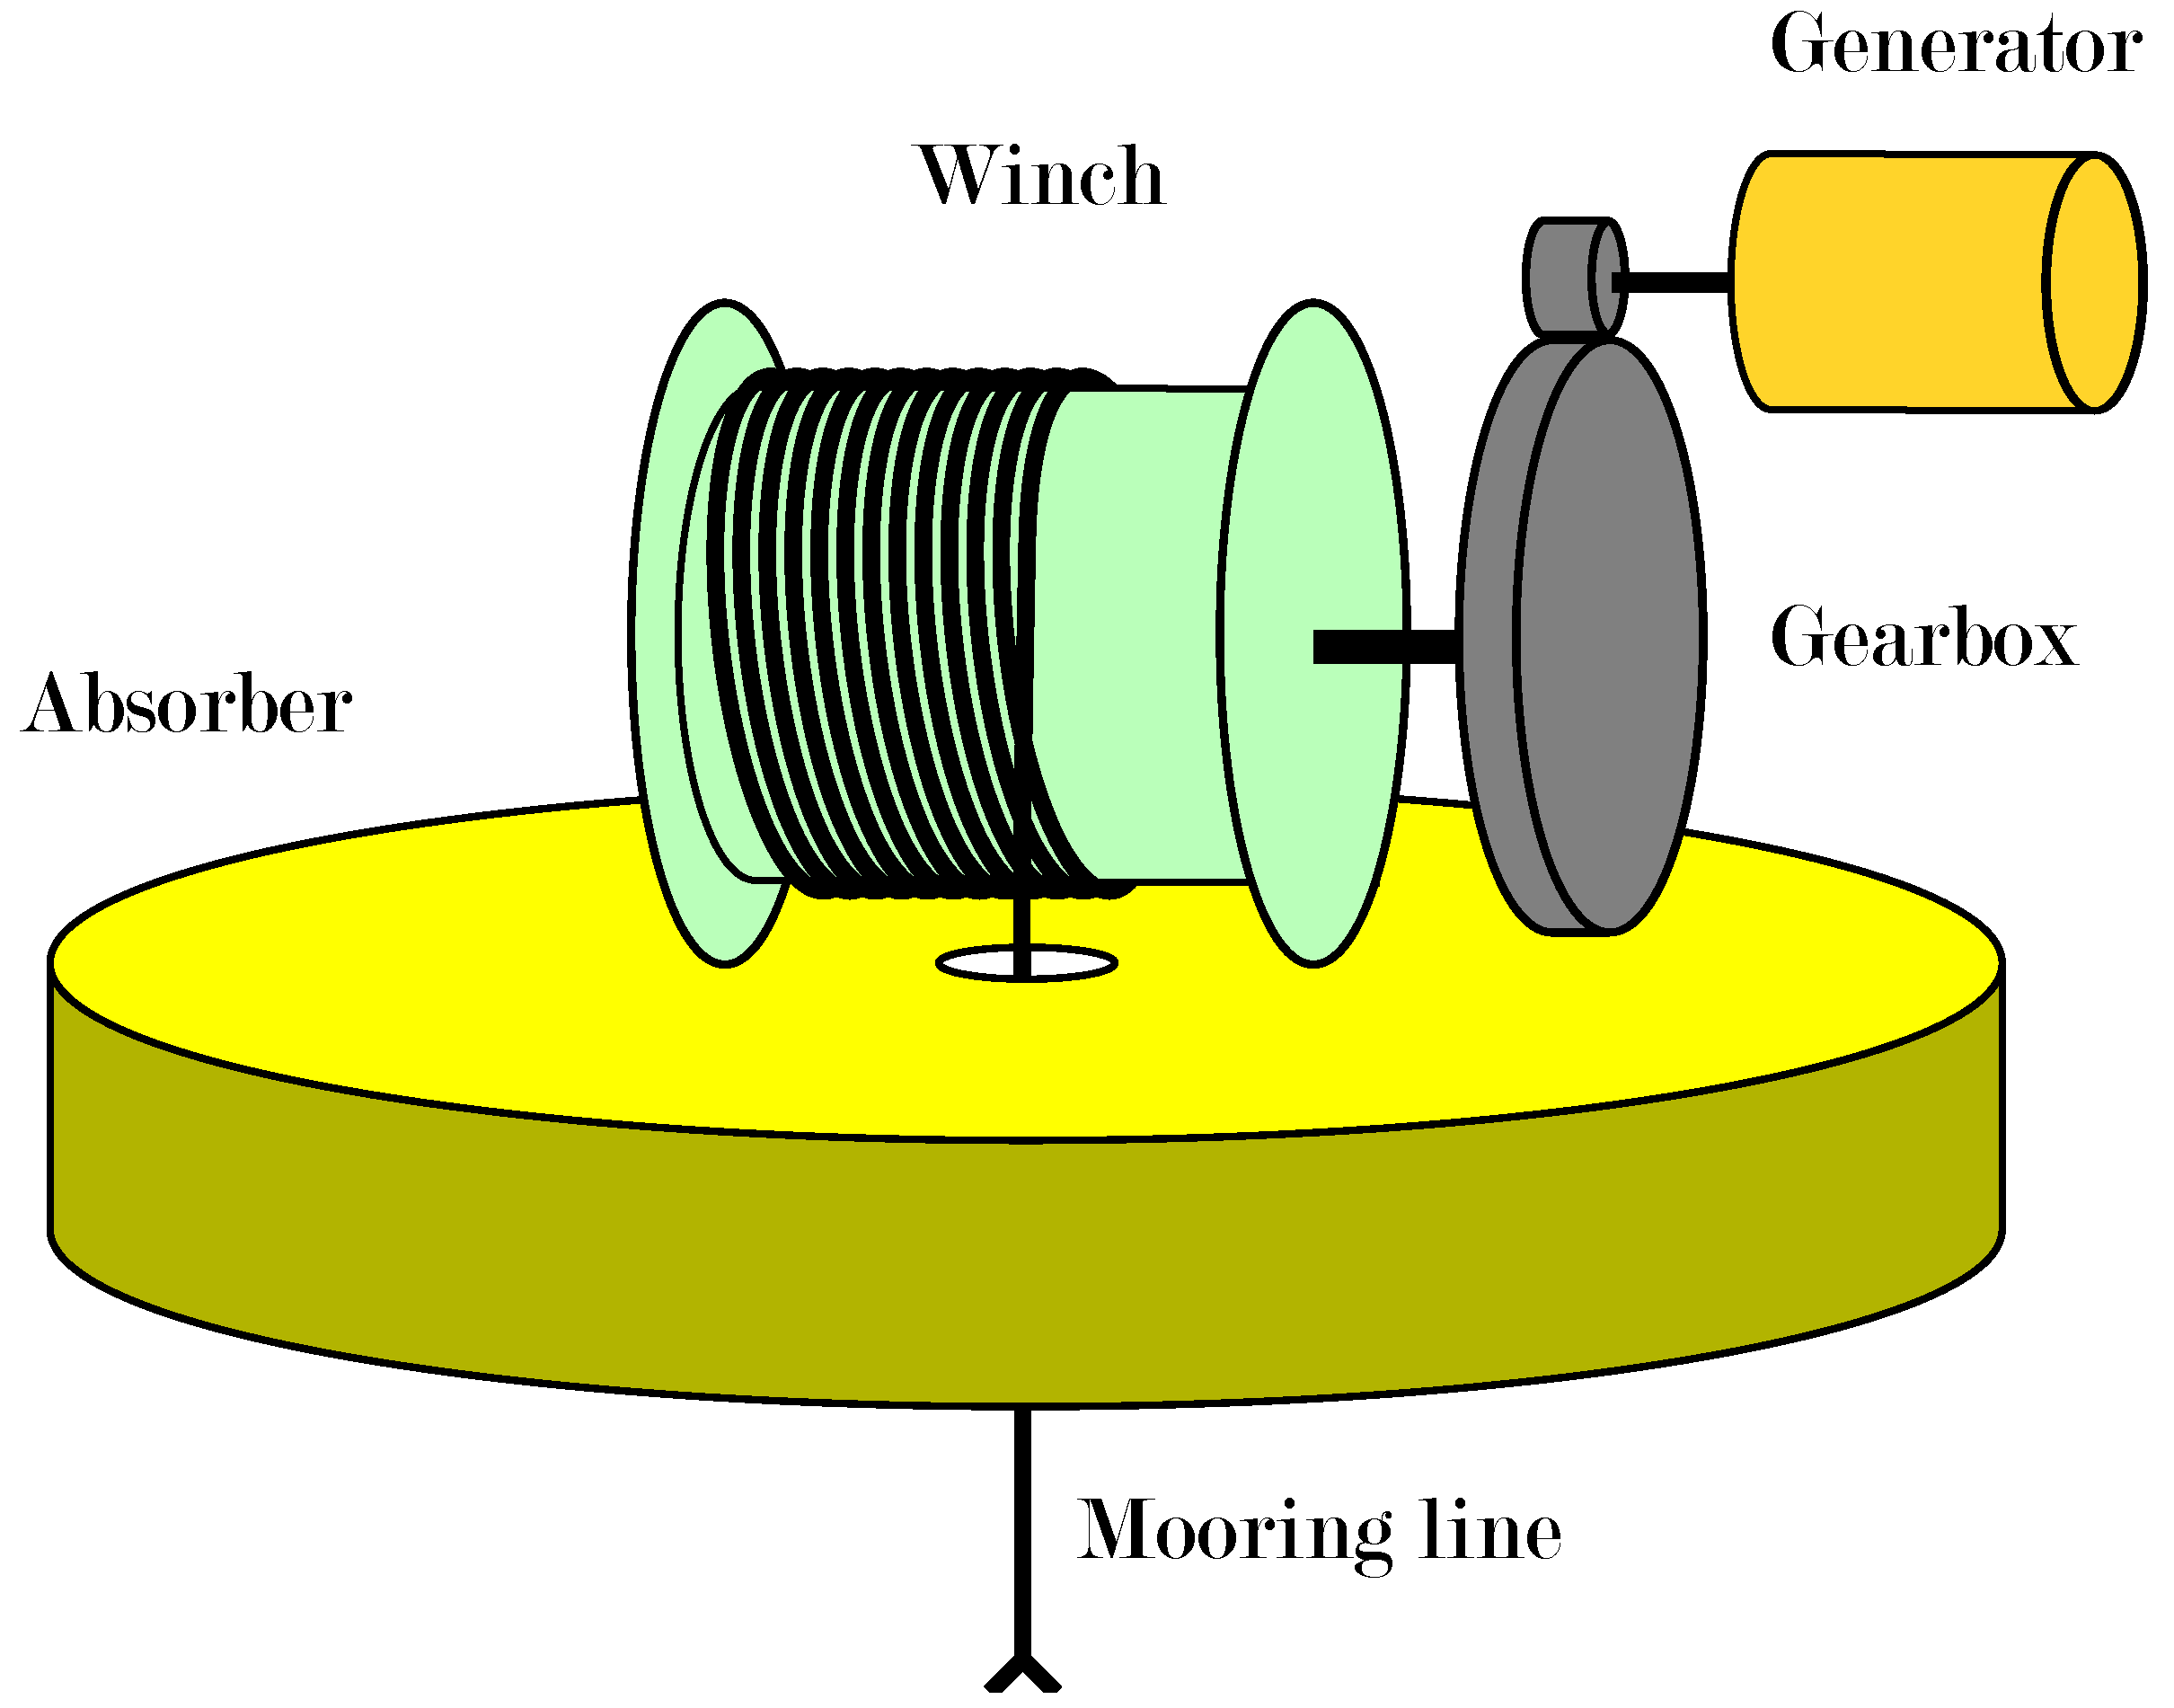
The PTO system is realized as a winch and rope system, as illustrated in Figure 6. The generator can only produce power during upwards motion, and has to operate in motoring mode during downwards motion to maintain rope tension. The detailed control principle utilized by FO is described in our previous publications [10,11]. The generator is a high performance permanent magnet machine manufactured by Siemens® and is designed for industrial servo applications. It has high torque output and low inertia, and is suitable for direct-drive applications with low gear ratio or entirely without a gearbox. The generator is powered through a full bridge converter that gives full control of the generator torque with high precision and quick response, which in total gives a very powerful package with high performance that is well suited for the reciprocal wave motions. The electrical configuration of the generator and converter can be seen in Figure 7(b).
Figure 6.
Principal sketch of the WEC.

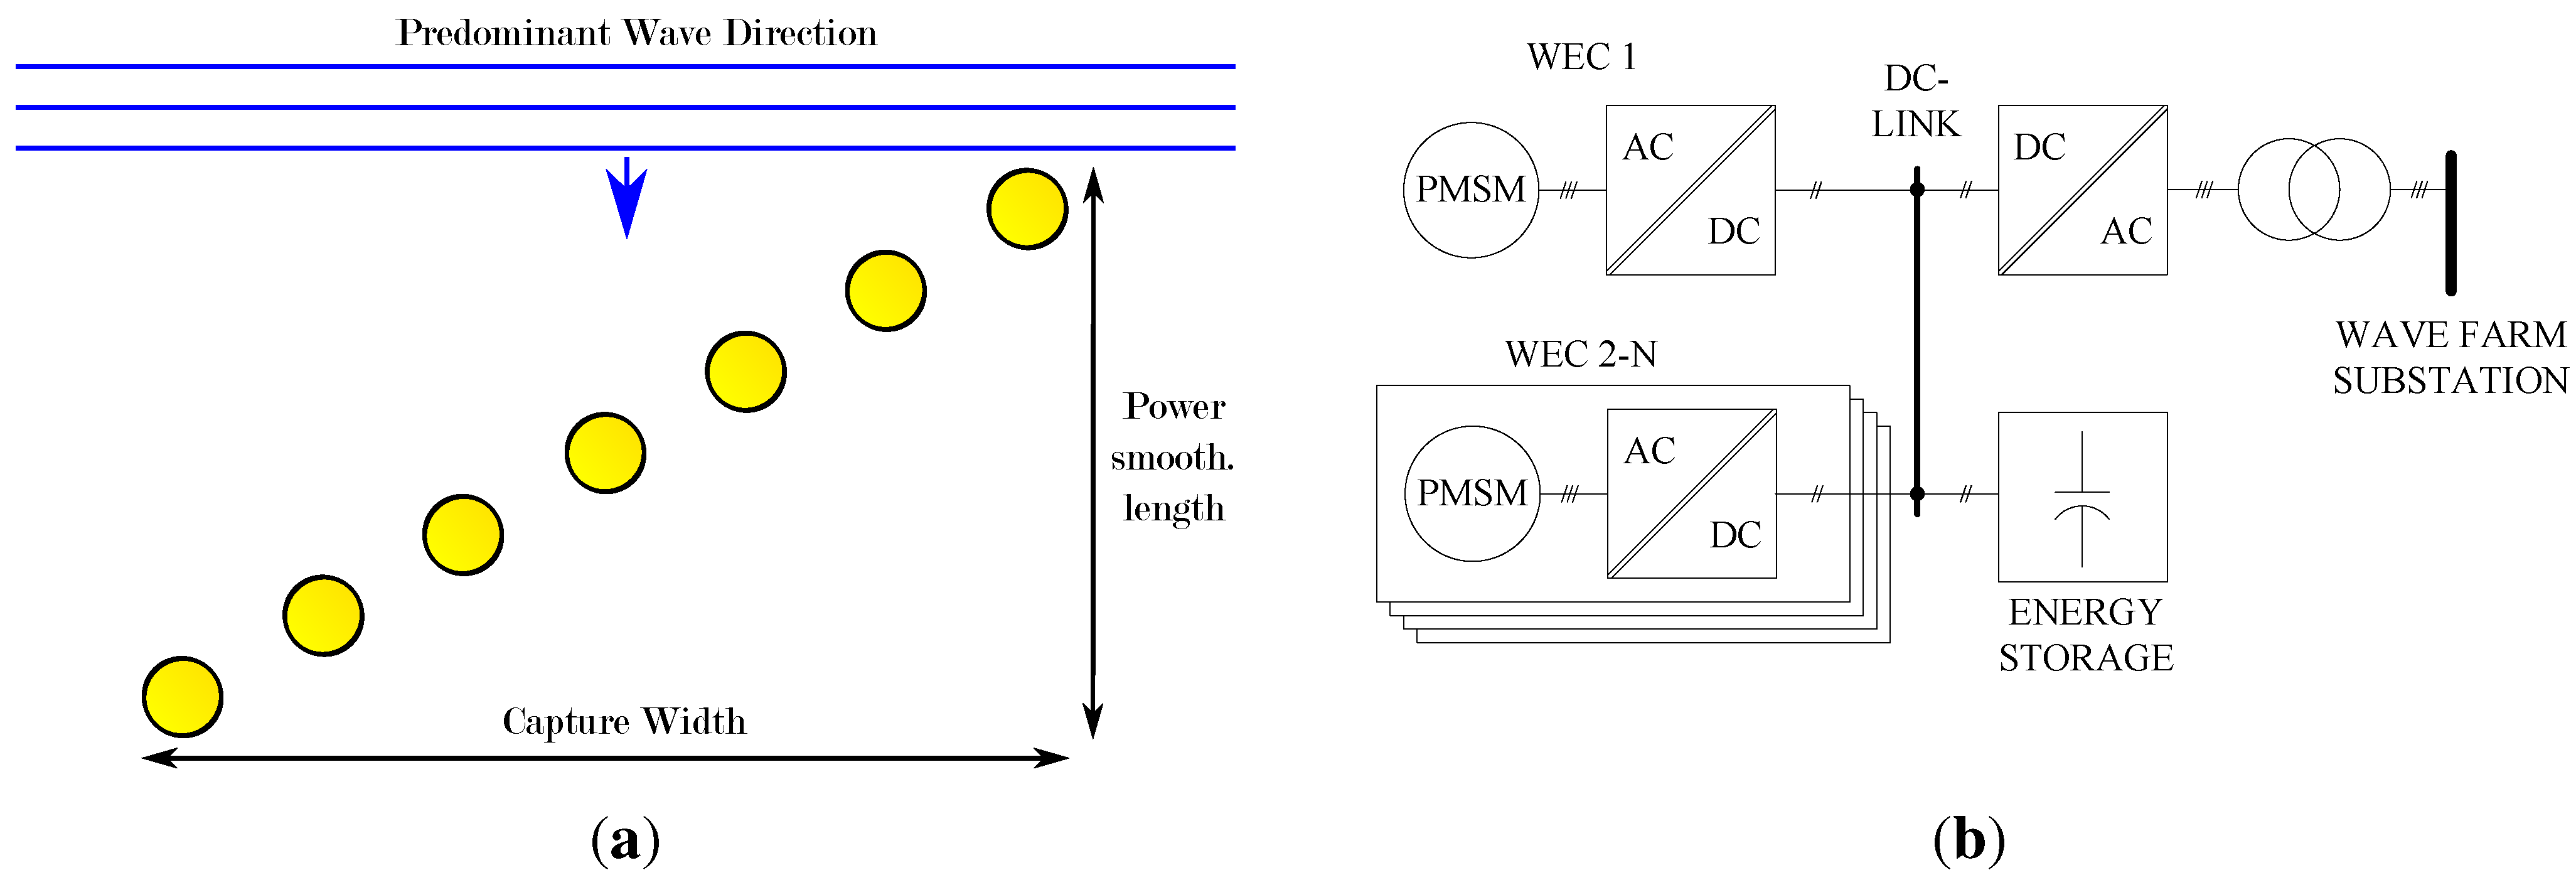
Figure 7.
Array design. (a) Array configuration; (b) Electrical configuration.

As discussed earlier, the unidirectional production principle increases the peak-to-average ratio with a factor of two as the production becomes asymmetrical. The consequent reduction in power quality transfers to the generator and the converter, reducing the utilization factor on these components to 50%. Symmetrical production may be achieved by implementing a separate spring system that produces enough pre-tension to tense the rope and also pull the generator at full power during the downward motion. As this will be an expensive and powerful system, the costs must be carefully weighed against the increased generator and converter costs of the asymmetrical system. Our earlier prototype Bolt®, shown in Figure 4 is designed with the symmetrical option based on a hydraulic spring system.
When cost-optimizing the PTO, the rated production force turns out to be the design property with the highest cost impact, since it governs the strength and the physical size for most of the mechanical components. The rated power has the second highest cost impact and influences mostly the generator and the converter. There is also a high potential for cost savings on the inverter by extensive utilization of field weakening control, as described in our previous work [11]. The third driving cost parameter is the ability to handle mechanical inertia by the implemented control system. As the system has to follow the reciprocal motion of the waves, the dynamical drive train response is very important. Also, a high inertia will cause high power fluctuations due to change in kinetic energy. The inertia is dominated by the generator and can be reduced by moving towards more expensive direct drive generators with high torque and low speed. Thus, there will be a cost balance between good control and low inertia on the generator. Hence, it is important to keep in mind that the power rating of a PTO alone is not sufficient to give a clear picture of the PTO cost. However, to simplify further analysis, power rating is used as the key performance indicator in the following sections.
2.2. Array
To increase the output power, and to improve the output power quality, several WECs may be linked together into an array. Figure 7(a) shows the proposed layout that was put forward in our previous study described in [12,13]. The fundamentals behind this design is the need to space the WECs along the incoming wave direction to gain power quality from intermediate wave smoothing, while simultaneously achieving a good capture ratio, which requires spacing perpendicular to the incoming wave direction. Thus, a 45° angle to the incoming wave direction was found to be optimal. Also, the array design should endeavor to cover a full wave length along the predominant wave direction to maximize the effect of power smoothing. With Lifesaver as the basis, this amounts to around seven absorbers per array.
It is FO’s point of view that the devices within the array should be positioned close together and interconnected so that the array can be viewed and operated as a single system. Furthermore, this allows for sharing a common mooring system and simplifies the electrical connections between the devices as the cable can run along the floater topside. The exact configuration of the mechanical interfaces is not yet decided, but preliminary studies indicate that a combination of strong moorings pulling the devices apart and flexible bumper connections between the devices can maintain the mechanical integrity of the array within reasonable cost. In this work, a spacing of 2 m is chosen between the devices to account for the interface structure. Figure 8 illustrates an array based on Lifesaver with this configuration.
Figure 8.
Artistic impression of array based on Lifesaver.

The array is electrically connected to DC by coupling the DC-Link on the inverters. The configuration is illustrated in Figure 7(b), and shows how the power can flow freely between the WECs without additional conversion or transmission equipment. This allows a producing WEC to directly transfer power to a consuming WEC that is running in pull-back, and allows the sum of WEC powers to be directly transferred. However, the low DC-link voltage poses a practical limit to the size of the array due to the sea cables that have to run between the WECs. As a rule of thumb, 1000 A is used as a current limit for low voltage sea cables. This limits the number of WECs in the array to around ten, and supports the earlier stated figure of seven absorbers in the array. Thus, this array size is adopted for the following simulation work.
As the allowed current transfer capacity is fully utilized within the array, the array output must be transformed to a higher voltage before export from the array. The middle WEC should act as a mother WEC and house the electrical conversion equipment and connect to the export cable. Since the aggregated array power is low voltage DC, an active front-end inverter and a transformer is required to convert the output to medium voltage AC. The cost of this equipment is directly influenced by the peak power requirement and power quality at this point. In our earlier publication [13], we showed that the peak to average ratio would be directly reduced by a factor of 3–5 due to natural power smoothing between the devices. The peak-to-average ratio could be further improved towards 1.5 by implementing a small energy storage, as shown in our work [14]. As will be demonstrated in the following, the peak power rating for the current configuration is close to three, which will require a rated installed converter capacity of about twice the average exported power. This is illustrated in Figure 3 on page 422.
2.3. Farm
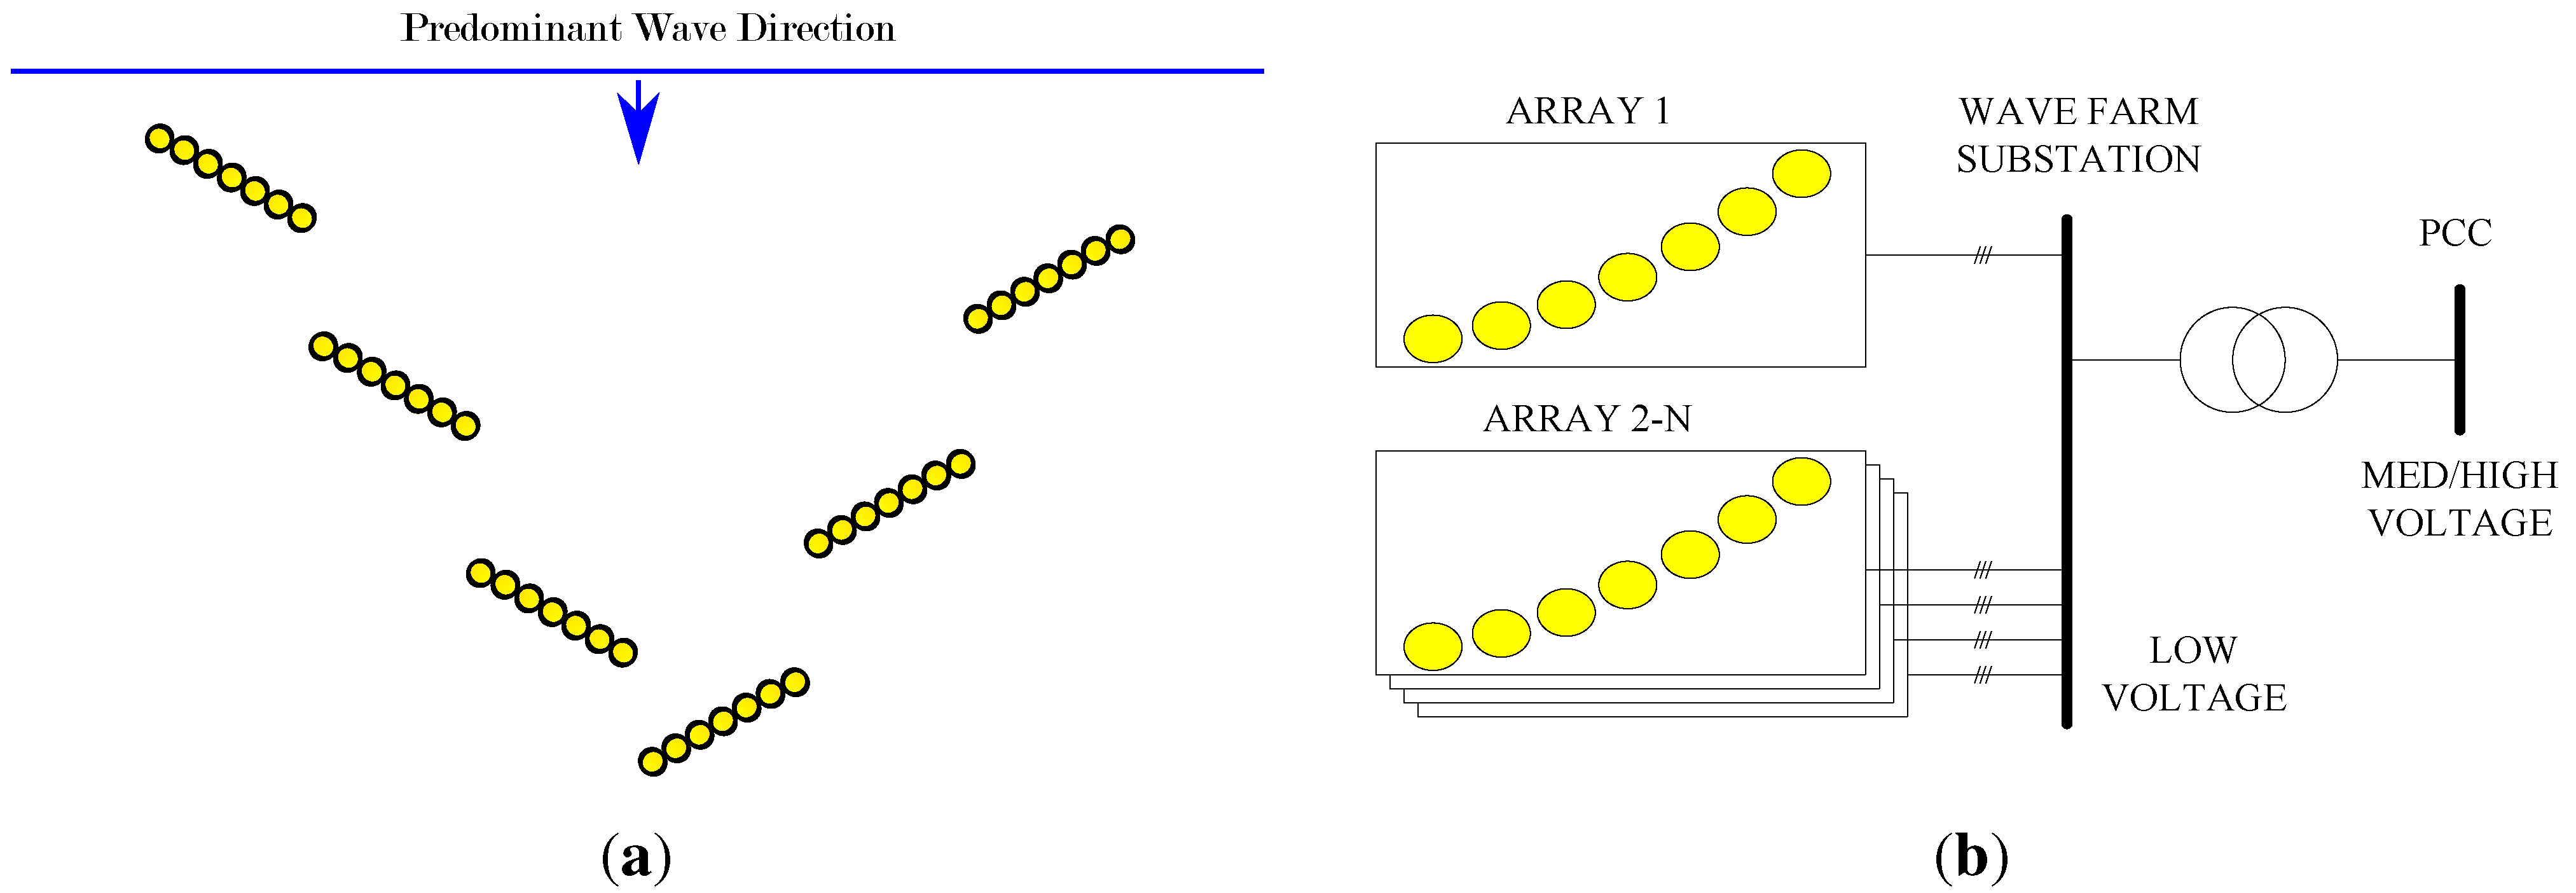
The array could be directly connected to the grid as it outputs standard AC power. However, since the power utilization is only about 50%, it will be beneficial to further improve the power quality by creating a WEC farm that consists of several arrays. The arrays must be positioned in the farm according to the same principles of the WEC placement in the array. Hence, no array must shield another array from the predominant wave direction. Also, for effective power smoothing, the incoming wave along the predominant wave direction should only interfere with one WEC at a time. A proposed farm configuration consisting of six arrays that complies with this is shown in Figure 9(a), and implemented in the following simulation work. Some interference is expected between the absorbers, which in general reduces the power output from the rear WECs. The wedge-shaped layout could compensate some of this by amplifying the incoming wave, but this has not yet been verified by hydrodynamical analysis, and must be treated with care.
Figure 9.
Wave farm design. (a) Farm configuration; (b) Electrical configuration.

While the smoothing effect of the array mainly comes from evening out the power fluctuations within a single wave, the smoothing effect for the farm comes from balancing out the differences between waves in an incoming wave train. As demonstrated by Stephen Salter (Salter, 1988) [4], smoothing of about 100–200 seconds is required to effectively smooth out wave train fluctuations. This corresponds to a fetch of 1–2 km and is far greater than the farm configuration suggested here. Some cyclical power fluctuations must therefore be expected also on the farm output, and a peak-to-average ratio of approximately 1.25 is expected. The proposed electrical configuration for the farm is shown in Figure 9(b) and shows how the medium voltage power from each array is collected for export. A second step-up transformer may be included to further increase the output voltage. The main benefit of the improved power quality from the farm is better utilization of the shore cable connecting to the grid.
3. Simulation Model
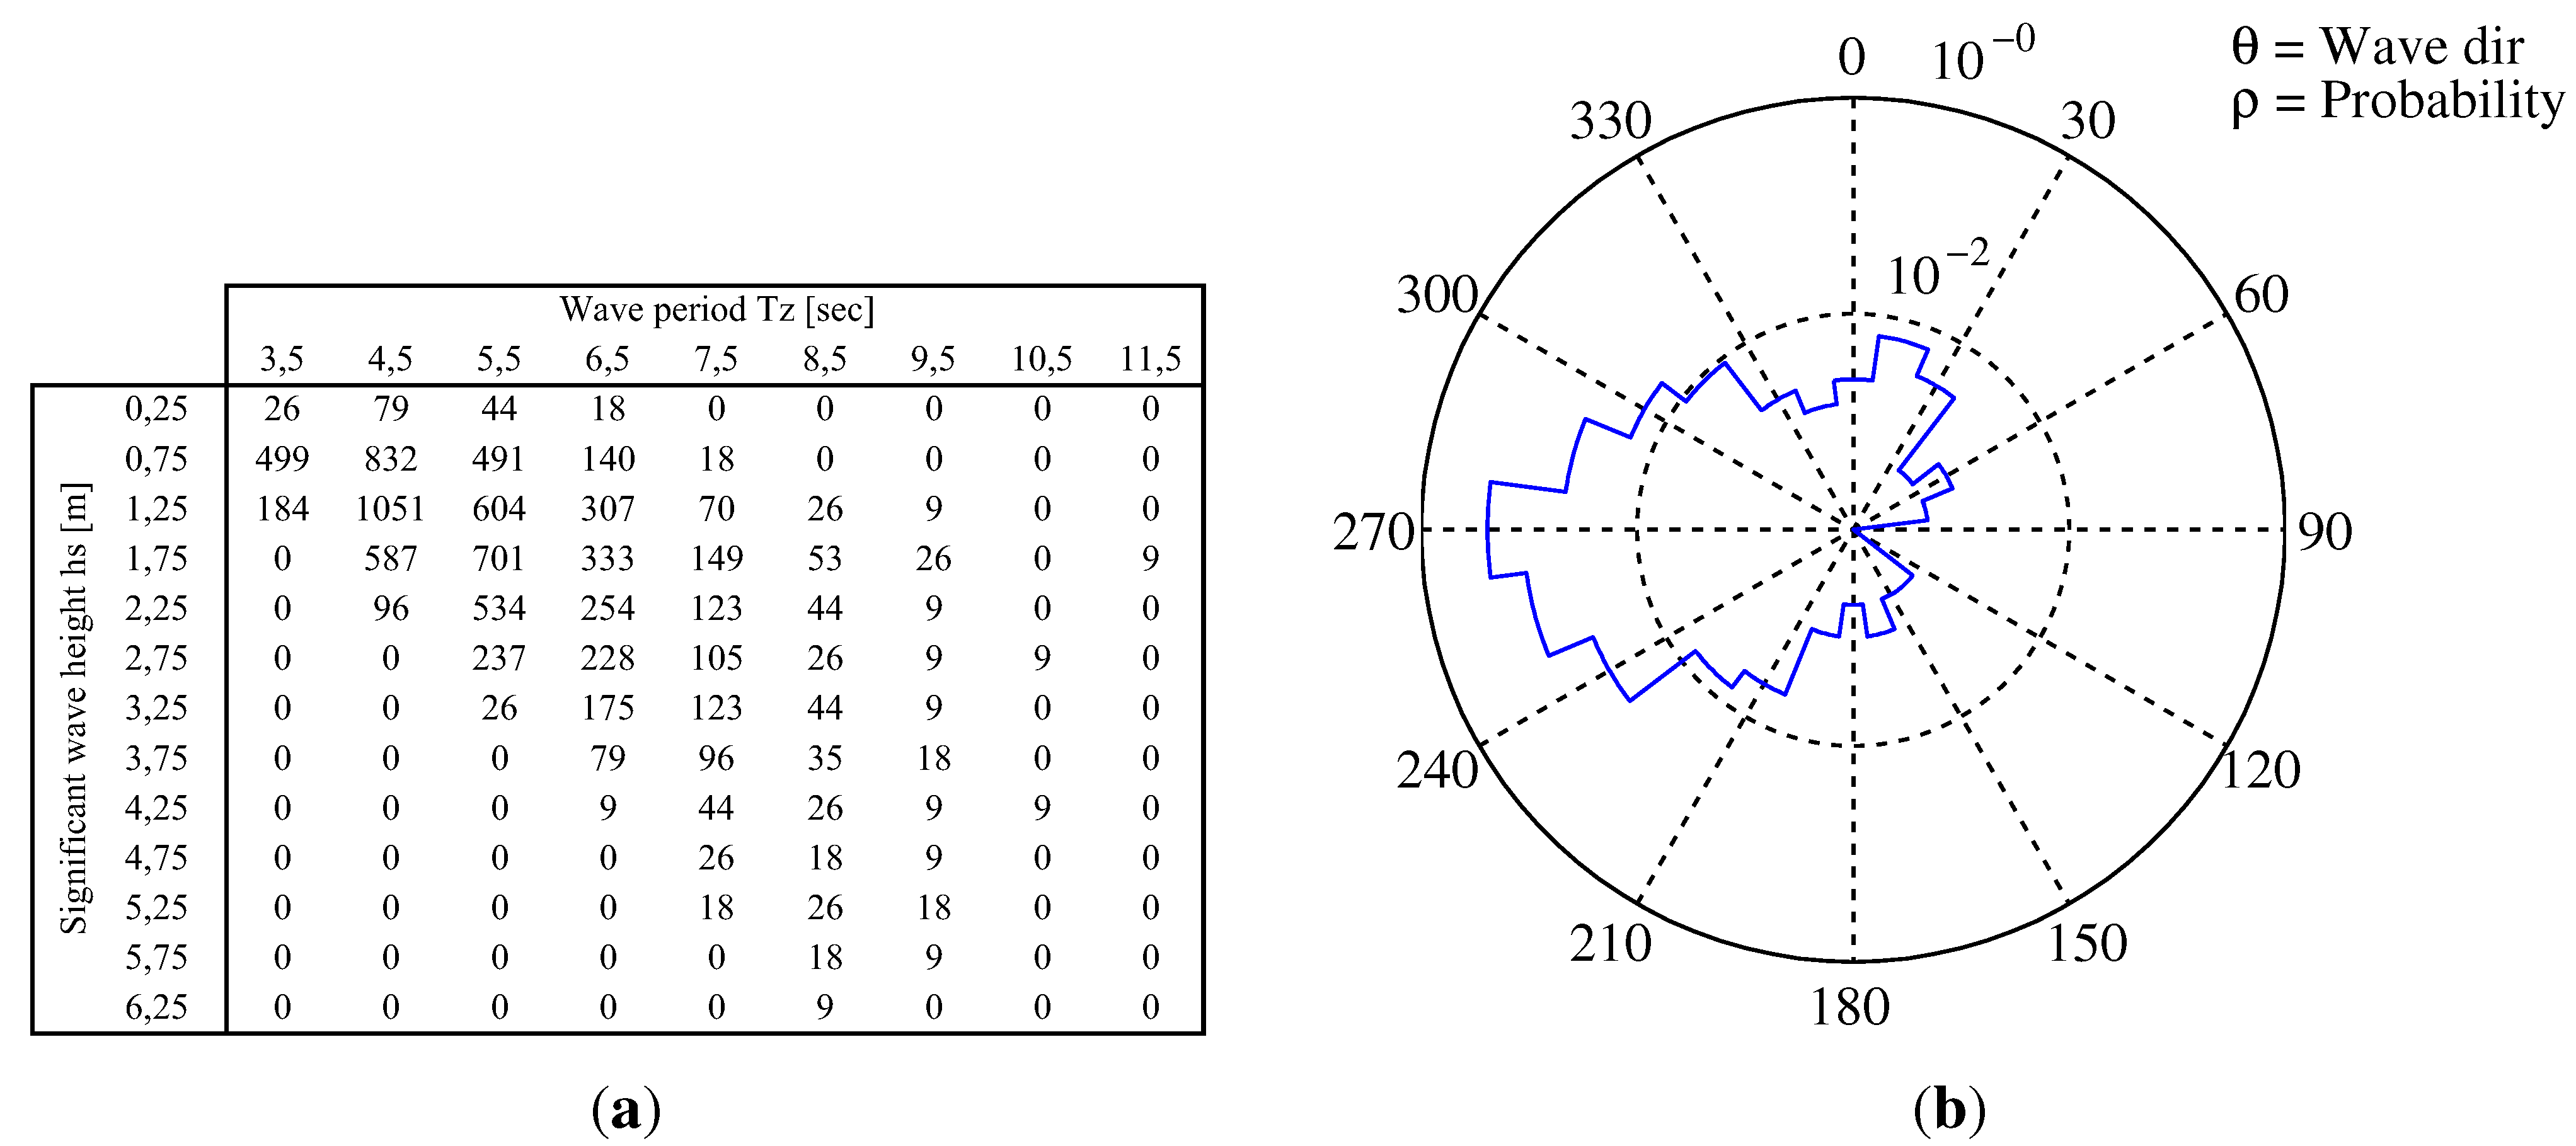
The simulations are performed on the basis of the WEC prototype test site Wavehub located west of Cornwall, England as shown in Figure 5. The test site is funded and supported by the renewable energy program administrated by the British government. The site includes a sub-sea power substation that allows for electrically connecting the WECs to the grid. Wavehub has been surveyed and monitored for an extensive period and work is still ongoing to calculate true statistical wave data for the site. The wave scatter diagram and the directional spectrum for Wavehub is plotted in Figure 10(a) and Figure 10(b), respectively. The directional scatter is heavily dominated by waves from the west, and the directional plot must be logarithmically scaled to show all the directions observed.
The model used for the farm simulation is based on the single absorber model for Lifesaver (Molinas et al., 2007, Skjervheim et al., 2008) [15,16]. The simulation model solves Equation (1) for ζ (t) in the time domain. The index denotes the mode of motion, given by the six degrees of freedom (DOF) of motion for the floater. The excitation force matrix Fe,i is the time-dependent force due to incident waves, and M denotes the mass of the system.
Figure 10.
Wave climate at Wavehub. (a) Wavehub scatter diagram. Hours per wave state; (b) Probability distribution of wave direction on Wavehub. The plot is a logarithmic polar plot defined by the angle θ and radi ρ.
Figure 10.
Wave climate at Wavehub. (a) Wavehub scatter diagram. Hours per wave state; (b) Probability distribution of wave direction on Wavehub. The plot is a logarithmic polar plot defined by the angle θ and radi ρ.

Since the simulation is based on a detailed 6DOF model for Lifesaver, FO keeps the simulation model confidential. However, such high level of complexity is not essential for this study, and a simplified 1DOF model would produce almost the same result. It is therefore possible for a third party to qualitatively verify the results published here without detailed knowledge of the simulation model used.
To simulate a wave state, a 20-minute time series of irregular waves is generated based on the JONSWAP wave spectrum [18]. The wave state is defined by the significant wave height hs, the zero crossing period tz, and the wave direction θ. The subsequent excitation forces are then calculated and the simulation is performed for the full length of the time series. The simulation model also takes into account PTO and generator losses, and the model outputs a 20-minute time series of exported electrical power from the WEC. The simulation model has undergone many years of development and testing, and is verified against real production data from several prototypes, including Bolt® and Lifesaver.
Array and farm simulations are performed by running the simulation model separately for each absorber in the array/farm. All absorbers are simulated for the same wave scenario, and the wave propagation through the array is modeled in detail to produce an authentic result. The simulation model does not take interference between the WECs into consideration. This is handled by separate modeling work and is described in the next section.
3.1. Hydrodynamic Interactions within the Array
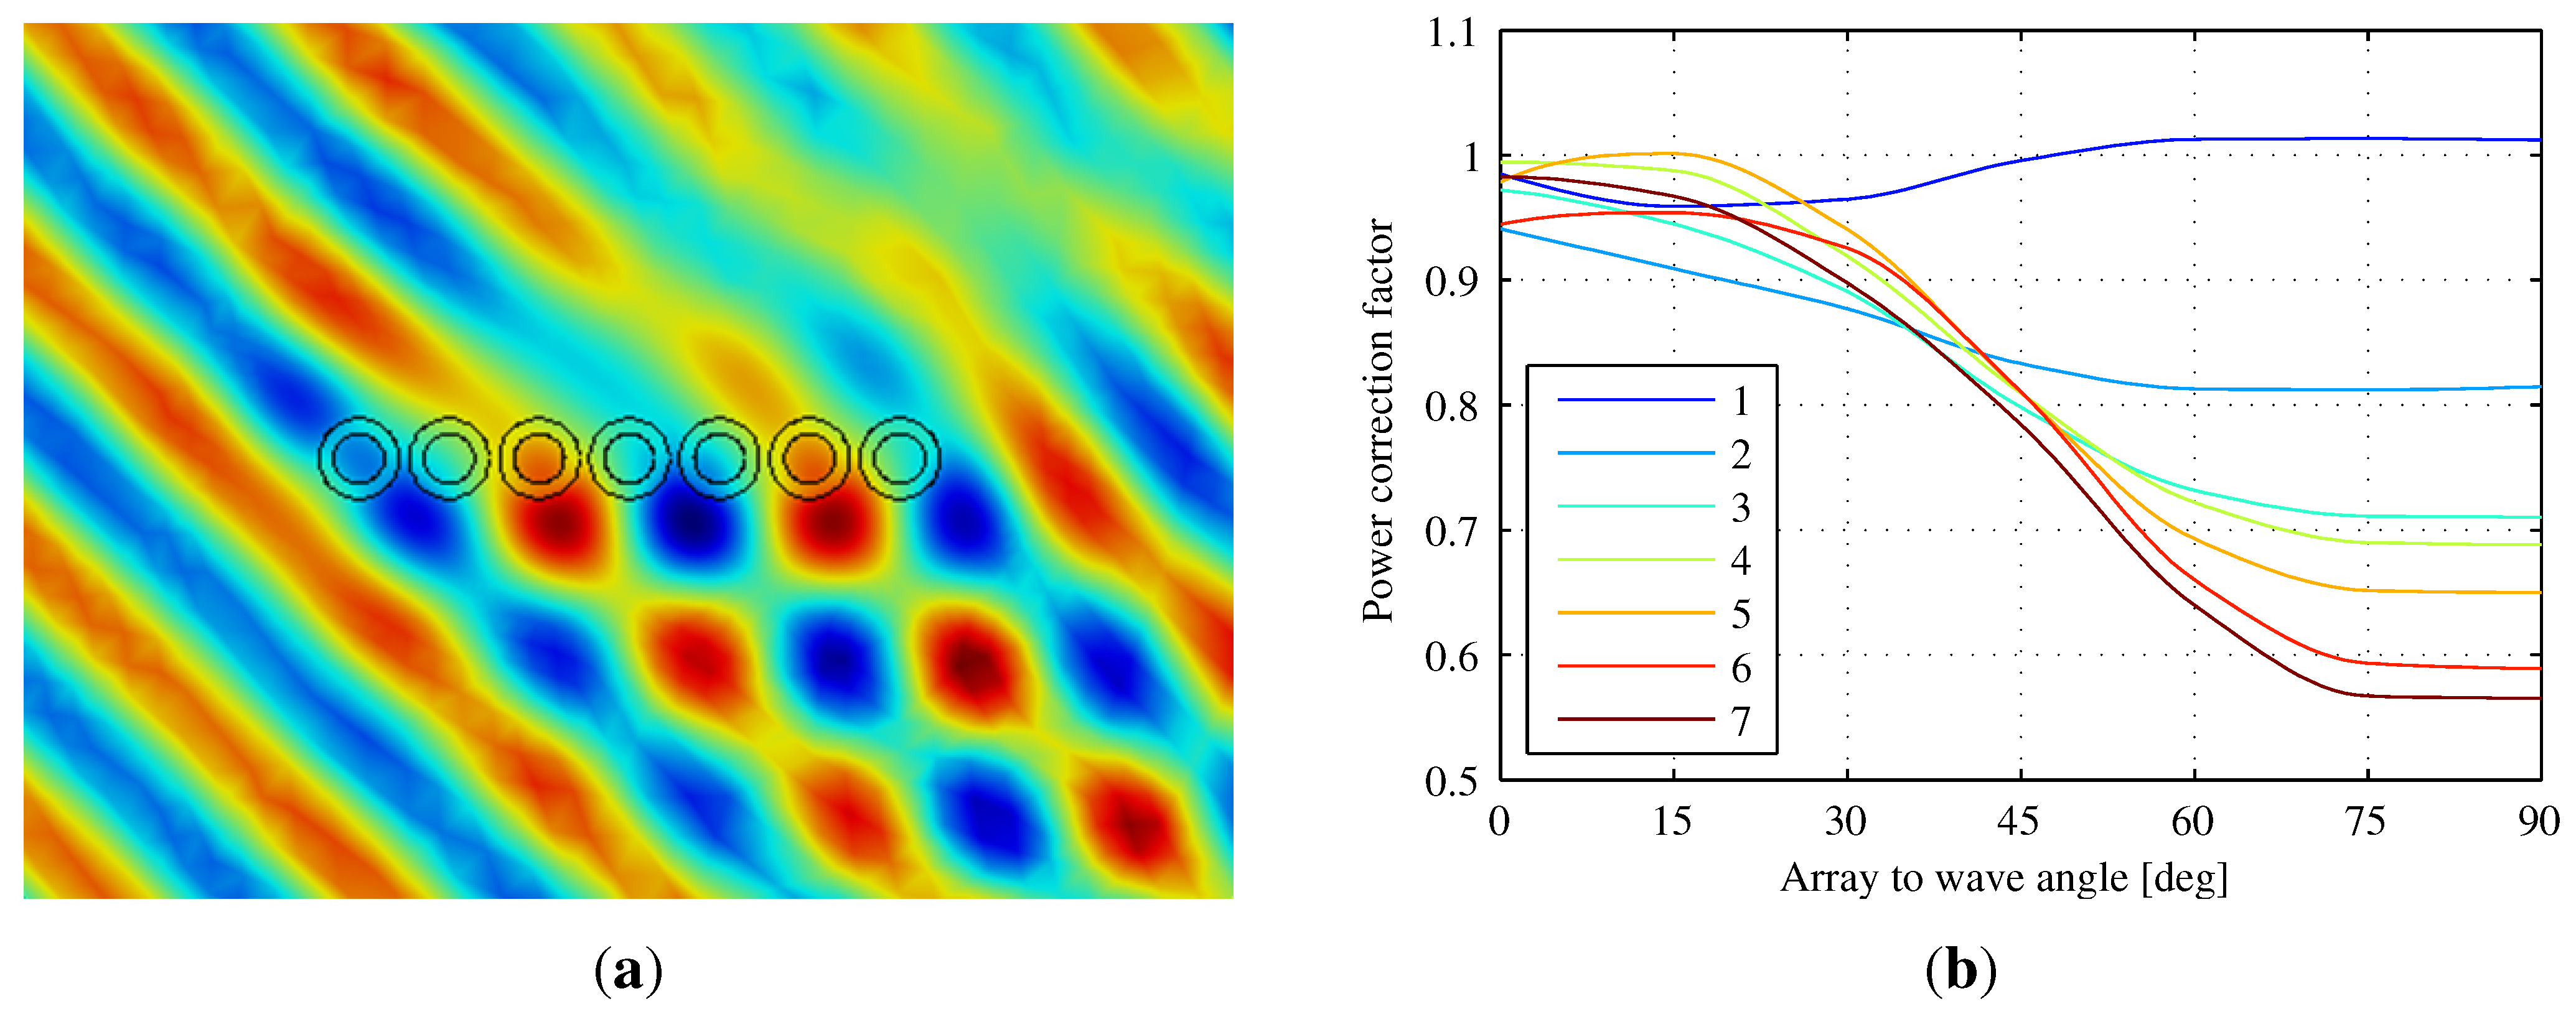
The hydrodynamical problem is solved within the framework of linear potential theory, specifically the Laplace equation, resulting in the interaction field illustrated in Figure 11(a). In this paper, the theoretical basis is only covered briefly. The work of J.N Newman’s Marine Hydrodynamics [19] is used as basis for this simulation work.
Figure 11.
Hydrodynamical interference between absorbers. (a) Illustration of the wave interaction with the array. The wave direction is from southwest and thus causes amplification on the southern side of the array and attenuation on the northern side; (b) Power correction factors for absorbers in array calculated from shadowing effects (Tz = 6.5 s).

Since the velocity potential is linear, all contributions to forces and motions are linear. As a result, the principle of superposition applies. Therefore, it is convenient to split the complex problem into a set of simpler problems. The full solution is thus the sum of several simpler solutions. The potential arising from N absorbers placed in a string can thus be described as the sum of the following contributions.
ϕ = ϕ0 + ϕD + ϕR
The total velocity potential ϕ due to the interaction of N absorbers on a string is the sum of the excitation potential due to incident waves ϕ0, the diffraction potential due to the interaction of the incident potential with all absorbers at rest ϕD, and the radiation potential ϕR due to the independent motion of every absorber in every mode of motion with no incident waves present.
The diffraction problem and the radiation problem are solved independently. Thus, there are N + 1 independent problems to solve. Furthermore, the radiation potential from each absorber is separated in 6 independent modes of motion. The total potential acting on absorber N in mode i of motion is the sum of every other absorber’s radiation and diffraction potential, in addition to the diffraction and radiation potential from absorber N acting on itself in mode i of motion. Combining the six modes of motions for each absorber, and allowing for all absorbers to interact, results in a total of N × 6 independent linear equations to be solved for each wave frequency. With a full description of the velocity potential, it is possible to integrate solutions in the frequency domain on specific wave climates and optimize the array energy output with respect to array layout angle and power take off damping coefficient.
In order to represent the interactions within the array in the time domain model, a set of correction factors is applied to the power output from a time domain model of an array without interactions. Correction factors are calculated individually for each wave direction and wave period encountered. The correction factor for the individual WECs are plotted as a function of the array angle in Figure 11(b) for the design wave period (Tz = 6.5 s). Currently, only interactions within arrays are taken into consideration, and the hydrodynamical effect of the wave farm is not modeled. A detailed farm study will be required to produce an accurate figure for annual energy production, but based on experience with similar modeling, the interactions are not believed to have significant impact on the simulated power quality. The results presented here are therefore believed to be accurate and valid for evaluating power quality.
4. Results
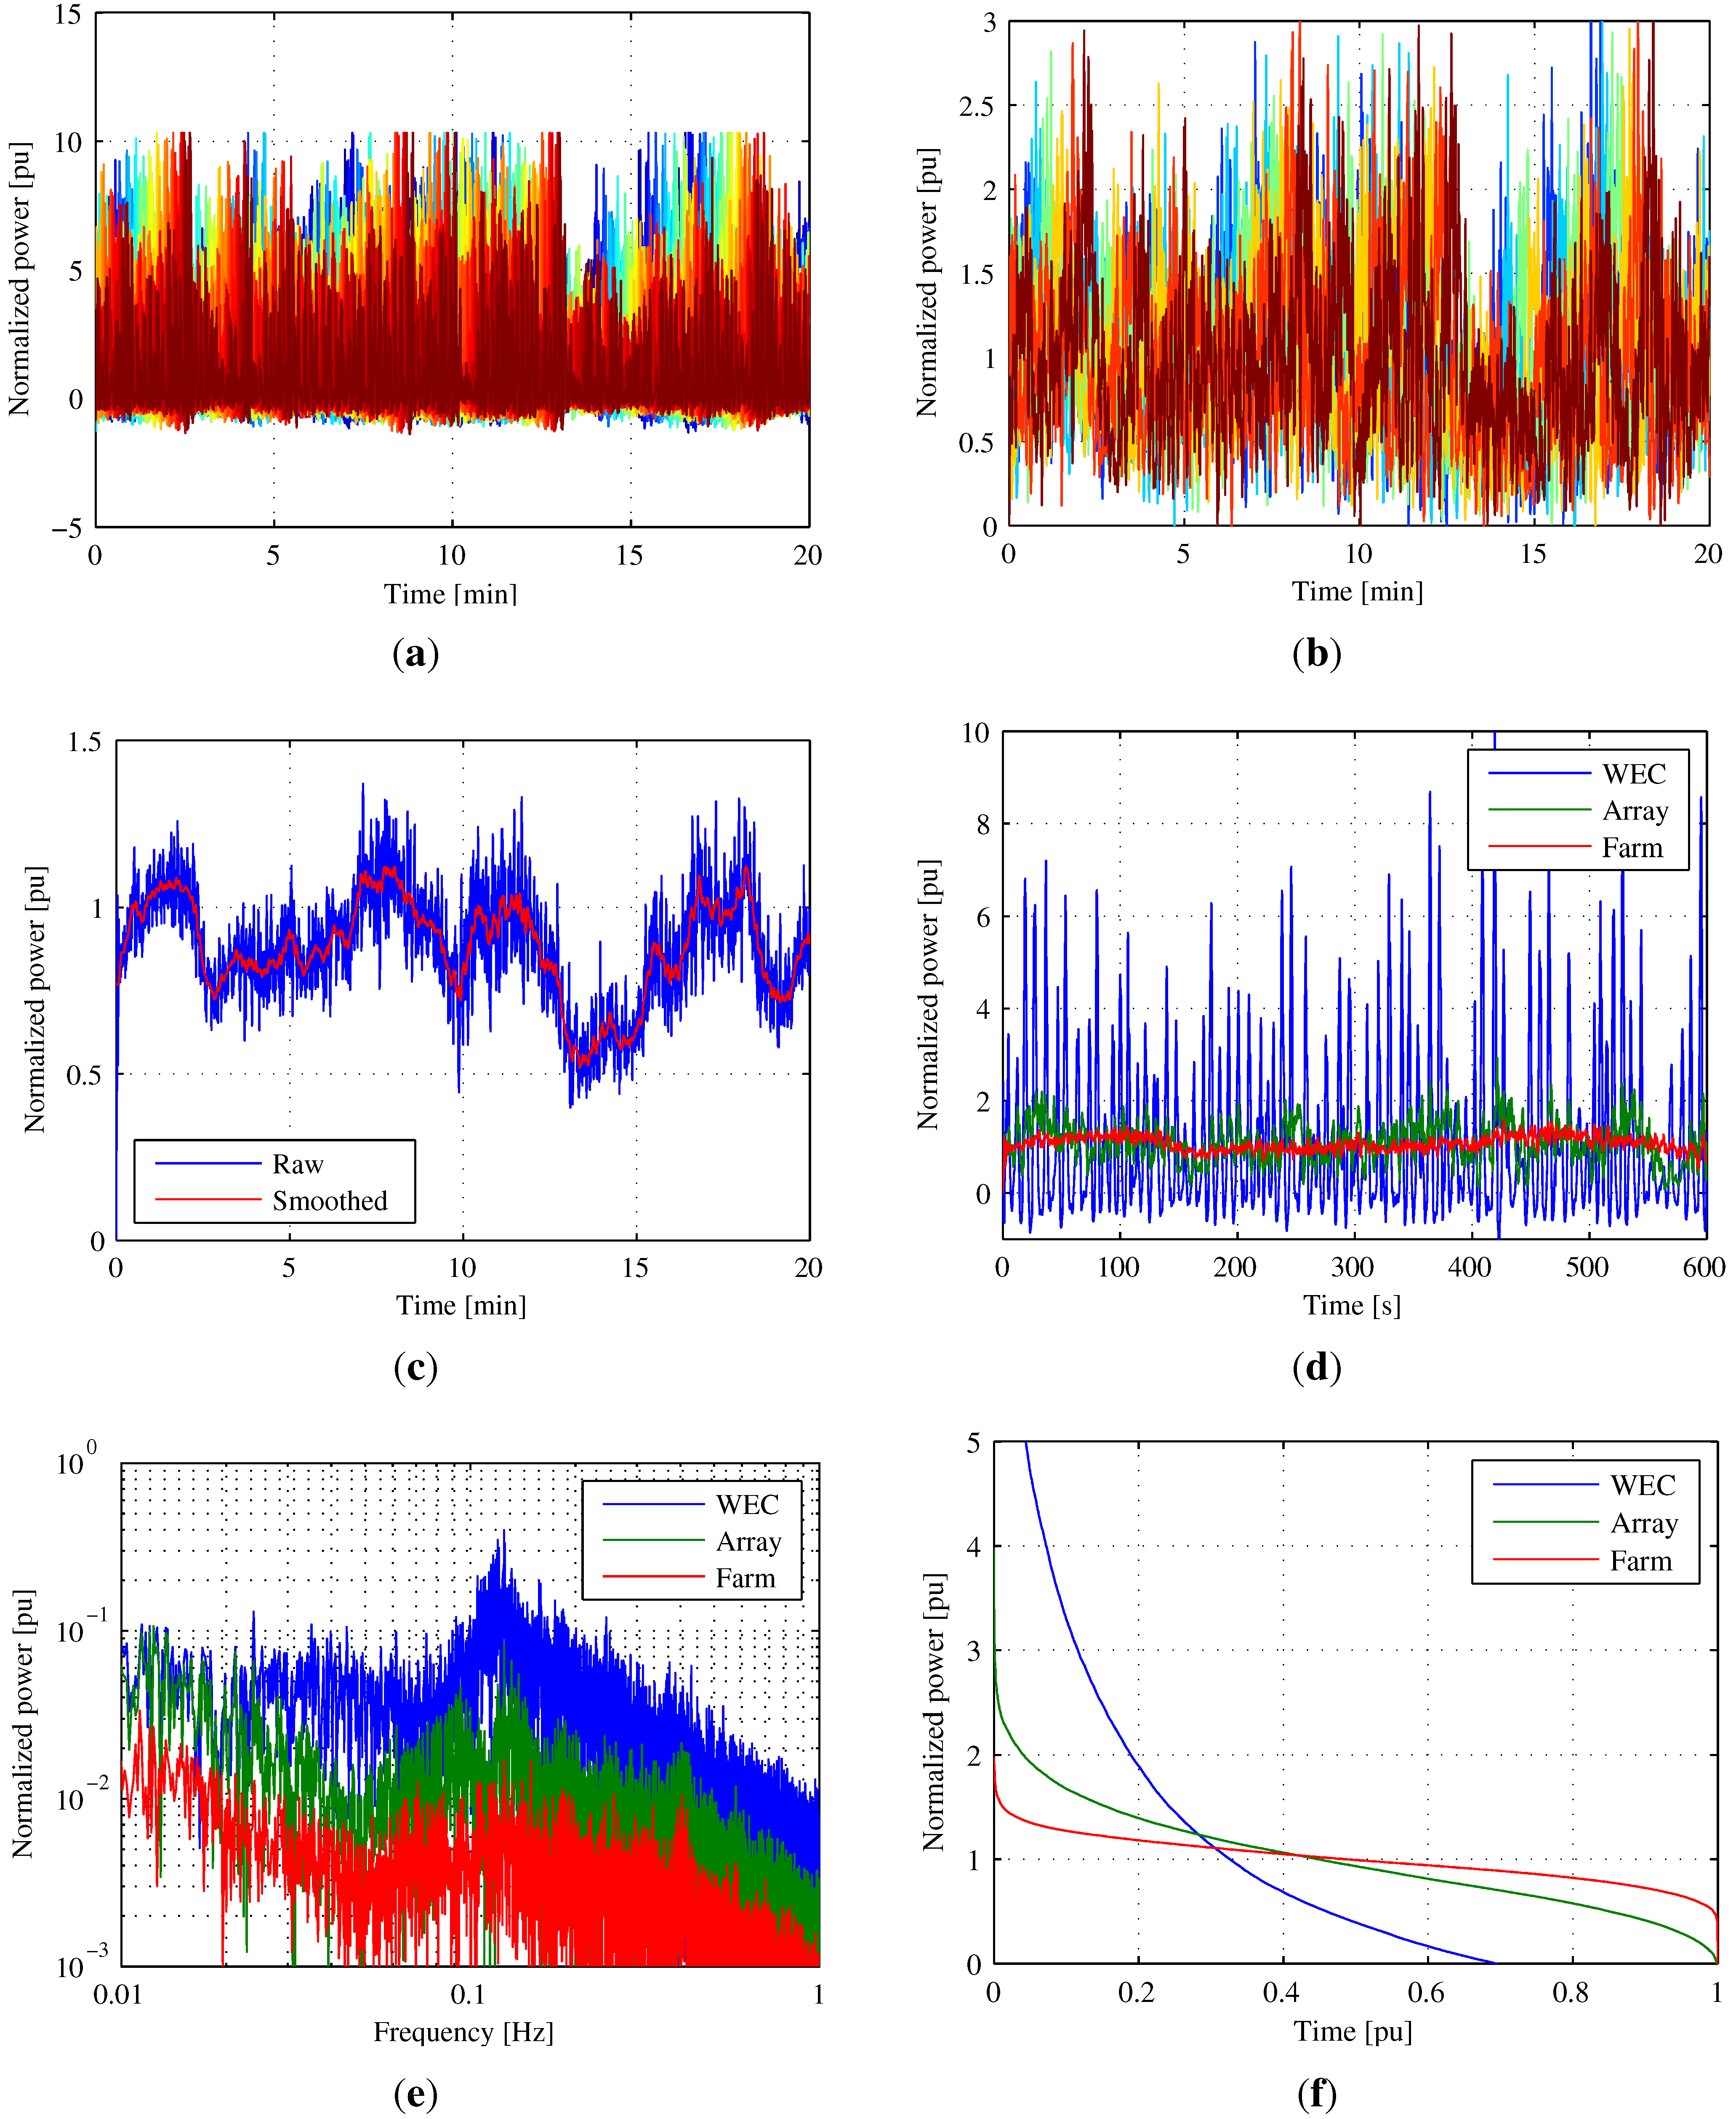
The wave energy farm is simulated for the WEC design wave state, which is defined as 2.75 m significant wave height hs and 6.5 s zero-crossing period Tz. Production from each of the 48 WECs is simulated for the same 20 minute window, and the actual power output from each WEC is stored. Figure 12(a) shows the simulated raw output power from each of the 48 WECs. The power from each absorber is individually colored with a rainbow color map, and the power scale is normalized to rated average output power for one WEC. The plot illustrates the time-shifting effect of the power peaks as the waves propagate through the array. It also clearly shows the lack of power smoothing as the wave trains passes through the farm in that the power peaks do not reach maximum power for some portion of the time.
By adding up the power from each WEC according to the array and farm configuration, the aggregated power from each of the six arrays is calculated and plotted in Figure 12(b) by applying the same plot method as in the previous figure. The plot demonstrates the improvement in power quality as the power fluctuations within a single wave is smoothed out with a reduction in peak-to-average ratio from ten to three. As the rated capacity of an inverter may be exceeded for short periods, an array inverter with double power capacity of the rated power is likely to suffice. Still, this will require a converter with twice the cost compared to an average exported power, and measures to further improve the power quality should be kept in mind. Our previously published paper [14] indicates a final peak-to-average ratio for the array between 1.5 and 3 after energy storage is included, the exact figure being a result of economic optimization.
Figure 12.
Simulation results. All values are normalized to the average output power of the unit (WEC/array/farm). (a) Individual power output from all 48 WECs; (b) Aggregated power output from each of the six arrays; (c) Aggregated power output from the entire wave farm. The red curve shows the output power smoothed with a 10-second low pass filter; (d) Illustration of the power quality improvement as the power is aggregated in the farm; (e) Output power in frequency domain; (f) Output power distribution.

The total aggregate wave farm power is calculated by adding up the six array outputs. The result is plotted in Figure 12(c) and shows a further improvement of power quality. The resulting peak-to-average power ratio is 1.56 in this case, which is higher than the target of 1.25. However, it can be seen that there is a high frequency distortion on the power signal that seems to relate directly to the wave fluctuations from the WECs. These rapid fluctuations can be filtered down quite easily with a small energy storage, and the red curve in Figure 12(c) shows the total farm output power smoothed with a 10-second filter. In this case, the peak-to-average ratio is reduced to a healthy 1.28, which is regarded as satisfactory. At this level, almost the whole of the installed conversion and transfer capacity can be utilized with negligible cost impact due to reduced power quality. The calculated rms value of the output power is only 1.63% higher than the average power.
In Figure 12(d) a power time series from WEC, array and farm are plotted together to illustrate the power quality improvement as power is aggregated. The power in each case is normalized to the rated power of the unit. A small energy storage seems favorable given the high fluctuations still present on the farm power output, but it is not necessarily required to be located in the farm connection point. If distributed energy storages were instead installed on each of the arrays, and controlled or tuned to compensate the aggregated fluctuations on the farm output, the energy storage could serve dual purposes by also reducing the array peak-to-average power, which would further improve the power quality before transformation to AC. This may save the expensive converter capacity and must be subjected to detailed economical investigation.
To investigate further the frequency components causing the fluctuations, a frequency analysis of the output power was performed. Figure 12(e) shows the result of a fast Fourier transform (FFT) analysis during the different power stages. Power is normalized to rated output for each stage. In general, the figure shows the expected characteristics with a decreasing level of distortion as power is aggregated. The peak of the spectrum coincides well with the wave period, and it can be seen how the farm has high attenuation at 0.1 Hz and significantly lower attenuation at 0.01 Hz in comparison with the WEC. The local minimum observed at 0.05 Hz on both the farm output and the array output is expected to be caused by low excitation in combination with good attenuation at this frequency. The frequency plot can serve as a powerful tool when optimizing the farm layout.
As an illustration of the utilization of installed power capacity, Figure 12(f) shows the power/time distributions at the three farm levels. The plot is created by sorting all the points in Figure 12(d) in descending order. This plot is an effective tool for optimizing the the power components in the power transfer chain as it visualizes the energy that is produced on various power levels. For instance, it shows that both the array and the farm output have steep inclines close to the y-axis. The allowed peak power of the power transfer equipment can be drawn as horizontal lines on the plot. The area between output power line and the horizontal line will then represent lost power due to the transfer capacity deficit, while the area below the horizontal line represents the power that can be transferred. For instance, it can be seen directly from the figure that the array peak-to-average transfer capacity can be reduced from 2.5 to 2.0 with only a small energy sacrifice. As these curves currently represent only one wave state, they should be used with care. When a complete analysis is performed, these data serve as valuable inputs to the economical cost model.
Thus far, the analysis has only been performed for the design wave state, and for the optimal wave direction. A complete analysis should be performed, taking into account all sea states and directions encountered throughout a year to find the annual produced energy with the given system configuration. The smoothing effects will be less efficient from unfavorable wave directions and will cause higher peak production than the installed capacity. This is not a problem in and of itself, but will force the WECs to hold back production and exporting less power due to the downstream restrictions. A thorough analysis with annual data will show the exact amount of power shedding and give a good basis for detailed scaling of the power components. However, based on experience from our previous work [13], and given the strong directionality at the Wavehub site, which is the basis of this work, it is believed that the current findings are realistic and only require minor adjustments after a comprehensive analysis.
5. Conclusions
This work shows that a wave energy farm can be grid connected with adequate power quality and good utilization of installed transfer capacity without major power conditioning components. The power transfer chain is believed to be economically efficient, although some components within the wave farm require significant over-capacity. Earlier studies of annual power have shown annual full-load export capacity of approximately 3500 hours per year [14], and with the improvements that the farm configuration brings, it is believed that an annual full-load export capacity of more than 4000 hours per year will be attainable. This is better than land-based wind turbines which, on average, provide approximately 2500 full-load hours per year [20], and is believed to be competitive with offshore wind farms. This analysis has been performed only on the most dominant wave state, and therefore future work should involve a complete study based on the annual wave climate.
Acknowledgment
We would like to thank the Norwegian Research Council, whose funding for the industrial PhD project of Jonas Sjolte made it possible to publish this work.
References
- Tissandier, J.; Babarit, A.; Clement, A. Study of the Smoothing Effect on the Power Production in an Array of SEAREV Wave Energy Converters. In Proceedings of the Eighteenth International Offshore and Polar Engineering Conference, Vancouver, BC, Canada, 6–11 July 2008.
- Kavanagh, D.; Keane, A.; Flynn, D. Challenges Posed by the Integration of Wave Power onto the Irish Power System. In Proceedings of the 9th European Wave and Tidal Energy Conference, Southampton, UK, 5–9 September 2011.
- Blavette, A.; O’Sullivan, D.; Lewis, A.; Egan, M. Impact of a Wave Farm on Its Local Grid: Voltage Limits, Flicker Level and Power Fluctuations. In Proceedings of the OCEANS Conference, Yeosu, Korea, 21–24 May 2012.
- Salter, S.H. World progress in wave energy 1988. Int. J. Ambient Energy 1989, 10, 3–24. [Google Scholar] [CrossRef]
- Bjerke, I.; Hjetland, E.; Tjensvoll, G.; Sjolte, J. Experiences from Field Testing with the BOLT Wave Energy Converter. In Proceedings of the 9th European Wave and Tidal Energy Conference (EWTEC11), Southampton, UK, 5–9 September 2011.
- Pitt, E.G. The wave power climate at the Wave Hub site. Appl. Wave Res. Rev. Wave Power Clim. 2006. Available online: http://ebookbrowse.com/november-2006-applied-wave-research-review-of-wave-power-climate-pdf-d256126921 (accessed on 26 March 2013).
- Falnes, J.; Lillebrekken, P.M. Budal’s Latching-controlled-buoy Type Wave-power Plant. In Proceedings of the 5th European Wave Energy Conference, Cork, Ireland, 17–20 September 2003.
- Falnes, J.; Hals, J. Heaving buoys, point absorbers and arrays. Philos. Trans. R. Soc. Math. Phys. Eng. Sci. 2012, 370, 246–277. [Google Scholar] [CrossRef]
- Falnes, J. Ocean Waves and Oscillating Systems: Linear Interactions Including Wave-Energy Extraction; Cambridge University Press: Cambridge, UK, 2002. [Google Scholar]
- Sjolte, J.; Bjerke, I.; Crozier, A.; Tjensvoll, G.; Molinas, M. All-Electric Wave Energy Converter with Stand-alone 600VDC Power System and Ultracapacitor Bank. In Proceedings of the 2012 EVER International Conference and Exhibition on Ecological Vehicles and Renewable Energies, Monte Carlo, Monaco, 22–25 March 2012.
- Sjolte, J.; Bjerke, I.; Crozier, A.; Tjensvoll, G.; Molinas, M. All-electric Wave Energy Power Take Off System with Improved Power Quality at the Grid Connection Point. In Proceedings of the Transmission and Distribution Conference and Exposition (T D) 2012, Orlando, FL, USA, 7–10 May 2012; pp. 1–7.
- Sjolte, J.; Tjensvoll, G.; Molinas, M. All-electric Wave Energy Converter Connected in Array with Common DC-link for Improved Power Quality. In Proceedings of 2012 3rd IEEE International Symposium on Power Electronics for Distributed Generation Systems (PEDG), Aalborg, Denmark, 25–28 June 2012; pp. 431–436.
- Sjolte, J.; Tjensvoll, G.; Molinas, M. Annual Energy and Power Quality from an All-Electric Wave Energy Converter Array. In Proceedings of the European Power Electronics and Motion Control and Applications Conference (EPE-PEMC’12), Novi Sad, Serbia, 4–6 September 2012.
- Sjolte, J.; Tjensvoll, G.; Molinas, M. All-electric Wave Energy Converter Array with Energy Storage and Reactive Power Compensation for Improved Power Quality. In Proceedings of the Energy Conversion Congress and Exposition (ECCE), 2012 IEEE, Raleigh, NC, USA, 15–20 September 2012; pp. 954–961.
- Molinas, M.; Skjervheim, O.; Andreasen, P.; Undeland, T.; Hals, J.; Moan, T.; Sorby, B. Power Electroncis as Grid Interface for Actively Controlled Wave Energy Converters. In Proceedings of the International Conference on Clean Energy Power (ICCEP07), Capri, Italy, 21–23 May 2007.
- Skjervheim, O.; Sorby, B.; Molinas, M. All Electric Power Take Off for a Direct Coupled Point Absorber. In Proceedings of the 2nd International Conference on Ocean Energy (ICOE2008), Brest, France, 15-17 October 2008.
- Sjolte, J.; Bjerke, I.; Hjetland, E.; Tjensvoll, G. All-Electric Wave Energy Power Take Off Generator Optimized by High Overspeed. In Proceedings of the 9th European Wave and Tidal Energy Conference, Southampton, UK, 5–9 September 2011.
- Joint North Sea Wave Observation Project (JONSWAP). Available online: http://www.wikiwaves.org/Ocean-Wave_Spectra (accessed on 26 Mar 2013).
- Newman, J. Marine Hydrodynamics; MIT Press: Cambridge, MA, USA, 1977. [Google Scholar]
- Table of capacity factors for various sources of power generation. Available online: http://en.wikipedia.org/wiki/Capacity_factor (accessed on 26 Mar 2013).
© 2013 by the authors; licensee MDPI, Basel, Switzerland. This article is an open access article distributed under the terms and conditions of the Creative Commons Attribution license (http://creativecommons.org/licenses/by/3.0/).
Share and Cite
MDPI and ACS Style
Sjolte, J.; Tjensvoll, G.; Molinas, M. Power Collection from Wave Energy Farms. Appl. Sci. 2013, 3, 420-436. https://doi.org/10.3390/app3020420
AMA Style
Sjolte J, Tjensvoll G, Molinas M. Power Collection from Wave Energy Farms. Applied Sciences. 2013; 3(2):420-436. https://doi.org/10.3390/app3020420
Chicago/Turabian StyleSjolte, Jonas, Gaute Tjensvoll, and Marta Molinas. 2013. "Power Collection from Wave Energy Farms" Applied Sciences 3, no. 2: 420-436. https://doi.org/10.3390/app3020420