1. Introduction
Due to their optimum dielectric, piezoelectric and ferroelectric response, lead-free based electroceramics have been proposed as an alternative to Pb(Zr
1−xTi
x)O
3 (PZT). In particular, Ba
1−xCa
xT
1−yZr
yO
3 (BCTZ) solid solution shows a phase diagram similar to PZT systems with a morphotropic phase boundary (MPB) responsible for its high electrical performance. The coalescence of two ferroelectric phases lowers down the energy barrier between them, facilitating the rotation grade of the polarization vector [
1]. For this reason, several researchers have focused their attention on modifying the chemical composition [
2,
3,
4,
5] or synthesis conditions [
6,
7,
8] for maximizing their electrical properties.
For high-temperature conditions (
T >
TC), a systematic study of the electrical behavior for BCTZ has not been presented. Moreover, the influence that Ca
2+ doping has over dielectric conditions and the associated conduction mechanism has not fully been explained. In order to investigate ceramic relaxation phenomena and structural features related to conduction mechanisms, impedance spectroscopy (IS) arises as an efficient technique [
9].
The dielectric process, in polycrystalline materials, involves the movement of electric carriers. Therefore, it is important to separate between the different responsible microstructural regions. To characterize the microstructure of the material, IS measurements are made over a wide range of frequencies to distinguish between different regions [
10,
11,
12]: grains, grain boundary, sample/electrode interface, etc. Using a variable-frequency measurement, regardless the nature of the material under study, the analysis of the alternating current (AC) data requires considerable care in order to (a) assign the different electrical impedances to the appropriate regions of the sample and (b) extract the maximum amount of useful information from the data available [
13]. This is how experimental information obtained is represented by appropriate equivalent circuits, useful for determining component resistance and capacitance parameters.
In the present work the influence of Ca2+ on the structure and phase transition behavior was studied. The effect of the microstructure on the dielectric and conduction characteristics was analyzed. Finally, the dielectric relaxation and activation energy was calculated for thermally activated electrical processes.
2. Materials and Methods
Ba1−xCaxTi0.9Zr0.1O3 solid solutions (x = 0.10, 0.15, 0.18) were prepared by conventional solid state method. BaCO3 (99.0%, Analytyca, Monterrey, Mexico), CaCO3 (99.0%, Fluka, Seelze, Germany), TiO2 (99.0%, Aldrich, St. Louis, MO, USA) and ZrO2 (99.0%, Riedel-deHaën, Seelze, Germany) were used as starting materials. Reagents were dried at 200 °C for 2 h, weighted according to the stoichiometry ratio and mixed for 30 min in an agate mortar using acetone. Afterwards, the mixture was calcined at 1250 °C for 2 h, followed by a ball-milling process (product ground by zirconia balls using ethanol as grinding media for 24 h). Finally, powders were uniaxially pressed into pellets (~13.0 mm diameter; ~1.5 mm thickness, 40 MPa) and sintered at 1400 °C for 2 h in air.
Phase structure of BCTZ ceramics was identified using X-ray diffraction (D-8 Advance, Bruker Co., Billerica, MA, USA) with Cu Kα radiation, 0.016° step size (2θ) and 1 s of integration time. The microstructure of samples was analyzed by field emission scanning electron microscope (JSM-7600F, JEOL, Peabody, MA, USA). The EDS spectra were recorded with an INCA X-ray microanalysis system (EDX, Oxford Instruments plc., Oxfordshire, UK). Average grain size of a large sample area was determined using a computer-aided image analysis (ImageJ software, National Institutes of Health (NIH), Bethesda, MD, USA).
To measure electrical properties, sintered samples were polished and coated on both sides with gold tincture and fired at 700 °C for 30 min to form electrodes.
Temperature-dependent dielectric permittivity and losses were performed with a precision impedance analyzer Agilent 4294A (Keysight Tech. Inc., Santa Rosa, CA, USA). Complex impedance measures were achieved with an impedance gain/phase analyzer SI 1260 (Solartron Analytical, Hampshire, UK) connected to a dielectric interface 1296 (Solartron Analytical). Experiments were completed using a computer-controlled temperature furnace 47760 (Thermo Fisher Scientific Inc., Waltham, MA, USA) evaluating from 30 °C to 700 °C. The impedance fitting analysis was performed using ZView software (ver. 3.2c Scribner Associates, Inc., Southern Pines, NC, USA).
3. Results and Discussion
3.1. Structural and Microstructural Results
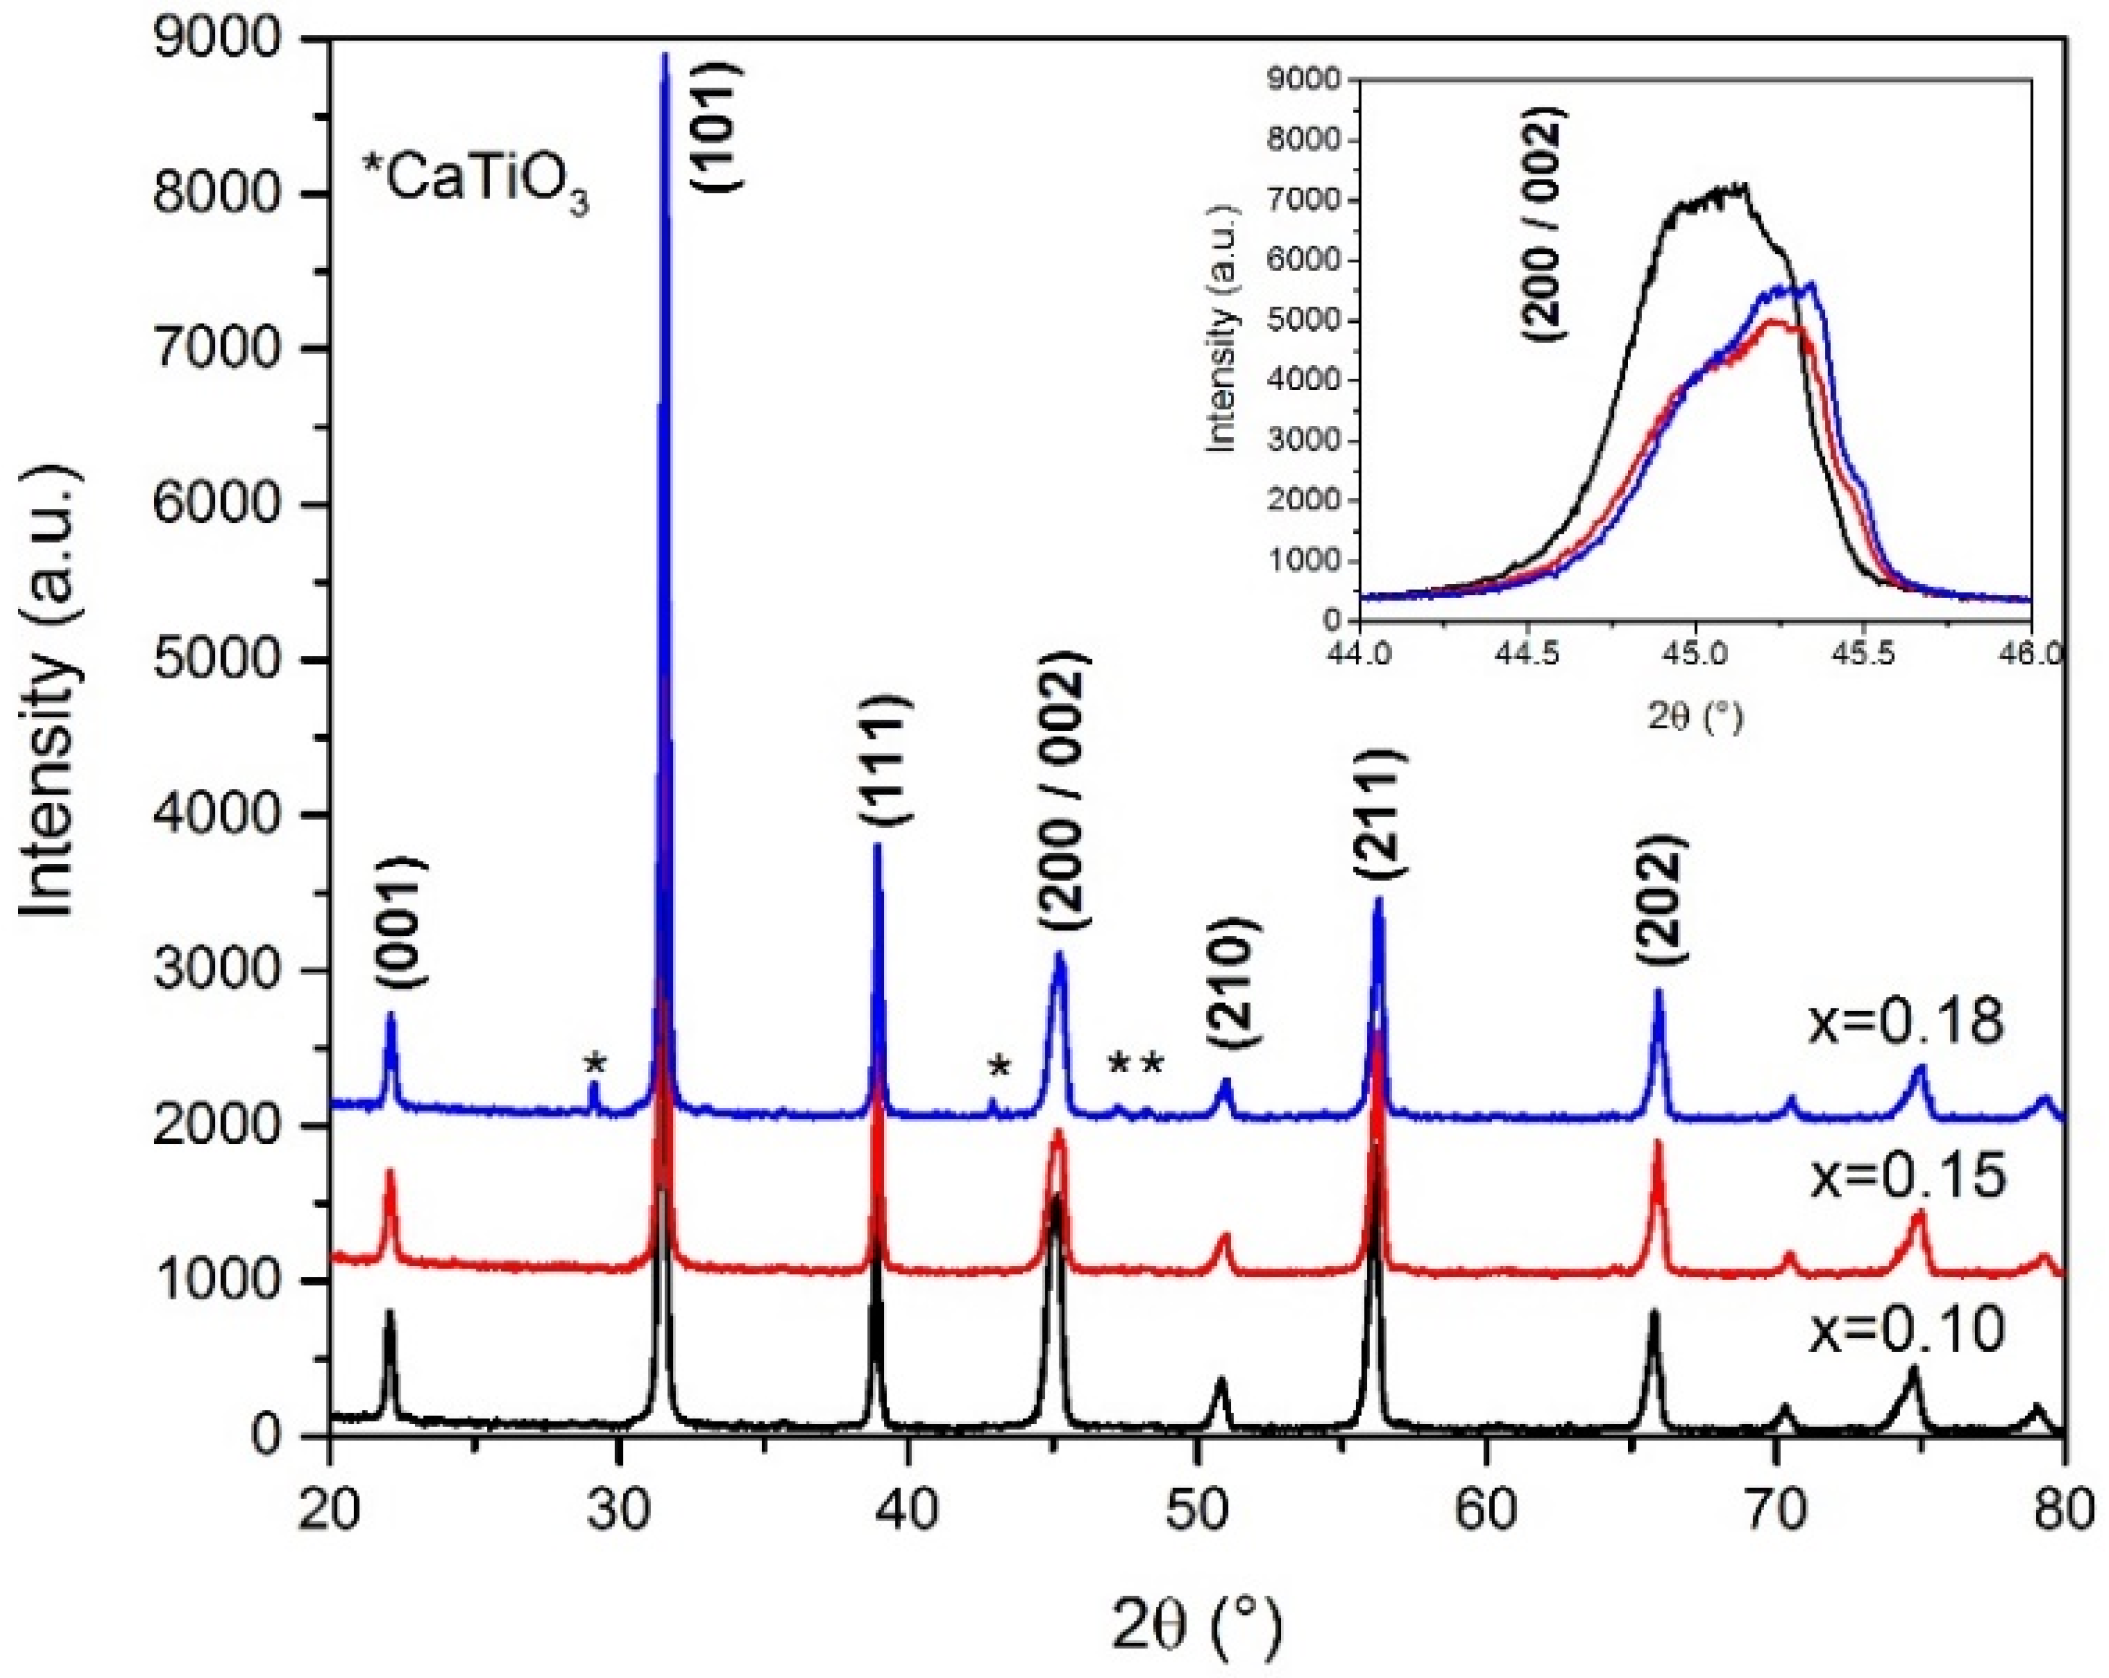
The XRD patterns for BCTZ (
x = 0.10, 0.15, 0.18) sintered samples are shown in
Figure 1. All compositions exhibited a perovskite-type structure. For
x = 0.18, a secondary phase of CaTiO
3 was detected. The XRD patterns indicate that Ca
2+ and Zr
4+ ions were incorporated completely into the BaTiO
3 lattice (for
x = 0.10 and 0.15 compositions) to form a solid solution.
A fine-scanning XRD pattern in the 2θ range of 44°–46° (inset
Figure 1) was performed to determine the dependence of the phase structure. A rhombohedral structure with a single (200) peak at 45° was revealed. A further increase in the
x content was followed by a pronounced splitting of the (002) peak from the (200) peak, demonstrating a phase transition from rhombohedral to tetragonal phases [
14]. The CaTiO
3 secondary phase (PDF#042-0423) was detected for
x = 0.18. It was speculated that the rhombohedral and tetragonal phases may coexist in the composition range of 0.10 ≤
x ≤ 0.20, and consequently, there exists a temperature-independent morphotropic phase boundary (MPB) [
15]. The presence of a MPB enhances the electrical performance of BCTZ electroceramics.
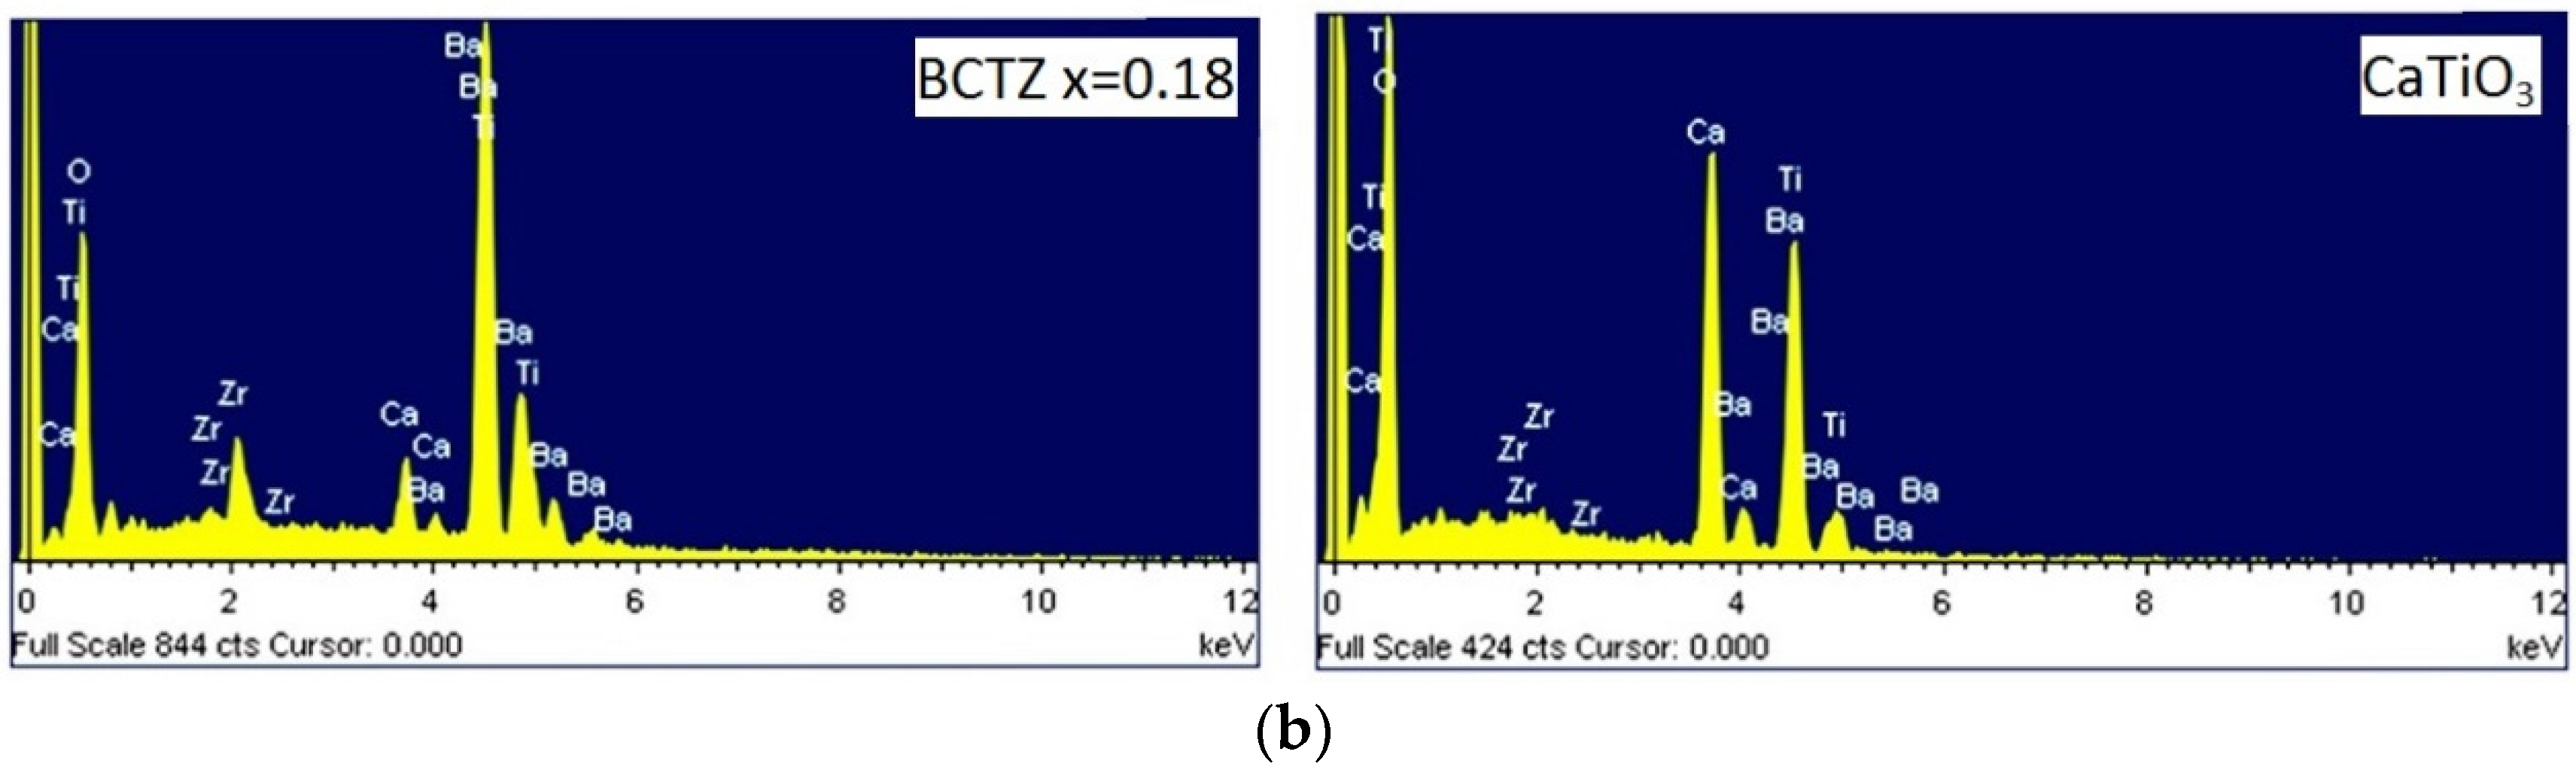
Figure 2a shows the SEM images for sintered pellets at 1400 °C for 2 h with
x = 0.10, 0.15 and 0.18. All ceramics revealed a dense microstructure (≈98%). Increasing the Ca
2+ content at the Ba
2+ sites decreased the average grain size of the ceramic (22.6, 17.9 and 13.3 μm); moreover, as
x = 0.18, the presence of the secondary CaTiO
3 phase was promoted due to the proximity of the solubility limit, as revealed by the XRD analysis.
Figure 2b shows the EDS spectra for the expected cations of BCTZ and CaTiO
3 grains (
x = 0.18 sample).
3.2. Dielectric Analysis
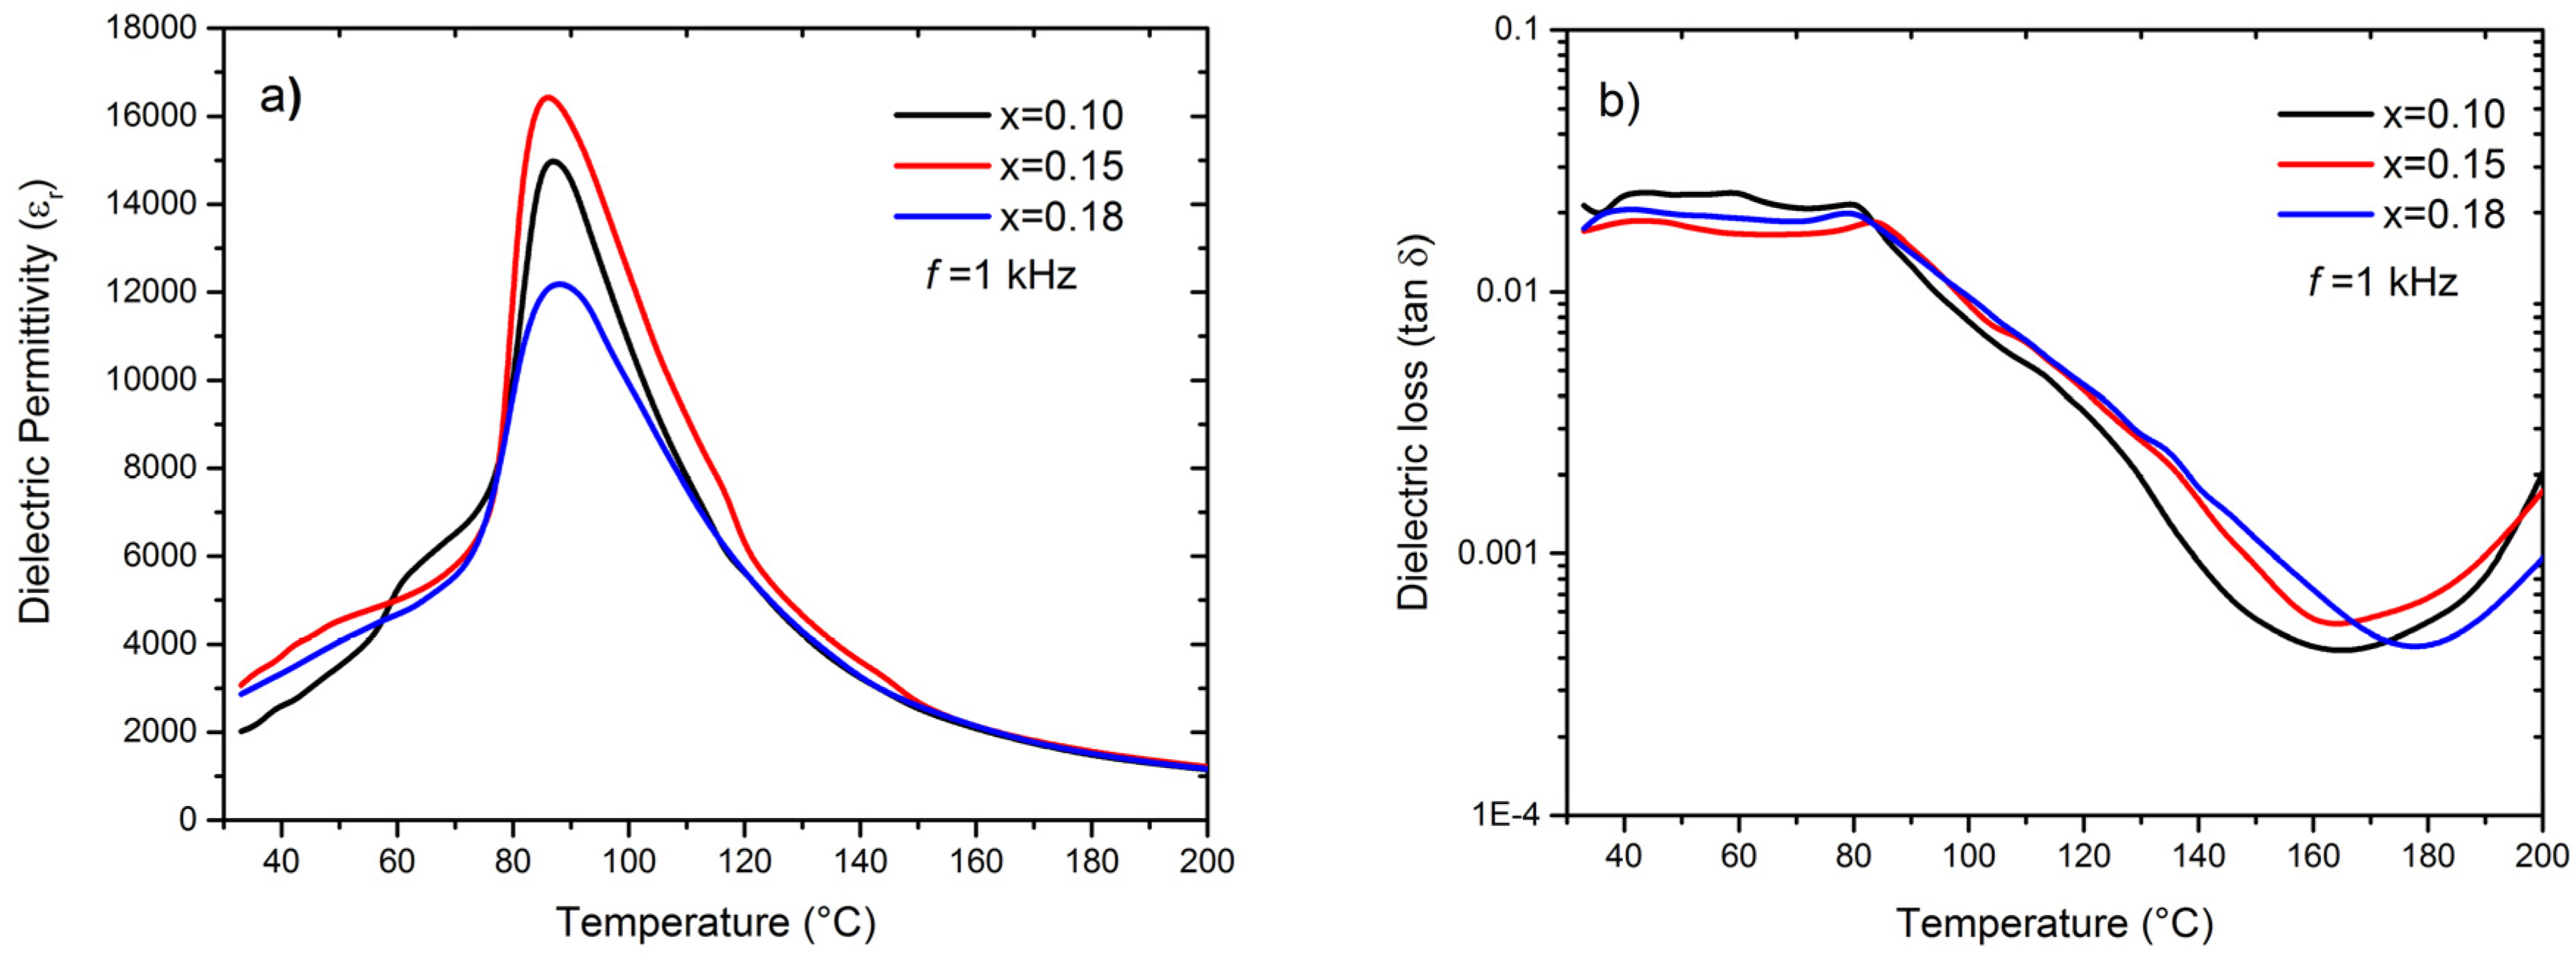
Dielectric permittivity (ε
r) and losses (
tan δ) at (1 kHz), as a function of the Ca
2+ content and temperature, are shown in
Figure 3. Two phase transitions corresponding to rhombohedral-tetragonal (
R-T) and tetragonal-cubic (
T-C) transitions were observed. The increase of the Ca
2+ substitution at the Ba
2+ sites resulted in a displacement, to lower temperatures, of the
R-T phase transition temperature (
TR-T), which was not observable for
x = 0.18. The Ca
2+ addition increases the stability of the temperature range for the tetragonal phase [
16]. Furthermore, the dielectric permittivity reached a maximum at
x = 0.15, promoted by the MPB. This effect led to a higher number of grains that were favorably oriented towards an electric field, and hence, the optimum piezoelectric and ferroelectric performance could be obtained [
1].
The associated physical properties of BCTZ ceramics after
TC are related to relaxation and conductivity processes [
17,
18,
19,
20,
21]. For ferroelectric materials, it is important to perform a complete analysis of their electrical properties to separate different electroactive contributions (grain/bulk and grain boundary) and their frequency/temperature dependence.
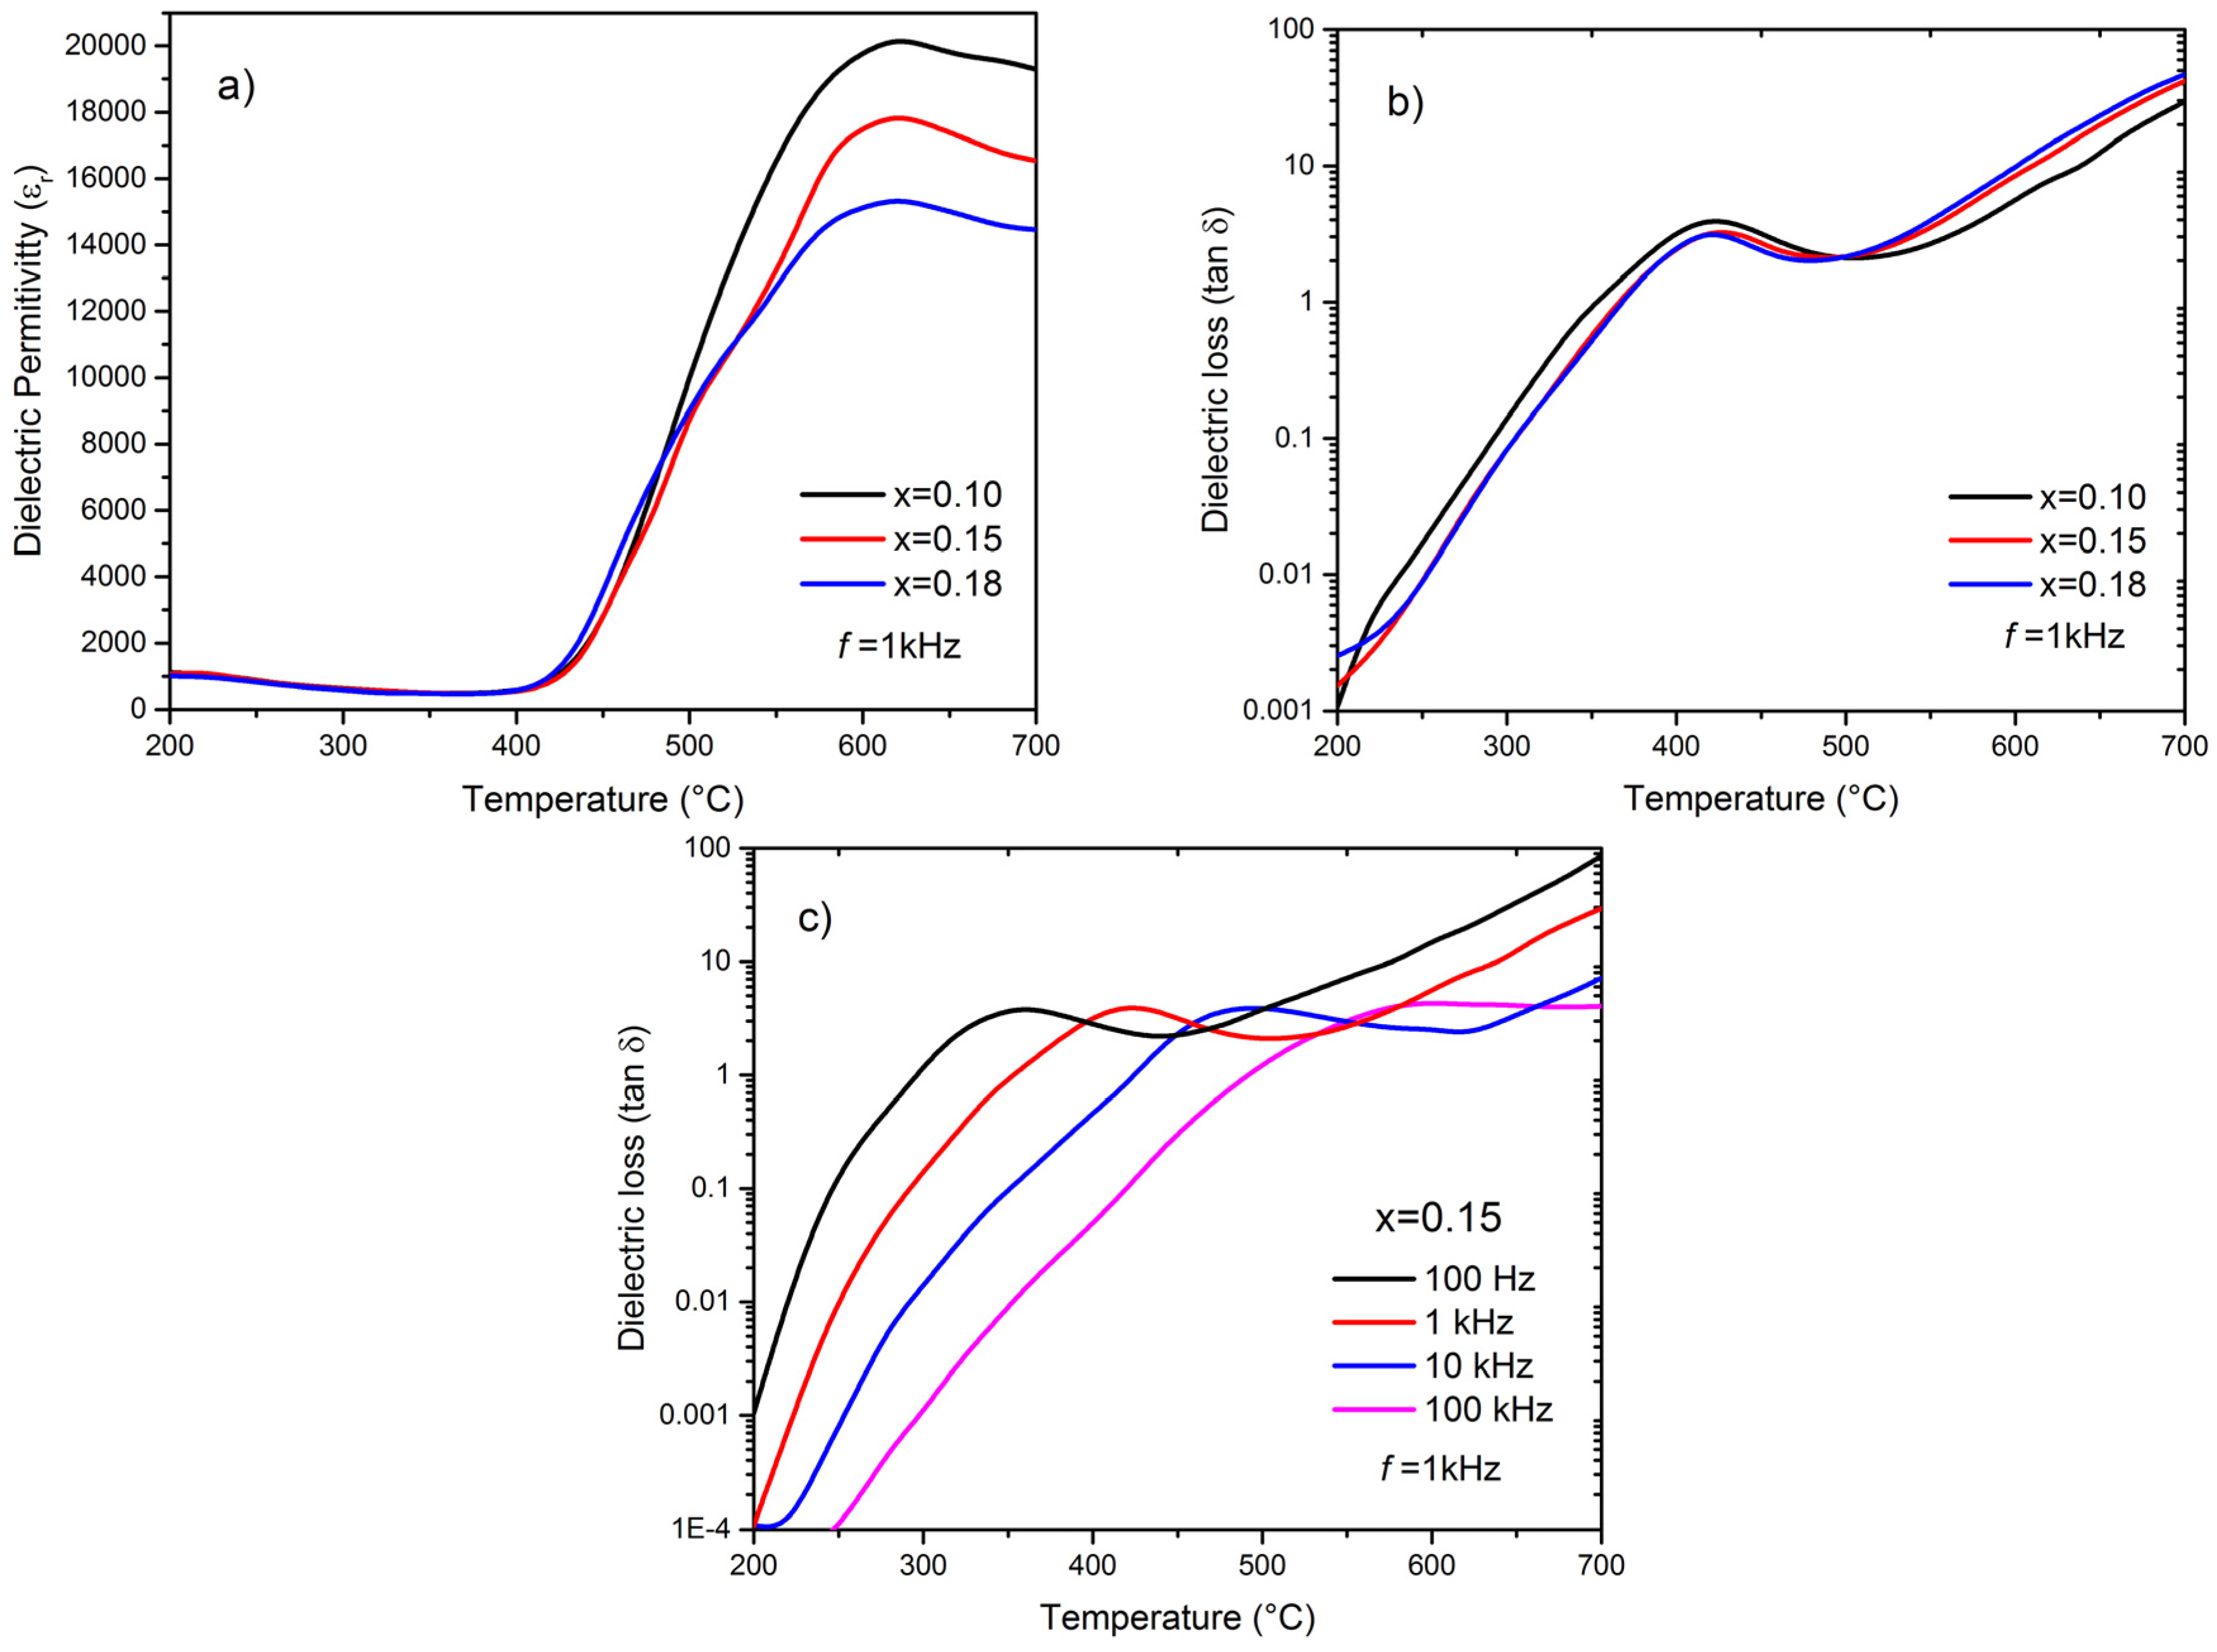
Figure 4b shows a dielectric anomaly (around 400 °C) for
T > TC. Temperatures higher than
TC avoid the influence of ferroelectric domains on the ceramic resistance (conduction) because it is well known that defect dipoles and charged species are located at the domain walls [
22], which aid the bulk (grain) conduction [
11,
22].
Despite Ca
2+ content increases, the dielectric permittivity and losses remained constant for all compositions. Furthermore, Ca
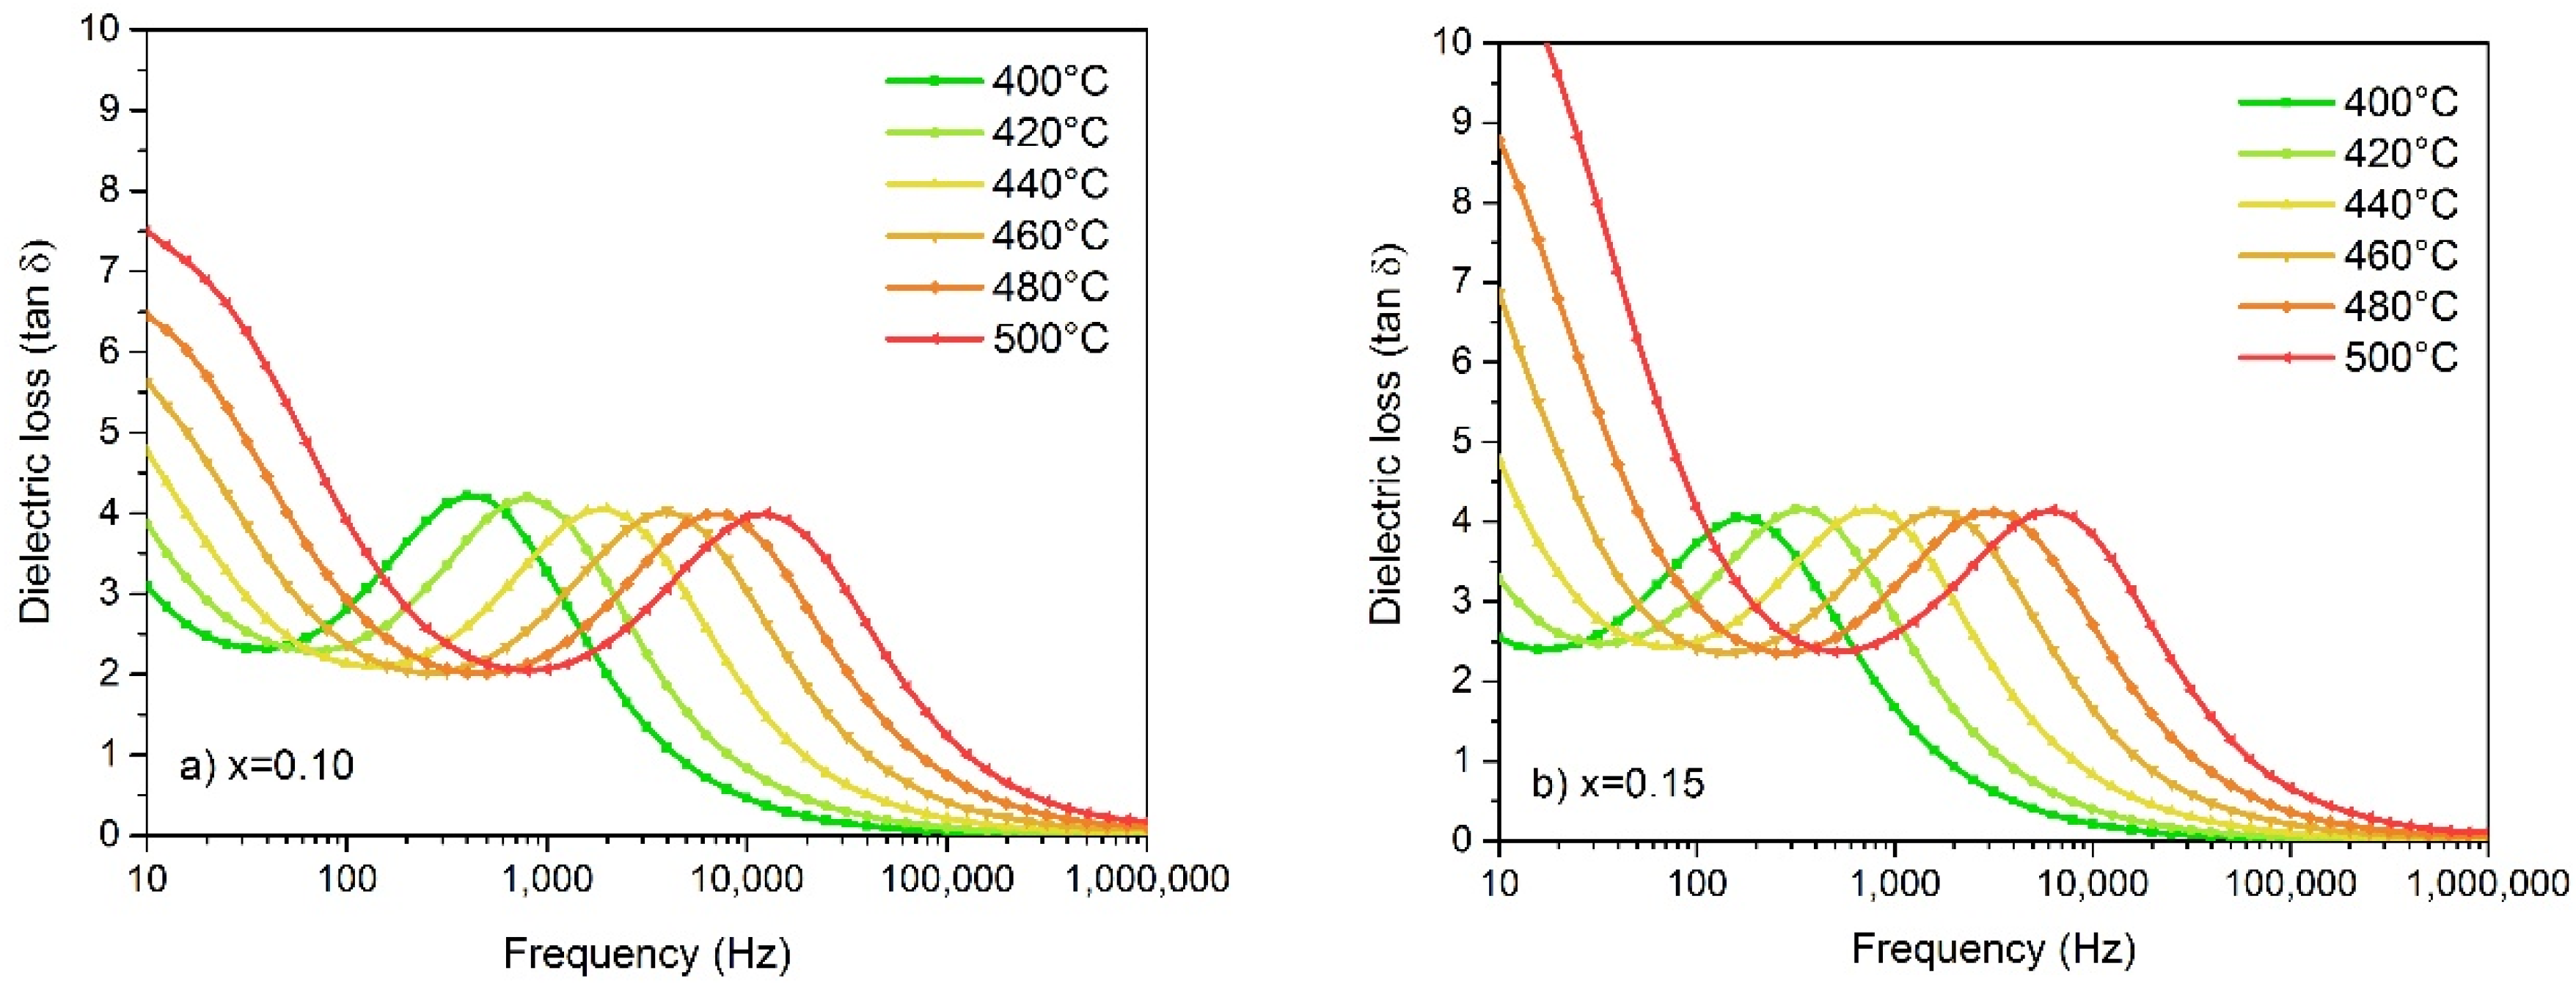
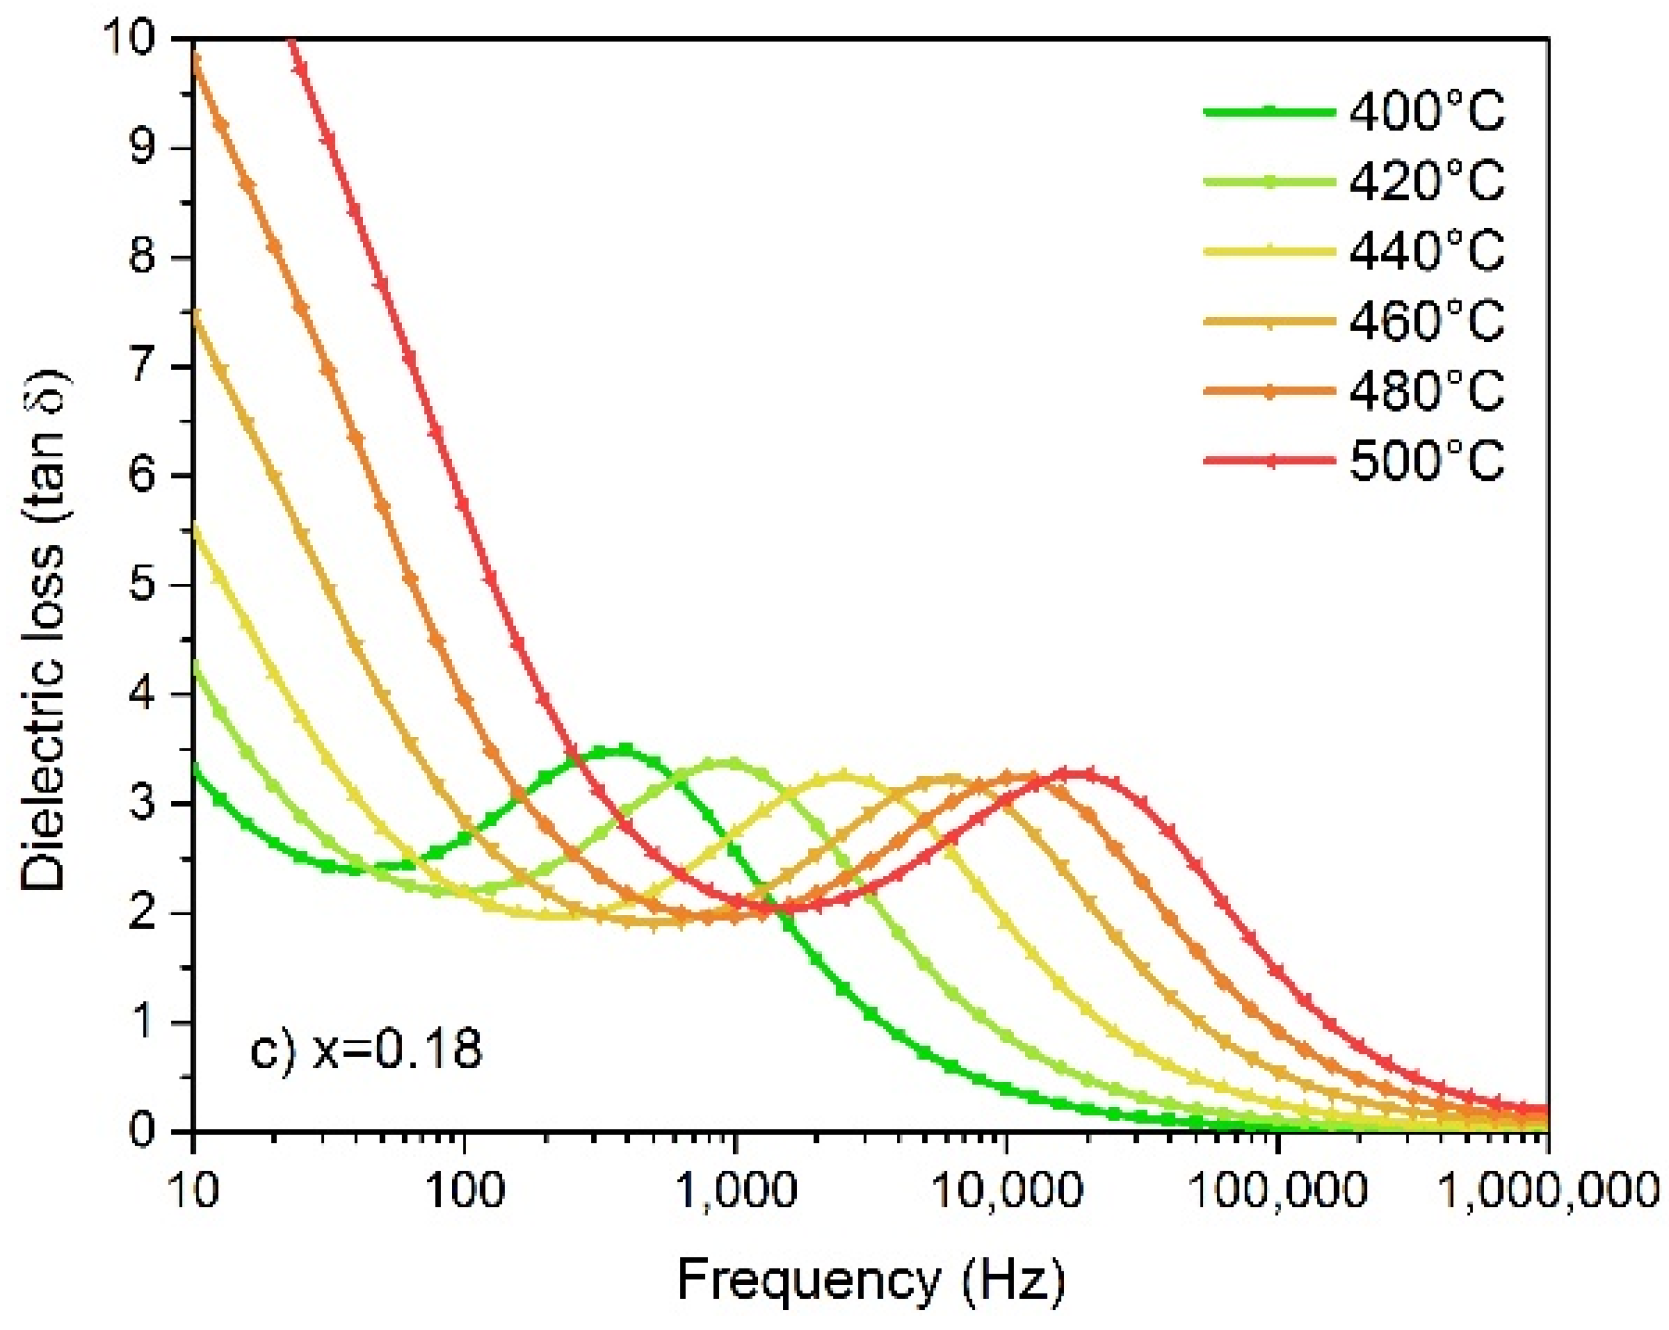
2+ content shifted the permittivity maxima to lower dielectric values at higher temperatures (around 600 °C). More conveniently seen from the dielectric loss (
tan δ), the dielectric anomaly was associated with a process of relaxation [
17]: loss peaks shifted toward higher temperatures with an increase in the frequency (
Figure 4c).
For the analysis of BCTZ
x = 0.15, wide relaxation peaks were overlapped in a large frequency-dependent range and shifted to higher frequency as the temperature increased. This phenomenon indicates that the dielectric loss peak is related to a thermally activated relaxation process [
17]. Moreover, as the Ca
2+ content increased, the amplitude of the dielectric loss peak decreased, indicating a low activity in the same range of frequencies (
Figure 5a–c).
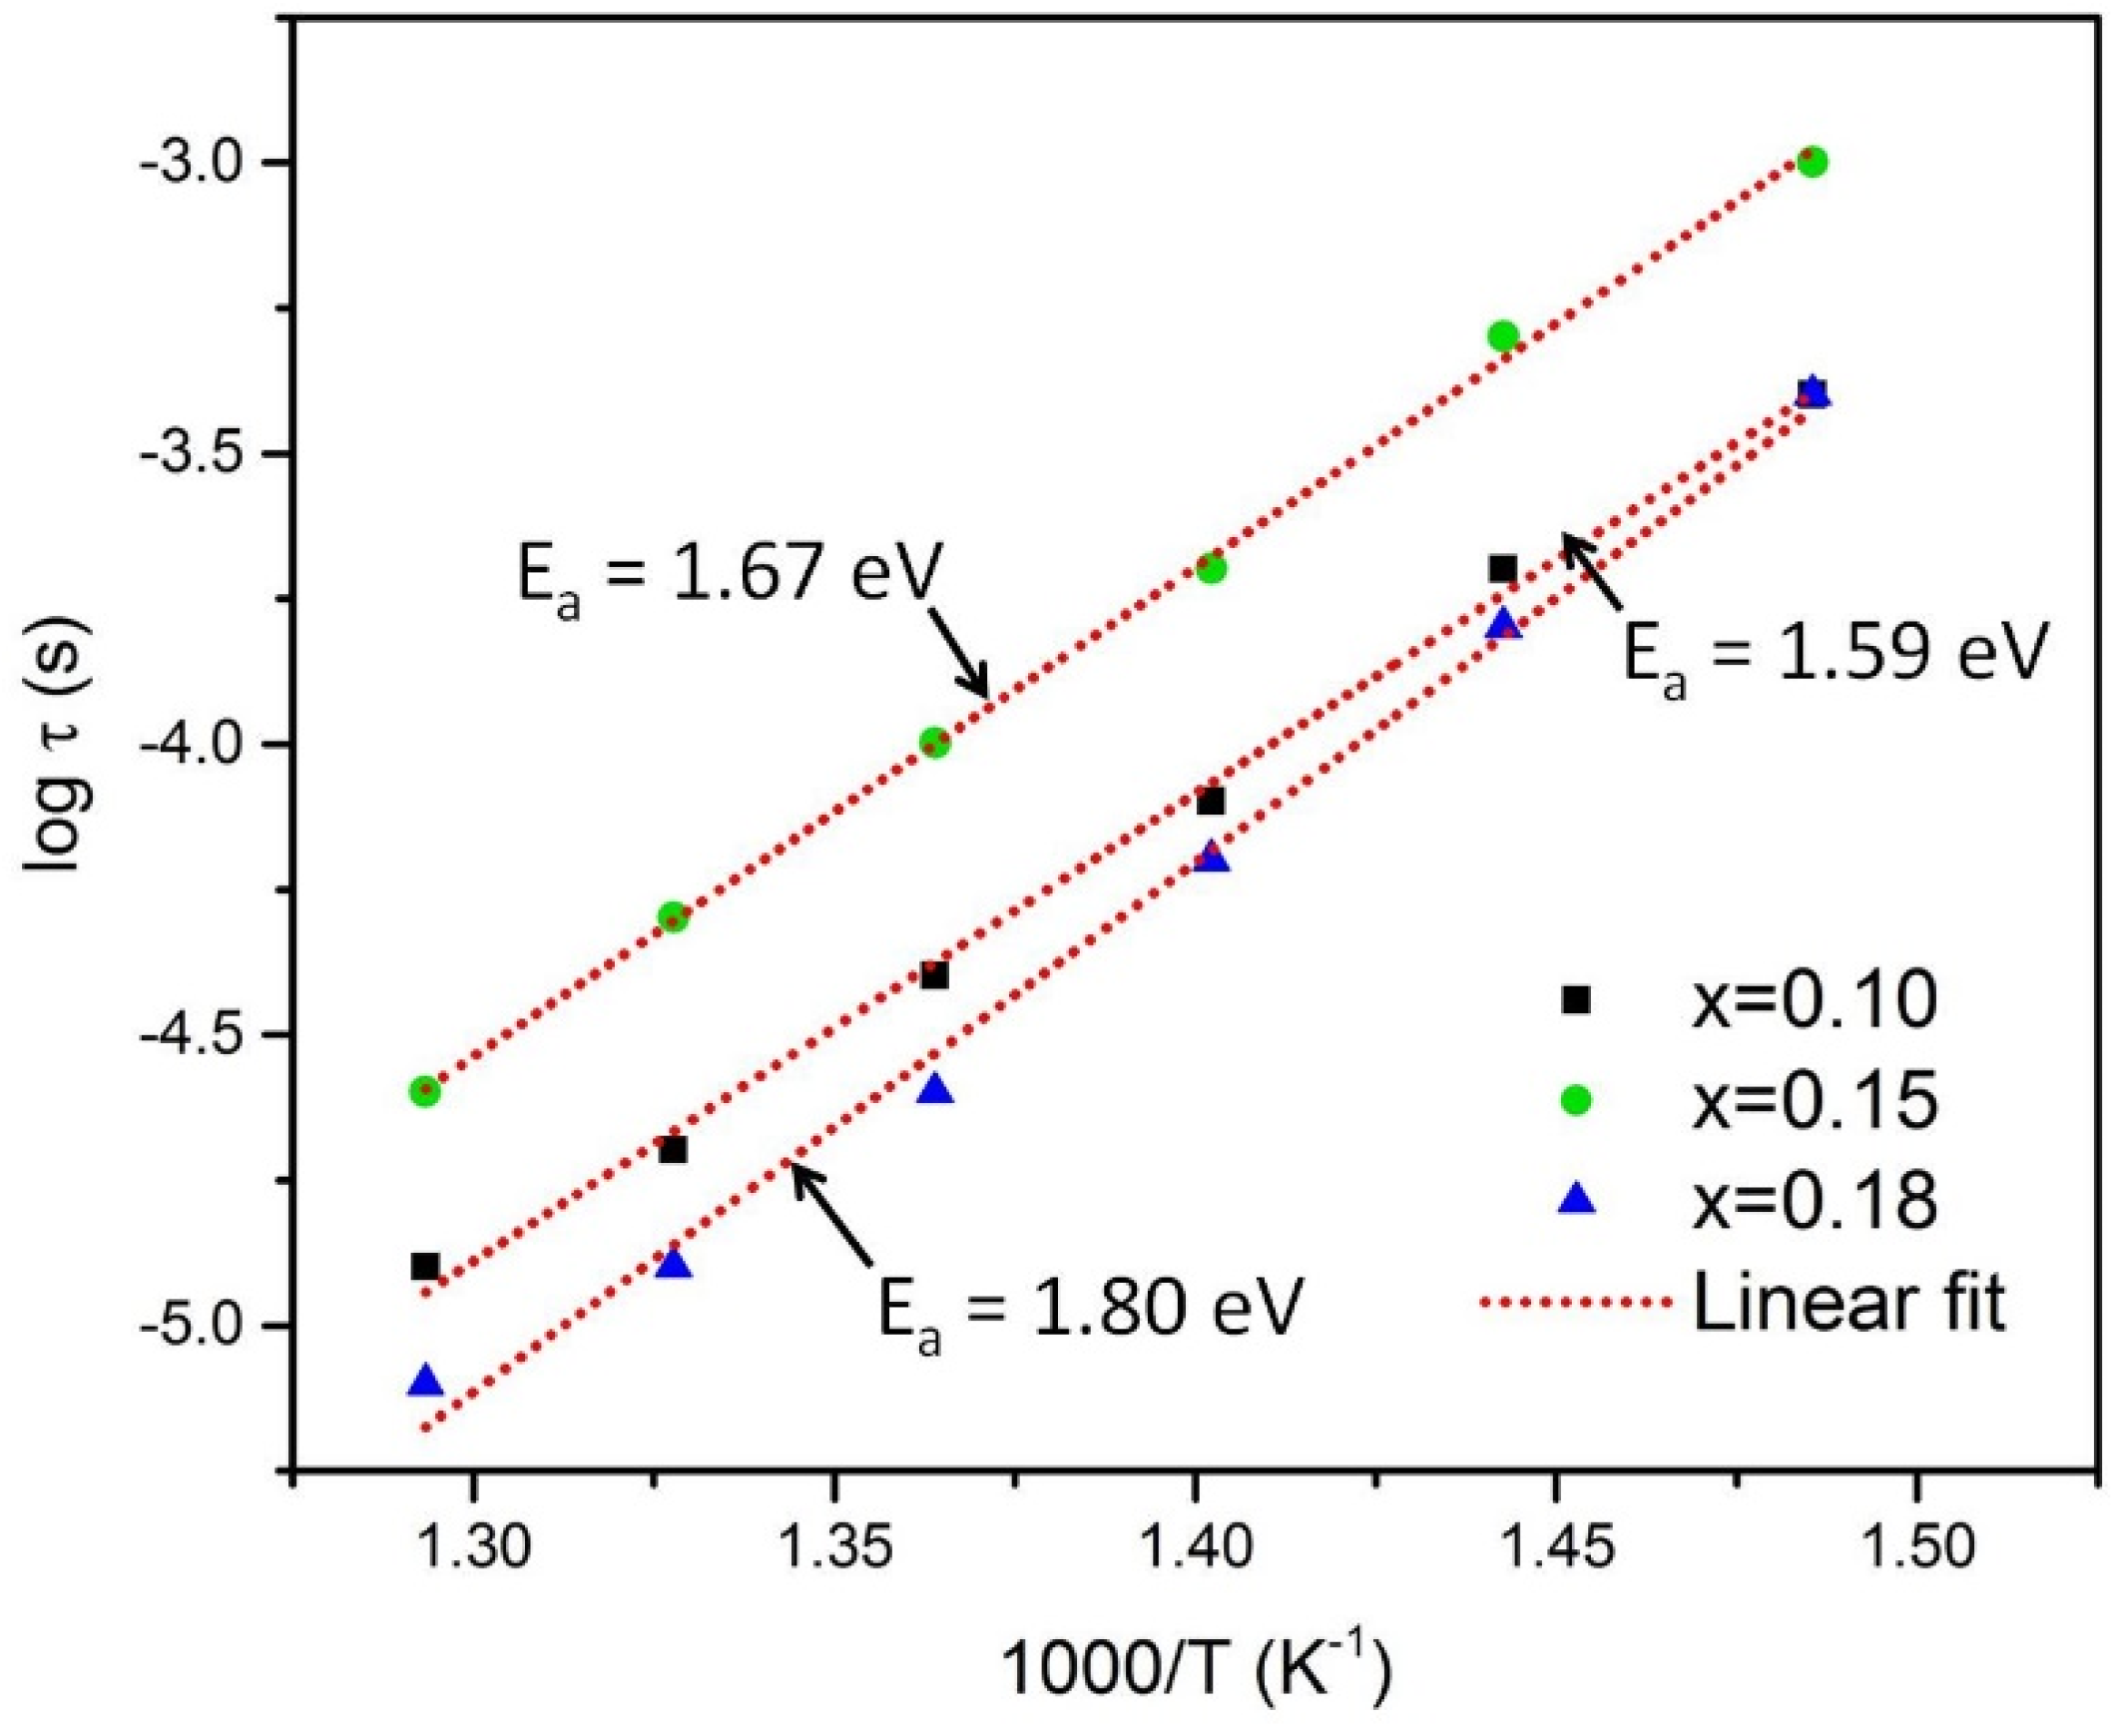
The thermally activated relaxation process follows the Arrhenius law:
where τ
0 is the relaxation time,
Ea is the activation energy of the relaxation process,
T is the absolute temperature, and
KB is the Boltzmann constant. The resonant condition is ω
pτ
p = 1, where ω is the angular frequency (ω = 2π
f) and the subscript
p represents the values at the peak maximum position.
Figure 6 shows the Arrhenius plots of the dielectric loss peak and the linear fitting for the studied BCTZ compositions. The relaxation parameters obtained from the linear relation, according to Equation (1), are shown in
Table 1.
3.3. Impedance Spectroscopy Analysis
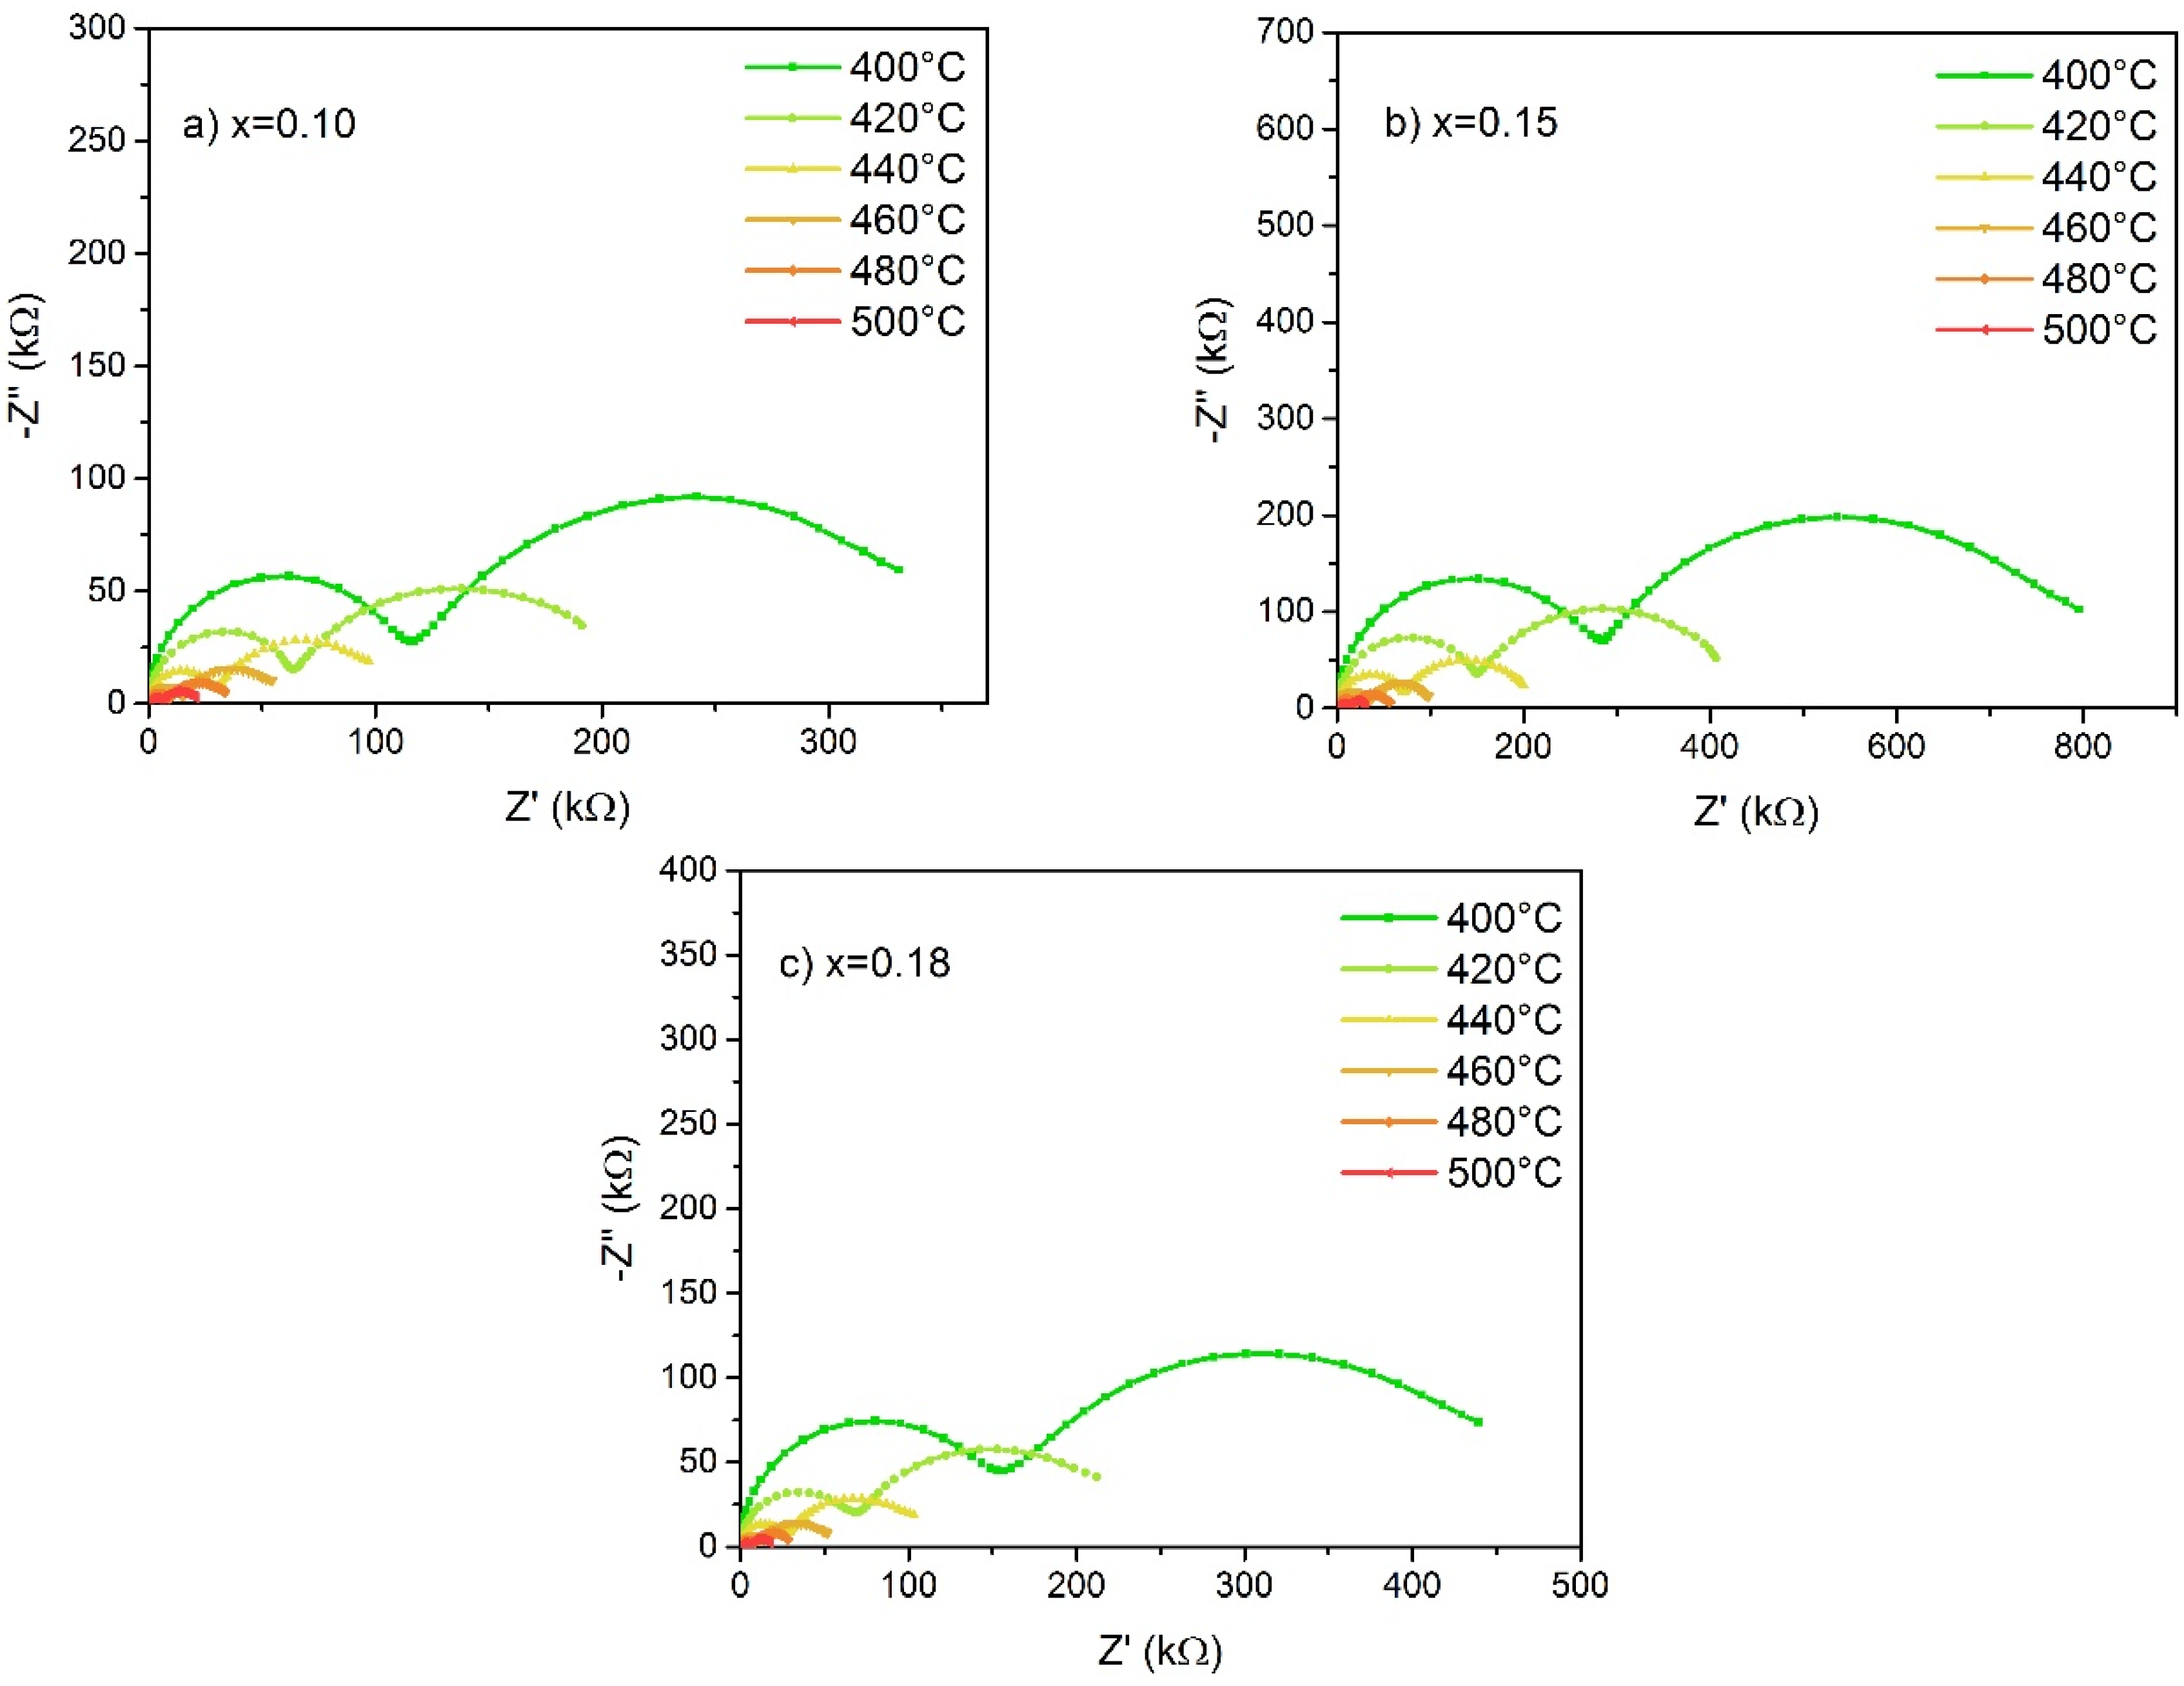
The Nyquist diagrams (Z’’ vs. Z’) of BCTZ (
x = 0.10, 0.15, 0.18) ceramics, at different temperatures, are shown in
Figure 7. The thermal effect over the impedance behavior of the samples became remarkable as temperature increases. Generally used for dielectric materials or ionic conductors, IS is a convenient technique to distinguish between different regions that are responsible for conduction mechanisms [
10]. The two semicircles displayed in
Figure 7a–c (for sintered BCTZ ceramics at 1400 °C for 2 h) represent the electrical contributions response. From high to low frequency, two semicircles appeared. These phenomena are attributed to the grain/bulk ferroelectric and grain boundary effects, respectively. Semiconducting grains and insulating grain boundaries are characteristic for BCTZ compositions. Moreover, as the radius of the semicircles decreased, the electric resistance dropped.
Increasing the dopant concentration enhances the electronic conductivity until the material reaches a maximum value. The electrical processes, taking place within the material, were modeled for the BCTZ (
x = 0.15, 420 °C) system. The electrical properties may be described by an appropriate equivalent circuit, based on a combination of RC (resistor-capacitor) elements in a series and/or parallel arrangement. These RC components represent the macroscopic processes involved in the charge transport due to inhomogeneity over the microstructure. To analyze systems that include a relaxation process, discrete RC elements must be combined with, or replaced by, distributed impedance components.
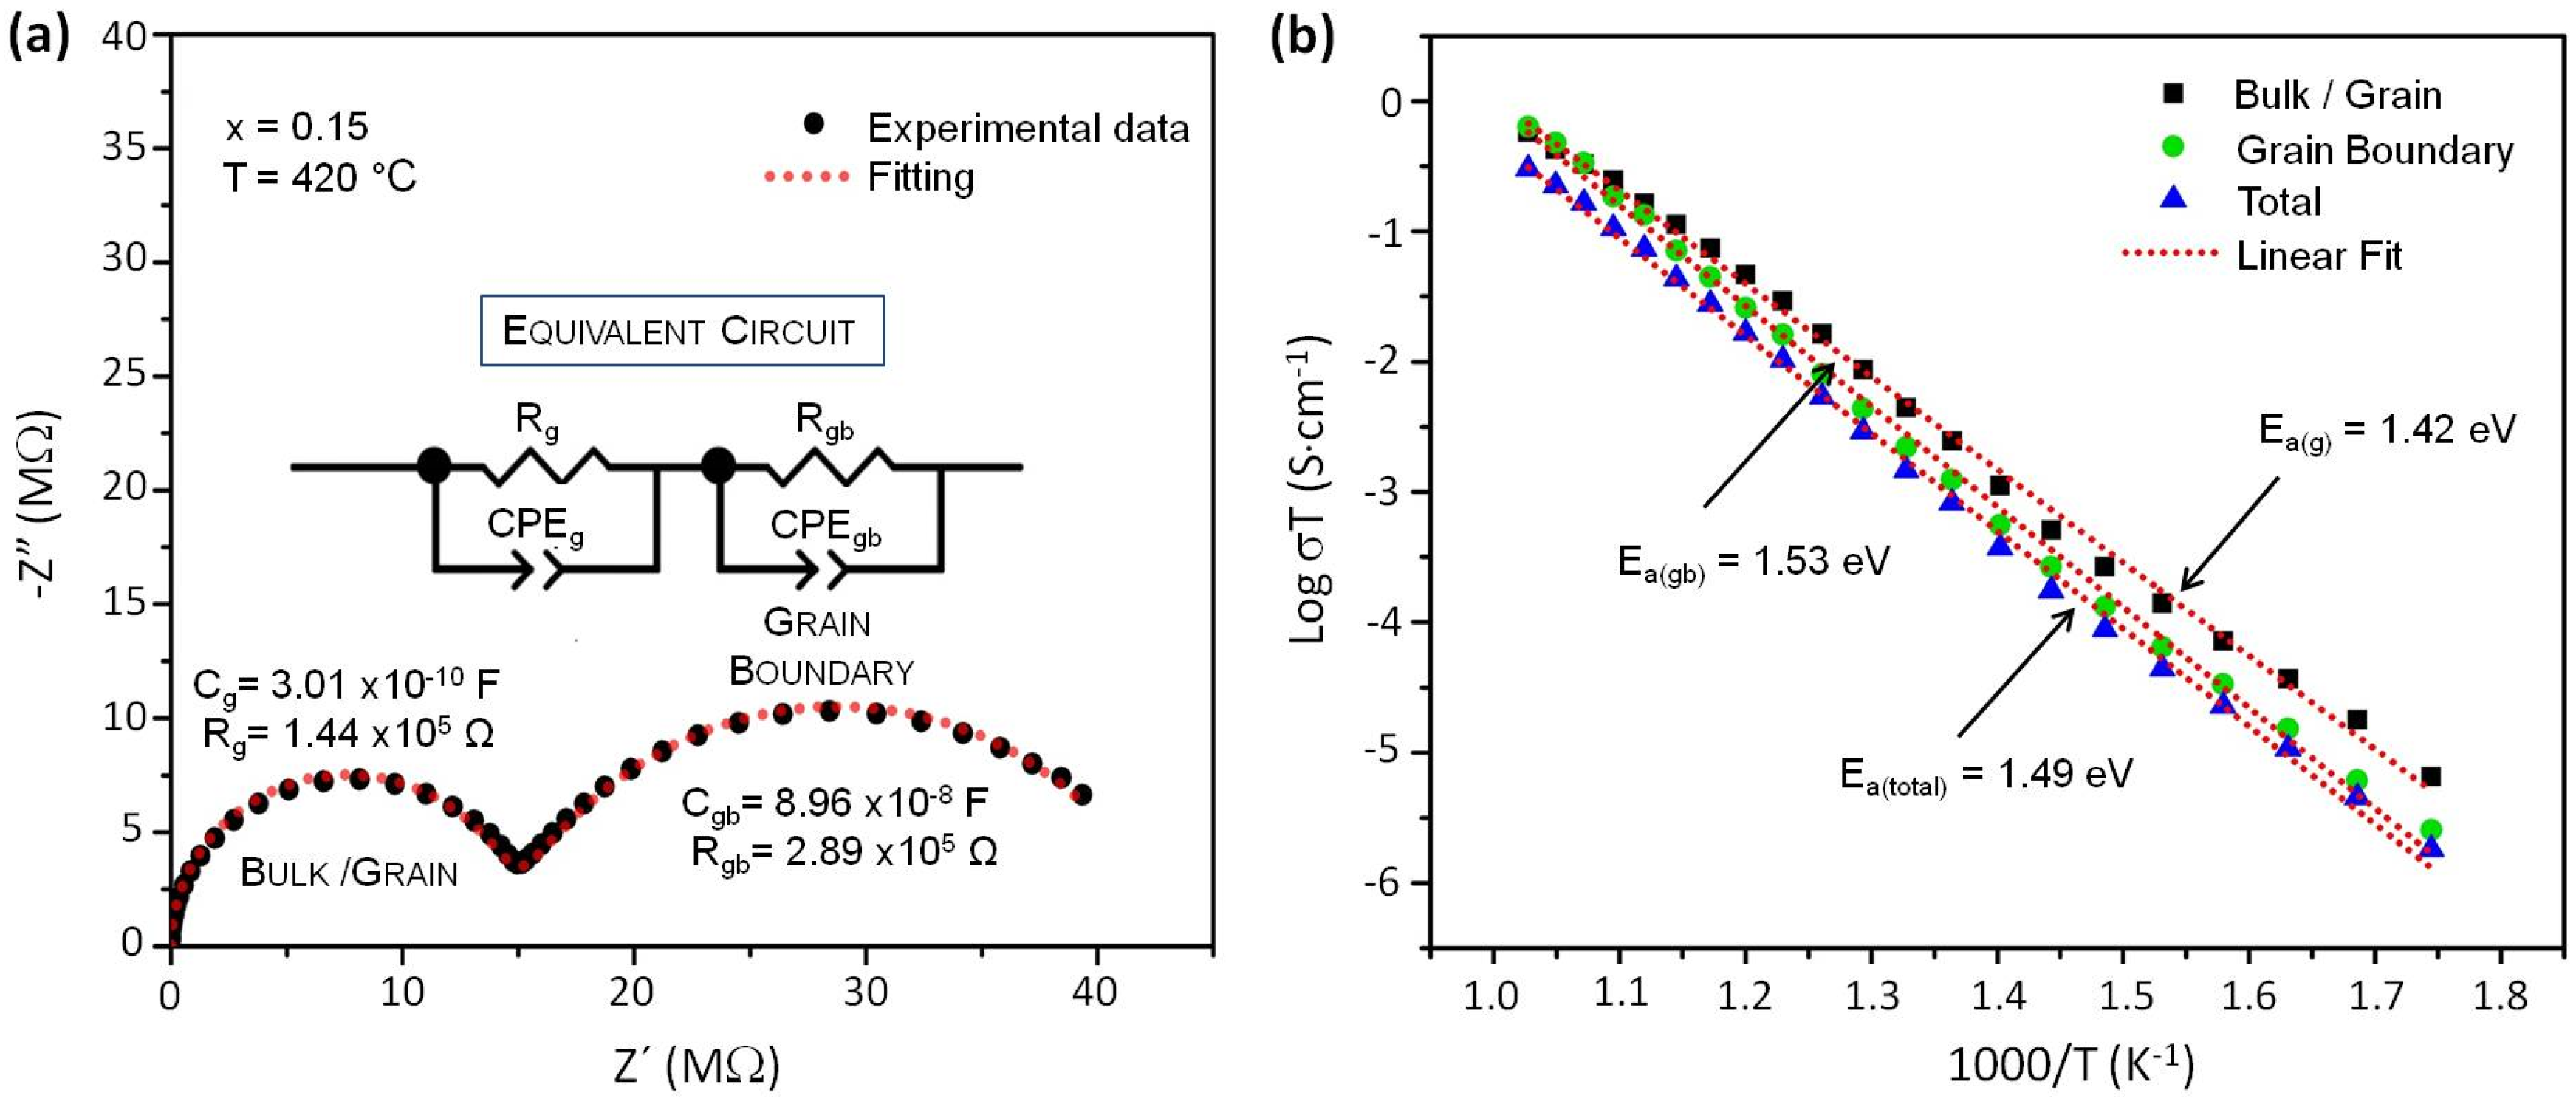
Figure 8 represents the fitting data and the equivalent circuit for BCTZ
x = 0.15 at 420 °C. The fitting data (
Figure 8a) was done using two R-CPE elements connected in series. The CPE element (constant phase element) was used instead of a pure capacitor to suppress the dispersion and non-linearities in the values. Then, the values of the resistance (R) and capacitance (C) for the bulk (b) and grain boundary (gb) were calculated. The CPE element is defined as [
23,
24]:
where
w is the angular frequency,
Y0 is related to the size, thickness and material properties, and α (0 ≤ α ≤ 1) relates to the degree of energy dissipation; it measures the arc depression which is frequency-independent [
21]. For α = 0, CPE behaves as a resistor. When α = 1, CPE behaves as a capacitor. For α = 0.5, the CPE element becomes a series RC circuit (Warburg diffusion). The calculated α value of BCTZ
x = 0.15 is ≈1.
Associated capacitances led to the identification of different processes: C
g (10
−9–10
−10 F) for bulk/grain ferroelectric ceramics and
Cgb (10
−8 F) for the grain boundary. The fitting measured impedances for equivalent circuits elements are:
Cg = 3.01 × 10
−10 F and
Rg = 1.44 × 10
5 Ω;
Cgb = 8.96 × 10
−8 F and
Rgb = 2.89 × 10
5 Ω, for BCTZ
x = 0.15 samples measured at 420 °C. These results reveal a well-sintered material with narrow intergranular regions [
10].
Like the relaxation time, the electrical conductivity for sintered BCTZ ceramics, measured from 300 °C to 700 °C, follows the Arrhenius law (Equation (1)).
Figure 8b shows the activation energy calculated for each region: the bulk/grain, grain boundary and total. The total conductivity response (σ
total) is 2.31 × 10
−4 S·cm
−1, with a bulk conductivity (σ
b) of 7.07 × 10
−4 S·cm
−1 and a grain boundary conductivity (σ
gb) of 3.64 × 10
−4 S·cm
−1. Following the relationship (σ ∝ R
−1), the maximum conductivity (σ
max) of the material is noticed at the minimum value of the arc response. For the obtained BCTZ
x = 0.15, σ
max = 2.48 × 10
−2 S·cm
−1 is reached at 580 °C.
4. Conclusions
BCTZ ceramics were obtained by conventional solid state method. It was found that the studied compositions exhibited a perovskite phase, except for x = 0.18 where a secondary phase of CaTiO3 appears. The dielectric permittivity showed a maximum value at x = 0.15, promoted by the MPB (i.e., due to higher polarizability promoted by the coexistence of rhombohedral-tetragonal phases). For T > TC, a thermally relaxation process was found. Moreover, EIS analyses showed that conduction phenomena are associated with the bulk and grain boundary regions. For these processes, a suitable equivalent circuit was proposed with R and CPE elements. The maximum conductivity for BCTZ (x = 0.15) was found at 580 °C.


 ,
, 


