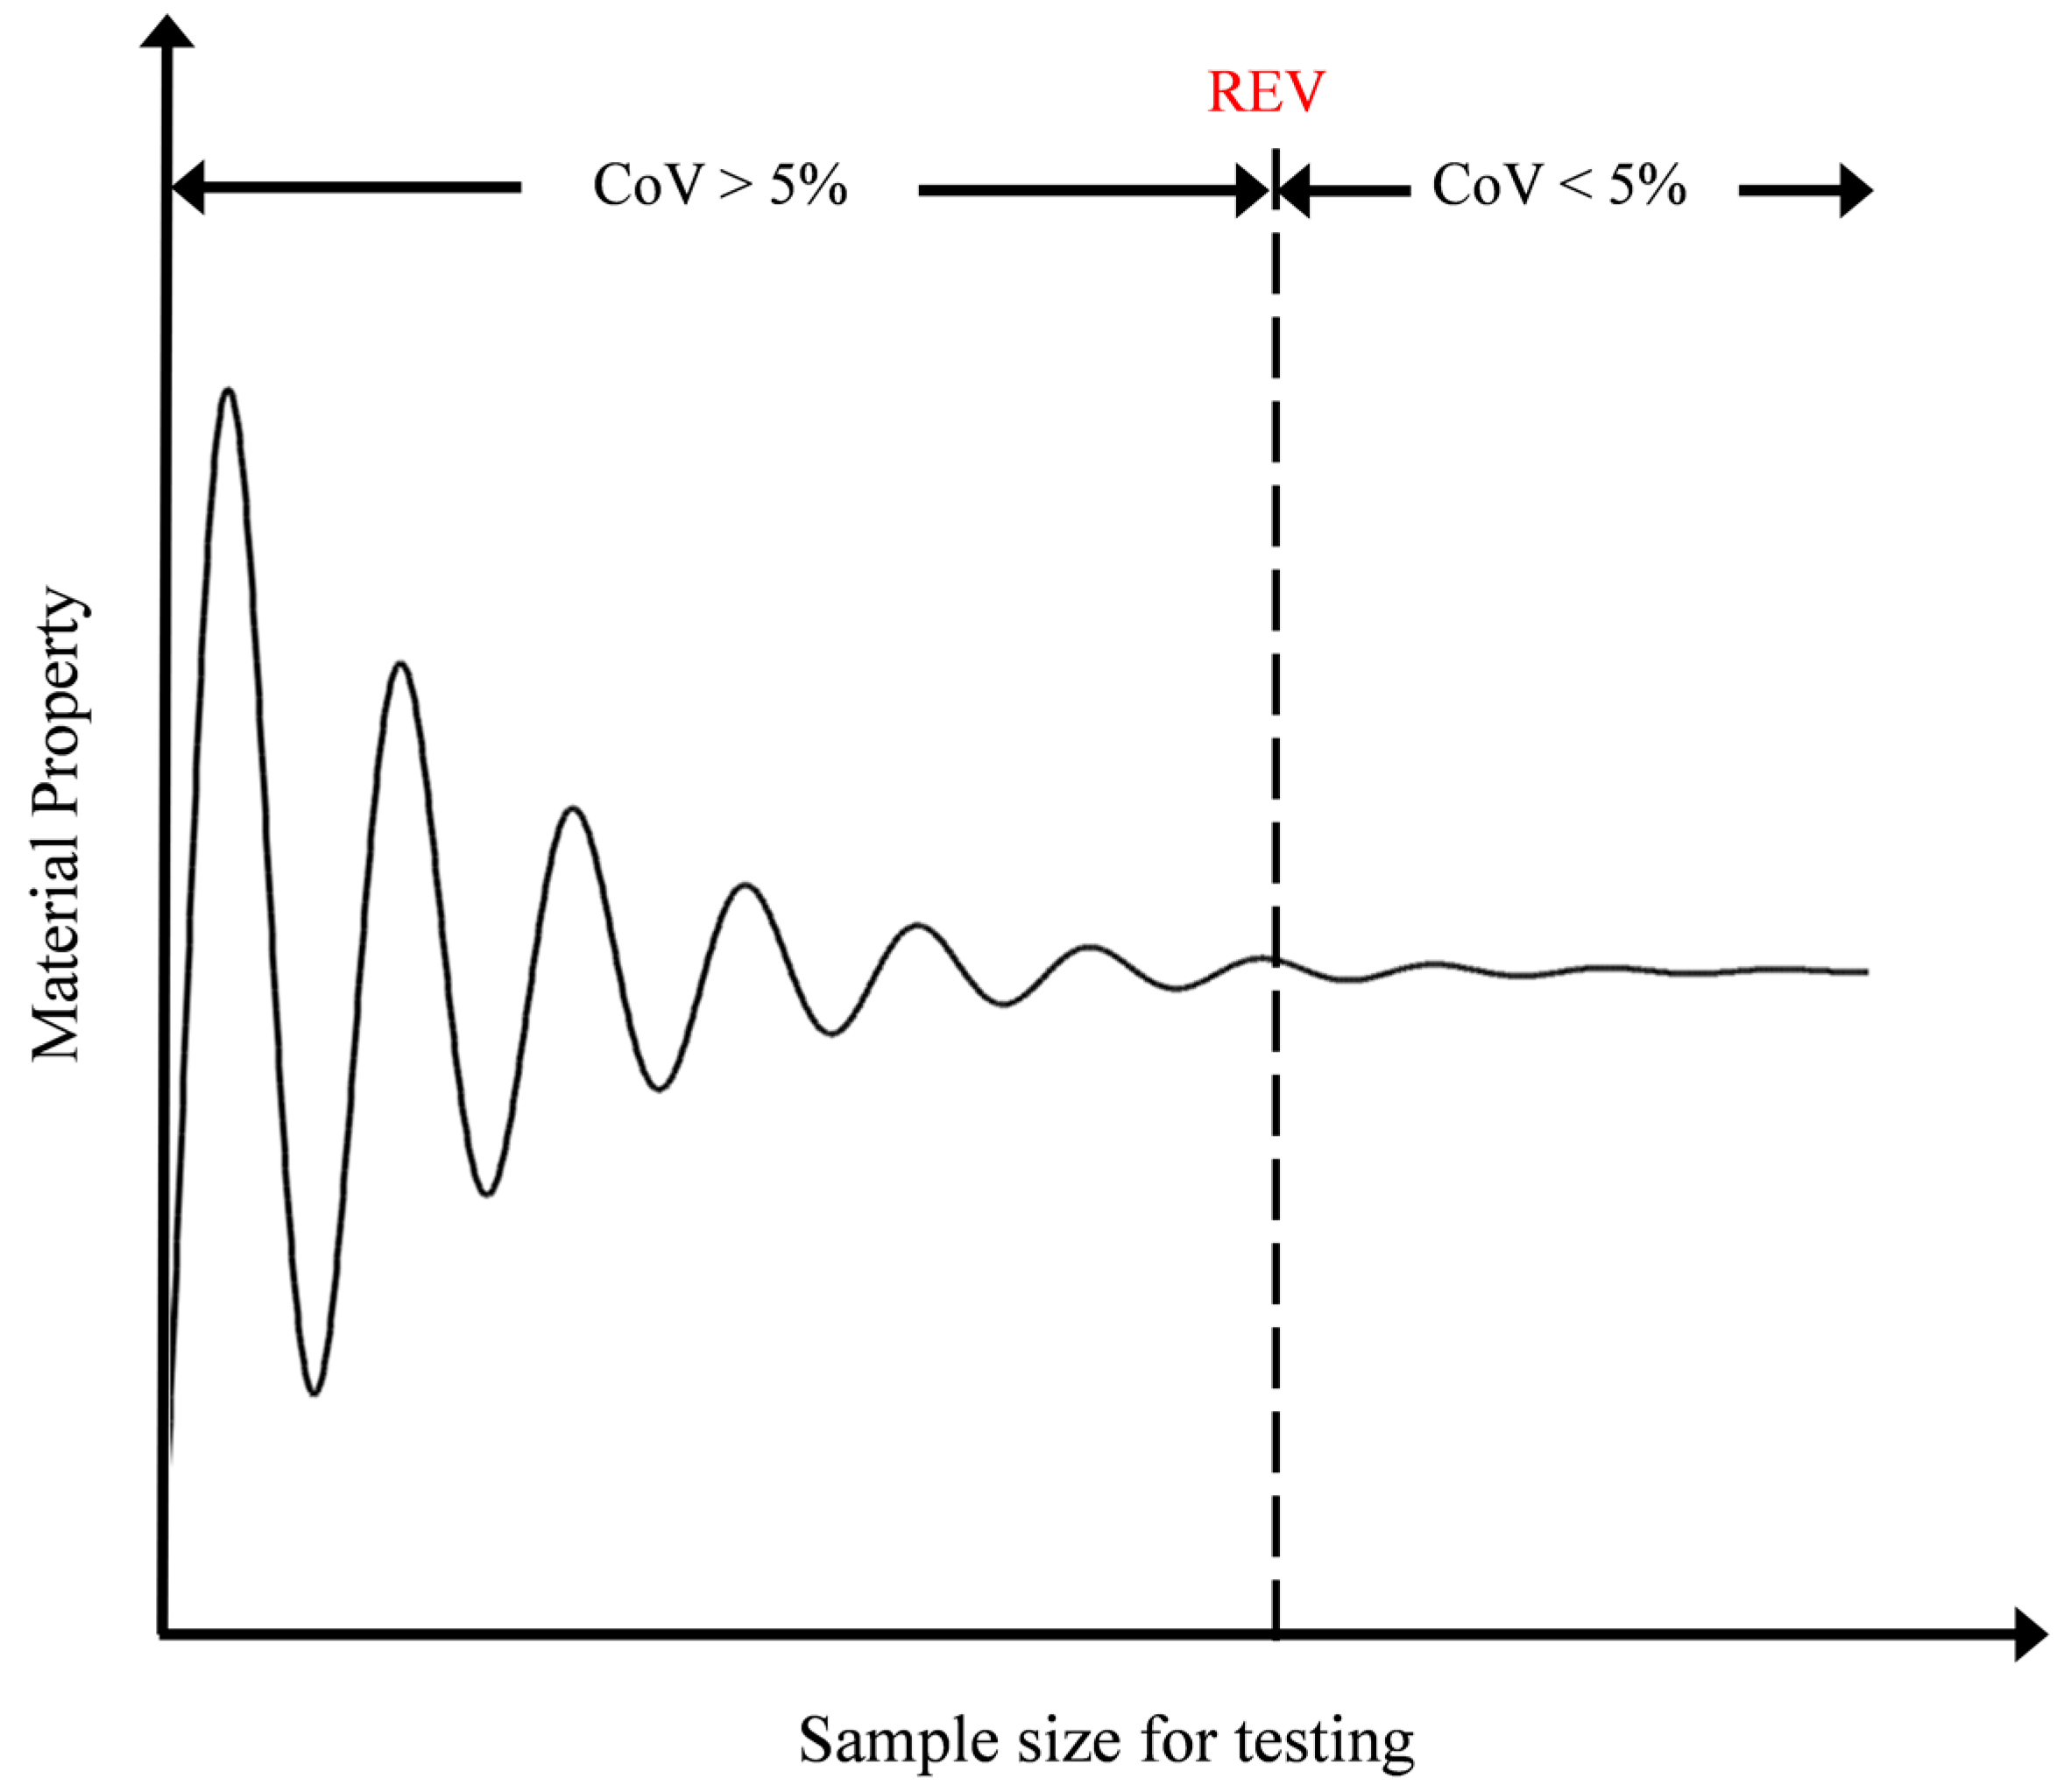
The REV concept was used in this study in order to observe the effects of sample size and particle size as well as to obtain the microscopic properties representing the homogeneous physical behavior of the model at macro scale. In this study, REV was achieved by obtaining the minimum size of the sample above which the sample diameter does not affect the mechanical behavior of the material; at coefficient of variation to be less than 5% for the average value of five consecutively larger samples. The coefficient of variation (CoV) is defined as the ratio of standard deviation to the mean values of the measured parameter under consideration. Since rock is a natural and not man-made material, the value of CoV for a rock property is generally used as less than 5% for REV studies [
21,
22,
23,
24], as the scatter in testing results or CoV of UCS, point load index and Brazilian tests was recorded as far greater than 5% after testing of many types of rock specimens [
25,
26,
27,
28,
29,
30]. In order to achieve REV, the initial sample of 30 cm diameter was generated and the macroscopic parameters of the sample i.e., UCS, Young’s modulus (E) and Poisson’s ratio (υ), were obtained by performing UCS tests for all rock types in PFC
2D code. The microscopic parameters were sequentially calibrated so that the required macroscopic parameters could be achieved. Brazilian tensile strength (BTS) tests and compressive strength tests at confining pressures of 5, 10, 15 and 20 MPa were performed for all rock types using 30 cm diameter sample and the results were recorded. More samples were generated by increasing the sample diameter by 5 cm at a time and UCS, BTS and compression tests were performed for each increased sample diameter until the CoV of all the macroscopic parameters (UCS, E, υ, BTS and compressive strengths at various confining pressures) for five consecutively larger samples was obtained to be less than 5%. Every time diameter of the sample was increased, the calibration of microscopic parameters had to be performed in UCS tests so that the required UCS, E, and υ for the increased sample size could be achieved. For REV calculations, all the microscopic parameters given in
Table 4 needed not to be changed and only four microscopic parameters namely; particle–particle contact Young’s modulus (
Ec), Young’s modulus of parallel bond (
Ēc), parallel bond normal and shear strength (
and
) were carefully calibrated in UCS tests each time the sample diameter was increased. In the calibration process, the values of particle-particle contact Young’s modulus (
Ec) were kept equal to the values of Young’s modulus of parallel bond (
Ēc), whereas, the values of parallel bond normal strength (
were kept equal to the values of parallel bond shear strength (
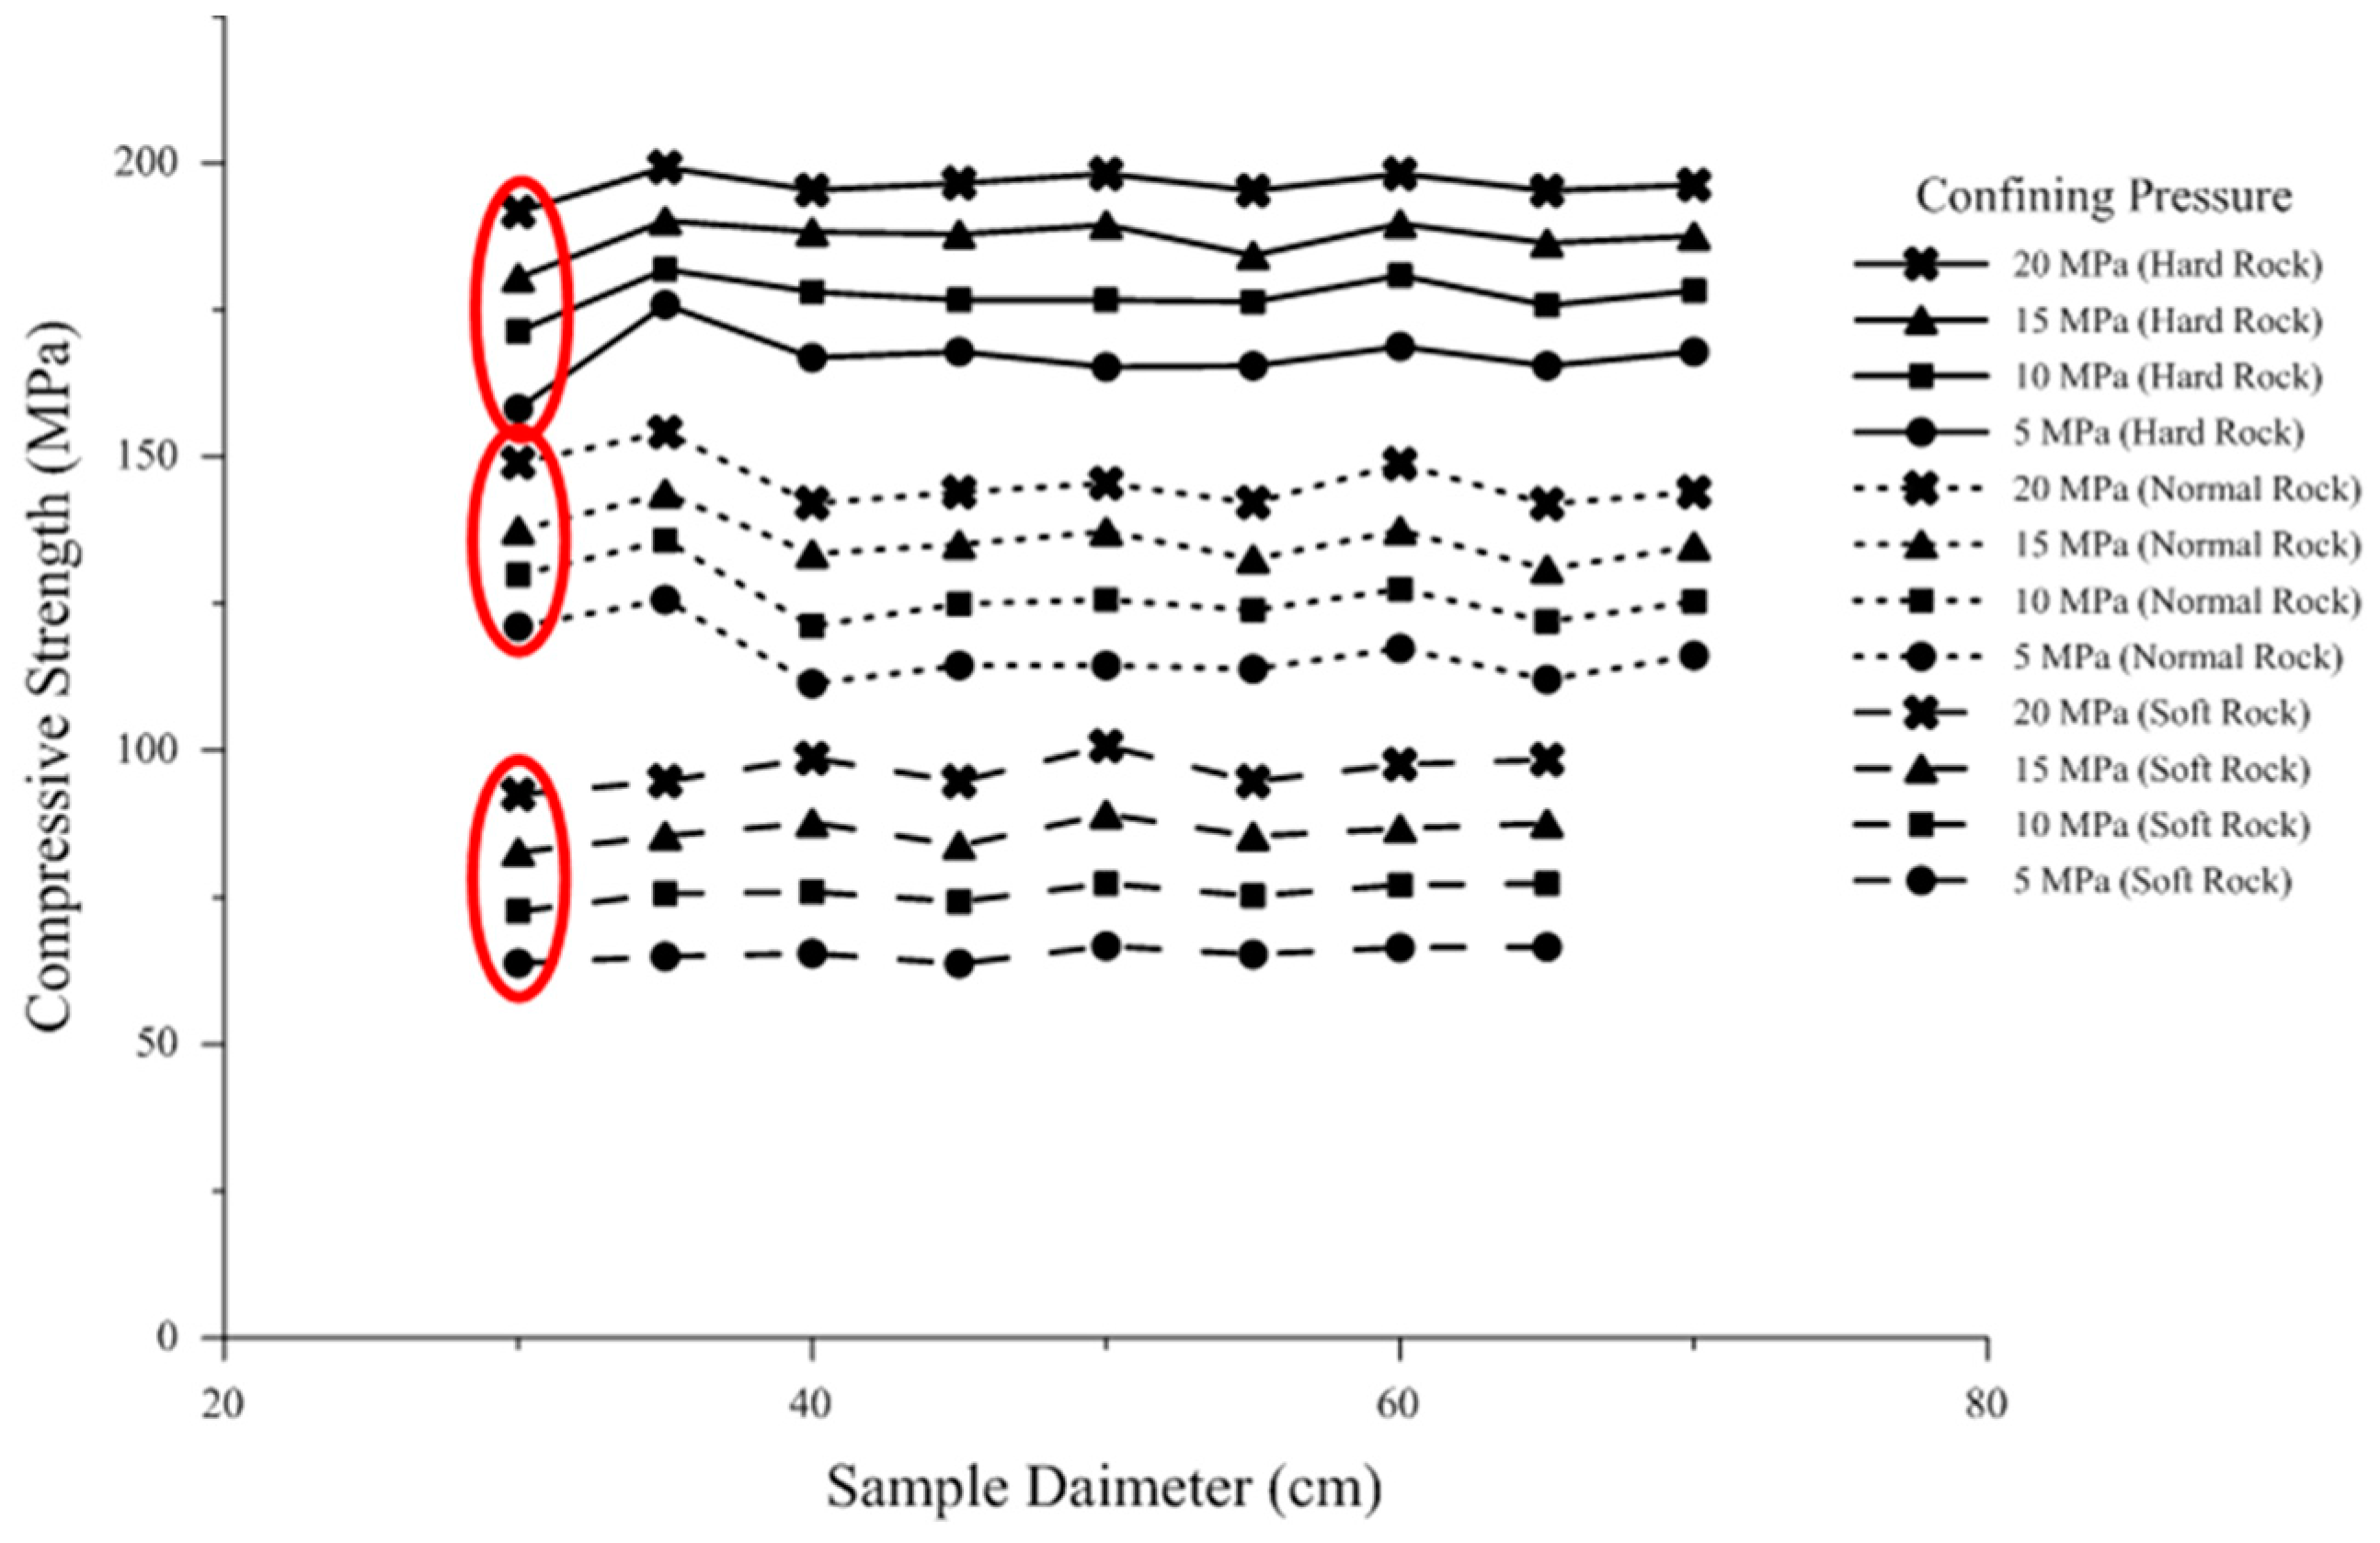
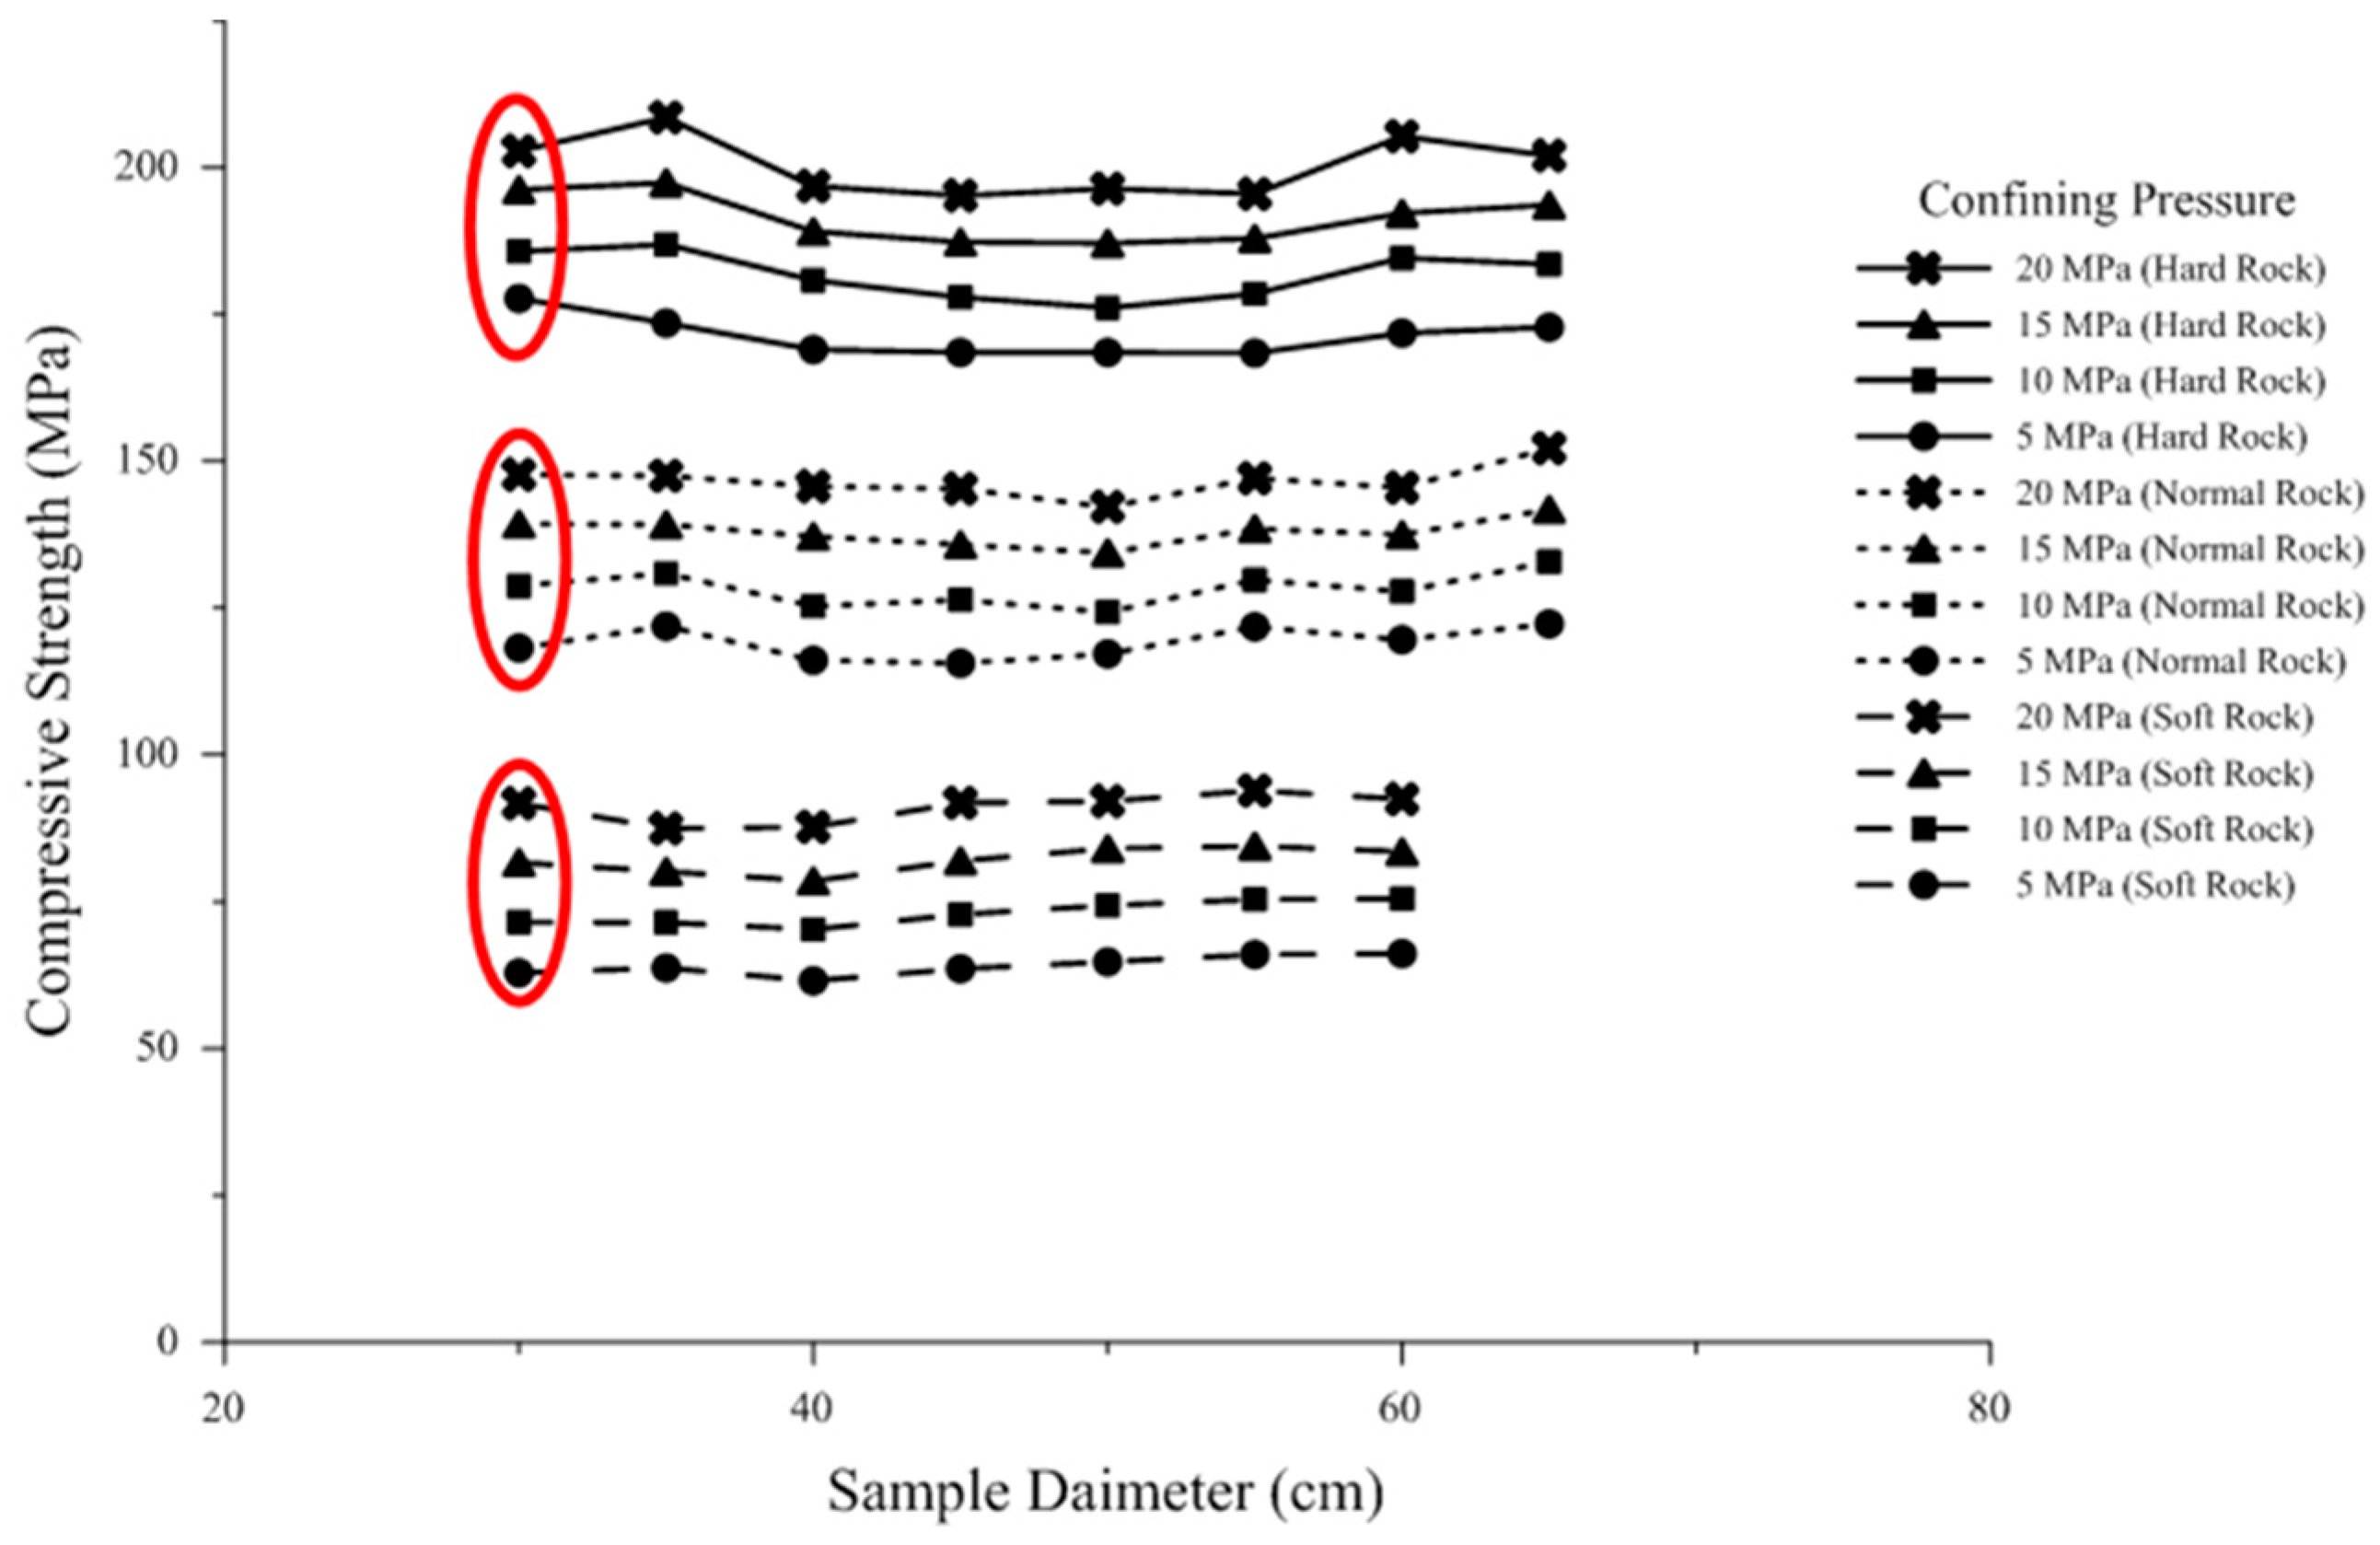
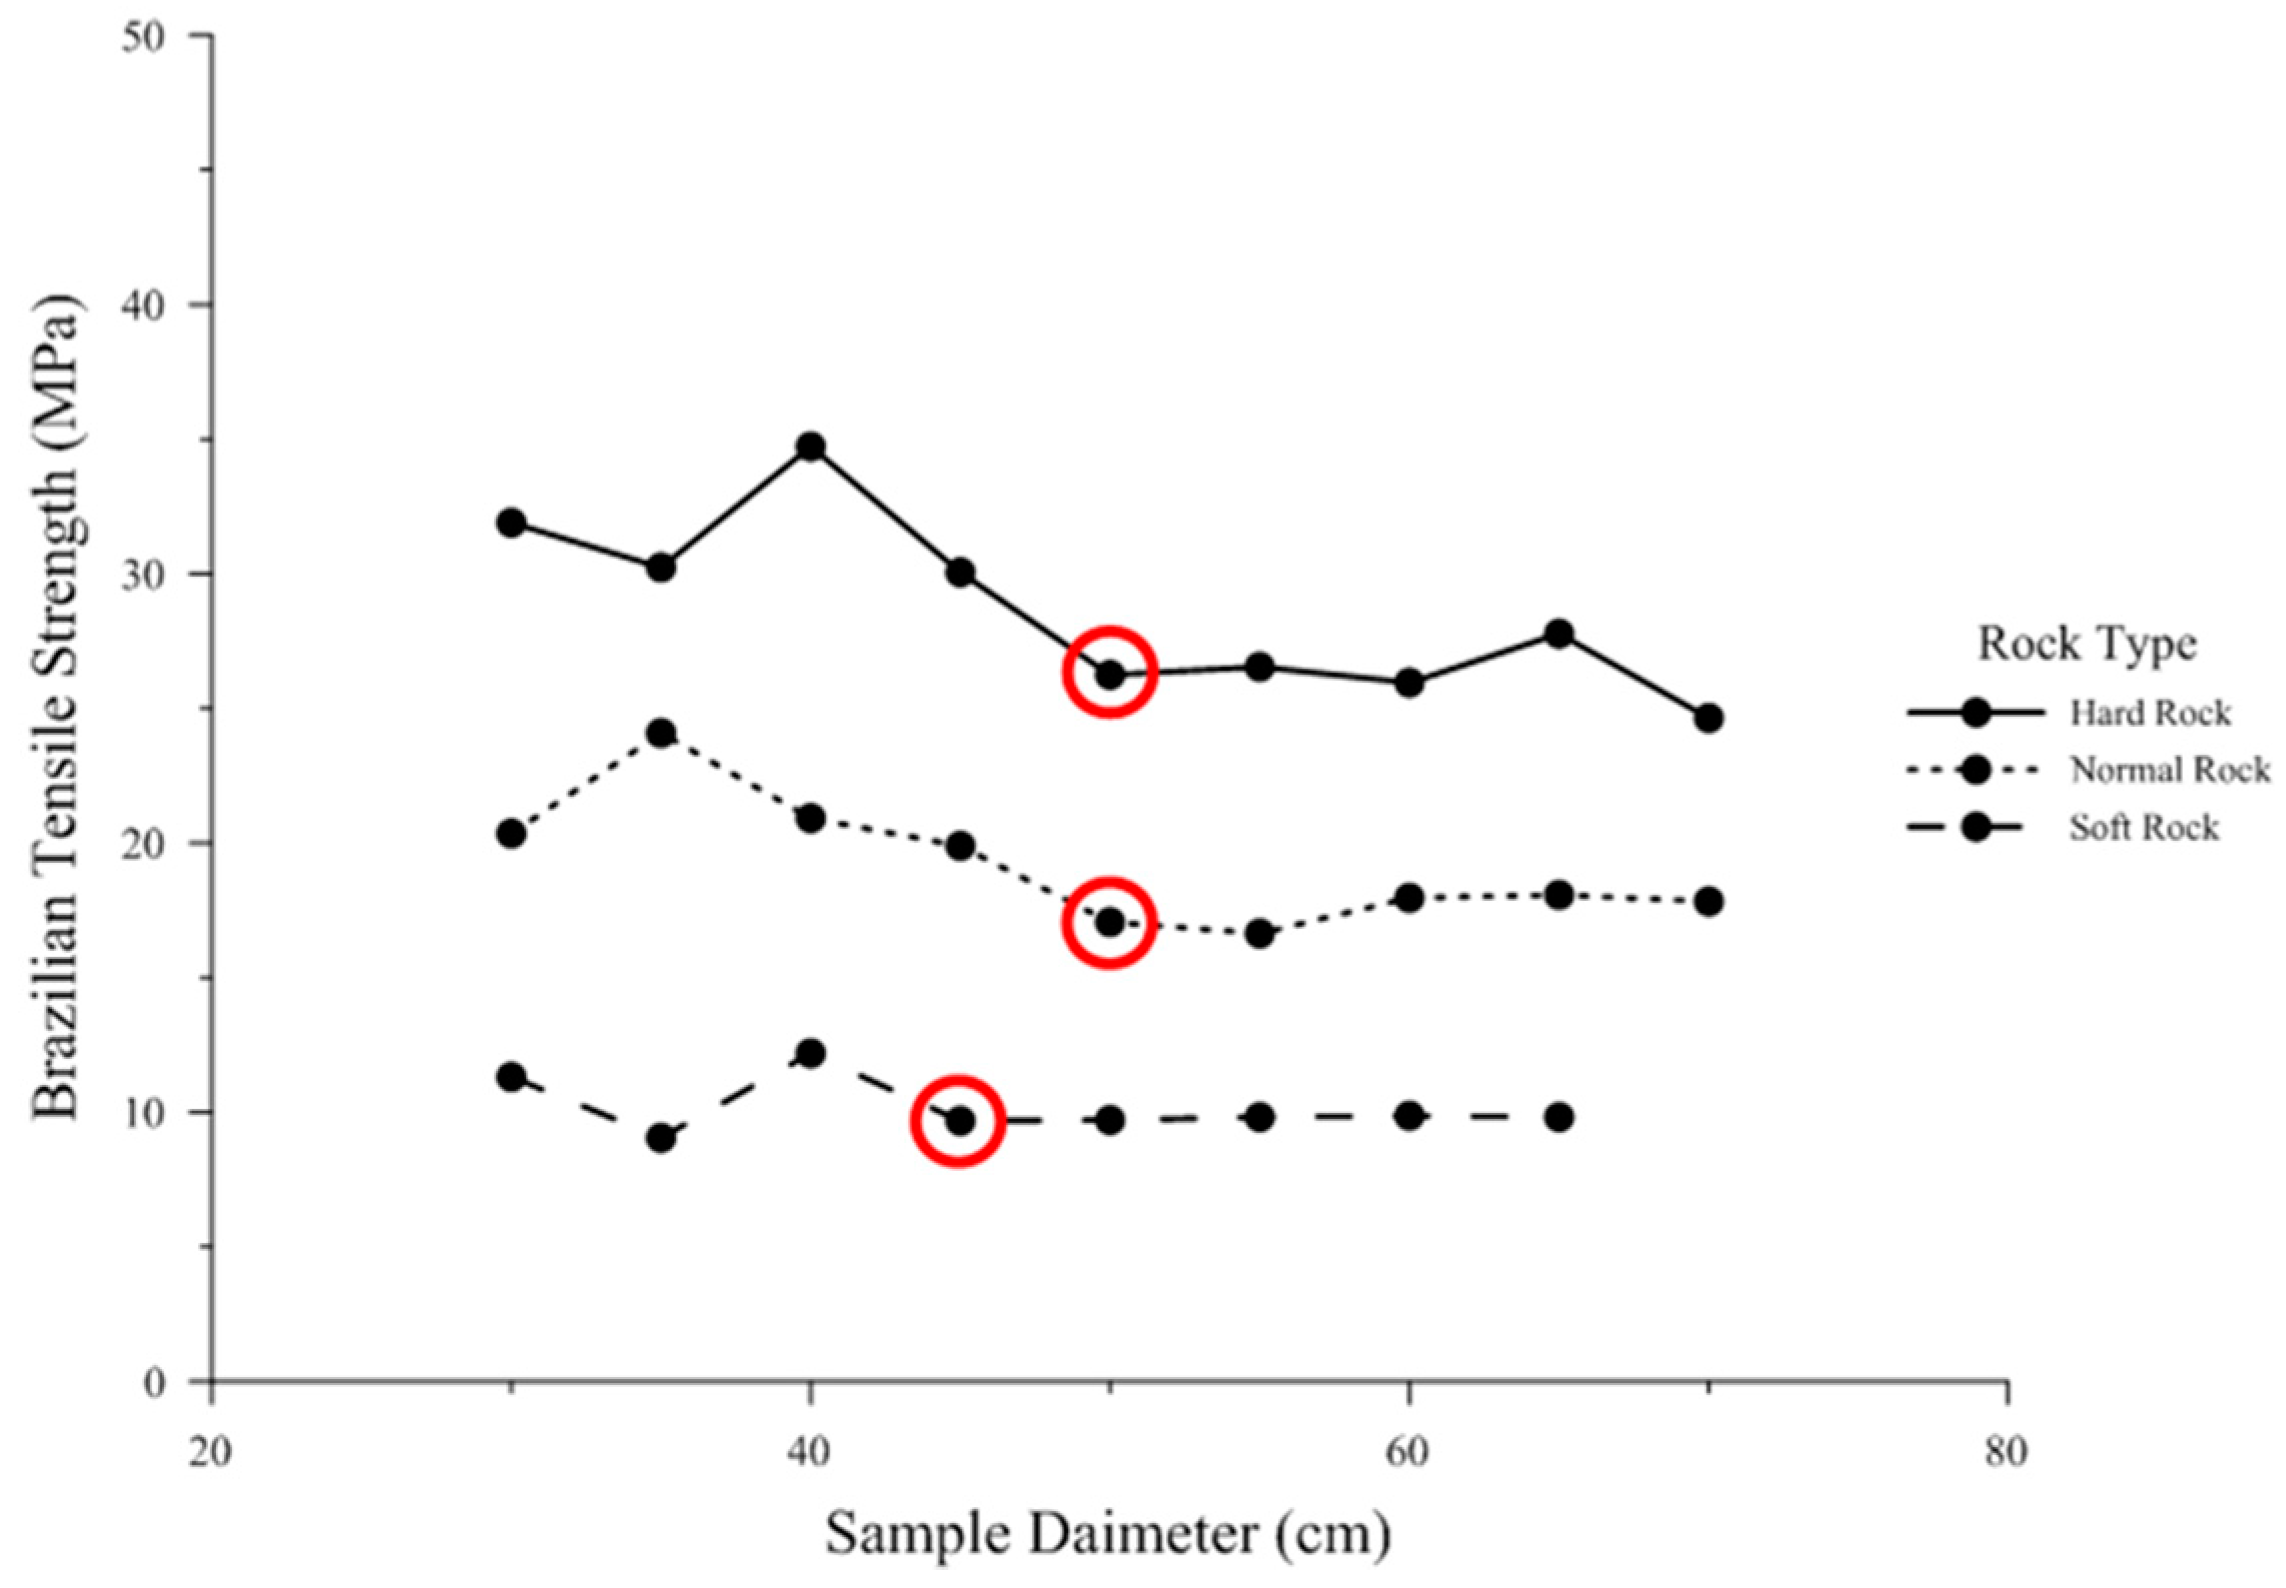
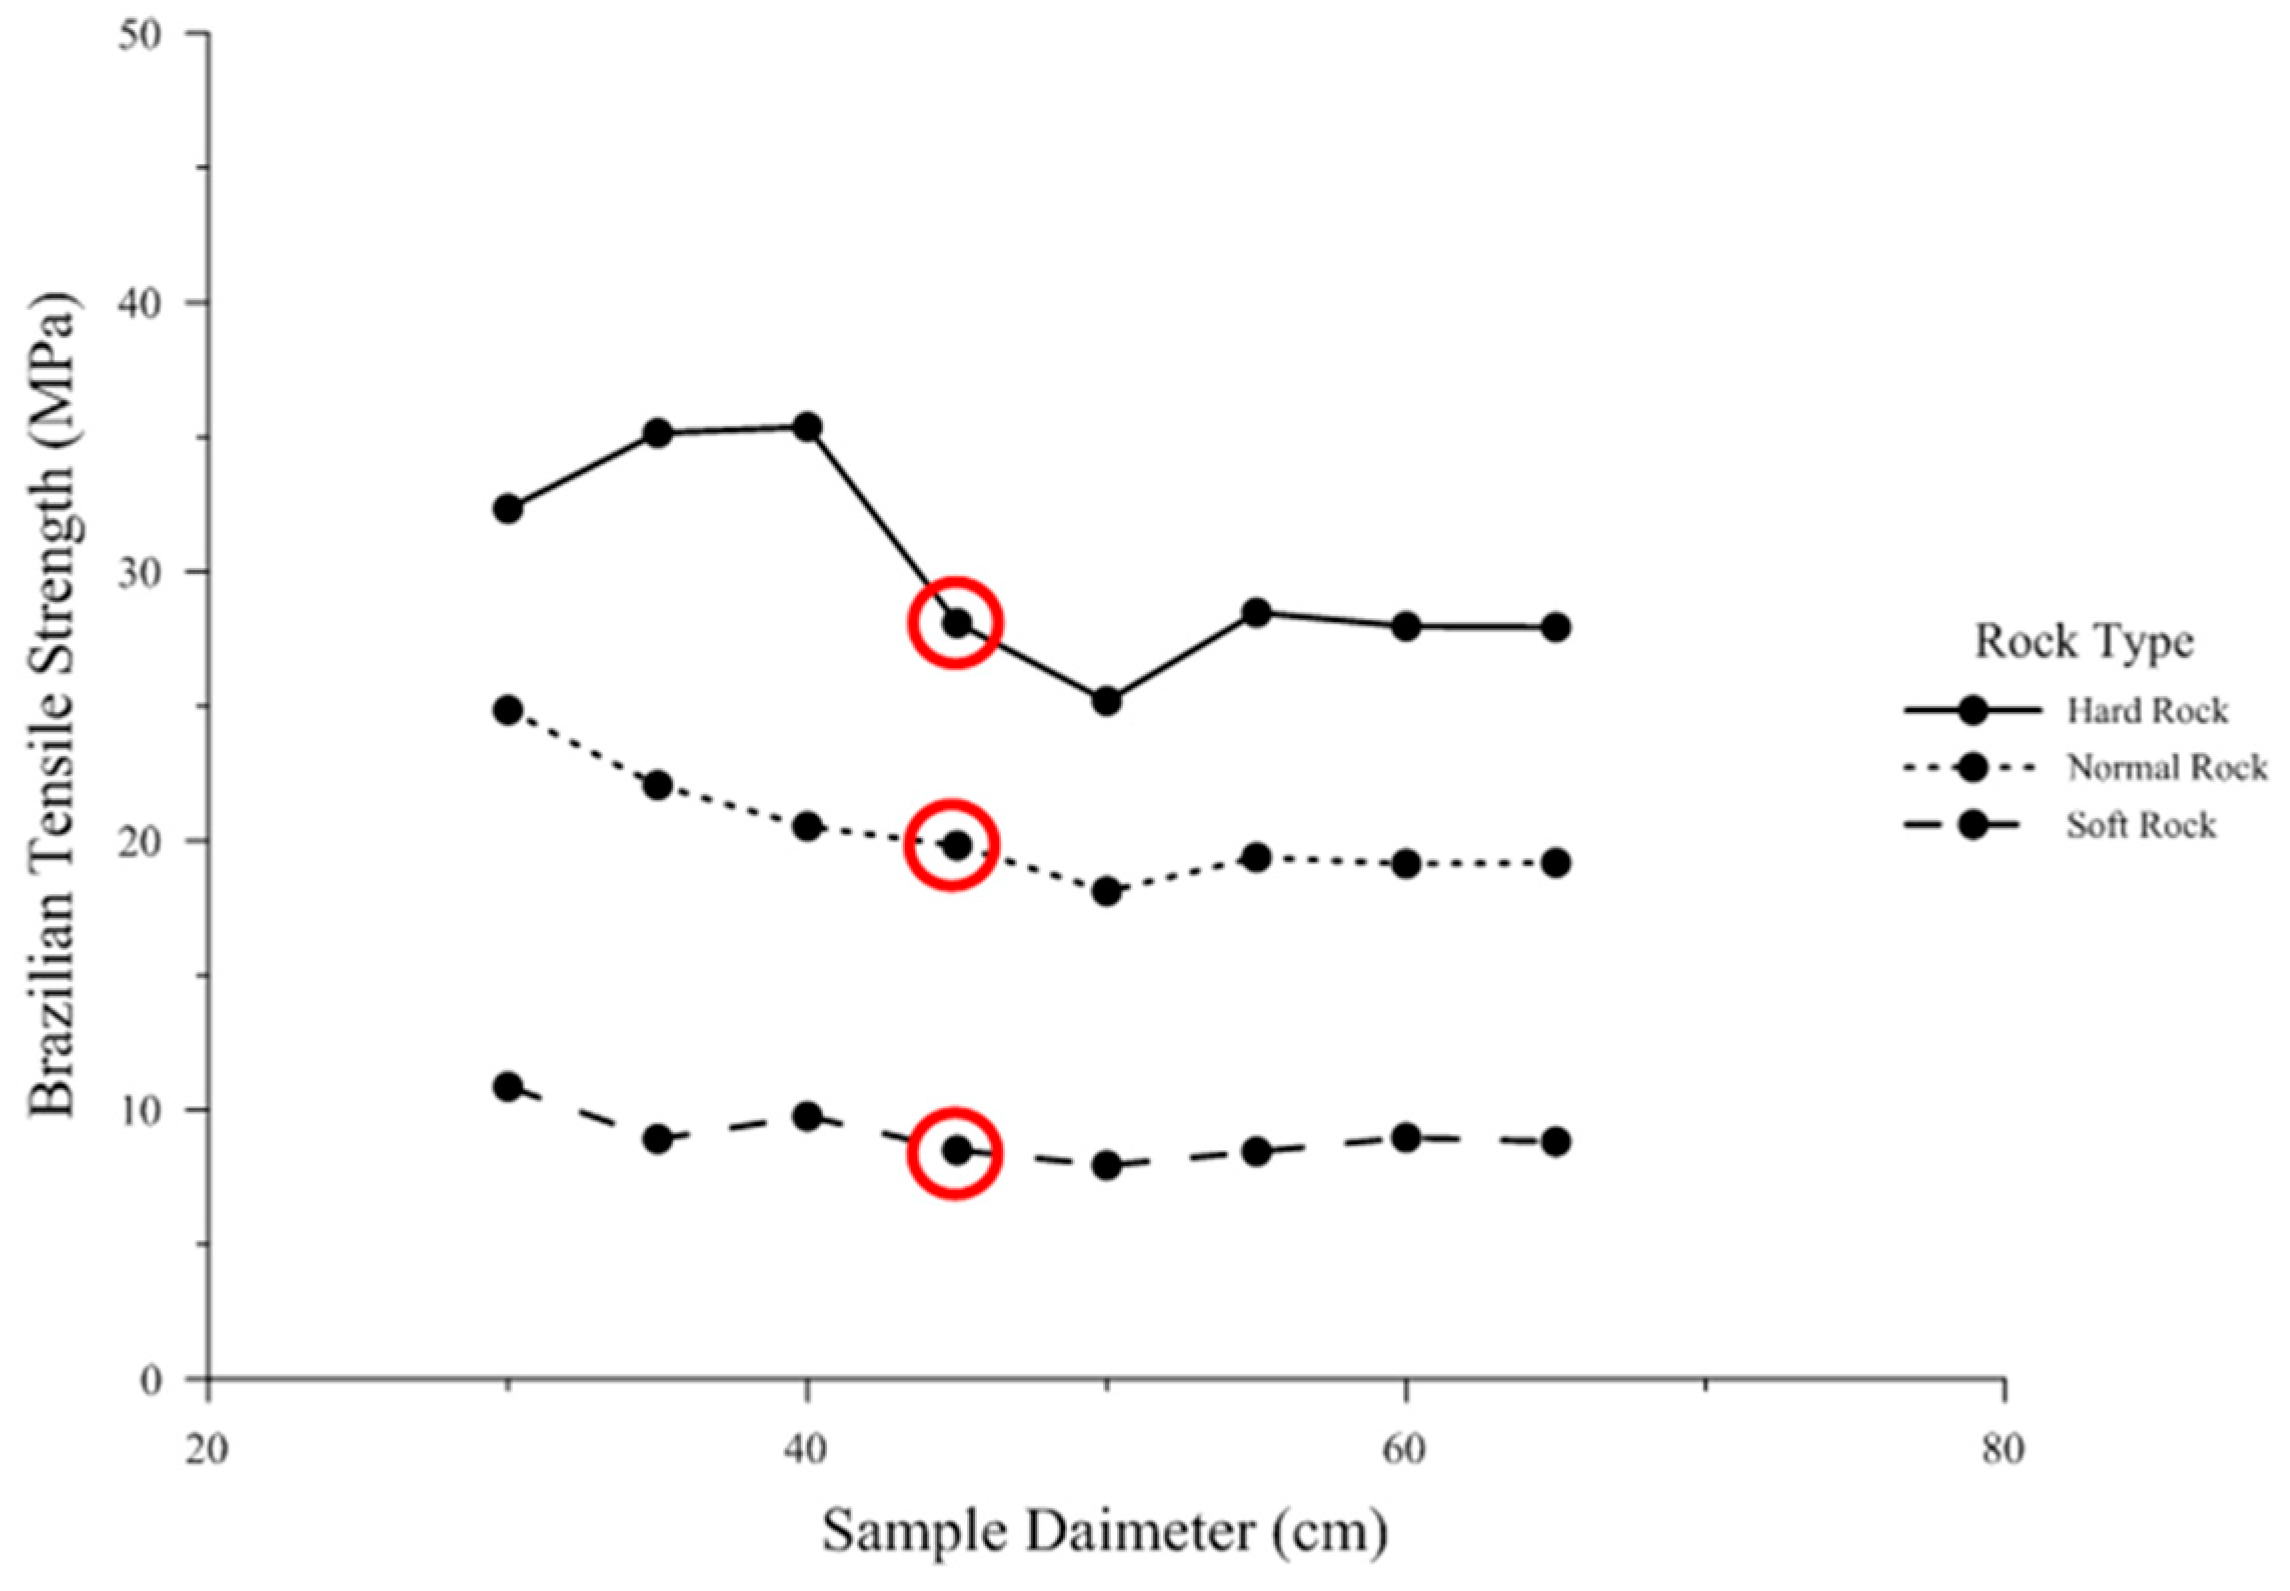
. The compression test results for low modulus ratio, average modulus ratio, and high modulus ratio are presented in
Figure 5,
Figure 6 and
Figure 7, respectively. The BTS test results for low modulus ratio, average modulus ratio, and high modulus ratio are presented in
Figure 8,
Figure 9 and
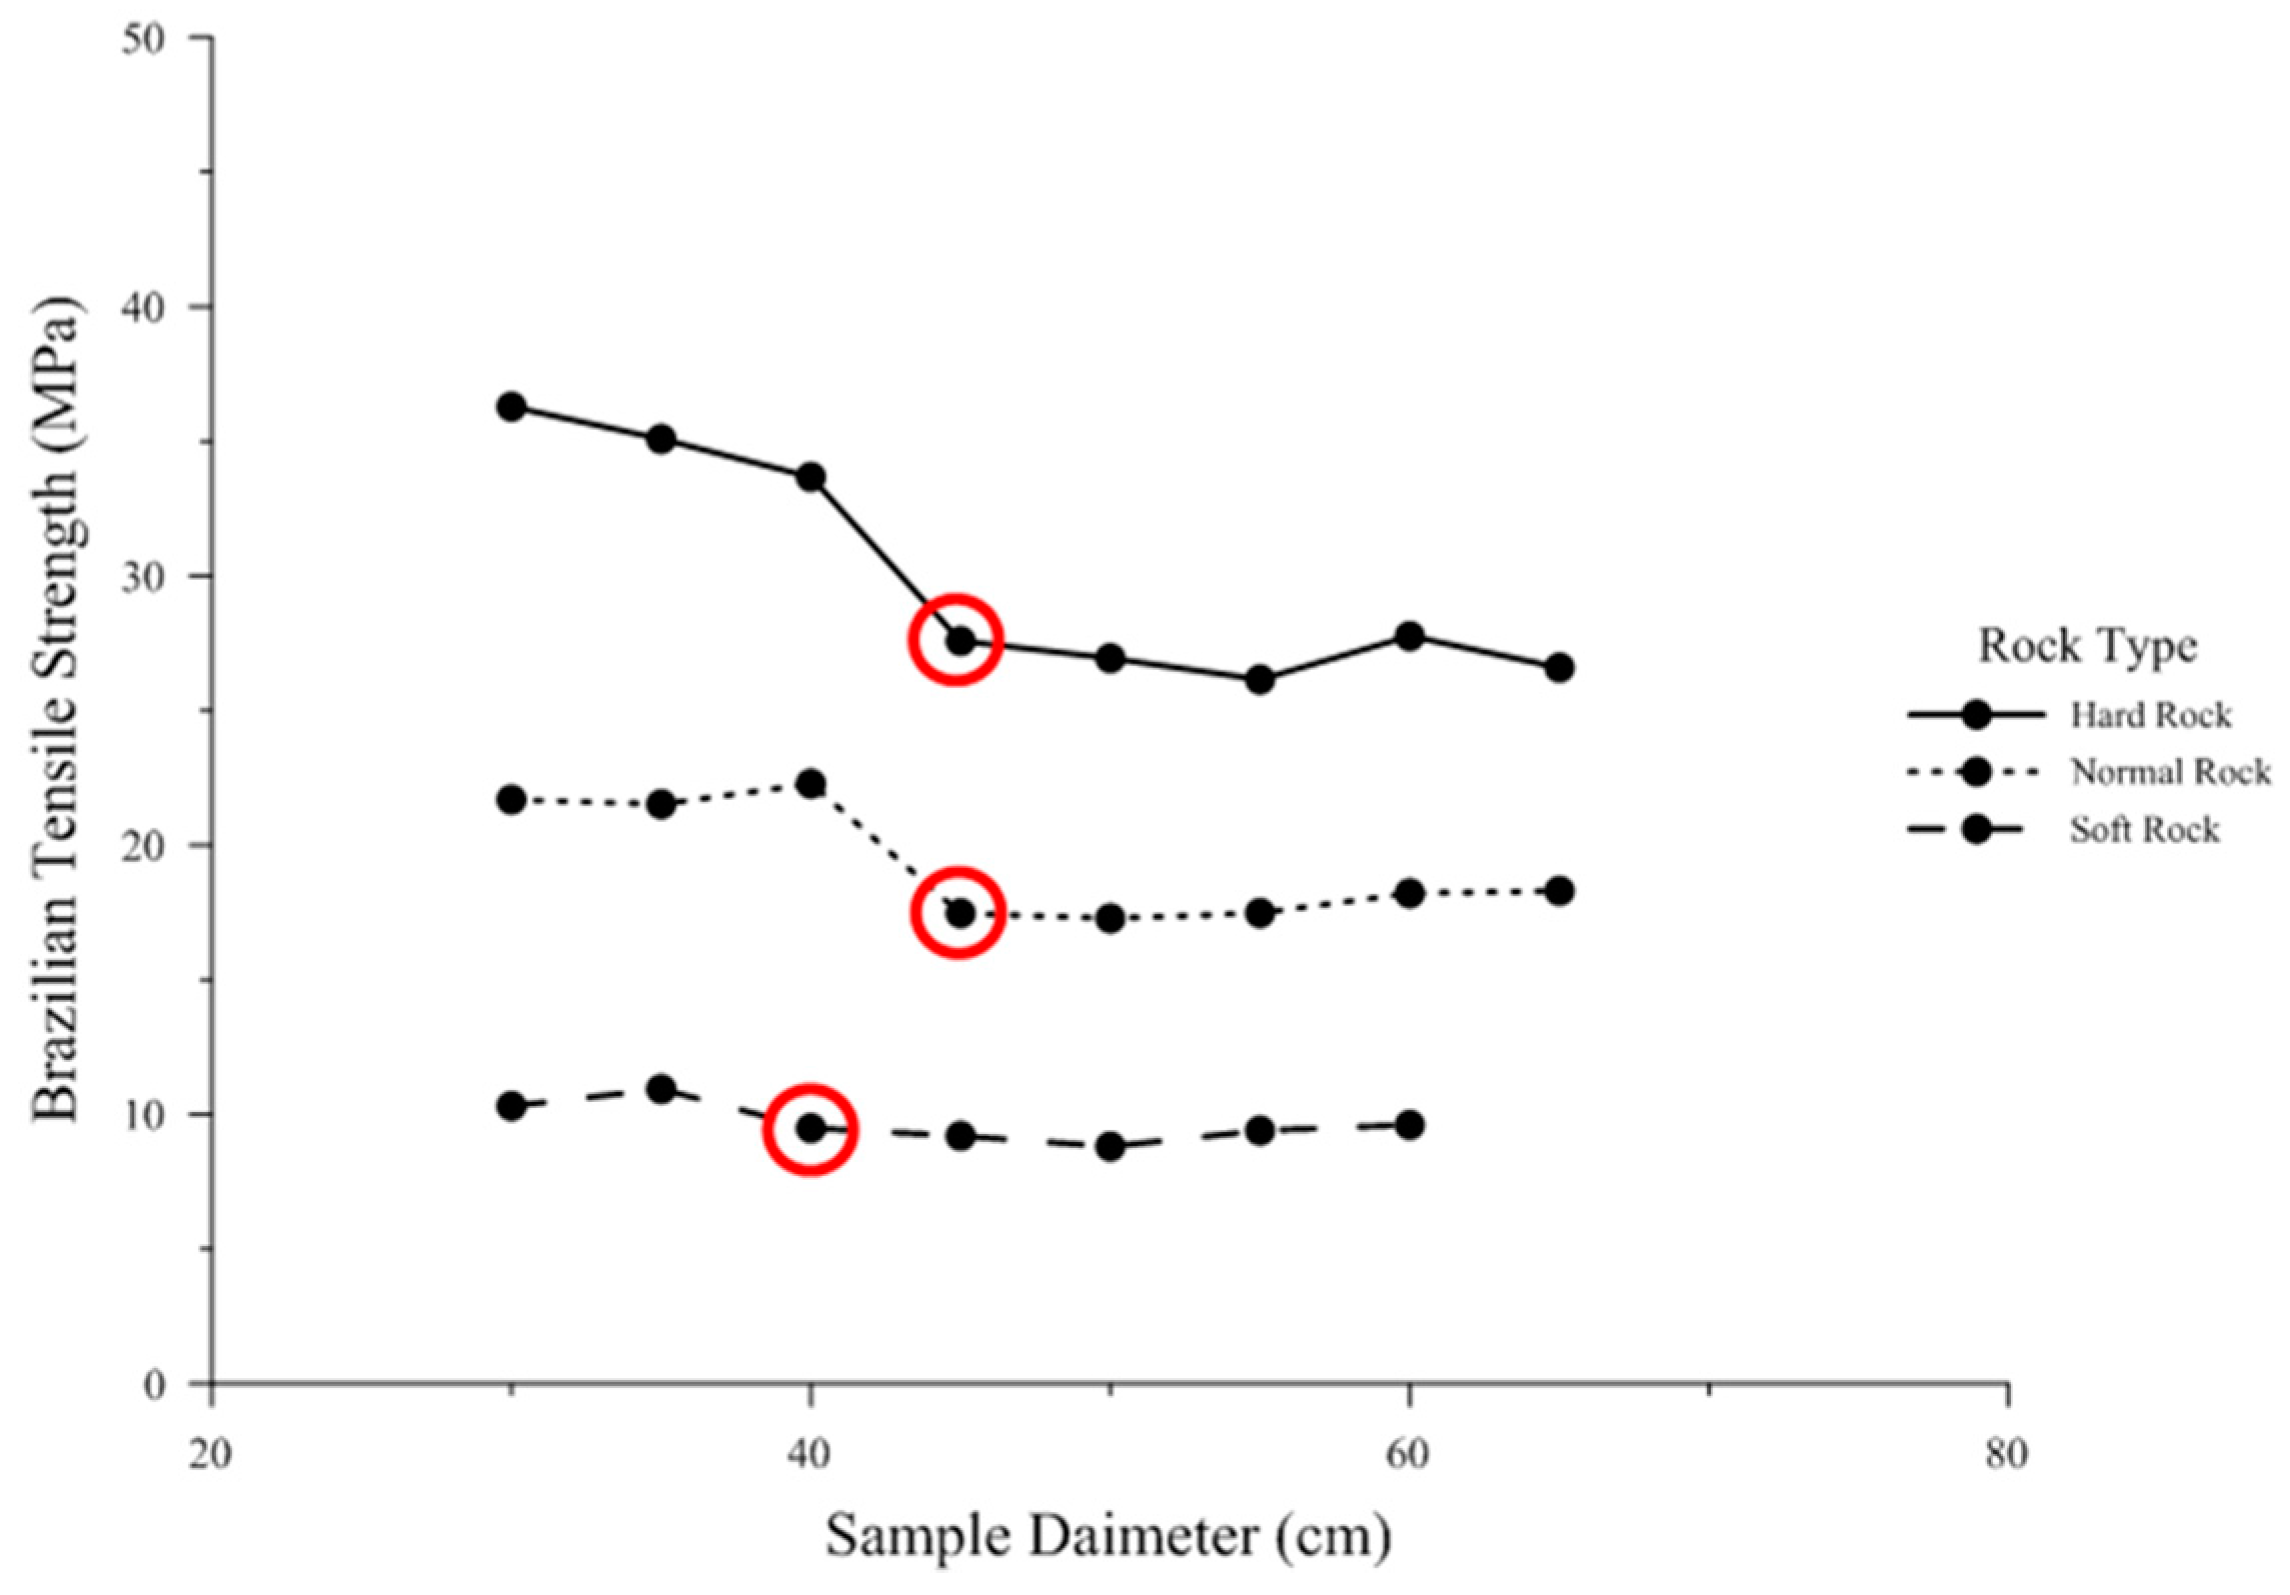
Figure 10, respectively. For each case of intact rock strength (UCS), according to their modulus ratio, the compression tests as well as BTS tests were performed simultaneously by increasing the sample diameter by 5 cm at a time until REV was achieved for both compression and BTS tests. The microscopic parameters, obtained after calibration by performing UCS tests and REV calculations for BTS and compression tests, change with the increase in sample diameter. The values obtained for both compression and BTS tests were then recorded and were used to calculate CoV in each case for a set of five consecutively larger samples. The tests were used to stop conducting when the CoV was calculated to be less than 5% which indicated that the smallest sample of the set of five consecutively larger samples represents REV. Since, the CoV of all UCS tests were obtained to be less than 5%, REV was achieved at 30 cm sample diameter for all the cases when compression tests were performed but, in all the cases of BTS tests, REV was achieved at sample diameter greater than 30 cm. This means that REV is dependent on the BTS tests results more than the compression test results. That is why, the higher sample diameter among the REV results of compression and BTS tests for each case was selected to represent REV of that case. The microscopic parameters related to that sample diameter in each case were then used to simulate the intact rock for conducting the rock splitting process. In
Figure 5,
Figure 6,
Figure 7,
Figure 8,
Figure 9 and
Figure 10, the sample diameter at REV for each case is shown by highlighting the compression and BTS values at that sample diameter in red circles. The importance of performing REV calculations for PFC
2D simulations is that if the microscopic parameters related to any sample size is used for modeling, then the compressive strength and tensile strength of the rock-like material prepared in PFC
2D does not represent the actual compressive and tensile strength of the intact rock intended to be simulated for numerical analysis.
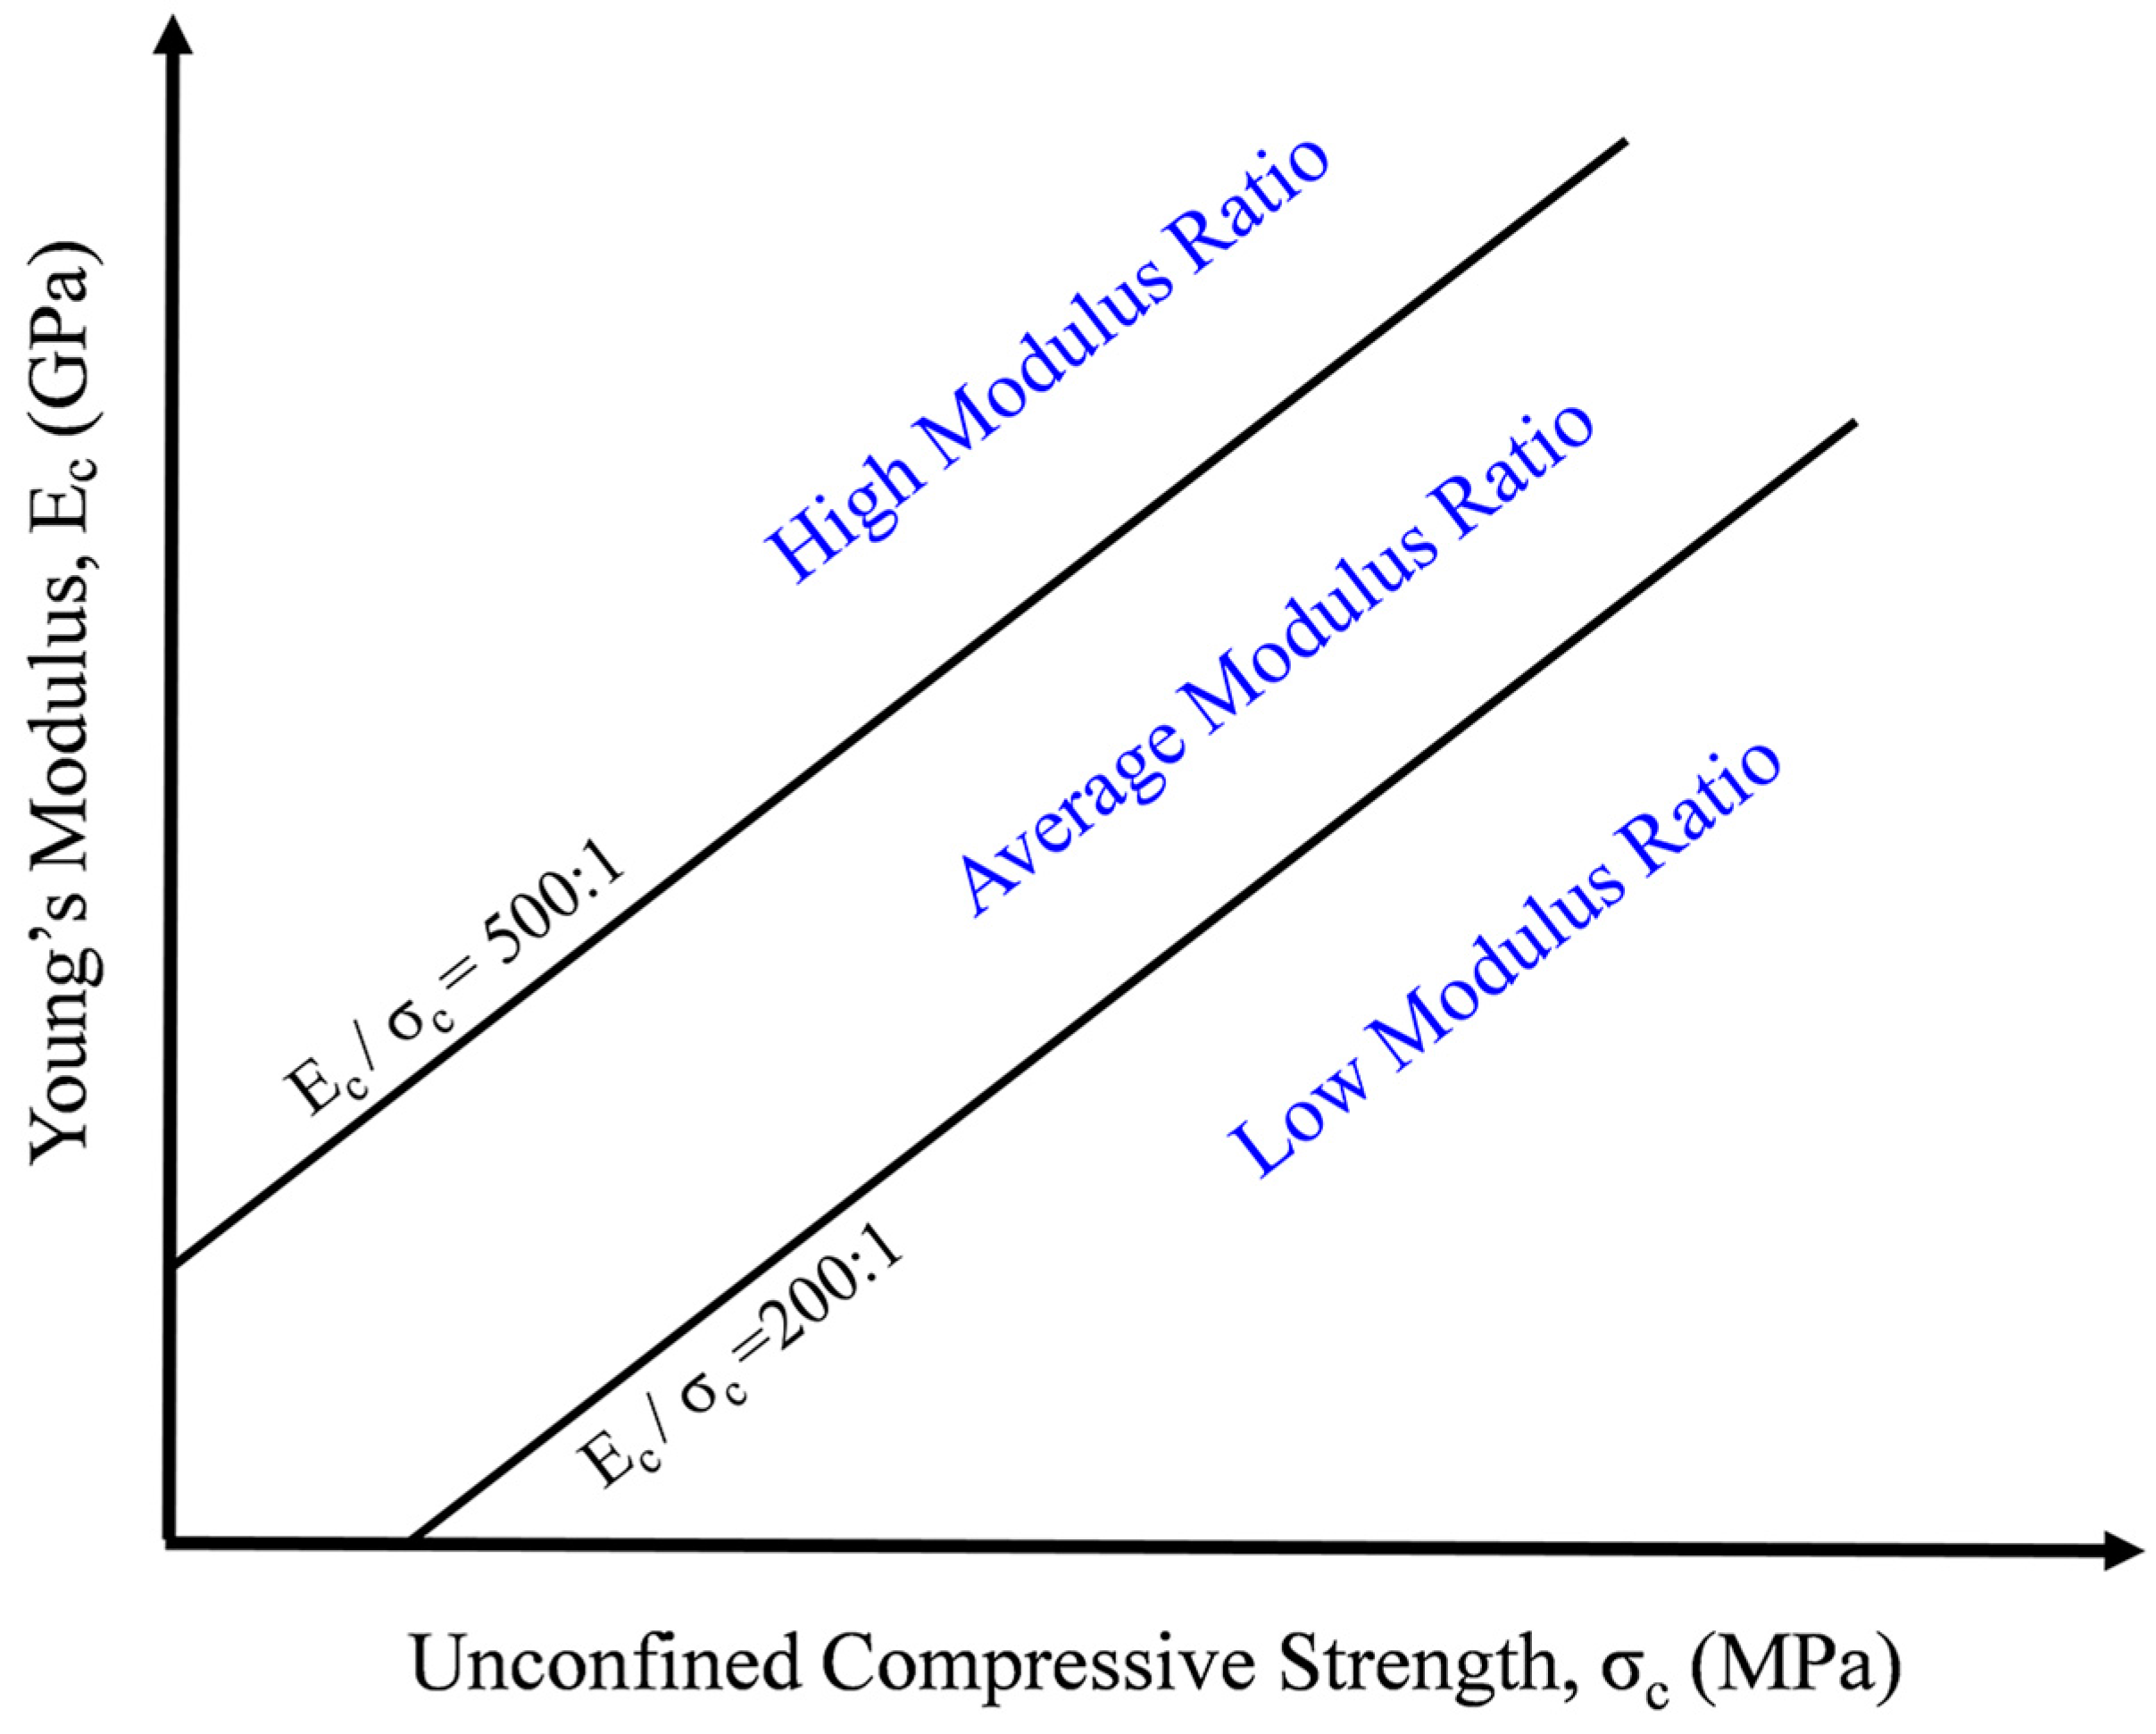
For high modulus ratio, the sample diameters at REV for soft rock, normal rock, and hard rock were obtained as 40, 45 and 45 cm, respectively. For average modulus ratio, the sample diameters at REV for soft rock, normal rock, and hard rock were obtained as 45, 45 and 45 cm, respectively. For low modulus ratio, the sample diameters at REV for soft rock, normal rock, and hard rock were obtained as 45, 50 and 50 cm, respectively. Based on the REV calculations, the values obtained for particle-particle contact Young’s modulus (
Ec) and Young’s modulus of parallel bond (
Ēc) for all types of rocks are presented in
Table 5 and the values obtained for parallel bond normal and shear strength (
and
) for all types of rock are presented in
Table 6.


