

Genetically Predicted Association of 91 Circulating Inflammatory Proteins with Multiple Sclerosis: A Mendelian Randomization Study

Abstract
:1. Introduction
2. Methods
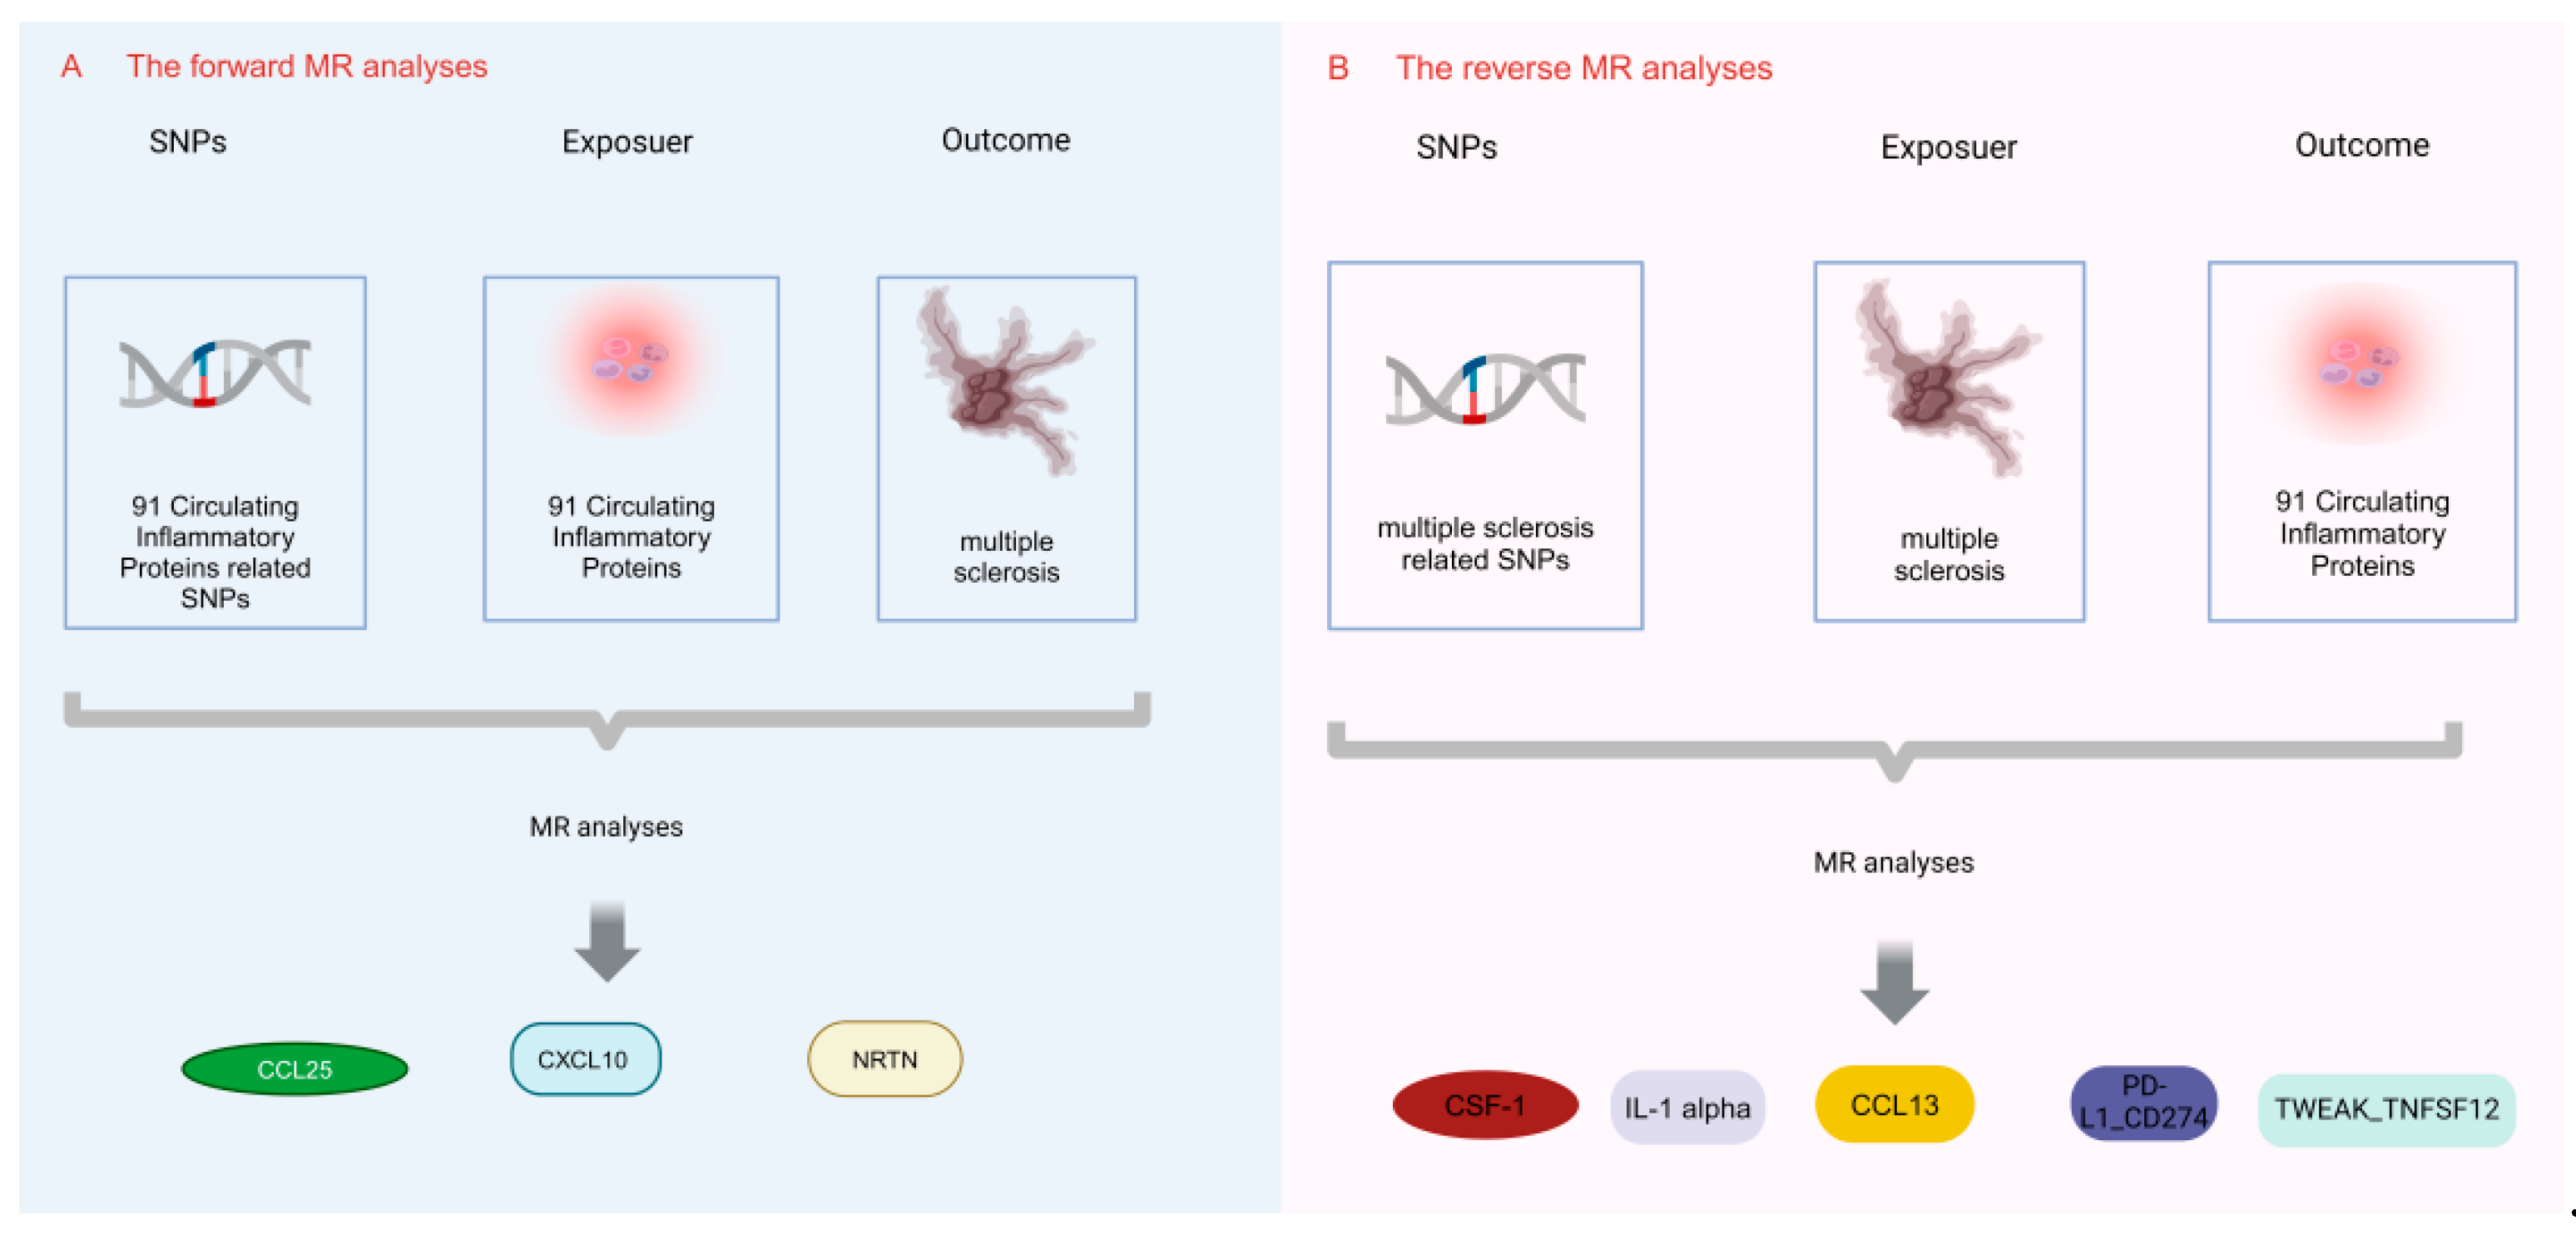
2.1. Study Design
2.2. Selection of IVs for MR Analyses
2.3. Data Sources
2.4. MR and Sensitivity Analysis
3. Results
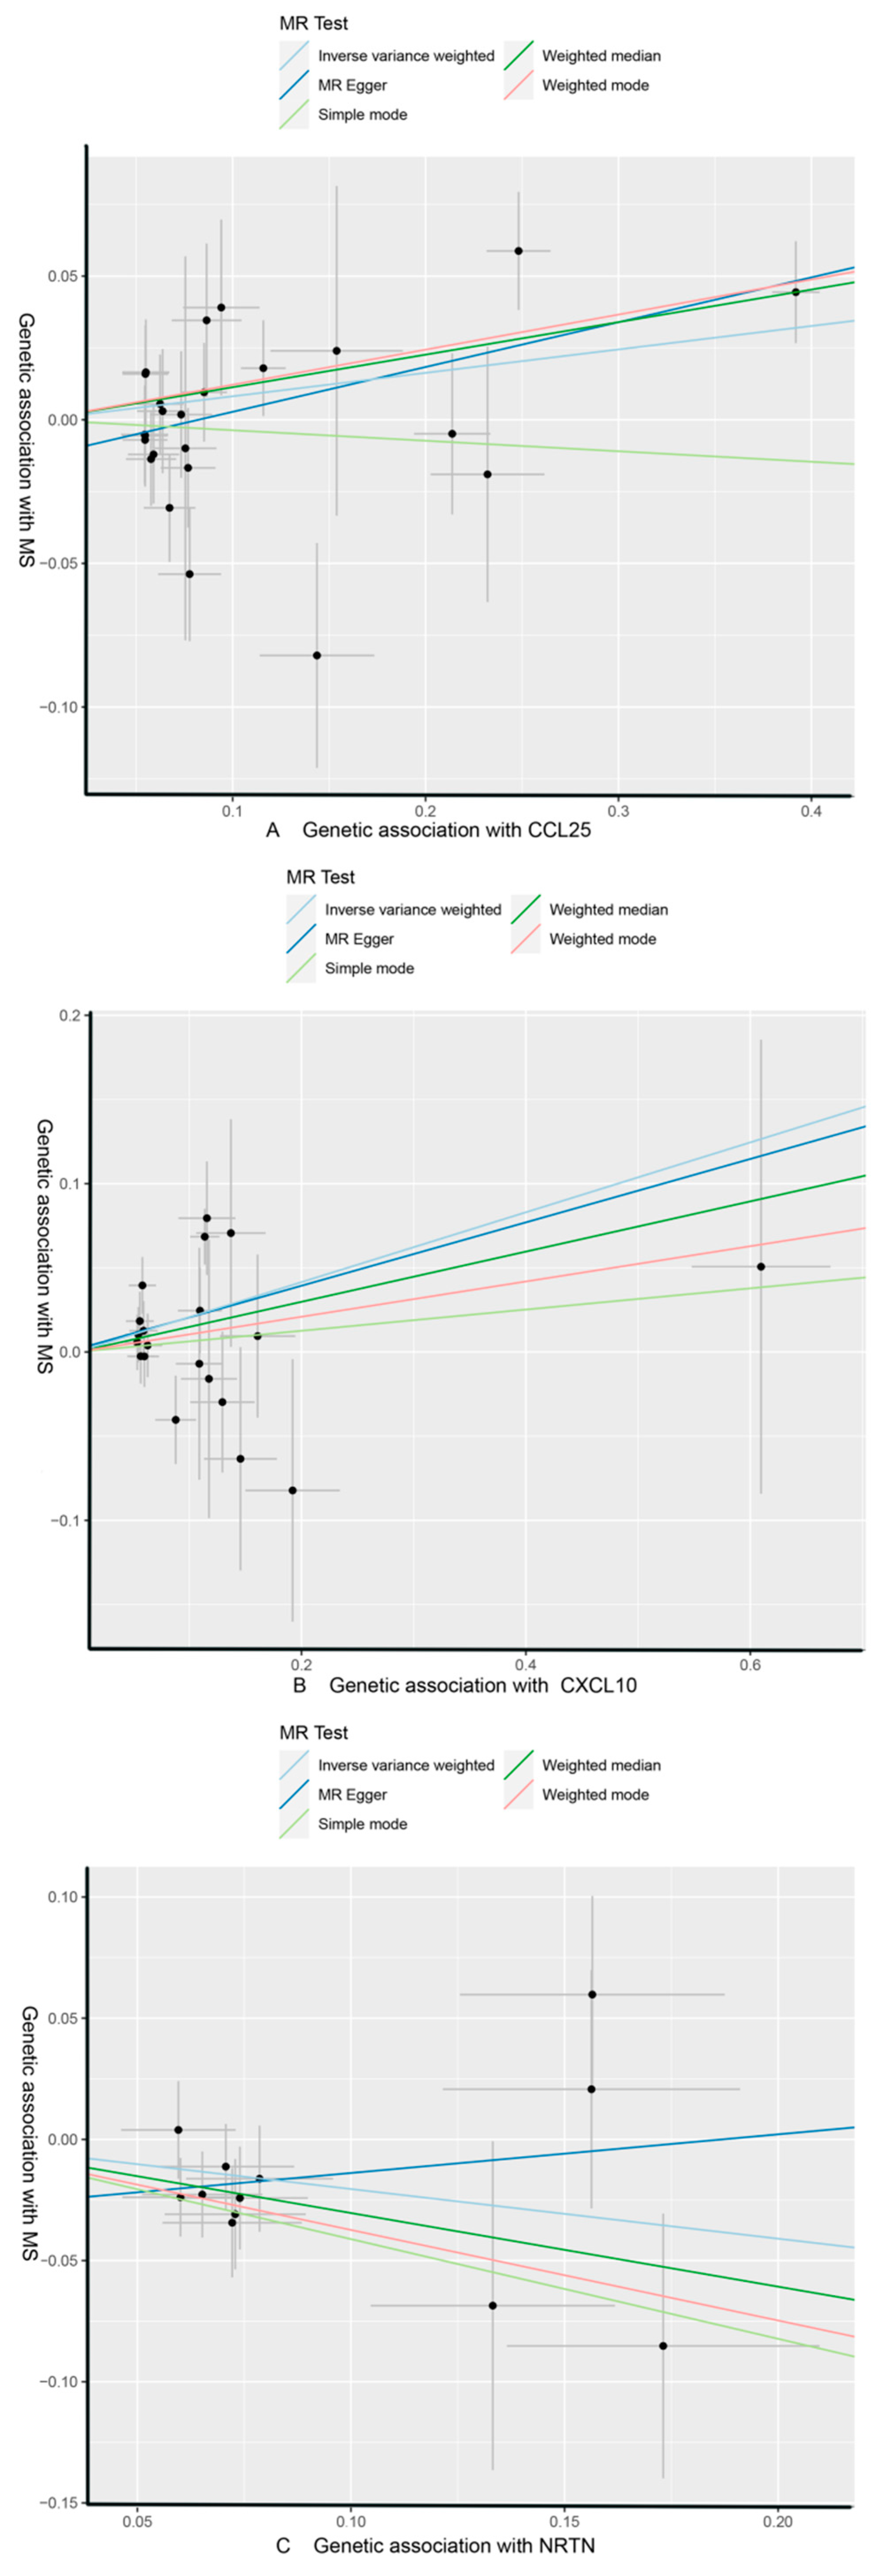
3.1. Effect of 91 Circulating Inflammatory Proteins on MS
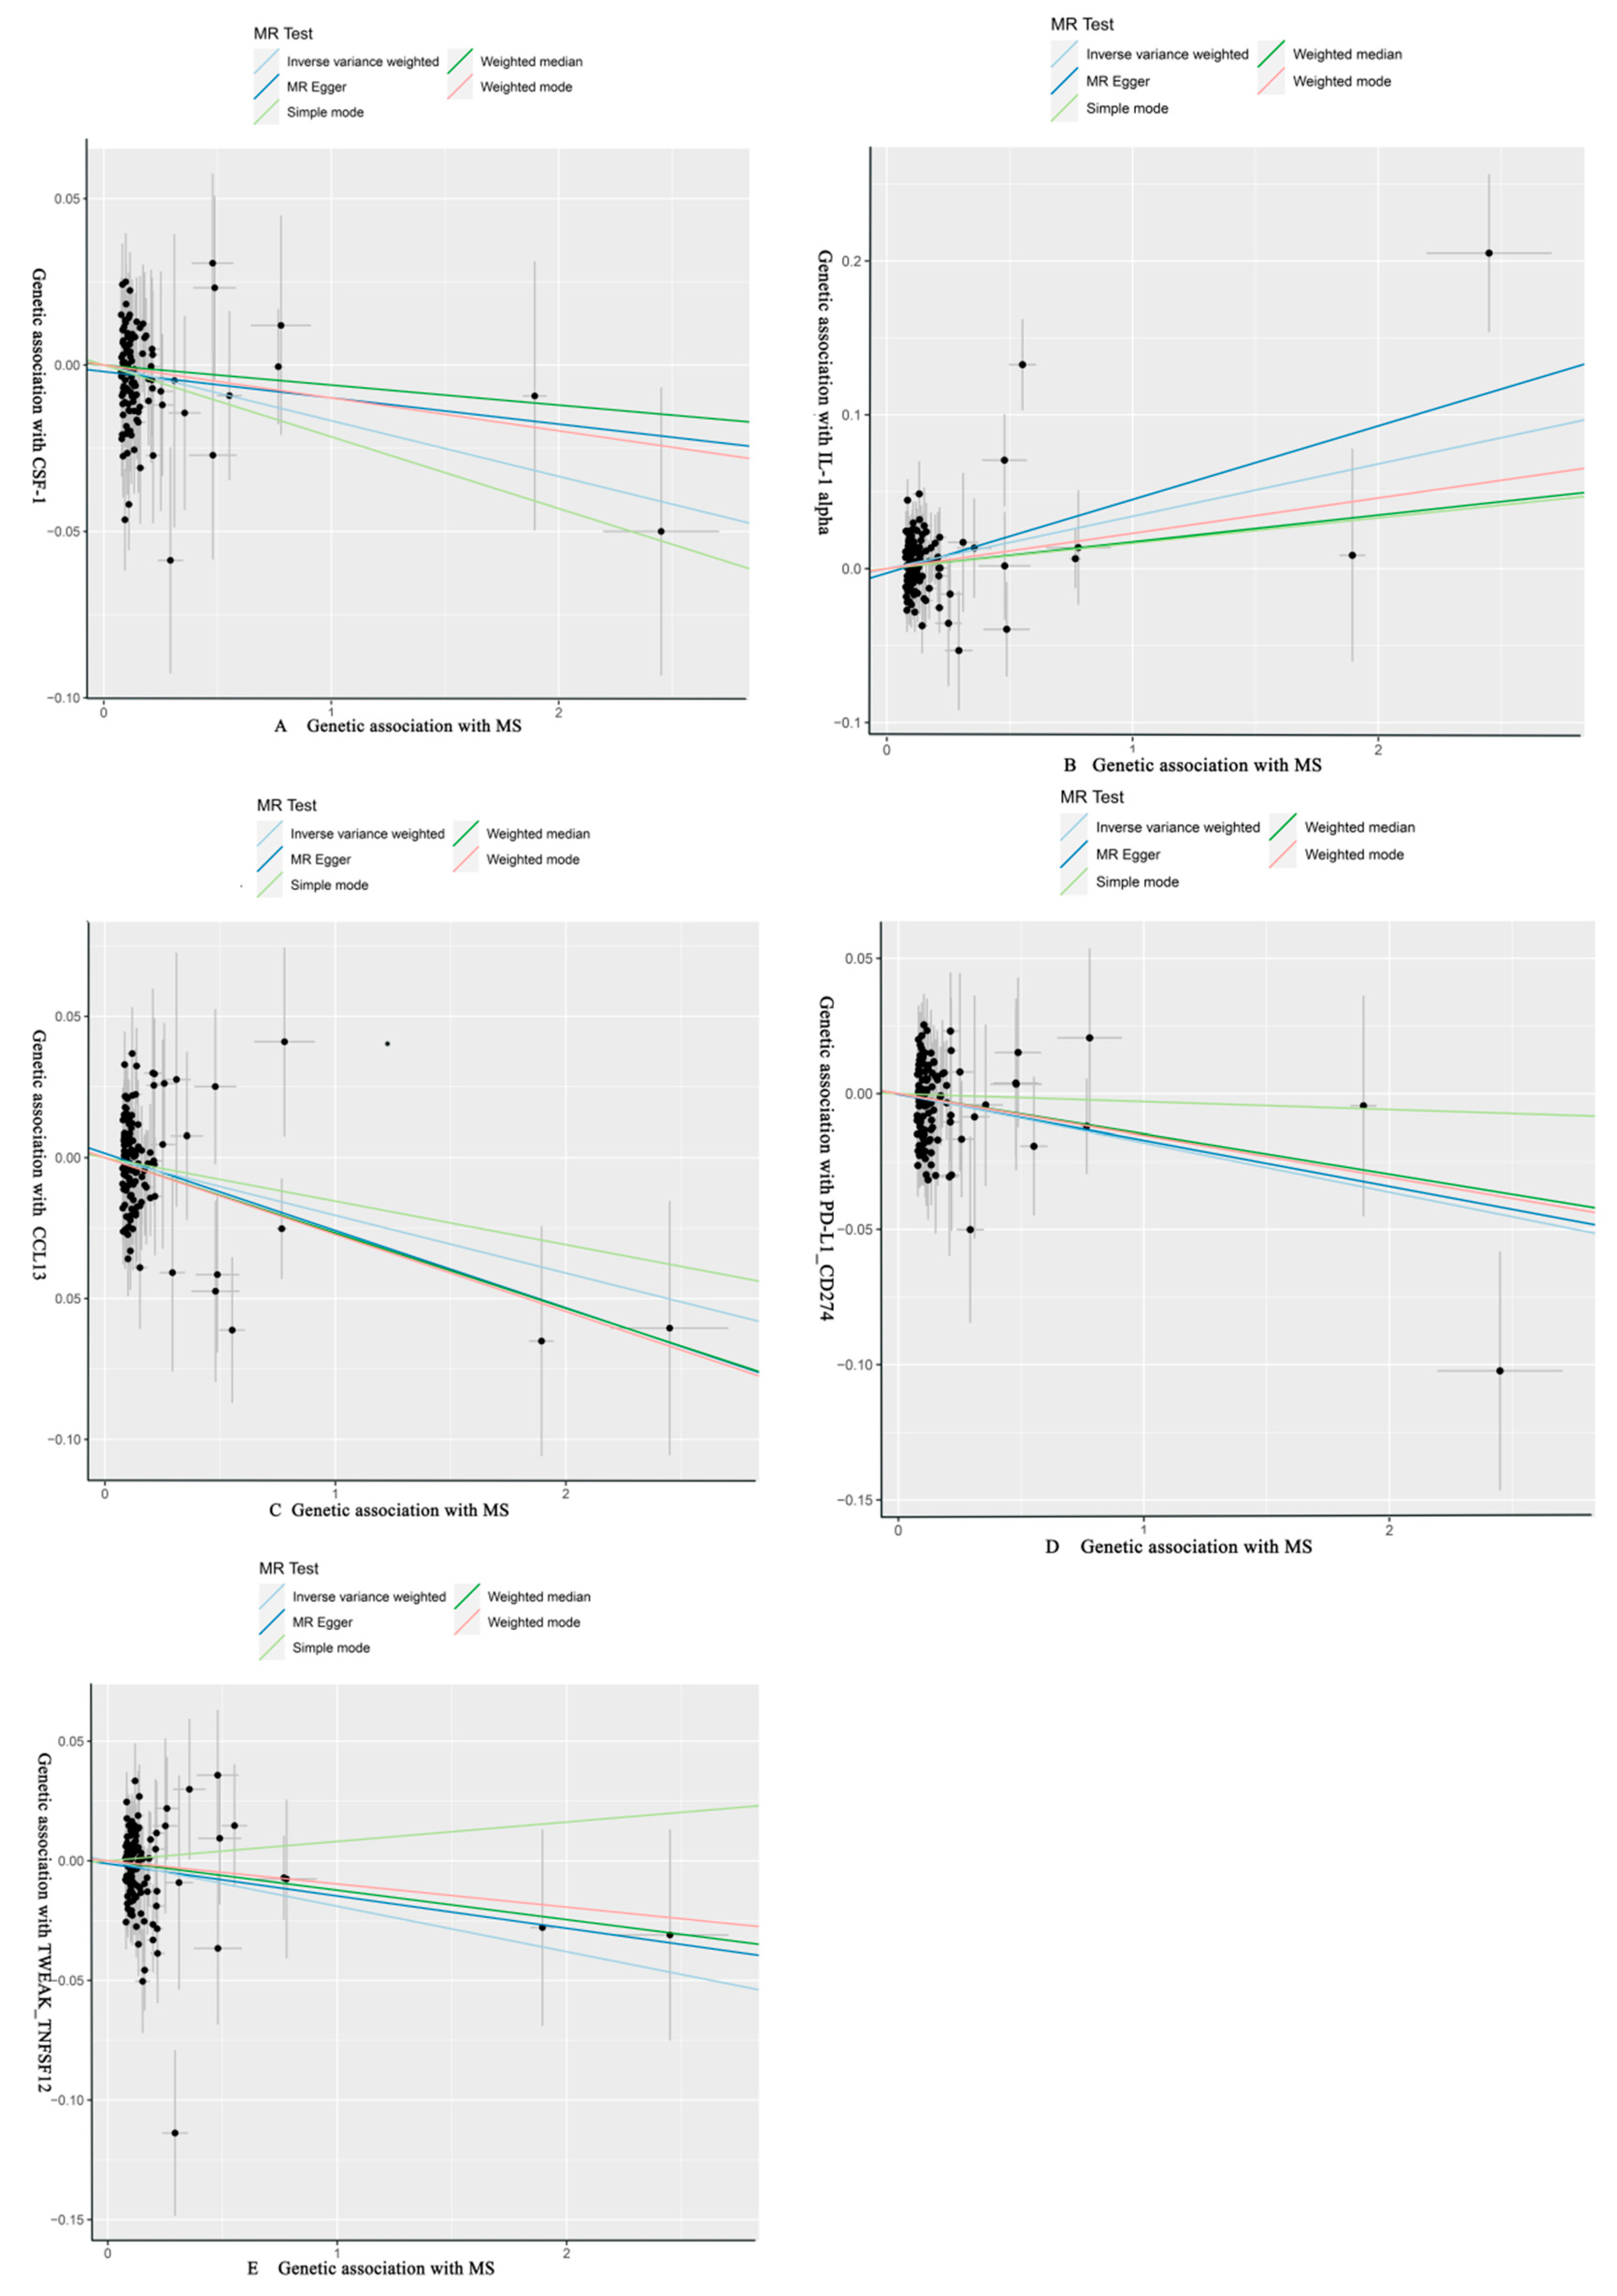
3.2. Effect of MS on 91 Circulating Inflammatory Proteins
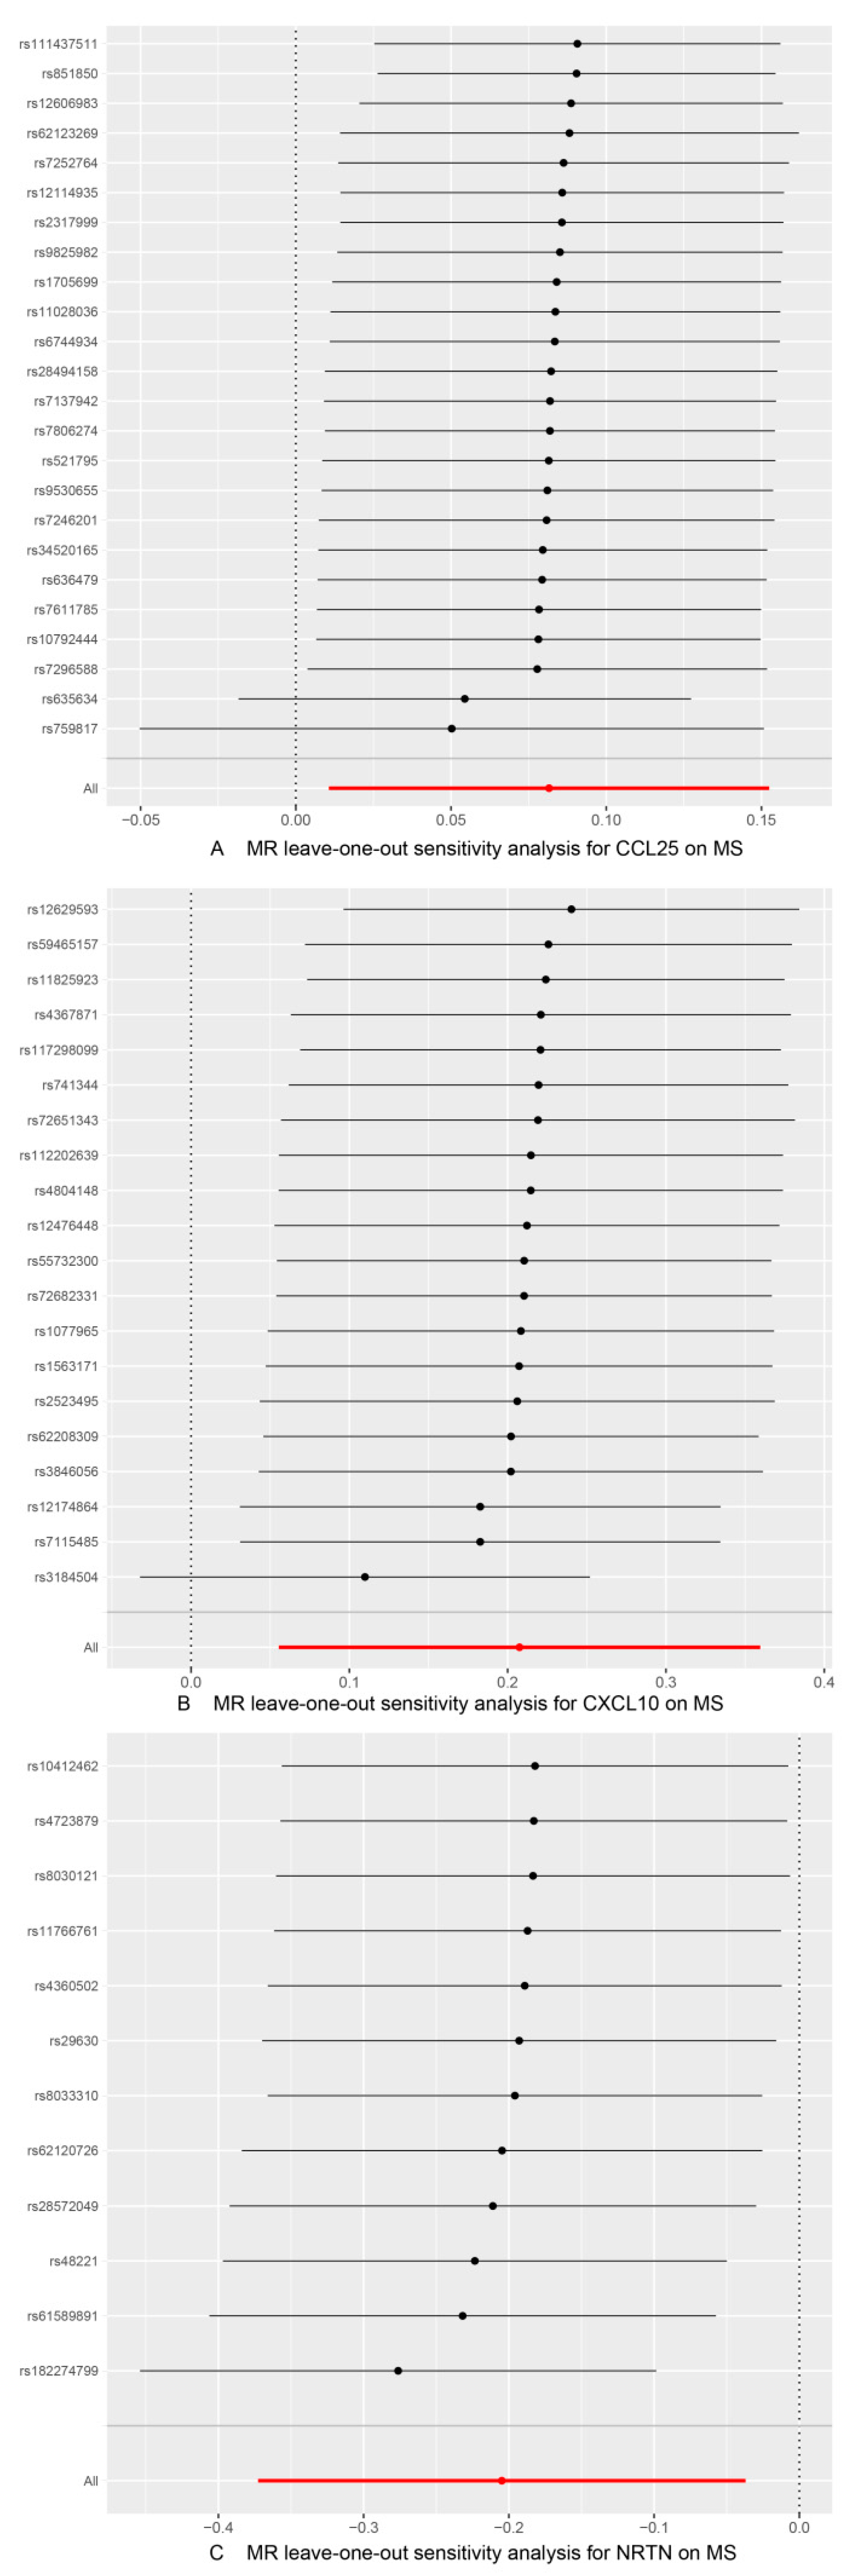
3.3. Sensitivity Analysis
4. Discussion
5. Conclusions
Supplementary Materials
Author Contributions
Funding
Institutional Review Board Statement
Informed Consent Statement
Data Availability Statement
Acknowledgments
Conflicts of Interest
References
- Coclitu, C.; Constantinescu, C.S.; Tanasescu, R. The future of multiple sclerosis treatments. Expert Rev. Neurother. 2016, 16, 1341–1356. [Google Scholar] [CrossRef]
- Harirchian, M.H.; Fatehi, F.; Sarraf, P.; Honarvar, N.M.; Bitarafan, S. Worldwide prevalence of familial multiple sclerosis: A systematic review and meta-analysis. Mult. Scler. Relat. Disord. 2018, 20, 43–47. [Google Scholar] [CrossRef] [PubMed]
- Browne, P.; Chandraratna, D.; Angood, C.; Tremlett, H.; Baker, C.; Taylor, B.V.; Thompson, A.J. Atlas of Multiple Sclerosis 2013: A growing global problem with widespread inequity. Neurology 2014, 83, 1022–1024. [Google Scholar] [CrossRef] [PubMed]
- Mandoj, C.; Renna, R.; Plantone, D.; Sperduti, I.; Cigliana, G.; Conti, L.; Koudriavtseva, T. Anti-annexin antibodies, cholesterol levels and disability in multiple sclerosis. Neurosci. Lett. 2015, 606, 156–160. [Google Scholar] [CrossRef] [PubMed]
- Voumvourakis, K.I.; Fragkou, P.C.; Kitsos, D.K.; Foska, K.; Chondrogianni, M.; Tsiodras, S. Human herpesvirus 6 infection as a trigger of multiple sclerosis: An update of recent literature. BMC Neurol. 2022, 22, 57. [Google Scholar] [CrossRef]
- Kamphuis, W.W.; Derada Troletti, C.; Reijerkerk, A.; Romero, I.A.; de Vries, H.E. The blood-brain barrier in multiple sclerosis: microRNAs as key regulators. CNS Neurol. Disord. Drug Targets 2015, 14, 157–167. [Google Scholar] [CrossRef] [PubMed]
- Garg, N.; Smith, T.W. An update on immunopathogenesis, diagnosis, and treatment of multiple sclerosis. Brain Behav. 2015, 5, e00362. [Google Scholar] [CrossRef]
- Ward, M.; Goldman, M.D. Epidemiology and Pathophysiology of Multiple Sclerosis. Continuum 2022, 28, 988–1005. [Google Scholar] [CrossRef] [PubMed]
- Dutra, R.C.; Moreira, E.L.; Alberti, T.B.; Marcon, R.; Prediger, R.D.; Calixto, J.B. Spatial reference memory deficits precede motor dysfunction in an experimental autoimmune encephalomyelitis model: The role of kallikrein-kinin system. Brain Behav. Immun. 2013, 33, 90–101. [Google Scholar] [CrossRef]
- GBD 2016 Multiple Sclerosis Collaborators. Global, regional, and national burden of multiple sclerosis 1990–2016: A systematic analysis for the Global Burden of Disease Study 2016. Lancet Neurol. 2019, 18, 269–285. [Google Scholar] [CrossRef]
- Walton, C.; King, R.; Rechtman, L.; Kaye, W.; Leray, E.; Marrie, R.A.; Robertson, N.; La Rocca, N.; Uitdehaag, B.; van der Mei, I.; et al. Rising prevalence of multiple sclerosis worldwide: Insights from the Atlas of MS, third edition. Mult. Scler. 2020, 26, 1816–1821. [Google Scholar] [CrossRef] [PubMed]
- Sun, Y.; Yu, H.; Guan, Y. Glia Connect Inflammation and Neurodegeneration in Multiple Sclerosis. Neurosci. Bull. 2023, 39, 466–478. [Google Scholar] [CrossRef] [PubMed]
- Rauf, A.; Badoni, H.; Abu-Izneid, T.; Olatunde, A.; Rahman, M.M.; Painuli, S.; Semwal, P.; Wilairatana, P.; Mubarak, M.S. Neuroinflammatory Markers: Key Indicators in the Pathology of Neurodegenerative Diseases. Molecules 2022, 27, 3194. [Google Scholar] [CrossRef] [PubMed]
- Schain, M.; Kreisl, W.C. Neuroinflammation in Neurodegenerative Disorders-a Review. Curr. Neurol. Neurosci. Rep. 2017, 17, 25. [Google Scholar] [CrossRef] [PubMed]
- Liu, Z.; Cheng, X.; Zhong, S.; Zhang, X.; Liu, C.; Liu, F.; Zhao, C. Peripheral and Central Nervous System Immune Response Crosstalk in Amyotrophic Lateral Sclerosis. Front. Neurosci. 2020, 14, 575. [Google Scholar] [CrossRef] [PubMed]
- Tehrani, A.R.; Gholipour, S.; Sharifi, R.; Yadegari, S.; Abbasi-Kolli, M.; Masoudian, N. Plasma levels of CTRP-3, CTRP-9 and apelin in women with multiple sclerosis. J. Neuroimmunol. 2019, 333, 576968. [Google Scholar] [CrossRef] [PubMed]
- Grzegorski, T.; Iwanowski, P.; Kozubski, W.; Losy, J. The alterations of cerebrospinal fluid TNF-alpha and TGF-beta2 levels in early relapsing-remitting multiple sclerosis. Immunol. Res. 2022, 70, 708–713. [Google Scholar] [CrossRef] [PubMed]
- Evans, D.M.; Davey Smith, G. Mendelian Randomization: New Applications in the Coming Age of Hypothesis-Free Causality. Annu. Rev. Genom. Hum. Genet. 2015, 16, 327–350. [Google Scholar] [CrossRef]
- Davey Smith, G.; Hemani, G. Mendelian randomization: Genetic anchors for causal inference in epidemiological studies. Hum. Mol. Genet. 2014, 23, R89–R98. [Google Scholar] [CrossRef]
- Emdin, C.A.; Khera, A.V.; Kathiresan, S. Mendelian Randomization. Jama 2017, 318, 1925–1926. [Google Scholar] [CrossRef] [PubMed]
- Larsson, S.C.; Butterworth, A.S.; Burgess, S. Mendelian randomization for cardiovascular diseases: Principles and applications. Eur. Heart J. 2023, 44, 4913–4924. [Google Scholar] [CrossRef]
- Teumer, A.; Chaker, L.; Groeneweg, S.; Li, Y.; Di Munno, C.; Barbieri, C.; Schultheiss, U.T.; Traglia, M.; Ahluwalia, T.S.; Akiyama, M.; et al. Genome-wide analyses identify a role for SLC17A4 and AADAT in thyroid hormone regulation. Nat. Commun. 2018, 9, 4455. [Google Scholar] [CrossRef]
- Shungin, D.; Winkler, T.W.; Croteau-Chonka, D.C.; Ferreira, T.; Locke, A.E.; Mägi, R.; Strawbridge, R.J.; Pers, T.H.; Fischer, K.; Justice, A.E.; et al. New genetic loci link adipose and insulin biology to body fat distribution. Nature 2015, 518, 187–196. [Google Scholar] [CrossRef] [PubMed]
- International Multiple Sclerosis Genetics Consortium. Multiple sclerosis genomic map implicates peripheral immune cells and microglia in susceptibility. Science 2019, 365, eaav7188. [Google Scholar] [CrossRef]
- Zhao, J.H.; Stacey, D.; Eriksson, N.; Macdonald-Dunlop, E.; Hedman, Å.K.; Kalnapenkis, A.; Enroth, S.; Cozzetto, D.; Digby-Bell, J.; Marten, J.; et al. Genetics of circulating inflammatory proteins identifies drivers of immune-mediated disease risk and therapeutic targets. Nat. Immunol. 2023, 24, 1540–1551. [Google Scholar] [CrossRef]
- Bowden, J.; Davey Smith, G.; Burgess, S. Mendelian randomization with invalid instruments: Effect estimation and bias detection through Egger regression. Int. J. Epidemiol. 2015, 44, 512–525. [Google Scholar] [CrossRef]
- Bowden, J.; Davey Smith, G.; Haycock, P.C.; Burgess, S. Consistent Estimation in Mendelian Randomization with Some Invalid Instruments Using a Weighted Median Estimator. Genet. Epidemiol. 2016, 40, 304–314. [Google Scholar] [CrossRef] [PubMed]
- Burgess, S.; Scott, R.A.; Timpson, N.J.; Davey Smith, G.; Thompson, S.G. Using published data in Mendelian randomization: A blueprint for efficient identification of causal risk factors. Eur. J. Epidemiol. 2015, 30, 543–552. [Google Scholar] [CrossRef] [PubMed]
- Burgess, S.; Butterworth, A.; Thompson, S.G. Mendelian randomization analysis with multiple genetic variants using summarized data. Genet. Epidemiol. 2013, 37, 658–665. [Google Scholar] [CrossRef]
- Hartwig, F.P.; Davey Smith, G.; Bowden, J. Robust inference in summary data Mendelian randomization via the zero modal pleiotropy assumption. Int. J. Epidemiol. 2017, 46, 1985–1998. [Google Scholar] [CrossRef] [PubMed]
- Glickman, M.E.; Rao, S.R.; Schultz, M.R. False discovery rate control is a recommended alternative to Bonferroni-type adjustments in health studies. J. Clin. Epidemiol. 2014, 67, 850–857. [Google Scholar] [CrossRef] [PubMed]
- Burgess, S.; Davey Smith, G.; Davies, N.M.; Dudbridge, F.; Gill, D.; Glymour, M.M.; Hartwig, F.P.; Kutalik, Z.; Holmes, M.V.; Minelli, C.; et al. Guidelines for performing Mendelian randomization investigations: Update for summer 2023. Wellcome Open Res. 2019, 4, 186. [Google Scholar] [CrossRef]
- Burgess, S.; Dudbridge, F.; Thompson, S.G. Combining information on multiple instrumental variables in Mendelian randomization: Comparison of allele score and summarized data methods. Stat. Med. 2016, 35, 1880–1906. [Google Scholar] [CrossRef]
- Yavorska, O.O.; Burgess, S. MendelianRandomization: An R package for performing Mendelian randomization analyses using summarized data. Int. J. Epidemiol. 2017, 46, 1734–1739. [Google Scholar] [CrossRef]
- Slob, E.A.W.; Burgess, S. A comparison of robust Mendelian randomization methods using summary data. Genet. Epidemiol. 2020, 44, 313–329. [Google Scholar] [CrossRef]
- Greco, M.F.; Minelli, C.; Sheehan, N.A.; Thompson, J.R. Detecting pleiotropy in Mendelian randomisation studies with summary data and a continuous outcome. Stat. Med. 2015, 34, 2926–2940. [Google Scholar] [CrossRef]
- Burgess, S.; Bowden, J.; Fall, T.; Ingelsson, E.; Thompson, S.G. Sensitivity Analyses for Robust Causal Inference from Mendelian Randomization Analyses with Multiple Genetic Variants. Epidemiology 2017, 28, 30–42. [Google Scholar] [CrossRef]
- Hemani, G.; Tilling, K.; Davey Smith, G. Orienting the causal relationship between imprecisely measured traits using GWAS summary data. PLoS Genet. 2017, 13, e1007081. [Google Scholar]
- Huang, J.; Khademi, M.; Fugger, L.; Lindhe, Ö.; Novakova, L.; Axelsson, M.; Malmeström, C.; Constantinescu, C.; Lycke, J.; Piehl, F.; et al. Inflammation-related plasma and CSF biomarkers for multiple sclerosis. Proc. Natl. Acad. Sci. USA 2020, 117, 12952–12960. [Google Scholar] [CrossRef]
- Ruiz, F.; Vigne, S.; Pot, C. Resolution of inflammation during multiple sclerosis. Semin. Immunopathol. 2019, 41, 711–726. [Google Scholar] [CrossRef] [PubMed]
- Pegoretti, V.; Swanson, K.A.; Bethea, J.R.; Probert, L.; Eisel, U.L.M.; Fischer, R. Inflammation and Oxidative Stress in Multiple Sclerosis: Consequences for Therapy Development. Oxidative Med. Cell. Longev. 2020, 2020, 7191080. [Google Scholar] [CrossRef]
- Jank, L.; Bhargava, P. Relationship Between Multiple Sclerosis, Gut Dysbiosis, and Inflammation: Considerations for Treatment. Neurol. Clin. 2024, 42, 55–76. [Google Scholar] [CrossRef]
- Kuhlmann, T.; Ludwin, S.; Prat, A.; Antel, J.; Brück, W.; Lassmann, H. An updated histological classification system for multiple sclerosis lesions. Acta Neuropathol. 2017, 133, 13–24. [Google Scholar] [CrossRef] [PubMed]
- Popescu, B.F.; Lucchinetti, C.F. Meningeal and cortical grey matter pathology in multiple sclerosis. BMC Neurol. 2012, 12, 11. [Google Scholar] [CrossRef]
- Hedegaard, C.J.; Krakauer, M.; Bendtzen, K.; Lund, H.; Sellebjerg, F.; Nielsen, C.H. T helper cell type 1 (Th1), Th2 and Th17 responses to myelin basic protein and disease activity in multiple sclerosis. Immunology 2008, 125, 161–169. [Google Scholar] [CrossRef]
- Fahmi, R.M.; Ramadan, B.M.; Salah, H.; Elsaid, A.F.; Shehta, N. Neutrophil-lymphocyte ratio as a marker for disability and activity in multiple sclerosis. Mult. Scler. Relat. Disord. 2021, 51, 102921. [Google Scholar] [CrossRef]
- Meuth, S.G.; Simon, O.J.; Grimm, A.; Melzer, N.; Herrmann, A.M.; Spitzer, P.; Landgraf, P.; Wiendl, H. CNS inflammation and neuronal degeneration is aggravated by impaired CD200-CD200R-mediated macrophage silencing. J. Neuroimmunol. 2008, 194, 62–69. [Google Scholar] [CrossRef]
- Qiuping, Z.; Jei, X.; Youxin, J.; Wei, J.; Chun, L.; Jin, W.; Qun, W.; Yan, L.; Chunsong, H.; Mingzhen, Y.; et al. CC chemokine ligand 25 enhances resistance to apoptosis in CD4+ T cells from patients with T-cell lineage acute and chronic lymphocytic leukemia by means of livin activation. Cancer Res. 2004, 64, 7579–7587. [Google Scholar] [CrossRef]
- Wu, X.; Sun, M.; Yang, Z.; Lu, C.; Wang, Q.; Wang, H.; Deng, C.; Liu, Y.; Yang, Y. The Roles of CCR9/CCL25 in Inflammation and Inflammation-Associated Diseases. Front. Cell Dev. Biol. 2021, 9, 686548. [Google Scholar] [CrossRef] [PubMed]
- Wu, W.; Doan, N.; Said, J.; Karunasiri, D.; Pullarkat, S.T. Strong expression of chemokine receptor CCR9 in diffuse large B-cell lymphoma and follicular lymphoma strongly correlates with gastrointestinal involvement. Hum. Pathol. 2014, 45, 1451–1458. [Google Scholar] [CrossRef] [PubMed]
- Kalindjian, S.B.; Kadnur, S.V.; Hewson, C.A.; Venkateshappa, C.; Juluri, S.; Kristam, R.; Kulkarni, B.; Mohammed, Z.; Saxena, R.; Viswanadhan, V.N.; et al. A New Series of Orally Bioavailable Chemokine Receptor 9 (CCR9) Antagonists; Possible Agents for the Treatment of Inflammatory Bowel Disease. J. Med. Chem. 2016, 59, 3098–3111. [Google Scholar] [CrossRef]
- Zhang, Y.; Han, J.; Wu, M.; Xu, L.; Wang, Y.; Yuan, W.; Hua, F.; Fan, H.; Dong, F.; Qu, X.; et al. Toll-Like Receptor 4 Promotes Th17 Lymphocyte Infiltration Via CCL25/CCR9 in Pathogenesis of Experimental Autoimmune Encephalomyelitis. J. Neuroimmune Pharmacol. 2019, 14, 493–502. [Google Scholar] [CrossRef] [PubMed]
- Braitch, M.; Constantinescu, C.S. The role of osteopontin in experimental autoimmune encephalomyelitis (EAE) and multiple sclerosis (MS). Inflamm. Allergy Drug Targets 2010, 9, 249–256. [Google Scholar] [CrossRef]
- Tubo, N.J.; Wurbel, M.A.; Charvat, T.T.; Schall, T.J.; Walters, M.J.; Campbell, J.J. A systemically-administered small molecule antagonist of CCR9 acts as a tissue-selective inhibitor of lymphocyte trafficking. PLoS ONE 2012, 7, e50498. [Google Scholar] [CrossRef]
- Trivedi, P.J.; Schmidt, C.; Bruns, T. Letter: The therapeutic potential of targeting CCL25/CCR9 in colonic inflammatory bowel disease-reading between the lines. Aliment. Pharmacol. Ther. 2016, 44, 307–308. [Google Scholar] [CrossRef] [PubMed]
- Vazirinejad, R.; Ahmadi, Z.; Kazemi Arababadi, M.; Hassanshahi, G.; Kennedy, D. The biological functions, structure and sources of CXCL10 and its outstanding part in the pathophysiology of multiple sclerosis. Neuroimmunomodulation 2014, 21, 322–330. [Google Scholar] [CrossRef]
- Sørensen, T.L.; Tani, M.; Jensen, J.; Pierce, V.; Lucchinetti, C.; Folcik, V.A.; Qin, S.; Rottman, J.; Sellebjerg, F.; Strieter, R.M.; et al. Expression of specific chemokines and chemokine receptors in the central nervous system of multiple sclerosis patients. J. Clin. Investig. 1999, 103, 807–815. [Google Scholar] [CrossRef] [PubMed]
- Simpson, J.E.; Newcombe, J.; Cuzner, M.L.; Woodroofe, M.N. Expression of the interferon-gamma-inducible chemokines IP-10 and Mig and their receptor, CXCR3, in multiple sclerosis lesions. Neuropathol. Appl. Neurobiol. 2000, 26, 133–142. [Google Scholar] [CrossRef]
- Balashov, K.E.; Rottman, J.B.; Weiner, H.L.; Hancock, W.W. CCR5(+) and CXCR3(+) T cells are increased in multiple sclerosis and their ligands MIP-1alpha and IP-10 are expressed in demyelinating brain lesions. Proc. Natl. Acad. Sci. USA 1999, 96, 6873–6878. [Google Scholar] [CrossRef]
- Sørensen, T.L.; Sellebjerg, F.; Jensen, C.V.; Strieter, R.M.; Ransohoff, R.M. Chemokines CXCL10 and CCL2: Differential involvement in intrathecal inflammation in multiple sclerosis. Eur. J. Neurol. 2001, 8, 665–672. [Google Scholar] [CrossRef]
- Comini-Frota, E.R.; Teixeira, A.L.; Angelo, J.P.; Andrade, M.V.; Brum, D.G.; Kaimen-Maciel, D.R.; Foss, N.T.; Donadi, E.A. Evaluation of serum levels of chemokines during interferon-β treatment in multiple sclerosis patients: A 1-year, observational cohort study. CNS Drugs 2011, 25, 971–981. [Google Scholar] [CrossRef] [PubMed]
- Yan, Q.; Elliott, J.; Snider, W.D. Brain-derived neurotrophic factor rescues spinal motor neurons from axotomy-induced cell death. Nature 1992, 360, 753–755. [Google Scholar] [CrossRef] [PubMed]
- Mo, L.; Yang, Z.; Zhang, A.; Li, X. The repair of the injured adult rat hippocampus with NT-3-chitosan carriers. Biomaterials 2010, 31, 2184–2192. [Google Scholar] [CrossRef] [PubMed]
- Rosenberg, S.S.; Ng, B.K.; Chan, J.R. The quest for remyelination: A new role for neurotrophins and their receptors. Brain Pathol. 2006, 16, 288–294. [Google Scholar] [CrossRef] [PubMed]
- McTigue, D.M.; Horner, P.J.; Stokes, B.T.; Gage, F.H. Neurotrophin-3 and brain-derived neurotrophic factor induce oligodendrocyte proliferation and myelination of regenerating axons in the contused adult rat spinal cord. J. Neurosci. 1998, 18, 5354–5365. [Google Scholar] [CrossRef]
- Baudet, C.; Pozas, E.; Adameyko, I.; Andersson, E.; Ericson, J.; Ernfors, P. Retrograde signaling onto Ret during motor nerve terminal maturation. J. Neurosci. 2008, 28, 963–975. [Google Scholar] [CrossRef]


| Number | Abbreviations | Full Name | ID |
|---|---|---|---|
| 1 | CXCL9 | Chemokine (C-X-C motif) ligand 9 | GCST90274784 |
| 2 | TWEAK_TNFSF12 | Tumor Necrosis Factor-like Weak Inducer of Apoptosis—Tumor Necrosis Factor Superfamily Member 12 | GCST90274846 |
| 3 | CCL23 | Chemokine (C-C motif) ligand 23 | GCST90274767 |
| 4 | ADA | Adenosine Deaminase | GCST90274759 |
| 5 | CASP-8 | Caspase-8 | GCST90274763 |
| 6 | CXCL6 | Chemokine (C-X-C motif) ligand 6 | GCST90274783 |
| 7 | PD-L1_CD274 | Programmed Cell Death 1 Ligand 1-Cluster of Differentiation 274 | GCST90274832 |
| 8 | IL-15RA | Interleukin-15 Receptor Alpha | GCST90274800 |
| 9 | IL-1 alpha | Interleukin-1 alpha | GCST90274805 |
| 10 | CST5 | Cystatin 5 | GCST90274777 |
| 11 | IL-10 | Interleukin-10 | GCST90274795 |
| 12 | IL-10RA | Interleukin-10 Receptor Alpha | GCST90274796 |
| 13 | NTF3 | Neurotrophin 3 | GCST90274829 |
| 14 | IL-12B | Interleukin-12B | GCST90274798 |
| 15 | IL-33 | Interleukin-33 | GCST90274812 |
| 16 | CCL13 | Chemokine (C-C motif) ligand 13 | GCST90274824 |
| 17 | OPG_TNFRSF11B | Osteoprotegerin—Tumor Necrosis Factor Receptor Superfamily Member 11B | GCST90274830 |
| 18 | IL-4 | Interleukin-4 | GCST90274813 |
| 19 | LIF | Leukemia Inhibitory Factor | GCST90274819 |
| 20 | FIt3L | Fms-related tyrosine kinase 3 ligand | GCST90274791 |
| 21 | TNFRSF9 | Tumor Necrosis Factor Receptor Superfamily Member 9 | GCST90274841 |
| 22 | IL-5 | Interleukin-5 | GCST90274814 |
| 23 | DNER | Delta/Notch-like EGF repeat-containing receptor | GCST90274785 |
| 24 | CCL20 | Chemokine (C-C motif) ligand 20 | GCST90274766 |
| 25 | TNFSF14 | Tumor Necrosis Factor Superfamily Member 14 | GCST90274842 |
| 26 | IL-6 | Interleukin-6 | GCST90274815 |
| 27 | CCL19 | Chemokine (C-C motif) ligand 19 | GCST90274765 |
| 28 | TNFB_LTA | Tumor Necrosis Factor B/Lymphotoxin-alpha | GCST90274840 |
| 29 | SIRT2 | Sirtuin 2 | GCST90274834 |
| 30 | STAMPB | Six transmembrane proteins of prostate B | GCST90274837 |
| 31 | 4EBP1_EIF4EBP1 | Eukaryotic Translation Initiation Factor 4E-Binding Protein 1 | GCST90274758 |
| 32 | IL-18R1 | Interleukin-18 Receptor 1 | GCST90274804 |
| 33 | LAP TGF-beta-1 | Latency Associated Peptide Transforming Growth Factor-beta 1 | GCST90274818 |
| 34 | IL-7 | Interleukin-7 | GCST90274816 |
| 35 | CXCL5 | Chemokine (C-X-C motif) ligand 5 | GCST90274782 |
| 36 | NRTN | Neurturin | GCST90274828 |
| 37 | IL-13 | Interleukin-13 | GCST90274799 |
| 38 | CDCP1 | CUB Domain Containing Protein 1 | GCST90274775 |
| 39 | TGF-alpha | Transforming Growth Factor-alpha | GCST90274838 |
| 40 | FGF-21 | Fibroblast Growth Factor 21 | GCST90274788 |
| 41 | SLAMF1 | Signaling Lymphocytic Activation Molecule Family Member 1 | GCST90274835 |
| 42 | CXCL1 | Chemokine (C-X-C motif) ligand 1 | GCST90274779 |
| 43 | TRAIL | Tumor Necrosis Factor-related Apoptosis-inducing Ligand | GCST90274843 |
| 44 | IL-17C | Interleukin-17C | GCST90274802 |
| 45 | MMP-1 | Matrix Metalloproteinase-1 | GCST90274826 |
| 46 | CXCL11 | Chemokine (C-X-C motif) ligand 11 | GCST90274781 |
| 47 | FGF-23 | Fibroblast Growth Factor 23 | GCST90274789 |
| 48 | uPA_PLAU | Urokinase- type Plasminogen Activator (uPA)/Plasminogen Activator, Urokinase (PLAU) | GCST90274847 |
| 49 | FGF-19 | Fibroblast Growth Factor 19 | GCST90274787 |
| 50 | CX3CL1 | Chemokine (C-X3-C motif) ligand 1 | GCST90274778 |
| 51 | CXCL10 | Chemokine (C-X-C motif) ligand 10 | GCST90274780 |
| 52 | FGF-5 | Fibroblast Growth Factor 5 | GCST90274790 |
| 53 | CCL25 | Chemokine (C-C motif) ligand 25 | GCST90274768 |
| 54 | ARTN | Artemin | GCST90274760 |
| 55 | VEGF_A | Vascular Endothelial Growth Factor A | GCST90274848 |
| 56 | SCF_KITLG | Stem Cell Factor (SCF)/KIT Ligand (KITLG) | GCST90274833 |
| 57 | ST1A1_SULT1A1 | Sulfotransferase Family 1A Member 1 (SULT1A1) | GCST90274836 |
| 58 | CD244 | Cluster of Differentiation 244 | GCST90274771 |
| 59 | CCL11 | Chemokine (C-C motif) ligand 11 | GCST90274764 |
| 60 | MMP-10 | Matrix Metalloproteinase-10 | GCST90274827 |
| 61 | TRANCE | Tumor Necrosis Factor (TNF)-related Activation-induced Cytokine | GCST90274844 |
| 62 | IL-2 | Interleukin-2 | GCST90274806 |
| 63 | Beta-NGF_NGF | Beta-Nerve Growth Factor (NGF) | GCST90274762 |
| 64 | IL-2RB | Interleukin-2 Receptor Subunit Beta | GCST90274811 |
| 65 | OSM | Oncostatin M | GCST90274831 |
| 66 | AXIN1 | Axis Inhibition Protein 1 | GCST90274761 |
| 67 | CCL2 | Chemokine (C-C motif) ligand 2 | GCST90274821 |
| 68 | CCL8 | Chemokine (C-C motif) ligand 8 | GCST90274822 |
| 69 | CD6 | Cluster of Differentiation 6 | GCST90274774 |
| 70 | MIP-1 alpha_CCL3 | Macrophage Inflammatory Protein-1 alpha (MIP-1 alpha)/Chemokine (C-C motif) ligand 3 (CCL3) | GCST90274825 |
| 71 | hGDNF_GDNF | Human Glial Cell Line-Derived Neurotrophic Factor (GDNF) | GCST90274792 |
| 72 | CCL7 | Chemokine (C-C motif) ligand 7 | GCST90274823 |
| 73 | LIF-R | Leukemia Inhibitory Factor Receptor | GCST90274820 |
| 74 | EN-RAGE_S100A12 | Extracellular Newly Identified RAGE Binding Protein (EN-RAGE)/S100 Calcium Binding Protein A12 (S100A12) | GCST90274786 |
| 75 | CCL4 | Chemokine (C-C motif) ligand 4 | GCST90274770 |
| 76 | HGF | Hepatocyte Growth Factor | GCST90274793 |
| 77 | IL-17A | Interleukin-17A | GCST90274801 |
| 78 | CD5 | Cluster of Differentiation 5 | GCST90274773 |
| 79 | CSF-1 | Colony-Stimulating Factor 1 | GCST90274776 |
| 80 | CCL28 | Chemokine (C-C motif) ligand 28 | GCST90274769 |
| 81 | CD40 | Cluster of Differentiation 40 | GCST90274772 |
| 82 | IL-22RA1 | Interleukin-22 Receptor Subunit Alpha 1 | GCST90274809 |
| 83 | TNF | Tumor Necrosis Factor | GCST90274839 |
| 84 | IL-18 | Interleukin-18 | GCST90274803 |
| 85 | IL-20RA | Interleukin-20 Receptor Subunit Alpha | GCST90274808 |
| 86 | IL-24 | Interleukin-24 | GCST90274810 |
| 87 | IFNG | Interferon gamma | GCST90274794 |
| 88 | TSLP | Thymic Stromal Lymphopoietin | GCST90274845 |
| 89 | IL-20 | Interleukin-20 | GCST90274807 |
| 90 | IL10RB | Interleukin 10 Receptor Subunit Beta | GCST90274797 |
| 91 | IL-8 | Interleukin-8 | GCST90274817 |
| Exposure | Outcome | Method | Nsnp | B | Se | Pval | OR (95%CI) | P_adj_bon | P_adj_fdr |
|---|---|---|---|---|---|---|---|---|---|
| CCL25 | MS | MR Egger | 24 | 0.156 | 0.053 | 7.49 × 10⁻³ | 1.169 (1.054, 1.297) | ||
| Weighted median | 0.113 | 0.044 | 9.72 × 10⁻³ | 1.120 (1.028, 1.220) | |||||
| IVW | 0.082 | 0.036 | 2.42 × 10⁻² | 1.085 (1.011, 1.165) | 1 | 0.307 | |||
| Simple mode | −0.037 | 0.100 | 7.17 × 10⁻¹ | 0.964 (0.793, 1.172) | |||||
| Weighted mode | 0.122 | 0.039 | 5.17 × 10⁻³ | 1.130 (1.046, 1.221) | |||||
| CXCL10 | MR Egger | 20 | 0.188 | 0.188 | 3.30 × 10⁻¹ | 1.207 (0.835, 1.746) | |||
| Weighted median | 0.149 | 0.101 | 1.39 × 10⁻¹ | 1.161 (0.953, 1.414) | |||||
| IVW | 0.208 | 0.078 | 7.49 × 10⁻³ | 1.231 (1.057, 1.433) | 0.682 | 0.227 | |||
| Simple mode | 0.063 | 0.181 | 7.31 × 10⁻¹ | 1.065 (0.747, 1.518) | |||||
| Weighted mode | 0.105 | 0.215 | 6.32 × 10⁻¹ | 1.110 (0.729, 1.692) | |||||
| NRTN | MR Egger | 12 | 0.160 | 0.282 | 5.85 × 10⁻¹ | 1.173 (0.674, 2.040) | |||
| Weighted median | −0.304 | 0.118 | 1.02 × 10⁻² | 0.738 (0.585, 0.931) | |||||
| IVW | −0.205 | 0.086 | 1.68 × 10⁻² | 0.815 (0.689, 0.964) | 1 | 0.307 | |||
| Simple mode | −0.411 | 0.187 | 5.00 × 10⁻² | 0.663 (0.459, 0.956) | |||||
| Weighted mode | −0.374 | 0.189 | 7.39 × 10⁻² | 0.688 (0.475, 0.997) |
| Exposure | Outcome | Method | Nsnp | B | Se | Pval | OR (95%CI) | P_adj_bon | P_adj_fdr |
|---|---|---|---|---|---|---|---|---|---|
| MS | CSF-1 | MR Egger | 122 | −0.008 | 0.011 | 4.75 × 10⁻¹ | 0.992 (0.971, 1.014) | ||
| Weighted median | −0.006 | 0.012 | 6.06 × 10⁻¹ | 0.994 (0.972, 1.017) | |||||
| IVW | −0.017 | 0.007 | 2.35 × 10⁻² | 0.983 (0.969, 0.998) | 1 | 0.376 | |||
| Simple mode | −0.022 | 0.026 | 4.05 × 10⁻¹ | 0.979 (0.930, 1.029) | |||||
| Weighted mode | −0.010 | 0.011 | 3.60 × 10⁻¹ | 0.990 (0.970, 1.011) | |||||
| IL-1 alpha | MR Egger | 122 | 0.048 | 0.015 | 1.46 × 10⁻³ | 1.049 (1.019, 1.080) | |||
| Weighted median | 0.017 | 0.016 | 2.70 × 10⁻¹ | 1.018 (0.987, 1.050) | |||||
| IVW | 0.034 | 0.009 | 3.30 × 10⁻⁴ | 1.035 (1.016, 1.054) | 0.026 | 0.026 | |||
| Simple mode | 0.017 | 0.0345 | 6.33 × 10⁻¹ | 1.017 (0.950, 1.088) | |||||
| Weighted mode | 0.023 | 0.018 | 1.95 × 10⁻¹ | 1.023 (0.989, 1.059) | |||||
| CCL13 | MR Egger | 122 | −0.027 | 0.013 | 3.10 × 10⁻² | 0.973 (0.949, 0.997) | |||
| Weighted median | −0.027 | 0.012 | 3.12 × 10⁻² | 0.974 (0.950, 0.998) | |||||
| IVW | −0.020 | 0.008 | 1.45 × 10⁻² | 0.980 (0.964, 0.996) | 1 | 0.300 | |||
| Simple mode | −0.015 | 0.029 | 5.89 × 10⁻¹ | 0.985 (0.932, 1.041) | |||||
| Weighted mode | −0.027 | 0.011 | 1.81 × 10⁻² | 0.973 (0.952, 0.995) | |||||
| PD-L1_CD274 | MR Egger | 123 | −0.017 | 0.0112 | 1.32 × 10⁻¹ | 0.983 (0.962, 1.005) | |||
| Weighted median | −0.015 | 0.013 | 2.51 × 10⁻¹ | 0.985 (0.961, 1.011) | |||||
| IVW | −0.018 | 0.007 | 1.50 × 10⁻² | 0.982 (0.968, 0.996) | 1 | 0.300 | |||
| Simple mode | −0.003 | 0.026 | 9.10 × 10⁻¹ | 0.997 (0.948, 1.049) | |||||
| Weighted mode | −0.015 | 0.011 | 1.64 × 10⁻¹ | 0.985 (0.964, 1.006) | |||||
| TWEAK_TNFSF12 | MR Egger | 123 | −0.0135 | 0.0116 | 2.49 × 10⁻¹ | 0.987 (0.964, 1.009) | |||
| Weighted median | −0.0123 | 0.011 | 2.76 × 10⁻¹ | 0.988 (0.9663, 1.010) | |||||
| IVW | −0.019 | 0.008 | 1.43 × 10⁻² | 0.981 (0.966, 0.996) | 1 | 0.300 | |||
| Simple mode | 0.008 | 0.027 | 7.68 × 10⁻¹ | 1.008 (0.955, 1.064) | |||||
| Weighted mode | −0.010 | 0.011 | 3.97 × 10⁻¹ | 0.990 (0.969, 1.013) |
| Inflammatory Proteins | Outcomes | SNPs | Cochran’s Q Test | MR-Egger Intercept | MR-Presso | MR-Steiger | |||
|---|---|---|---|---|---|---|---|---|---|
| IVW | MR Egger | Egger Intercept | p Value | Global Test RSSobs | p Value | Causal Direction | |||
| CCL25 | MS | 24 | 0.165 | 0.273 | −0.013 | 0.078 | 0.187 | 0.034 (Outlier-corrected, 0 Outlier) | TRUE |
| CXCL10 | 20 | 0.098 | 0.074 | 0.002 | 0.911 | 0.064 | 0.015 (Outlier-corrected, 0 Outlier) | TRUE | |
| NRTN | 12 | 0.501 | 0.581 | −0.030 | 0.206 | 0.534 | 0.031 (Outlier-corrected, 0 Outlier) | TRUE | |
| Exposure | Outcomes | Nsnp | Cochran’s Q Test | MR-Egger Intercept | MR-Presso | MR-Steiger | |||
|---|---|---|---|---|---|---|---|---|---|
| IVW | MR Egger | Egger Intercept | p Value | Global Test RSSobs | p Value | Causal Direction | |||
| MS | CSF-1 | 122 | 0.59 | 0.595 | −0.002 | 0.282 | 0.622 | 0.023 (Outlier-corrected, 0 Outlier) | TRUE |
| IL-1 alpha | 122 | 0.092 | 0.099 | −0.003 | 0.222 | 0.081 | 0.0005 (Outlier-corrected, 0 Outlier) | TRUE | |
| CCL13 | 122 | 0.050 | 0.050 | 0.002 | 0.459 | 0.053 | 0.016 (Outlier-corrected, 0 Outlier) | TRUE | |
| PD-L1_CD274 | 123 | 0.639 | 0.615 | −0.0003 | 0.885 | 0.616 | 0.014 (Outlier-corrected, 0 Outlier) | TRUE | |
| TWEAK_TNFSF12 | 123 | 0.269 | 0.257 | −0.001 | 0.526 | 0.308 | 0.016 (Outlier-corrected, 0 Outlier) | TRUE | |
Disclaimer/Publisher’s Note: The statements, opinions and data contained in all publications are solely those of the individual author(s) and contributor(s) and not of MDPI and/or the editor(s). MDPI and/or the editor(s) disclaim responsibility for any injury to people or property resulting from any ideas, methods, instructions or products referred to in the content. |
© 2024 by the authors. Licensee MDPI, Basel, Switzerland. This article is an open access article distributed under the terms and conditions of the Creative Commons Attribution (CC BY) license (https://creativecommons.org/licenses/by/4.0/).
Share and Cite
Li, X.; Ding, Z.; Qi, S.; Wang, P.; Wang, J.; Zhou, J. Genetically Predicted Association of 91 Circulating Inflammatory Proteins with Multiple Sclerosis: A Mendelian Randomization Study. Brain Sci. 2024, 14, 833. https://doi.org/10.3390/brainsci14080833
Li X, Ding Z, Qi S, Wang P, Wang J, Zhou J. Genetically Predicted Association of 91 Circulating Inflammatory Proteins with Multiple Sclerosis: A Mendelian Randomization Study. Brain Sciences. 2024; 14(8):833. https://doi.org/10.3390/brainsci14080833
Chicago/Turabian StyleLi, Xin’ai, Zhiguo Ding, Shuo Qi, Peng Wang, Junhui Wang, and Jingwei Zhou. 2024. "Genetically Predicted Association of 91 Circulating Inflammatory Proteins with Multiple Sclerosis: A Mendelian Randomization Study" Brain Sciences 14, no. 8: 833. https://doi.org/10.3390/brainsci14080833