3.1. Evaluation of the L. caerulea Cultivars
The blue honeysuckle shrubs still did not reach their final size in the 5th year after planting (
Table 2). Shrub height and width varied among cultivars from 87 up to 120 cm, and from 90 up to 110 cm, respectively. Though there were significant differences between cultivars both for shrub height and width, some more years are needed to draw final conclusions. The two cultivars ‘Amphora’ and ‘Leningradskij Velikan’ were distinguished by very dense shrubs; this is a negative character that bears difficulties during the berry harvest. Other tested cultivars did not differ significantly in shrub density. The two Polish cultivars, ‘Iga’ and ‘Tola’, were the same as the Canadian cultivar ‘Tundra’; in their 5th growing season, they had very healthy shrubs without any visual decline symptoms. ‘Leningradskij Velikan’ had the worst health status and the main negative symptoms were stunted new growth and leaf discoloration.
The highest cumulative yield was obtained of cultivar. ‘Tundra’ (
Table 3). Cultivar ‘Wojtek’ also was very productive and did not differ significantly from cultivar ‘Tundra’. A total of five kg of berries harvested during three years, from 3–5 year old shrubs, were higher than the yield reported from the trials in Poland, where 3–4 years old cultivar ‘Wojtek’ gave around 1 kg yield [
31], though other authors claim that 2 kg of berries from a shrub is an average yield for 5–6 year old shrubs [
32,
33]. In our trial, berries were harvested in one pick though there are recommendations to harvest in 3–4 times, or even up to 7 times, to prevent loss of overripe berries [
34]. To consider that conditions cumulative yields in our trial could be increased by 10–15%. Cultivar ‘Amphora’ was the lowest yielding cultivar (1.8 kg during three years), and only cultivar ‘Nimfa’ did not differ significantly from it.
Average berry weight varied from 0.95 up to 1.19 g between cultivars (
Table 2). Cultivars ‘Iga’ and ‘Wojtek’ had significantly larger fruits than most other cultivars tested. Such fruit size obtained in our trial is comparable to the results of some Polish and Slovenian trials [
16,
35].
Szot and Lipa (2013) reported a significant increase in average berry weight after the shrub pruning [
36], but usually pruning starts from the 6th–8th year after planting of blue honeysuckle plantations, and our plants did not reach that age yet.
Sensory evaluation revealed significant differences between cultivars in berry appearance, flavor, and taste character (
Table 4). The most attractive were berries of ‘Amphora’, ‘Wojtek’ and ‘Tola’. Berries of ‘Iga’ and ‘Tundra’ were evaluated to have a significantly lower total score. On the other hand, ‘Leningradskij Velikan’ berries had the best flavor score, possibly related to higher dominance of sweetness. The flavor score of the most attractive ‘Amphora’ and ‘Tola’ berries was the lowest, the same as ‘Iga’, which lead to lower overall evaluation. It is interesting that the taste character of all these cultivars was evaluated as sour or acid. Combining berry appearance and flavor, ‘Leningradskij Velikan’ had the highest ratings, whereas ‘Indigo Gem’, ‘Nimfa’ and ‘Wojtek’ did not differ significantly.
3.2. Phenolic Profiles of Fruits of Selected L. caerulea Cultivars
Phytochemical profiles are determined by genetic origin, harvesting, and processing techniques of the plant materials and the environmental growing conditions. Environmental conditions are one of the main detrimental factors affecting the qualitative and quantitative compositions of plant materials. Central Europe is ascribed to the region of favorable growing conditions for
L. caerulea species, as well as Canada and Northern countries of origin [
2,
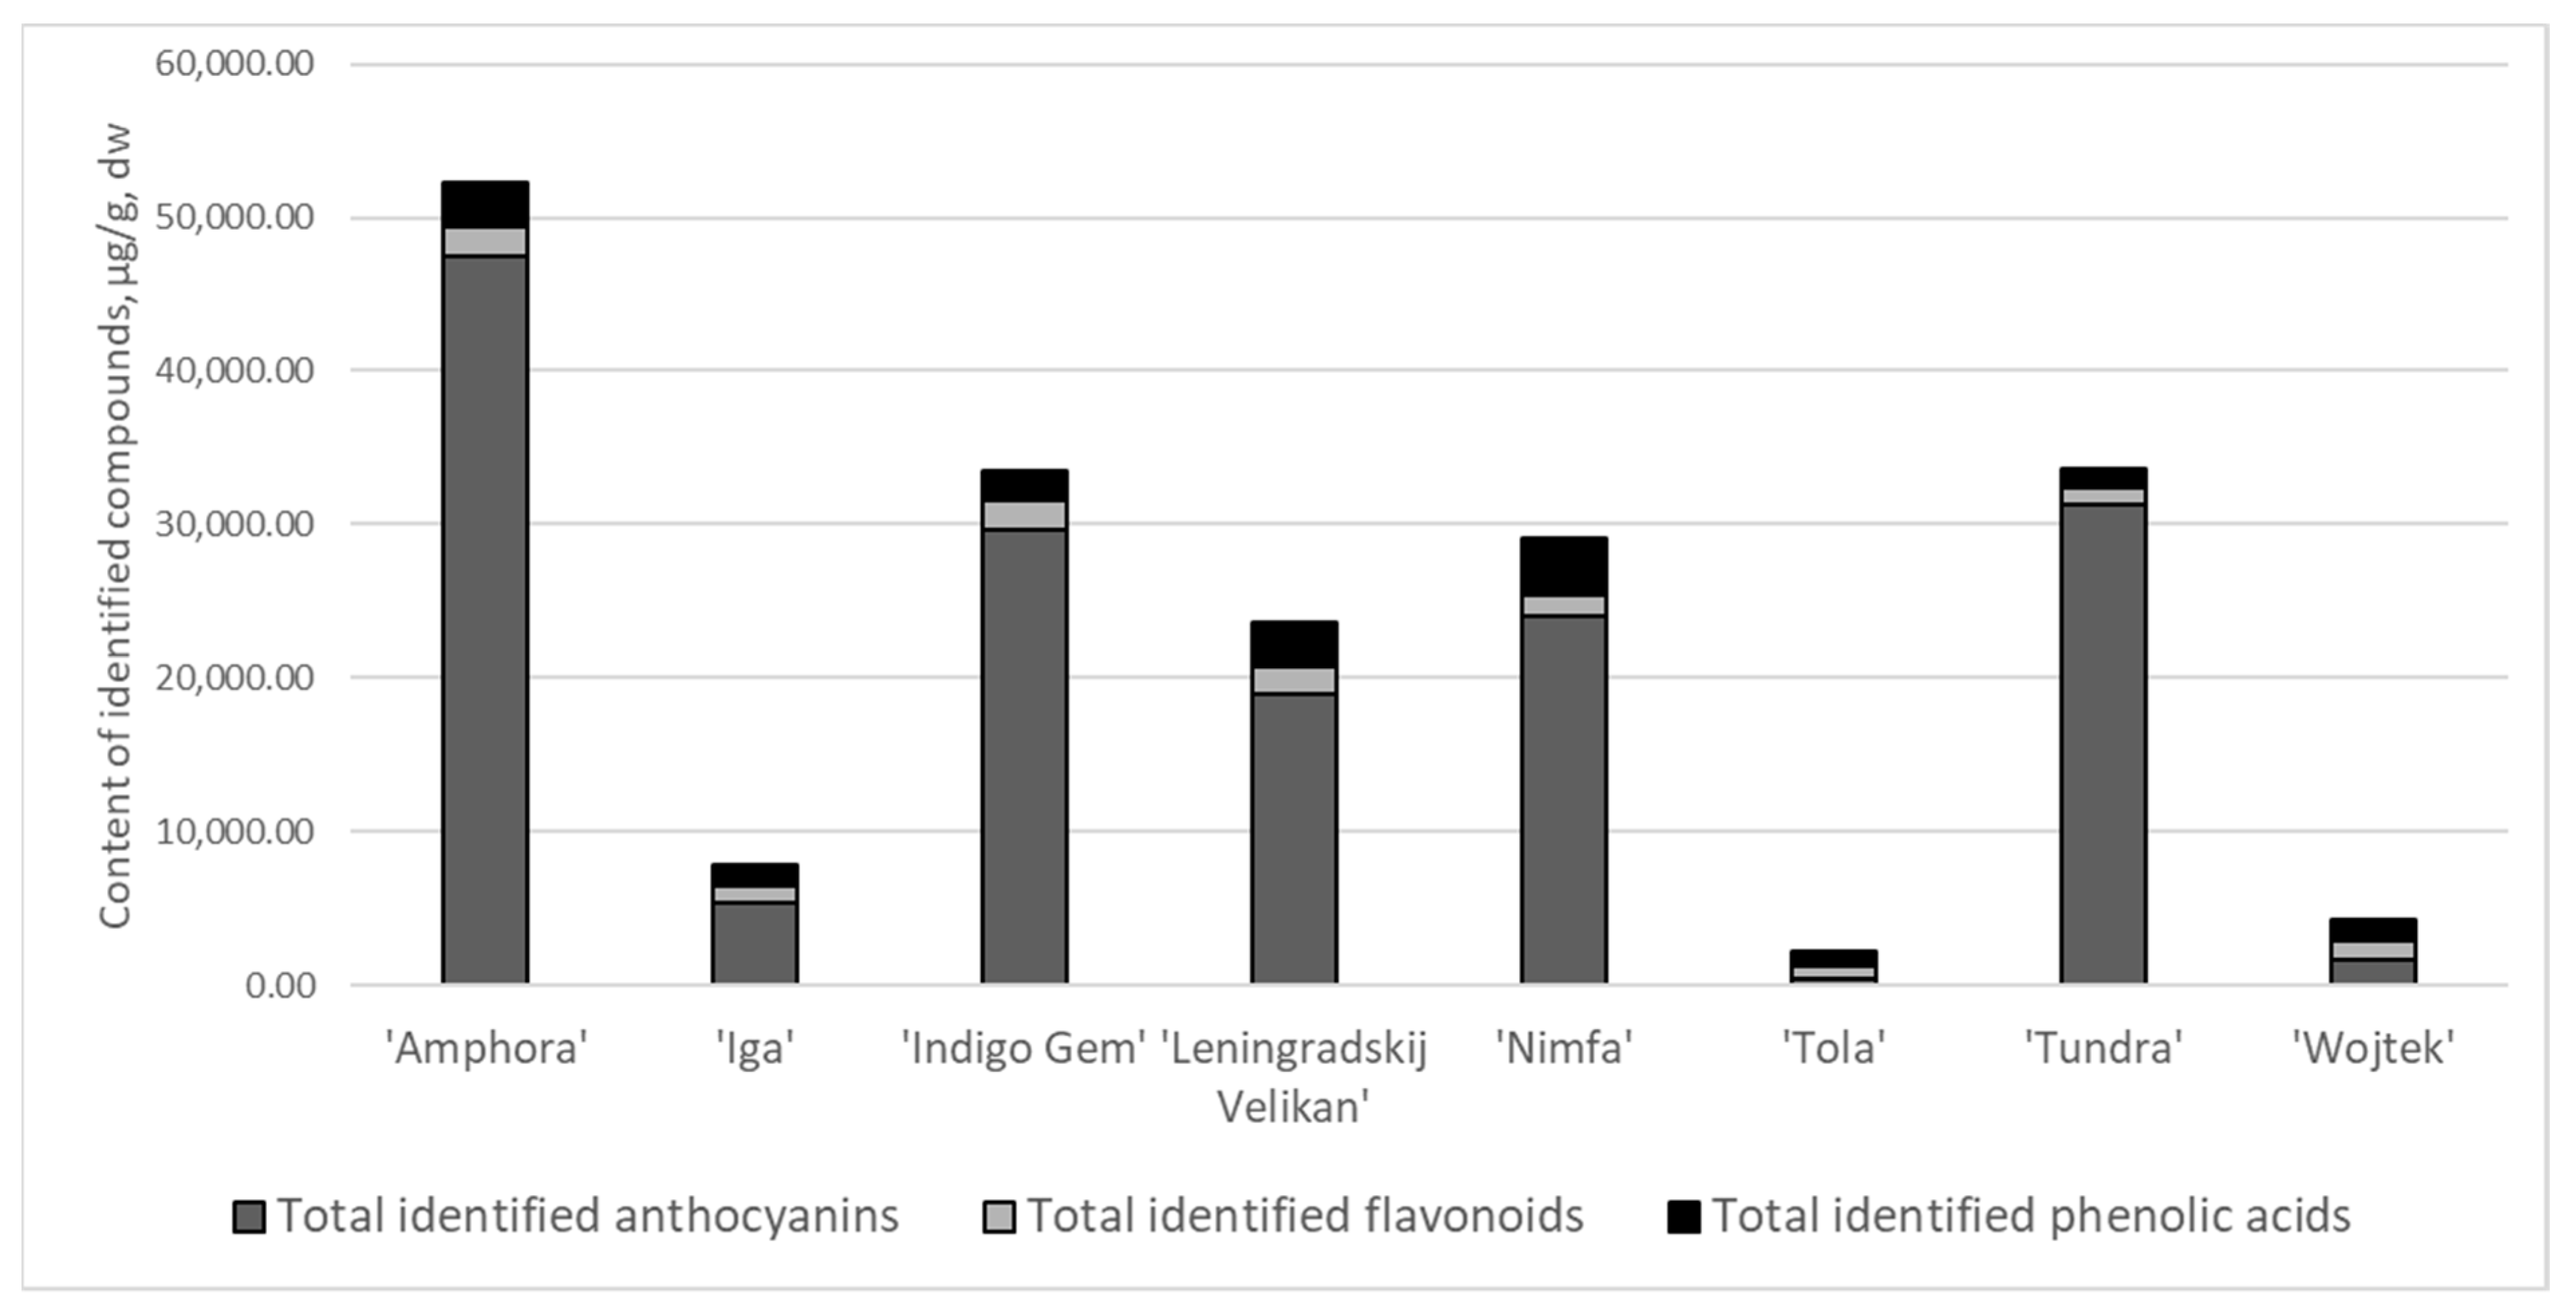
9]. The HPLC-PDA and UPLC-PDA assays enabled profiling and quantification of anthocyanins, flavones, flavonols, and hydroxycinnamic acid contents in selected cultivars (
Figure 1). Anthocyanins were the prevailing compounds and constituted from 38 up to 91% of total identified compounds, flavonoid fraction comprised from 3 up to 36%, and phenolic acids—3–42%.
The total amounts of identified anthocyanins varied significantly within the cultivars (
Table 5). The greatest average amounts were determined in ‘Amphora’ (~48 mg/g), ‘Indigo Gem‘, ‘Nimfa’, ‘Tundra’, ‘Leningradskij Velikan’ ranging 19 to 31 mg/g, and the lowest amounts were determined for ‘Tola’, ‘Wojtek’ and ‘Iga’—0.46, 1.63 and 5.39 mg/g, respectively (
p < 0.05).
The anthocyanin profile was predominated by the cyanidin-3-glucoside that accounted from 84 to 89% of total anthocyanins in cultivars ‘Wojtek’ and ‘Leningradskij Velikan’, respectively. The quantitative profiles of cyanidin-3,5-diglucoside, cyanidin-3-rutinoside, and peonidin-3-glucoside were cultivar specific, reaching up to 6, 8, and 4.5% of the total identified anthocyanins. The minor anthocyanins were up to 2%. The total content of the identified anthocyanins negatively correlated with the average fruit weight (R = −0.623;
p < 0.05). The profile of anthocyanins generally occurs in the following manner: cyanidin-3-glucoside > cyanidin-3,5-diglucoside > cyanidin-3-rutinoside > peonidin-3-glucoside > pelargonidin-3-glucoside in L.
caerulea genotypes [
3,
4,
6,
7,
13]. Although certain authors indicate the presence of malvidin-3-glucoside, peonidin-3,5-diglucoside, pelargonidin-3-glucoside, cyanidin-3-gentiobioside, and acetylated derivatives [
6,
13,
15]. The key marker of anthocyanin profile of L.
caerulea fruits is cyanidin-3-glucoside accounting for 70–90% of total amounts [
2,
3,
4,
6,
8,
13,
14]. The average contribution of cyanidin-3-glucoside in our tested cultivars were 86%, whereas the amounts of other identified anthocyanin derivatives were cultivar variant. The amounts of cyanidin-3-rutinoside tend to prevail after the cyanidin-3,5-diglucoside [
6,
37], but our results show, that only cultivars ‘Leningradskij Velikan’, ‘Wojtek’ and ‘Tola’ confirm this trend. Caprioli et al., 2016 determined cyanidin-3,5-diglucoside as the second prevailing compound in the spontaneously growing
L. caerulea var.
kamtschatica samples from Russia [
3]. Khattab et al., 2017 determined the predominance of cyanidin-3-glucoside, peonidin-3-glucoside, and cyanidin-3,5-diglucoside in the profiles of Canadian cultivars ‘Tundra’ and ‘Indigo Gem’ [
13]. Our results are in agreement confirming the second predominant compound peonidin-3-glucoside in ‘Tundra’ and cyanidin-3,5-diglucoside in ‘Indigo Gem’ samples. On the other hand, peonidin-3,5-dihexoside was the second prevailing compound, followed by peonidin-3-glucoside in ‘Tundra’ samples, cultivated in Slovenia [
11]. The quantitative levels tend to be low temperature and solar radiation dependent [
6,
9]. Growing conditions affect the total amounts of anthocyanins in cultivars [
2,
3]. Cyanidin-3-glucoside as the prevailing compound in the phenolic fraction, determine most of the pharmacological effects of
L. caerulea extracts [
8,
38,
39].
Rutin was the phytochemical marker of the flavonoids ranging from 255.78 ± 8.38 µg/g in ‘Tola’ up to 779.31 ± 9.88 µg/g in ‘Indigo Gem’ cultivar. The other quantified flavonoid derivatives were isoquercitrin, quercitrin, quercetin, isorhamnetin, luteolin-7-glucoside, and apigenin, showing significant quantitative variation between tested cultivars. The flavonoid profiles of
L. caerulea consist of (+)-catechin, (–)-epicatechin, quercetin, isorhamnetin, kaempferol, apigenin, and glycosides and aglycones of luteolin [
6,
7,
11]. Rutin is the predominant compound in the flavonoid fraction and can be regarded as the phytochemical marker. These results are in agreement with various studies regarding the chemical variation of flavonoids [
7,
11,
13,
37]. In our study, Russian cultivars contained the greatest amounts of flavonoids in the following order ‘Nympha’ > ‘Amphora’ > ‘Leningradskij Velikan’. Gawronski et al., 2020 determined ‘Aurora’ with the highest amounts of flavonoids from the 30 tested
L. caerulea cultivars [
17]. Great variation in total contents of flavonoids was determined by various authors for the ‘Indigo Gem’, ‘Leningradskij Velikan’, ‘Nimfa’ cultivars due to different environmental conditions and growing techniques [
17]. Anthocyanins and flavonoids are mainly located in skin tissues [
6], therefore whole fruits or pomace materials could be selected for obtaining fruit powders for further functionalization [
10].
The complex of hydroxycinnamic acids consisted of chlorogenic, caffeic, 4-
O-caffeoylquinic, dicaffeoylquinic acids,
p-coumaric, and ferulic acid. 3,5-dicaffeoylquinic acid prevailed in all tested cultivars (462.78–1975.90 µg/g), except ‘Tundra’ with the predominance of chlorogenic acid (676.87 ± 15.66 µg/g). Hydroxycinnamic acids are important precursors of flavor and they are highly abundant and characteristic in fruits of different genera [
1,
11,
40]. Chlorogenic acid and 3,5-dicaffeoylquinic acid are principal hydroxycinnamic acids in
Lonicera fruits [
3,
41]. The complex can also variably contain ferulic, caffeic,
p-coumaric, neochlorogenic, and other caffeoylquinic derivatives [
1,
6,
10]. Kucharska et al., 2017 and Ozmianski et al., 2016 determined three monocaffeoylquinic and three dicaffeoylquinic acids in
L. caerulea fruits [
7,
10]. Liu et al., 2020 determined that chlorogenic acid together with cyanidin-3-glucoside and (+)-catechin inhibit α-amylase activity and gain perspective as a hypoglycemic functional ingredient [
41]. Another group of compounds possessing antihyperglycemic effects are proanthocyanidins [
42].
Significantly, the greatest total amount of proanthocyanidins, determined by spectrophotometric DMCA method, were determined in samples of cultivars ‘Amphora’ and ‘Leningradskij Velikan’ (2.16 ± 0.03 mg/g and 2.13 ± 0.01 mg/g, respectively) (Table 7). The amounts of procyanidin B1, determined by HPLC-PDA method, were well correlated with the total amounts of proanthocyanidins (R = 0.886;
p < 0.05) and were highlighted in ‘Amphora’ and ‘Leningradskij Velikan‘, while ‘Tola’ and ‘Wojtek’ contained the lowest amounts (
Table 4). A much higher total of proanthocyanidins levels, compared to detected procyanidin B1 amounts, indicate that there are much more unidentified proanthocyanidins in tested
L. caerulea samples. Procyanidin dimers, trimers and up to polymers has been detected in the fruit samples by various authors [
1]. Significant negative correlational interdependence was also determined between the total proanthocyanidins and average fruit weight (R = −0.602;
p < 0.05). Proanthocyanidins in
L. caerulea are also geographic origin-specific [
6]. Their quantities are determined by the genotype and are negatively associated with the ripening [
4]. The procyanidin dimers, trimers, and tetramers were determined in different cultivars [
7,
10,
11]. Kucharska et al. study confirmed a great variation of amounts of individual and total proanthocyanidins in different cultivars [
7]. The results are comparable with our tested cultivars.
The quantitative profiles were highly dependent on the cultivar. Overall, the cultivars ‘Amphora’, ‘Indigo Gem’, and ‘Tundra’ contained, significantly (p < 0.05), the greatest total amount of identified phenolic compounds (51.4, 32.6 and 33.0 mg/g, respectively), followed by ‘Leningradskij Velikan’ > ‘Iga’ > ‘Wojtek’ > ‘Tola’, the latter—only 1.7 mg/g.
The identity of flavonoids and phenolic acids in extracts of
L. caerulea fruits was additionally confirmed by mass spectrometry, which data are presented in
Table 6. Obtained mass fragmentation spectra,
m/
z proportions were identical with MS/MS data of reference compounds and literature.
3.3. Antioxidant Activity of L. of Fruits of Selected L. caerulea Cultivars
Antioxidant activity of phenolic rich plant materials is highly correlated with the antioxidant capacity, which depends on the structural peculiarities of compounds [
27,
43]. In this study, the antioxidant activity was evaluated using the in vitro techniques that differ in mechanism of action and experimental conditions. The radical scavenging activity was evaluated using ABTS in neutral medium, while reducing activity—FRAP (pH is acidic) and CuPRAC (pH—close to physiological values) assays. ABTS, FRAP, and CuPRAC belong to the single electron transfer based assays [
44]. CuPRAC assay due to the electronic configuration of copper complex possess faster kinetics compared to FRAP assay [
26].
The greatest radical scavenging activity was determined in the samples of cultivar ‘Indigo Gem’ (192.34 ± 27.95 µmol TE/g) followed by ‘Leningradskij Velikan’ > ‘Amphora’ > ‘Tundra’ > ‘Iga’ > ‘Tola’ > ‘Wojtek’ > ‘Nimfa’ (
Table 7). Various studies determined cultivar ‘Nimfa’ with the lowest radical scavenging activities among 12 investigated cultivars [
4,
45]. The ferric reducing capacities were in a range of 107.66–707.60 µmol TE/g for the samples of cultivars in the following order—‘Tola’ < ‘Wojtek’ < ‘Leningradskij Velikan’ < ‘Iga’ < ‘Nimfa’ < ‘Amphora’ < ‘Tundra’ < ‘Indigo Gem‘. Cupric reducing capacities elucidated the highest (
p < 0.05) antioxidant activity in cultivars ‘Amphora’ and ‘Nimfa’ (697.61 ± 30.86 µmol TE/g and 670.24 ± 42.02 µmol TE/g, respectively). Cultivar ‘Tola’ was distinguished with the lowest (
p < 0.05) reducing activities. Higher antioxidant capacities have been determined for cultivars ‘Indigo Gem’ and ‘Tundra’, compared to other cultivars and certain fruits of
Vaccinium and
Rubus genus [
4,
13,
27,
46]. The three selected antioxidant evaluating methods, ABTS, FRAP, and CuPRAC, have revealed the multidirectional antioxidant capacity of L. caerulea fruit extracts and highlighted the superiority of the ‘Indigo Gem’ cultivar in terms of antioxidant activity. The applied antioxidant activity assays do not employ biological radicals, but, still, certain experimental setups can simulate conditions that can be met in food matrices of biological fluids, such as redox potential and pH [
47]. Antioxidant activity mechanisms are highly interrelated with the anti-inflammatory, chemopreventive, cardioprotective, hepatoprotective, and neuroprotective activities [
1,
8,
19]. The antioxidant activity of multi-phenolic compound containing plant matrices may differ due to their reaction kinetics, interactions in the sample, and peculiarities of activity enhancing structural elements [
27,
48].
Cupric reducing activities were well correlated with total proanthocyanidin content (R = 0.874;
p < 0.05), and contents of procyanidin B1 (R = 0.738;
p < 0.05), cyanidin-3,5-diglucoside (R = 0.810;
p < 0.05), isoquercitrin (R = 0.952;
p < 0.05),
p-coumaric acid (R = 0.714;
p < 0.05), chlorogenic (R = 0.881;
p < 0.05), caffeic (R = 0.833;
p < 0.05), 3,5-dicaffeoylquinic acid (R = 0.810;
p < 0.05) and ferulic acid (R = 0.833;
p < 0.05). In our previous research, we have determined caffeoylquinic acids as fast-acting antioxidant with high capacity [
48]. Esters of hydroxycinnamic acids might be more active than free phenolic acids, they stabilize radical forms more efficiently [
49]. The strong antioxidant properties of proanthocyanidins can be explained by the catechol moieties in their structure and the free phenolic hydroxyl groups. The coupling of monomers with 4β → 8 bonds provides structurally proper conditions for free radical inactivation and transition metal ion binding [
50]. Zeng et al., 2020 determined the greatest antioxidant activity of procyanidin B2 consistently in various in vitro and in vivo models [
51]. Ferric reducing activities correlated with total identified anthocyanins (R = 0.738;
p < 0.05) and individual anthocyanins with the range of coefficients R = 0.762–0.905 (
p < 0,05). The results are in agreement with the study of Moyer et al., 2002, that determined correlations between total anthocyanin content and FRAP results in the samples of
Vaccinium,
Rubus and
Ribes fruits [
52]. Radical scavenging activity was correlated with cyanidin-3-glucoside (R = 0.455;
p < 0.05), cyanidin-3-rutinoside (R = 0.644;
p < 0.05), rutin (R = 0.747;
p < 0.05), and procyanidin B1 (R = 0.545;
p < 0.05). Radical scavenging and reducing activities were well correlated with different groups of phenolics, indicating their versatile antioxidant potential. Correlation analysis suggested that anthocyanins and the predominant compound, cyanidin-3-glucoside, also proanthocyanidin B1, 3,5-dicaffeoylquinic acid, and rutin could be proposed as markers of reducing and radical scavenging activities of
L. caerulea fruit extracts.
3.4. Principal Component Analysis of Fruits of Selected L. caerulea Cultivars
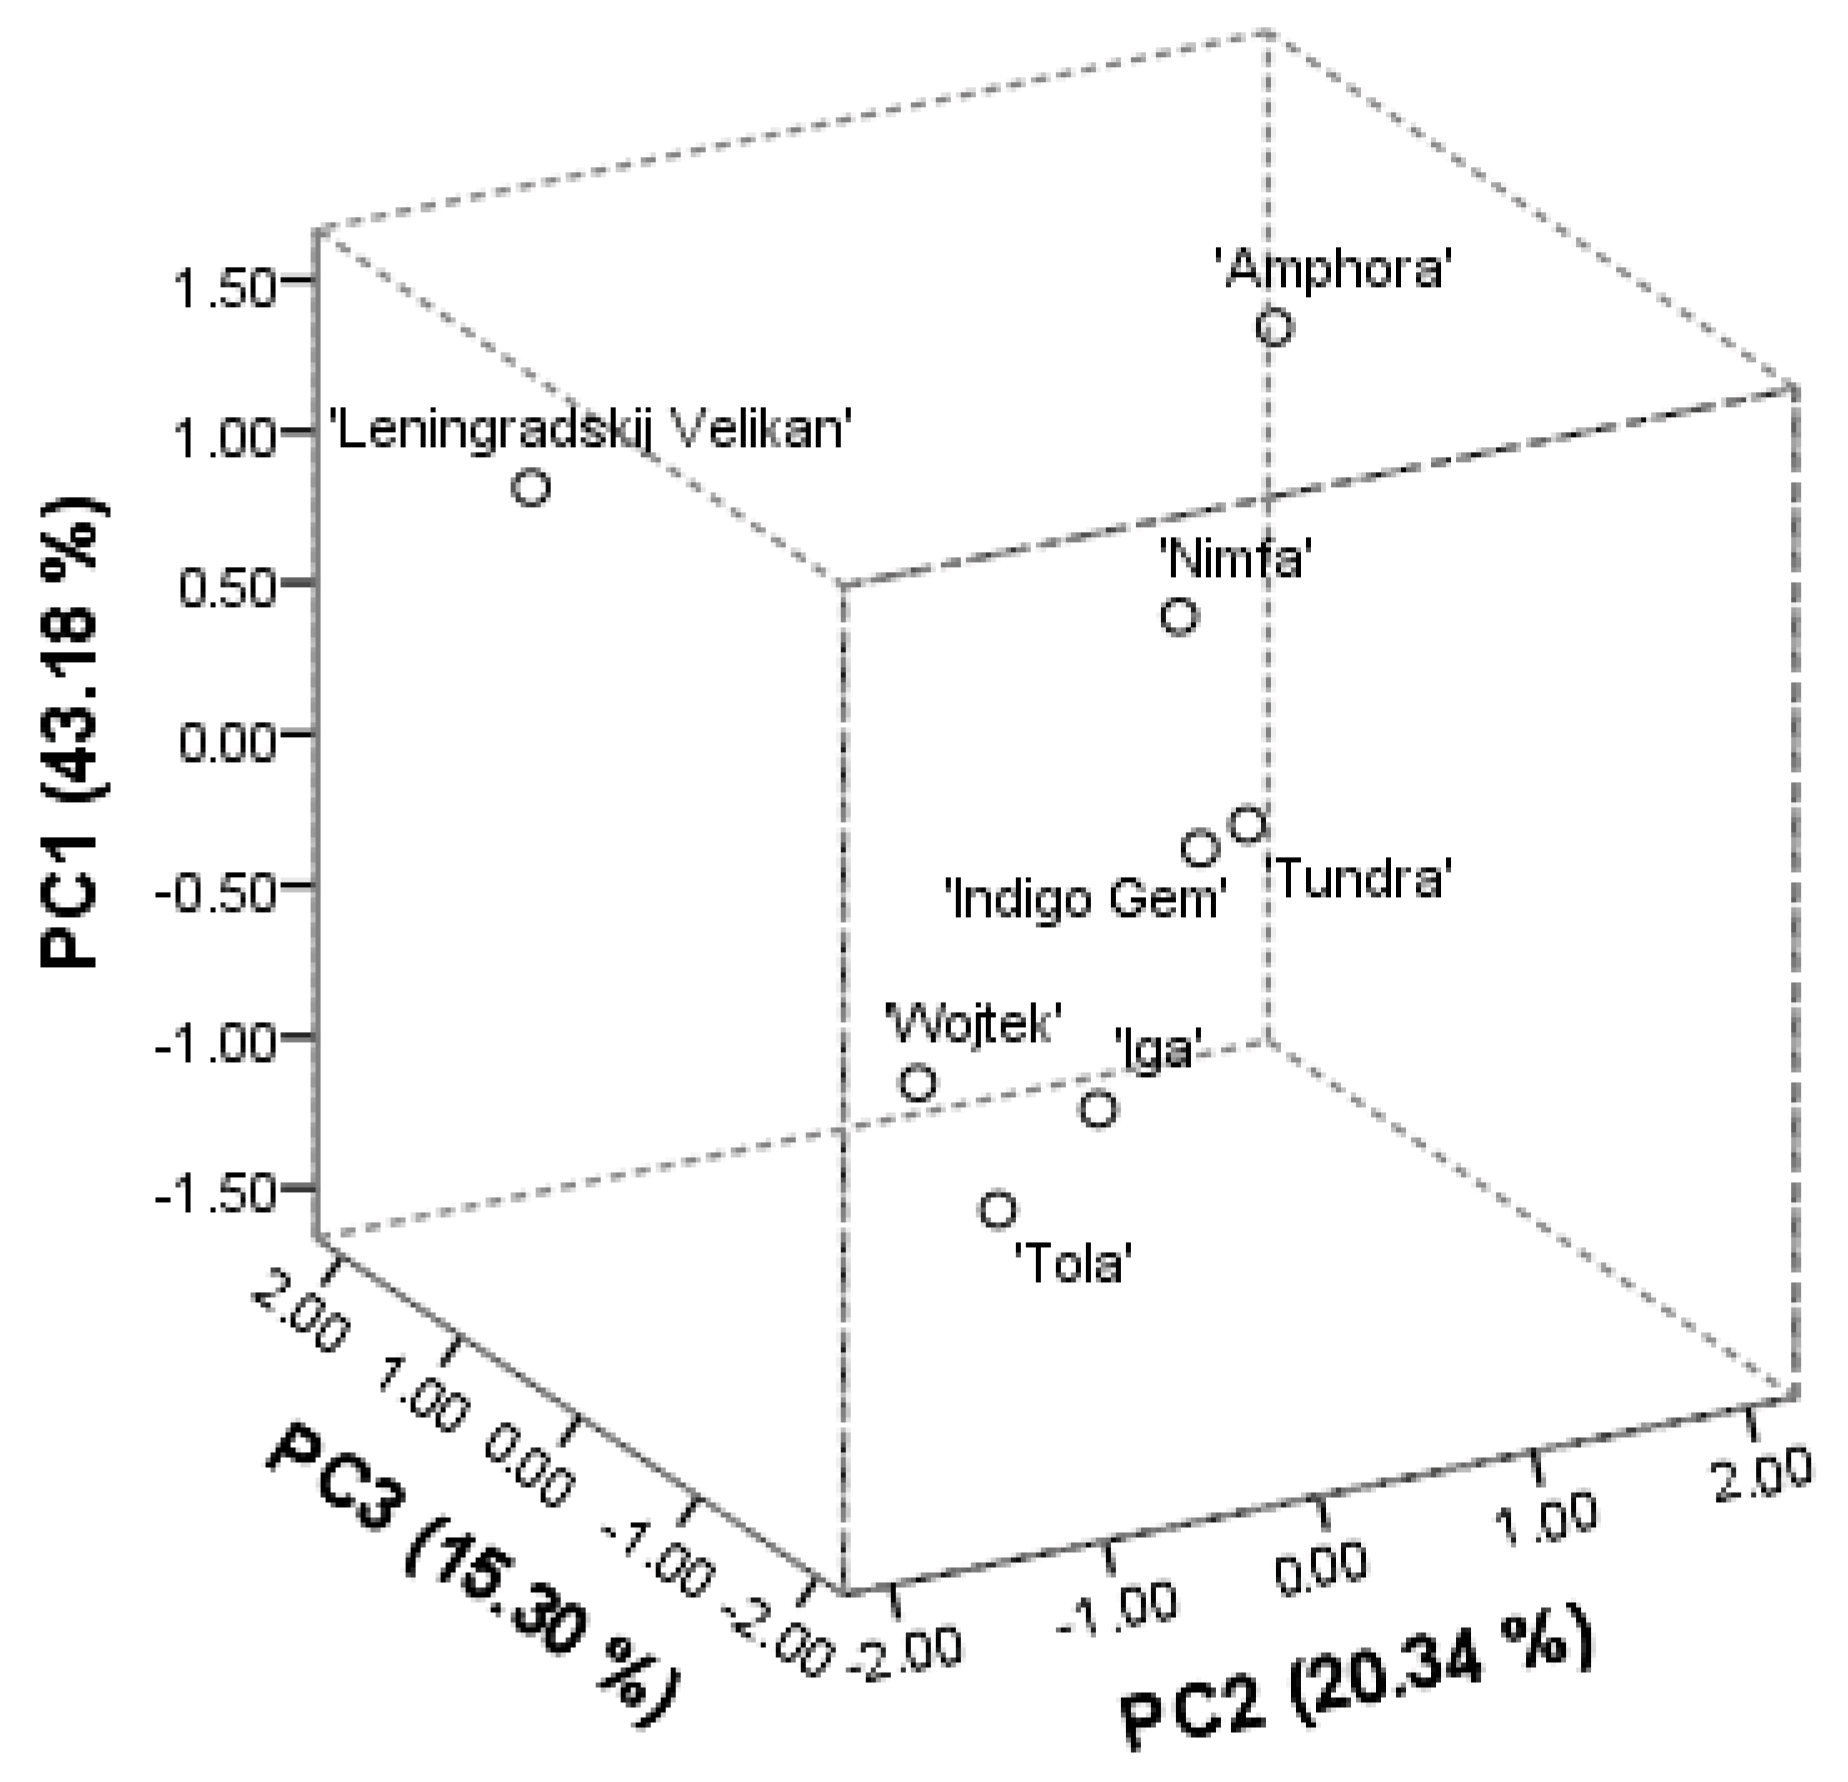
The principal component (PCA) analysis was performed on the phytochemical profile components, anthocyanins, flavones, flavan-3-ols, flavonols, proanthocyanidins, and hydroxycinnamic acids. The three main derived principal components explained 78.82% of the total variance. The score plot model has shown good separation between the investigated cultivars of
L. caerulea. The PC1 was positively correlated with the amounts of identified anthocyanins, namely cyanidin (0.927), peonidin (0.956), cyanidin-3-glucoside (0.945), peonidin-3-glucoside (0.937), cyanidin-3-galactoside (0.915), cyanidin-3-rutinoside (0.836), cyanidin-3,5-diglucoside (0.799), and constituted 43.18%. The PC2 described 20.34% of the total variance and correlated positively with all the determined caffeoylquinic acids (0.675–0.918), procyanidin B1 (0.530). The PC3 accounted for 15.30% of the total variance and was well correlated with the amounts of procyanidin B1 (0.592) and flavonoid aglycones, namely apigenin, quercetin, (0.823, −0.958, respectively). The arrangements of score plots of investigated cultivars are shown in
Figure 2. The first segregated group included ‘Wojtek’, ‘Iga’, and ‘Tola’ cultivars. They all were characterized by the lowest amounts of anthocyanins, proanthocyanidins, rutin, isoquercitrin, dicaffeoylquinic acids, and lowest or average reducing and radical scavenging activities. On the other hand, this group was distinguished with the greatest amounts of luteolin-7-
O-glucoside, as well as, greatest fruit weight, and the highest score of appearance. The second group included ‘Indigo Gem’ and ‘Tundra’ cultivars. They possessed the greatest reducing activities in FRAP and above the average in CuPRAC assays, as well as high amounts of cyanidin-3-glucoside. Although, they had the lowest shrub height and fruit weight. Cultivars ’Leningradskij Velikan’, ‘Nimfa’, and ‘Amphora’ tended to be specific. Cultivar ‘Amphora’ distinguished with the highest amounts of anthocyanins and flavonol derivatives. Samples of the ‘Leningradskij Velikan’ cultivar were the richest in procyanidins, and flavonoid aglycones, namely apigenin, isorhamnetin. Both cultivars possessed high shrub width and the greatest density. Cultivar ‘Nimfa’ can be characterized by the greatest amounts of individual caffeoylquinic acids. The origin place of the cultivar determines the phytogeographical profile in a qualitative and quantitative manner. Numerous studies support information, that Russian cultivars contain higher amounts of phytochemicals [
3,
4,
17]. In our study, the PCA analysis on phenolics clearly defined the cultivars into groups in the relation to their origin. The lowest (
p < 0.05) total amounts of all groups of identified compounds, as well as, the lowest antioxidant capacities were determined for the Polish cultivars, namely ‘Wojtek’, ‘Iga’ and ‘Tola’. Genotype characterization resulted in the highest appearance and fruit weight scores. The Canadian cultivars ‘Indigo Gem’ and ‘Tundra’ were distinguished with the highest ferric reducing antioxidant power and low fruit weight. The Russian cultivars had the greatest anthocyanin contents and were specific in dominant phenolics of different chemical groups.

 ,
, 


