
Transforming Heart Failure Management: The Power of Strain Imaging, 3D Imaging, and Vortex Analysis in Echocardiography

 ,
,  , , , , , , , , and
Abstract
:1. Introduction
2. Three-Dimensional Echocardiography
2.1. Clinical Applications
- Left ventricular function: This technology allows for a more accurate evaluation of the left ventricle (LV) function, avoiding geometric assumptions regarding the LV shape. It provides faster, more accurate, and reproducible measurements of ventricular volumes, compared to traditional 2DE (Figure 1).
- 2.
- LV desynchrony: For this assessment, the segmental LV volumes are tracked throughout the cardiac cycle. This temporal analysis allows for the identification of differences in the timing of each segment reaching its minimal volume, which corresponds to the maximal contraction. Under normal physiological conditions, all the LV segments reach their minimal volume simultaneously during ventricular systole. However, in the presence of dyssynchrony, there is a temporal dispersion, with diseased segments achieving the minimal volume later in systole. The systolic dyssynchrony index (SDI) quantifies dyssynchrony by calculating the standard deviation of the times to the regional minimal volume across all the segments. Studies have demonstrated that the SDI is a strong predictor of cardiac resynchronization therapy (CRT) response, with significant predictive power observed at 48 h [8], as well as at 6-month and 1-year follow-ups [9]. Additionally, the importance of the optimal LV pacing lead placement has been highlighted in studies using 3DE. Patients with pacing leads positioned at the site of the maximal mechanical delay experienced significantly greater improvements in the LV function, reverse remodeling, and peak oxygen consumption compared to those with leads placed distal to the optimal site [10].
- 3.
- Valve assessment: Three-dimensional echocardiography offers detailed visualization of the heart valves, which is crucial for diagnosing and planning surgical interventions in patients with valve diseases, such as stenosis or regurgitation (Figure 3). The ability to visualize the valves in three dimensions allows clinicians to measure the exact size and shape of the valve orifice, the extent of leaflet prolapse, and the severity of regurgitation or stenosis. This detailed assessment helps in selecting the most appropriate treatment strategy, whether it be surgical repair, valve replacement, or percutaneous interventions.
- 4.
- Interventional procedure and cardiac surgery: It is used for intraoperative monitoring during complex cardiac surgeries, providing real-time visual guidance that can improve surgical outcomes. In procedures such as transcatheter aortic and mitral valve replacements, mitral valve repairs, or the closure of atrial septal defects, real-time 3DE imaging provides invaluable guidance. It allows for the accurate positioning of catheters and devices, ensuring optimal procedural outcomes and reducing the risk of complications. The ability to visualize the heart and the devices in three dimensions enhances the precision of these interventions and improves patient safety.
- 5.
- Assessment of atrial function: It allows for the detailed evaluation of the atrial size, shape, and function, which is important in conditions such as atrial fibrillation and atrial septal defects. The ability to visualize the atria in three dimensions provides a better understanding of their pathophysiology and helps in planning interventions such as catheter ablation or the surgical closure of defects [11,12,13].
2.2. Limitations
3. Myocardial Strain Imaging
3.1. Clinical Applications
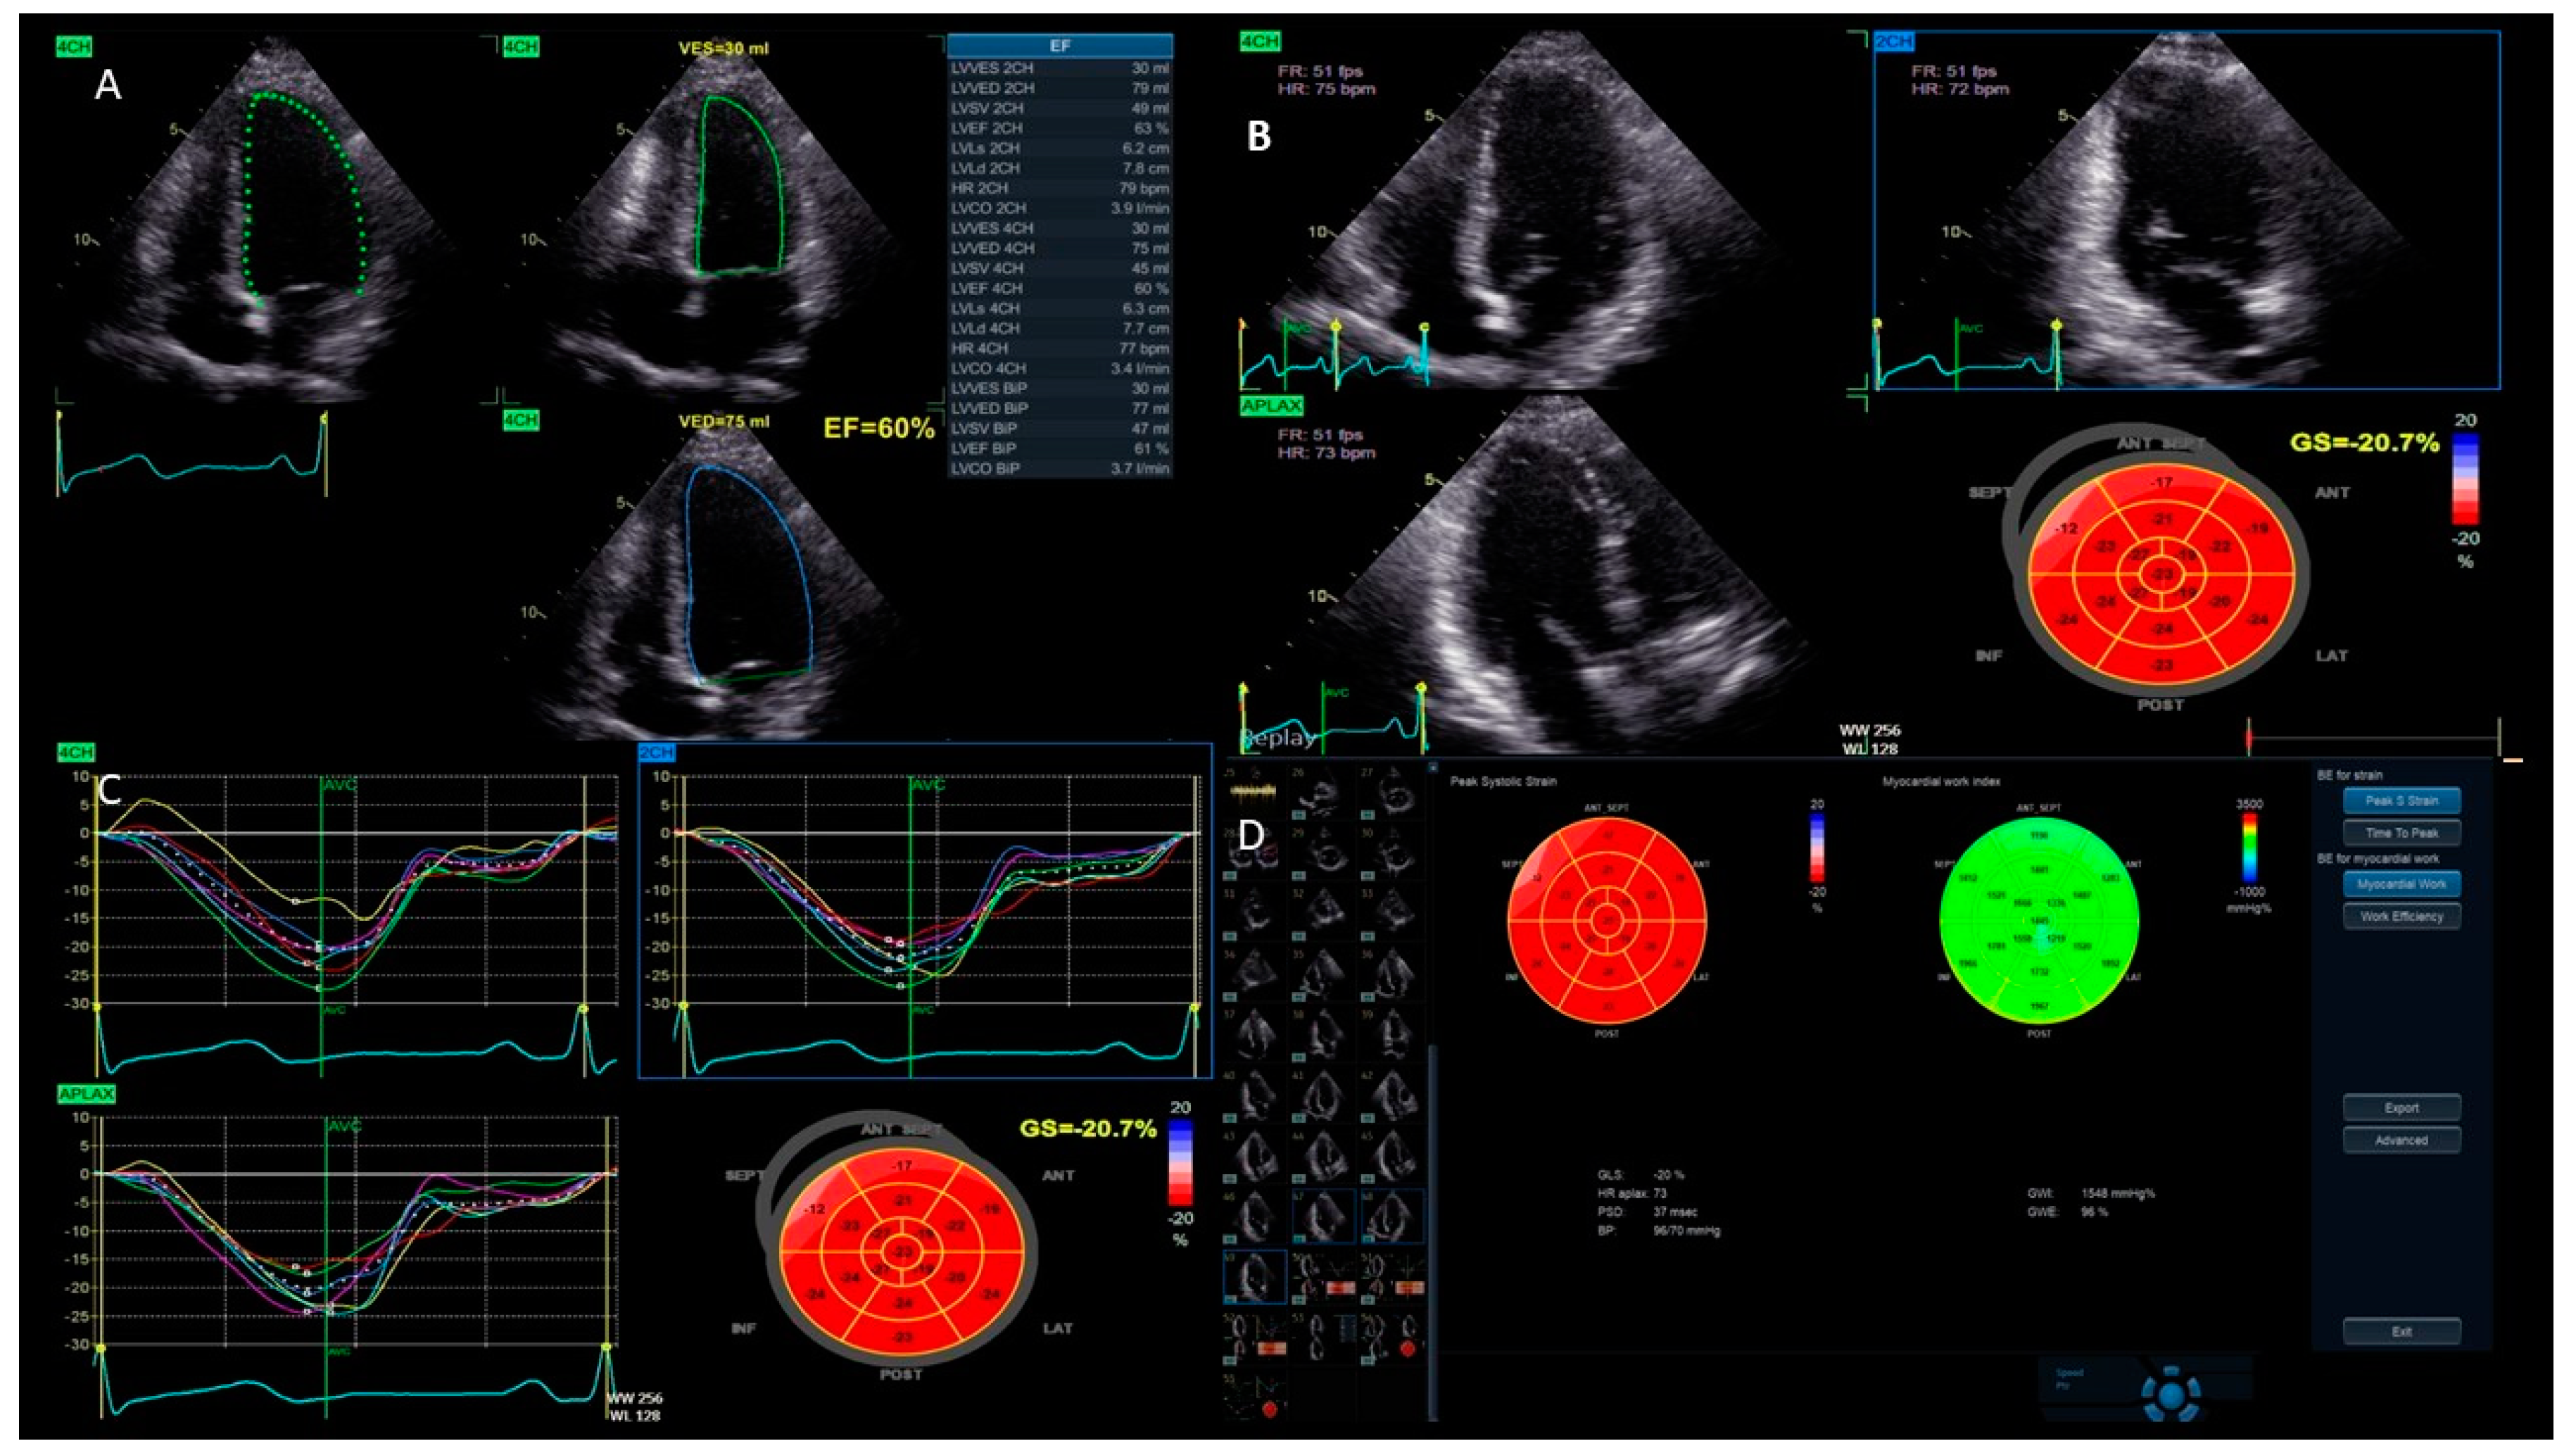
- Left ventricular function: One of the main uses of strain imaging is to detect early subclinical myocardial dysfunction. For instance, in patients undergoing chemotherapy, strain imaging can detect early signs of heart damage before a significant reduction in the LVEF occurs. This allows for prompt intervention and adjustments to the cancer treatment to prevent further harm to the myocardium [17,18]. The current definitions of cancer therapy-related cardiac dysfunction primarily rely on a reduction in the LVEF and/or a relative decrease in the GLS beyond a specific threshold [19]. As a result, baseline cardiac assessments are recommended for all patients prior to initiating cardiotoxic cancer treatments. GLS assessment using speckle tracking, particularly from three apical views, is strongly advised at the baseline, especially for patients at a moderate-to-high risk. It is important to acknowledge that strain measurements may vary between different vendors. Therefore, to ensure consistency, serial GLS evaluations for each patient should be conducted using the same equipment and software. A median GLS reduction of 13.6% has been identified as a predictor of future LVEF decline, with an upper limit of 15% recommended as the threshold for GLS reduction during cancer therapy to enhance specificity [19,20]. These measurements help stratify the risk of cancer treatment-related cardiovascular toxicity and identify significant changes during therapy. Notably, a normal LVEF does not exclude the presence of cancer treatment-related cardiac dysfunction; GLS, instead, can reliably detect early systolic impairment. For instance, Muckiene et al. demonstrated that a reduction in GLS is significantly linked to early anthracycline-induced cardiotoxicity in patients undergoing anthracycline-based chemotherapy. This finding suggests that GLS could potentially serve as a predictor for any subsequent declines in the LVEF associated with this chemotherapy regimen [21]. In the assessment of ischemic heart disease, strain imaging provides valuable information about regional myocardial function [16]. During an ischemic event, specific areas of the myocardium may show reduced strain, indicating impaired contractility. This technique can help identify a viable but hibernating myocardium, which can benefit from revascularization procedures. Strain imaging is also useful in evaluating the effectiveness of reperfusion therapies following acute myocardial infarction by assessing the recovery of myocardial function in the affected regions [22,23,24]. Furthermore, the management of HF patients benefits significantly from strain imaging. It offers a more sensitive measure of myocardial function compared to traditional echocardiographic parameters (Figure 4). GLS has been shown to correlate better with outcomes in heart failure patients, providing prognostic information that aids in clinical decision-making. In patients with HF with mildly reduced ejection fraction (HFmrEF), strain imaging can uncover subtle myocardial dysfunction that is often missed by conventional measures. Chang et al. demonstrated that in patients with HFmrEF, a LV GLS cut-off value of −11% effectively differentiated the subsequent risk of cardiovascular death [25]. This enhances the understanding and management of this complex condition [26].
- Cardiomyopathies: In hypertrophic cardiomyopathy (HCM), strain imaging can identify areas of abnormal myocardial mechanics that are indicative of the disease [27,28]. Reduced strain in the thickened segments of the LV, usually correlated with the extent of late gadolinium enhancement in a cardiac MRI, can signal the presence of fibrosis and assist in assessing the risk of sudden cardiac death [29]. Similarly, in dilated cardiomyopathy (DCM), strain imaging allows for a detailed evaluation of the global and regional myocardial function, aiding in the monitoring of disease progression and response to therapy [30]. Moreover, the relative apical sparing of the GLS ratio (the average of the apical longitudinal strain/the average of the combined mid and basal longitudinal strain > 1) is typically presented in cardiac amyloidosis, both associated with light chain and transthyretin deposits [31]. A reduced longitudinal strain with an apical sparing pattern is therefore considered a typical red flag disease [32].
- LV dyssynchrony: This technique evaluates the mechanical function of various segments of the LV to identify patients who are suitable for CRT and to monitor their response to the therapy [33,34]. Although cardiac imaging has not yet been proven to be effective for selecting candidates for CRT, there is emerging evidence supporting the use of strain imaging to identify the optimal placement of the pacing lead on the LV free wall [35]. Several studies have shown that positioning the lead in the area of the latest mechanical activation leads to better clinical outcomes [36]. Additionally, it is crucial to avoid placing the lateral lead over regions of transmural scarring. A peak radial strain value of less than 10% has been suggested as a marker for identifying the scar tissue [37].
- Valve assessment: Strain imaging provides additional insight into the effect of valvular lesions on myocardial function. For example, in aortic stenosis, strain imaging can detect early myocardial dysfunction before the onset of obvious HF symptoms, helping to determine the optimal timing for surgical intervention [38,39]. Likewise, in mitral regurgitation, it assists in evaluating the compensatory mechanisms and identifying the point at which myocardial function starts to deteriorate, thereby aiding in the decision-making process for valve repair or replacement [40]. Characteristically, the longitudinal strain impairment detected in individuals with mitral valve prolapse is more regional than global, with a distinct involvement of the left ventricular basal inferolateral segments and a relative sparing of the apical region [41].
- Congenital heart disease: Strain imaging is being used more and more in this field. It provides detailed functional assessments that are crucial for managing complex congenital anomalies. In patients with repaired congenital heart defects, strain imaging can monitor long-term myocardial function and detect early signs of dysfunction that may require further intervention [42]. A recent meta-analysis demonstrated that myocardial deformation parameters can be used for risk stratification in congenital heart disease (CHD) follow-ups, with an added clinical value over conventional echocardiography [43]. Indeed, in CHD, the anatomy of the ventricles is frequently distorted by the congenital abnormalities, the different surgeries, and the percutaneous procedures, with abnormal loading conditions related to the disease and surgical sequels, as well as residual lesions. In these conditions, the use of parameters that are independent by geometrical assumption, less affected by loading conditions, and not influenced by tethering provides obvious advantages over any geometric- or volumetric-based functional parameter [44]. Single ventricle strain was predictive of outcomes in hypoplastic left heart syndrome during the interstage period [45].
3.2. Limitations
4. Vortex Dynamics Imaging
4.1. Clinical Applications
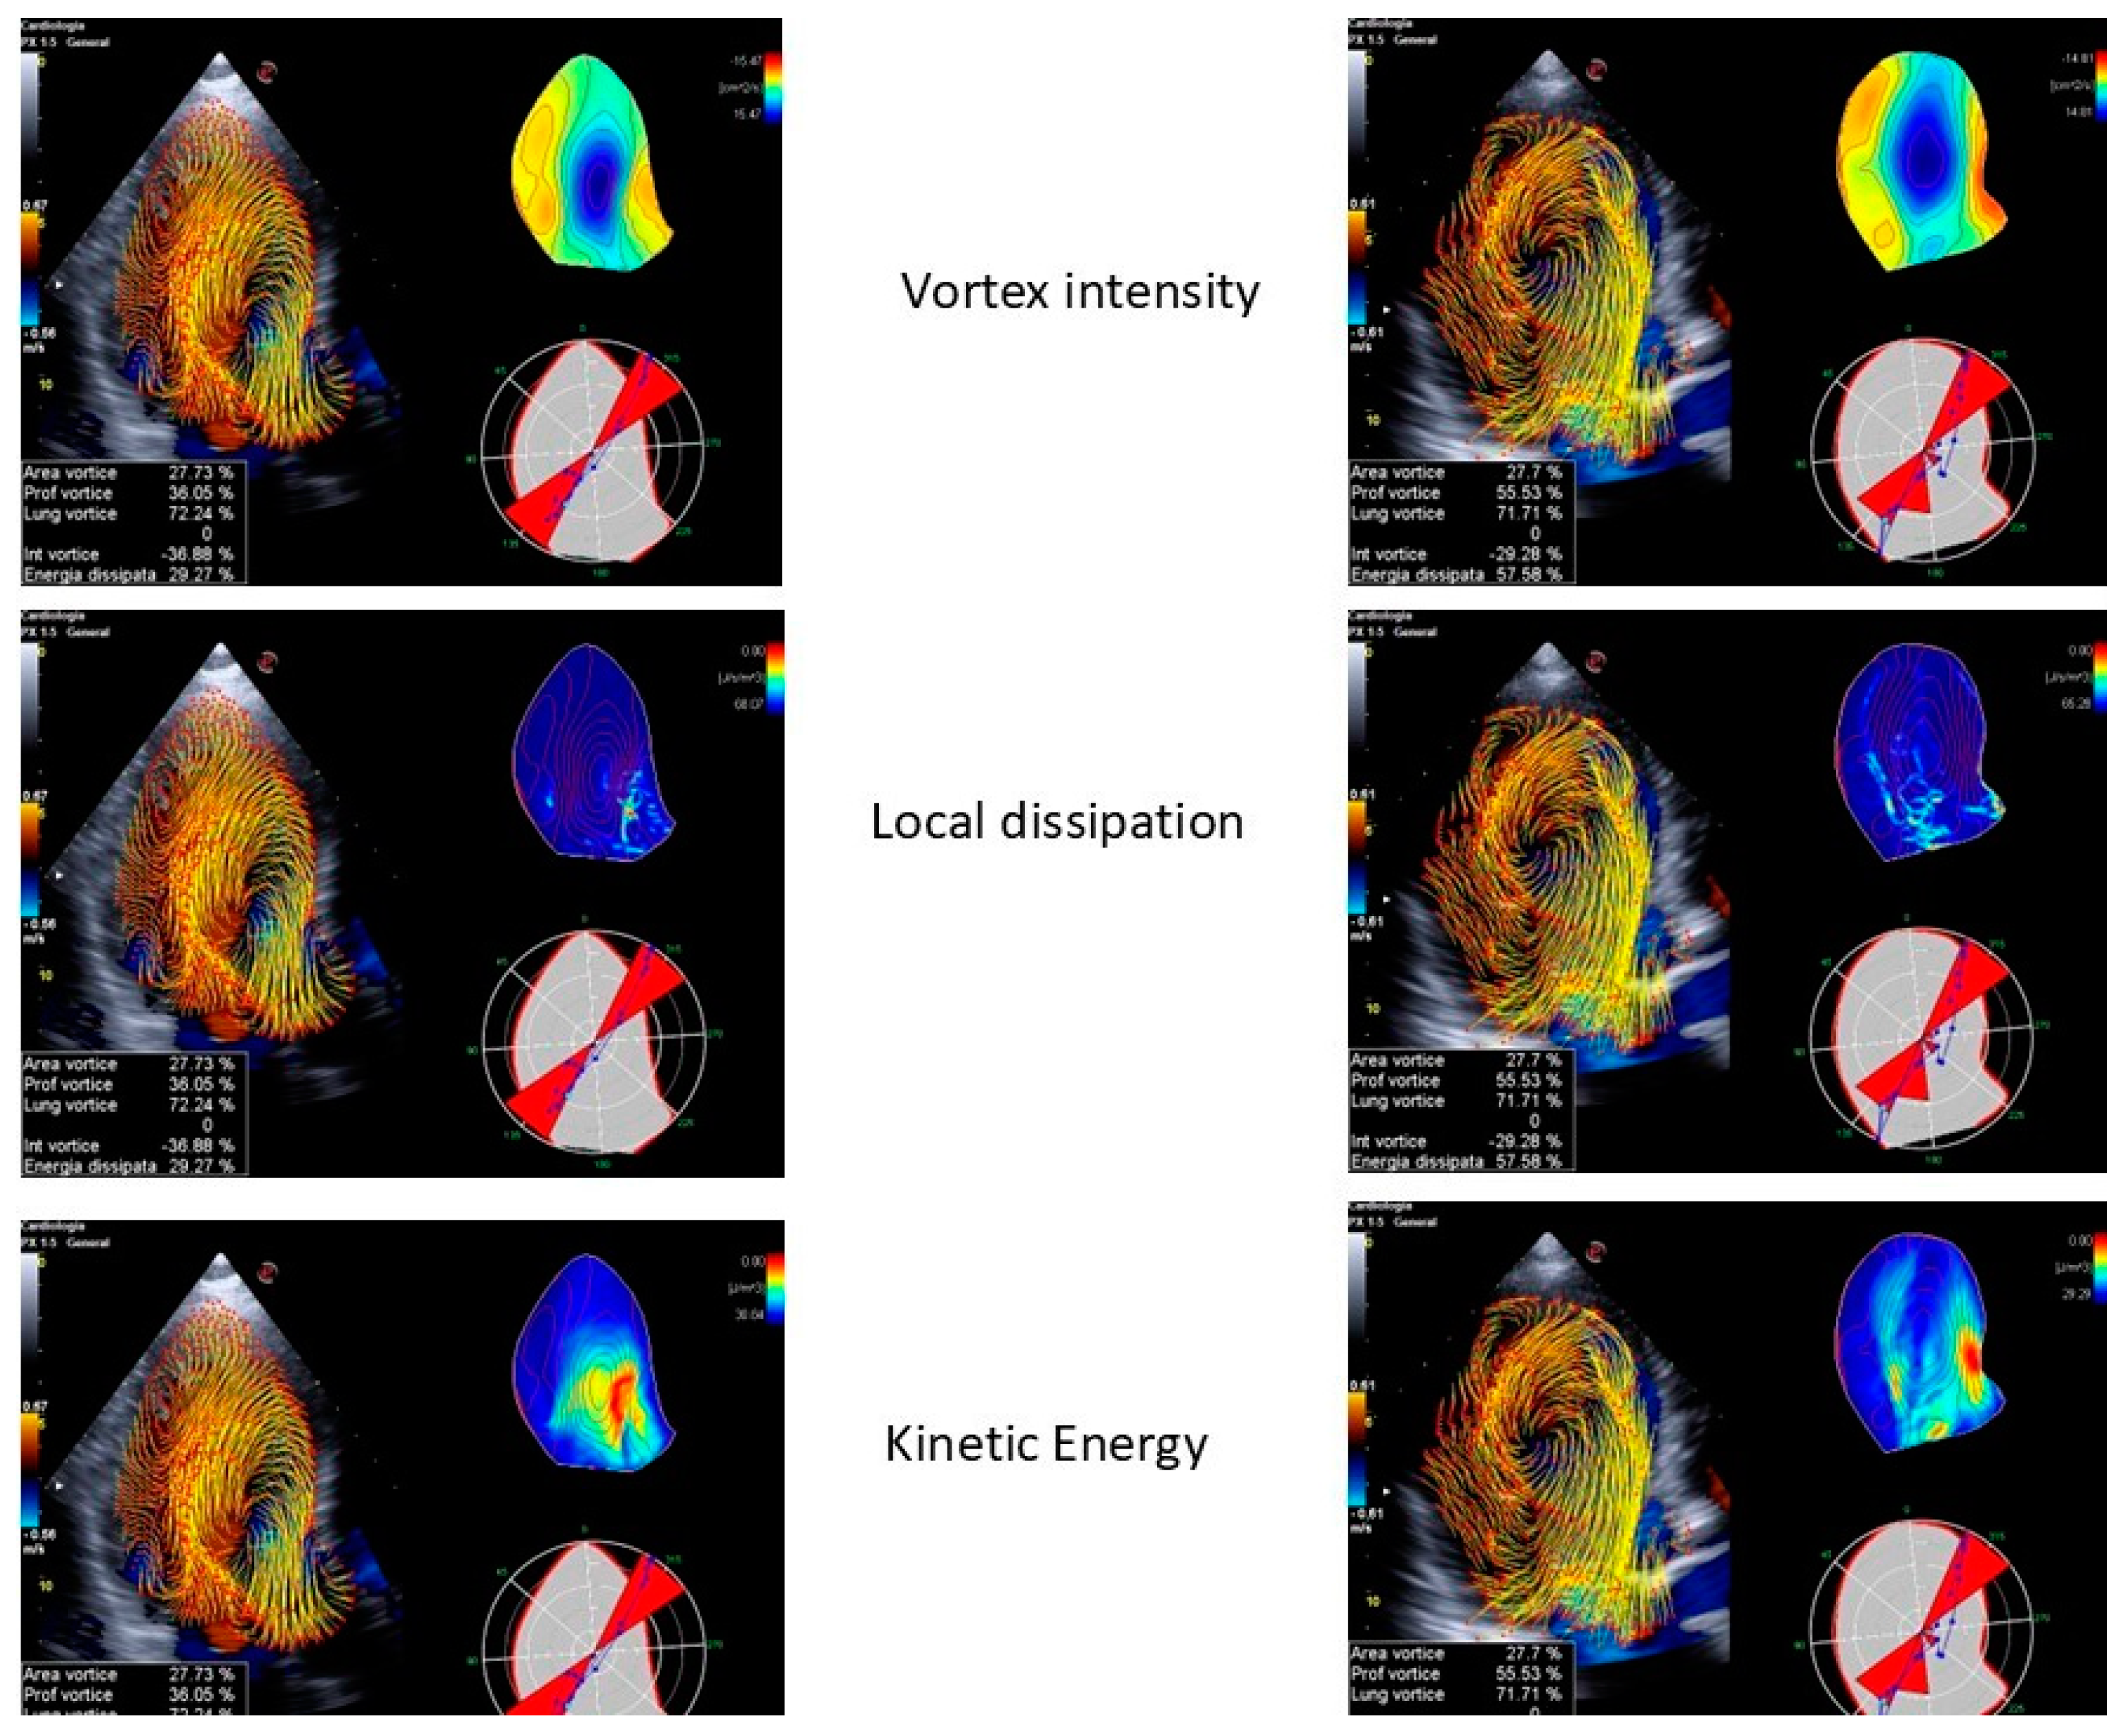
- LV function: Vortex imaging helps clinicians visualize and measure the vortices within the LV, which are crucial for the efficient blood ejection and filling. By analyzing these flow patterns, clinicians can identify early signs of LV dysfunction that might not be obvious using standard measures. Two vortex components were consistently observed following each transmitral filling wave. The anterior vortex was analyzed due to its greater relevance in the cardiac cycle, occurring after early filling and atrial contraction. The vortex generated after early filling appears to aid LV inflow and plays a more prominent role in individuals with impaired relaxation. The vortex formed after atrial contraction seems to store kinetic energy and redirect the flow toward the outflow tract, facilitating ejection and contributing to the mitral valve closure [56]. Diastolic vortices are especially important for assessing the left atrial function and ventricular filling pressures. This is particularly valuable in conditions like heart failure with a preserved ejection fraction, where vortex dynamics can reveal underlying diastolic dysfunction [56]. Moreover, a reduced vortex formation time (VFT), a dimensionless index used to quantify the vortex development, strongly correlates with LV dysfunction and predicts adverse outcomes in patients with HF [57]. As an example, the VFT ranged between 3.3 and 5.5 in healthy subjects, but decreased to values < 2.0 in patients with dilated cardiomyopathy [58].
- Valve disease: In mitral regurgitation, vortex imaging can depict the altered flow patterns caused by the regurgitant jet, helping to quantify the severity of the lesion and its effect on the LV filling. Restoring normal intracardiac LV flow patterns, as observed primarily after mitral valve replacements, may help preserve kinetic energy momentum, thereby reducing the LV workload and shear stress. A recent study revealed that intracardiac blood flow patterns are restored after mitral valve repairs, regardless of the repair technique used. In contrast, a mitral valve replacement with either biological or mechanical prostheses in non-anatomical orientations is associated with persistent alterations in the blood flow. A transcatheter edge-to-edge repair completely disrupts the LV vortices, while a transcatheter mitral valve replacement with a Tendyne valve has an effect similar to a mitral valve repair in restoring normal flow patterns [59]. Similarly, in aortic stenosis, the technique can illustrate the turbulent flow distal to the stenotic valve, offering a visual representation of the hemodynamic burden on the LV (Figure 5 and Figure 6). This information aids in the decision-making process for valve repairs or replacements by providing a more nuanced understanding of the disease’s impact on cardiac function [60,61]. Some studies have reported that aortic stenosis is associated with reduced LV filling efficiency, resulting in decreased VFT values. However, in patients with aortic stenosis and moderate aortic insufficiency, the VFT significantly increases, suggesting that the VFT may be an unreliable index of LV filling efficiency when competitive diastolic flows into the LV are present [62].
- Congenital heart diseases: CHDs often involve complex intracardiac flow abnormalities that can be challenging to assess with traditional imaging techniques. Vortex imaging is particularly effective in this area, providing a detailed visualization of abnormal flow patterns, which is essential for accurate diagnosis and surgical planning. For instance, in conditions such as the Tetralogy of Fallot or the transposition of the great arteries, vortex imaging can depict the intricate flow dynamics and help in understanding the physiological consequences of the defects. In patients with transposition of the great arteries, an increased flow across the pulmonary valve secondary to a large ventricular septal defect may be responsible for a Doppler gradient at the level of the pulmonary valve, mimicking a pulmonary stenosis. In this case, the differentiation between a real valvular stenosis and a gradient secondary to volume overload is extremely important in defining the surgical timing and the type of surgery (arterial switch and ventricular septal defect closure vs. Rastelli operation). These are the kinds of situations where the traditional Doppler and color Doppler techniques demonstrate all their limitations. The use of blood speckle imaging to study flow dynamics has proven to be helpful in formulating the correct diagnosis, especially in this difficult context [63]. Post-surgical follow-ups in CHD patients also benefit from vortex imaging, as it can monitor the restoration or alteration of normal flow patterns [60].
- LV dyssynchrony: Vortex imaging can assess the changes in intracavitary flow patterns before and after the CRT implantation, providing insights into the therapy’s effectiveness. Goliasch et al. utilized vortex imaging to assess the impact of an acute interruption and reactivation of the CRT. Deactivating the CRT significantly disrupted the LV filling, resulting in the reduced mitral inflow acceleration and increased total diastolic volume. This, in turn, led to the formation of an underdeveloped diastolic vortex, which impaired the transfer of kinetic energy from diastole to systole, delayed the redirection of the blood flow toward the aorta, and hindered the timely opening of the aortic valve, thereby prolonging the isovolumetric contraction period [64]. Upon the reactivation of the CRT, the LV filling improved immediately, and the total diastolic volume decreased. This restored the optimal timing of the diastolic vortex formation and shortened the isovolumetric interval [64]. By visualizing the improvement in flow efficiency and the reduction in dysfunctional vortices, clinicians can better evaluate the success of a CRT and make adjustments as needed to optimize patient outcomes.
- Cardiomyopathies: In DCM, vortex imaging helps to evaluate the impact of dilated chambers on intracardiac flow and to pinpoint the regions of flow stagnation that may contribute to thrombus formation. Furthermore, vortex patterns are used to gauge the severity of HF, as fragmented or abnormal patterns are associated with increased cardiac dysfunction [65].
4.2. Limitations
5. Multimodality Imaging
5.1. Integrative Approach
5.2. Emerging Technologies
5.3. Advanced Imaging in Clinical Practice
6. Future Directions and Research
7. Conclusions
Author Contributions
Funding
Informed Consent Statement
Data Availability Statement
Conflicts of Interest
Abbreviations
References
- Pergola, V.; Cameli, M.; Mattesi, G.; Mushtaq, S.; D’Andrea, A.; Guaricci, A.I.; Pastore, M.C.; Amato, F.; Dellino, C.M.; Motta, R.; et al. Multimodality Imaging in Advanced Heart Failure for Diagnosis, Management and Follow-Up: A Comprehensive Review. J. Clin. Med. 2023, 12, 7641. [Google Scholar] [CrossRef]
- Pergola, V.; D’Andrea, A.; Galzerano, D.; Mantovani, F.; Rizzo, M.; Giannuario, G.D.; Khoury, G.; Polizzi, V.; Rabia, G.; Gimelli, A.; et al. Unveiling the Hidden Chamber: Exploring the Importance of Left Atrial Function and Filling Pressure in Cardiovascular Health. J. Cardiovasc. Echogr. 2023, 33, 117–124. [Google Scholar] [CrossRef]
- Marwick, T.H.; Shah, S.J.; Thomas, J.D. Myocardial Strain in the Assessment of Patients with Heart Failure: A Review. JAMA Cardiol. 2019, 4, 287–294. [Google Scholar] [CrossRef] [PubMed]
- Nagueh, S.F.; Appleton, C.P.; Gillebert, T.C.; Marino, P.N.; Oh, J.K.; Smiseth, O.A.; Waggoner, A.D.; Flachskampf, F.A.; Pellikka, P.A.; Evangelisa, A. Recommendations for the evaluation of left ventricular diastolic function by echocardiography. Eur. J. Echocardiogr. J. Work. Gr. Echocardiogr. Eur. Soc. Cardiol. 2009, 10, 165–193. [Google Scholar] [CrossRef] [PubMed]
- Sperlongano, S.; D’Andrea, A.; Mele, D.; Russo, V.; Pergola, V.; Carbone, A.; Ilardi, F.; Di Maio, M.; Bottino, R.; Giallauria, F.; et al. Left Ventricular Deformation and Vortex Analysis in Heart Failure: From Ultrasound Technique to Current Clinical Application. Diagnostics 2021, 11, 892. [Google Scholar] [CrossRef]
- Pestelli, G.; Pergola, V.; Totaro, G.; Previtero, M.; Aruta, P.; Cecchetto, A.; Fiorencis, A.; Palermo, C.; Iliceto, S.; Mele, D. Value of Left Ventricular Indexed Ejection Time to Characterize the Severity of Aortic Stenosis. J. Clin. Med. 2022, 11, 1877. [Google Scholar] [CrossRef]
- Lang, R.M.; Badano, L.P.; Tsang, W.; Adams, D.H.; Agricola, E.; Buck, T.; Faletra, F.F.; Franke, A.; Hung, J.; de Isla, L.P.; et al. EAE/ASE recommendations for image acquisition and display using three-dimensional echocardiography. Eur. Heart J. Cardiovasc. Imaging 2012, 13, 1–46. [Google Scholar] [CrossRef]
- Marsan, N.A.; Bleeker, G.B.; Ypenburg, C.; Ghio, S.; van de Veire, N.R.; Holman, E.R.; van der Wall, E.E.; Tavazzi, L.; Schalij, M.J.; Bax, J.J. Real-time three-dimensional echocardiography permits quantification of left ventricular mechanical dyssynchrony and predicts acute response to cardiac resynchronization therapy. J. Cardiovasc. Electrophysiol. 2008, 19, 392–399. [Google Scholar] [CrossRef]
- Soliman, O.I.I.; Geleijnse, M.L.; Theuns, D.A.M.J.; van Dalen, B.M.; Vletter, W.B.; Jordaens, L.J.; Metawei, A.K.; Al-Amin, A.M.; ten Cate, F.J. Usefulness of left ventricular systolic dyssynchrony by real-time three-dimensional echocardiography to predict long-term response to cardiac resynchronization therapy. Am. J. Cardiol. 2009, 103, 1586–1591. [Google Scholar] [CrossRef] [PubMed]
- Becker, M.; Hoffmann, R.; Schmitz, F.; Hundemer, A.; Kühl, H.; Schauerte, P.; Kelm, M.; Franke, A. Relation of optimal lead positioning as defined by three-dimensional echocardiography to long-term benefit of cardiac resynchronization. Am. J. Cardiol. 2007, 100, 1671–1676. [Google Scholar] [CrossRef]
- Lang, R.M.; Badano, L.P.; Mor-Avi, V.; Afilalo, J.; Armstrong, A.; Ernande, L.; Flachskampf, F.A.; Foster, E.; Goldstein, S.A.; Kuznetsova, T.; et al. Recommendations for cardiac chamber quantification by echocardiography in adults: An update from the American Society of Echocardiography and the European Association of Cardiovascular Imaging. J. Am. Soc. Echocardiogr. Off. Publ. Am. Soc. Echocardiogr. 2015, 28, 1–39.e14. [Google Scholar] [CrossRef]
- Yu, Z.-X.; Yang, W.; Yin, W.-S.; Peng, K.X.; Pan, Y.L.; Chen, W.W.; Du, B.B.; He, Y.Q.; Yang, P. Clinical utility of left atrial strain in predicting atrial fibrillation recurrence after catheter ablation: An up-to-date review. World J. Clin. Cases 2022, 10, 8063–8075. [Google Scholar] [CrossRef]
- Martini, L.; Lisi, M.; Pastore, M.C.; Righini, F.M.; Rubboli, A.; Henein, M.Y.; Cameli, M. The Role of Speckle Tracking Echocardiography in the Evaluation of Advanced-Heart-Failure Patients. J. Clin. Med. 2024, 13, 4037. [Google Scholar] [CrossRef] [PubMed]
- Brady, B.; King, G.; Murphy, R.T.; Walsh, D. Myocardial strain: A clinical review. Ir. J. Med. Sci. 2023, 192, 1649–1656. [Google Scholar] [CrossRef] [PubMed]
- Voigt, J.U.; Cvijic, M. 2- and 3-Dimensional Myocardial Strain in Cardiac Health and Disease. JACC Cardiovasc. Imaging 2019, 12, 1849–1863. [Google Scholar] [CrossRef] [PubMed]
- Stokke, T.M.; Hasselberg, N.E.; Smedsrud, M.K.; Sarvari, S.I.; Haugaa, K.H.; Smiseth, O.A.; Edvardsen, T.; Remme, E.W. Geometry as a Confounder When Assessing Ventricular Systolic Function: Comparison Between Ejection Fraction and Strain. J. Am. Coll. Cardiol. 2017, 70, 942–954. [Google Scholar] [CrossRef] [PubMed]
- Gorgiladze, N.; Shavdia, M.; Gaprindashvili, T.; Gogua, E.; Gachechiladze, L.; Gujabidze, M.; Pagava, Z. Detection of Cardiotoxicity Using Right Ventricular Free Wall Longitudinal Strain in Low Cardiovascular Risk Breast Cancer Patients Receiving Low-Dose Anthracycline Treatment. Cureus 2024, 16, e63138. [Google Scholar] [CrossRef] [PubMed]
- Liu, R.; Xu, L.A.; Zhao, Z.; Han, R. Application of two-dimensional speckle-tracking echocardiography in radiotherapy-related cardiac systolic dysfunction and analysis of its risk factors: A prospective cohort study. BMC Cardiovasc. Disord. 2024, 24, 328. [Google Scholar] [CrossRef] [PubMed]
- Lyon, A.R.; López-Fernández, T.; Couch, L.S.; Asteggiano, R.; Aznar, M.C.; Bergler-Klein, J.; Boriani, G.; Cardinale, D.; Cordoba, R.; Cosyns, B.; et al. 2022 ESC Guidelines on cardio-oncology developed in collaboration with the European Hematology Association (EHA), the European Society for Therapeutic Radiology and Oncology (ESTRO) and the International Cardio-Oncology Society (IC-OS): Developed by the task force on cardio-oncology of the European Society of Cardiology (ESC). Eur. Heart J. 2022, 43, 4229–4361. [Google Scholar] [CrossRef] [PubMed]
- Oikonomou, E.K.; Kokkinidis, D.G.; Kampaktsis, P.N.; Amir, E.A.; Marwick, T.H.; Gupta, D.; Thavendiranathan, P. Assessment of Prognostic Value of Left Ventricular Global Longitudinal Strain for Early Prediction of Chemotherapy-Induced Cardiotoxicity: A Systematic Review and Meta-analysis. JAMA Cardiol. 2019, 4, 1007–1018. [Google Scholar] [CrossRef]
- Muckiene, G.; Vaitiekus, D.; Zaliaduonyte, D.; Zabiela, V.; Verseckaite-Costa, R.; Vaiciuliene, D.; Juozaityte, E. Prognostic Impact of Global Longitudinal Strain and NT-proBNP on Early Development of Cardiotoxicity in Breast Cancer Patients Treated with Anthracycline-Based Chemotherapy. Medicina 2023, 59, 953. [Google Scholar] [CrossRef]
- Zhou, F.; Yuan, H.; Sun, J.; Ran, H.; Pan, H.; Wu, P.; Yang, Q. Two-dimensional speckle tracking imaging cardiac motion-based quantitative evaluation of global longitudinal strain among patients with coronary Heart Disease and functions of left ventricular ischemic myocardial segment. Int. J. Cardiovasc. Imaging. 2024, 40, 351–359. [Google Scholar] [CrossRef]
- Yu, Z.; Pan, H.; Cheng, Z.; Lu, K.; Hu, H. Evaluation of Left Ventricular Systolic Function in Patients with Coronary Microvascular Dysfunction by Three-Dimensional Speckle-Tracking Imaging. Braz. J. Cardiovasc. Surg. 2022, 37, 321–327. [Google Scholar] [CrossRef]
- Yehia, A.; Zaki, A.; Sadaka, M.; Azeem, A.M.A.E. Incremental prognostic value of speckle tracking echocardiography and early follow-up echo assessment in predicting left ventricular recovery after reperfusion for ST-segment elevation myocardial infarction (STEMI). Echocardiography 2024, 41, e15725. [Google Scholar] [CrossRef]
- Chang, W.-T.; Lin, C.H.; Hong, C.-S.; Liao, C.T.; Liu, Y.W.; Chen, Z.C.; Shih, J.Y. The predictive value of global longitudinal strain in patients with heart failure mid-range ejection fraction. J. Cardiol. 2021, 77, 509–516. [Google Scholar] [CrossRef]
- Ashish, K.; Faisaluddin, M.; Bandyopadhyay, D.; Hajra, A.; Herzog, E. Prognostic value of global longitudinal strain in heart failure subjects: A recent prototype. Int. J. Cardiol. Heart Vasc. 2019, 22, 48–49. [Google Scholar] [CrossRef]
- Di Salvo, G.; Pacileo, G.; Limongelli, G.; Baldini, L.; Rea, A.; Verrengia, M.; D’Andrea, A.; Russo, M.G.; Calabrò, R. Non sustained ventricular tachycardia in hypertrophic cardiomyopathy and new ultrasonic derived parameters. J. Am. Soc. Echocardiogr. Off. Publ. Am. Soc. Echocardiogr. 2010, 23, 581–590. [Google Scholar] [CrossRef]
- Tower-Rader, A.; Betancor, J.; Popovic, Z.B.; Sato, K.; Thamilarasan, M.; Smedira, N.G.; Lever, H.M.; Desai, M.Y. Incremental Prognostic Utility of Left Ventricular Global Longitudinal Strain in Hypertrophic Obstructive Cardiomyopathy Patients and Preserved Left Ventricular Ejection Fraction. J. Am. Heart Assoc. 2017, 6, e006514. [Google Scholar] [CrossRef] [PubMed]
- Zhuang, H.; Yang, K.; Zhao, S.; Wu, J.; Xu, N.; Zhang, L.; Qi, X.; Zhang, M.; Song, L.; Pang, K. Incremental value of myocardial global longitudinal strain in predicting major adverse cardiac events among patients with hypertrophic cardiomyopathy. Echocardiography 2024, 41, e15834. [Google Scholar] [CrossRef] [PubMed]
- Chen, P.; Aurich, M.; Greiner, S.; Maliandi, G.; Müller-Hennessen, M.; Giannitsis, E.; Meder, B.; Frey, N.; Pleger, S.; Mereles, D. Prognostic relevance of global work index and global constructive work in patients with non-ischemic dilated cardiomyopathy. Int. J. Cardiovasc. Imaging 2024, 40, 1575–1584. [Google Scholar] [CrossRef] [PubMed]
- Dorbala, S.; Ando, Y.; Bokhari, S.; Dispenzieri, A.; Falk, R.H.; Ferrari, V.A.; Fontana, M.; Gheysens, O.; Gillmore, J.D.; Glaudemans, A.W.J.M.; et al. ASNC/AHA/ASE/EANM/HFSA/ISA/SCMR/SNMMI Expert Consensus Recommendations for Multimodality Imaging in Cardiac Amyloidosis: Part 2 of 2-Diagnostic Criteria and Appropriate Utilization. J. Card. Fail. 2019, 25, 854–865. [Google Scholar] [CrossRef]
- Garcia-Pavia, P.; Rapezzi, C.; Adler, Y.; Arad, M.; Basso, C.; Brucato, A.; Burazor, I.; Caforio, A.L.P.; Damy, T.; Eriksson, U.; et al. Diagnosis and treatment of cardiac amyloidosis: A position statement of the ESC Working Group on Myocardial and Pericardial Diseases. Eur. Heart J. 2021, 42, 1554–1568. [Google Scholar] [CrossRef]
- Behar, J.M.; Claridge, S.; Jackson, T.; Sieniewicz, B.; Porter, B.; Webb, J.; Rajani, R.; Kapetanakis, S.; Carr-White, G.; Rinaldi, C.A. The role of multi modality imaging in selecting patients and guiding lead placement for the delivery of cardiac resynchronization therapy. Expert Rev. Cardiovasc. Ther. 2017, 15, 93–107. [Google Scholar] [CrossRef]
- Antoniou, N.; Kalaitzoglou, M.; Tsigkriki, L.; Baroutidou, A.; Tsaousidis, A.; Koulaouzidis, G.; Giannakoulas, G.; Charisopoulou, D. Speckle Tracking Echocardiography in Patients with Non-Ischemic Dilated Cardiomyopathy Who Undergo Cardiac Resynchronization Therapy: A Narrative Review. Diagnostics 2024, 14, 1178. [Google Scholar] [CrossRef] [PubMed]
- Glikson, M.; Nielsen, J.C.; Kronborg, M.B.; Michowitz, Y.; Auricchio, A.; Barbash, I.M.; Barrabés, J.A.; Boriani, G.; Braunschweig, F.; Brignole, M.; et al. 2021 ESC Guidelines on cardiac pacing and cardiac resynchronization therapy: Developed by the Task Force on cardiac pacing and cardiac resynchronization therapy of the European Society of Cardiology (ESC) with the special contribution of the European Hear. Eur. Heart J. 2021, 42, 3427–3520. [Google Scholar] [CrossRef]
- Smiseth, O.A.; Torp, H.; Opdahl, A.; Haugaa, K.H.; Urheim, S. Myocardial strain imaging: How useful is it in clinical decision making? Eur. Heart J. 2016, 37, 1196–1207. [Google Scholar] [CrossRef]
- Khan, F.Z.; Virdee, M.S.; Palmer, C.R.; Pugh, P.J.; O’Halloran, D.; Elsik, M.; Read, P.A.; Begley, D.; Fynn, S.P.; Dutka, D.P. Targeted left ventricular lead placement to guide cardiac resynchronization therapy: The TARGET study: A randomized, controlled trial. J. Am. Coll. Cardiol. 2012, 59, 1509–1518. [Google Scholar] [CrossRef]
- Alahdab, F.; Ahmed, A.I.; Nayfeh, M.; Han, Y.; Abdelkarim, O.; Alfawara, M.S.; Little, S.H.; Reardon, M.J.; Faza, N.N.; Goel, S.S.; et al. Myocardial Blood Flow Reserve, Microvascular Coronary Health, and Myocardial Remodeling in Patients with Aortic Stenosis. J. Am. Heart Assoc. 2024, 13, e033447. [Google Scholar] [CrossRef]
- Le, T.-T.; Huang, W.; Singh, G.K.; Toh, D.F.; Ewe, S.H.; Tang, H.C.; Loo, G.; Bryant, J.A.; Ang, B.; Tay, E.L.; et al. Echocardiographic Global Longitudinal Strain Is Associated with Myocardial Fibrosis and Predicts Outcomes in Aortic Stenosis. Front. Cardiovasc. Med. 2021, 8, 750016. [Google Scholar] [CrossRef]
- Daios, S.; Anastasiou, V.; Bazmpani, M.-A.; Angelopoulou, S.M.; Karamitsos, T.; Zegkos, T.; Didagelos, M.; Savopoulos, C.; Ziakas, A.; Kamperidis, V. Moving from left ventricular ejection fraction to deformation imaging in mitral valve regurgitation. Curr. Probl. Cardiol. 2024, 49, 102432. [Google Scholar] [CrossRef] [PubMed]
- Sonaglioni, A.; Fagiani, V.; Nicolosi, G.L.; Lombardo, M. Echocardiographic assessment of left ventricular mechanics in individuals with mitral valve prolapse: A systematic review and meta-analysis. Int. J. Cardiovasc. Imaging 2024, 40, 1617–1629. [Google Scholar] [CrossRef]
- Egbe, A.C.; Miranda, W.R.; Anderson, J.H.; Pellikka, P.A.; Connolly, H.M. Prognostic Value of Left Ventricular Global Longitudinal Strain in Patients With Congenital Heart Disease. Circ. Cardiovasc. Imaging 2022, 15, e014865. [Google Scholar] [CrossRef]
- Dorobantu, D.M.; Amir, N.H.; Wadey, C.A.; Sharma, C.; Stuart, A.G.; Williams, C.A.; Pieles, G.E. The Role of Speckle-Tracking Echocardiography in Predicting Mortality and Morbidity in Patients with Congenital Heart Disease: A Systematic Review and Meta-analysis. J. Am. Soc. Echocardiogr. 2024, 37, 216–225. [Google Scholar] [CrossRef] [PubMed]
- Di Salvo, G.; Pergola, V.; Fadel, B.; Bulbul, Z.A.; Caso, P. Strain Echocardiography and Myocardial Mechanics: From Basics to Clinical Applications. J. Cardiovasc. Echogr. 2015, 25, 1–8. [Google Scholar] [CrossRef] [PubMed] [PubMed Central]
- Borrelli, N.; Di Salvo, G.; Sabatino, J.; Ibrahim, A.; Avesani, M.; Sirico, D.; Josen, M.; Penco, M.; Fraisse, A.; Michielon, G. Serial changes in longitudinal strain are associated with outcome in children with hypoplastic left heart syndrome. Int. J. Cardiol. 2020, 317, 56–62. [Google Scholar] [CrossRef] [PubMed]
- Festa, P.; Lovato, L.; Bianco, F.; Alaimo, A.; Angeli, E.; Baccano, G.; Barbi, E.; Bennati, E.; Bonhoeffer, P.; Bucciarelli, V.; et al. Recommendations for cardiovascular magnetic resonance and computed tomography in congenital heart disease: A consensus paper from the CMR/CCT Working Group of the Italian Society of Pediatric Cardiology and the Italian College of Cardiac Radiology endorsed by the Italian Society of Medical and Interventional Radiology (Part II). J. Cardiovasc. Med. 2024, 25, 473–487. [Google Scholar] [CrossRef] [PubMed]
- Di Salvo, G.; Pacileo, G.; Limongelli, G.; Verrengia, M.; Rea, A.; Santoro, G.; Gala, S.; Castaldi, B.; D’Andrea, A.; Caso, P.; et al. Abnormal regional myocardial deformation properties and increased aortic stiffness in normotensive patients with aortic coarctation despite successful correction: An ABPM, standard echocardiography and strain rate imaging study. Clin. Sci. 2007, 113, 259–266. [Google Scholar] [CrossRef] [PubMed]
- Egbe, A.C.; Miranda, W.R.; Ahmed, M.; Burchill, L.J.; Jain, C.C.; Karnakoti, S.; Kandlakunta, S.; Connolly, H.M. Diagnostic and Prognostic Role of Left Ventricular Strain Imaging in Adults with Coarctation of aorta. Am. J. Cardiol. 2024, 211, 98–105. [Google Scholar] [CrossRef] [PubMed]
- Kheradvar, A.; Houle, H.; Pedrizzetti, G.; Tonti, G.; Belcik, T.; Ashraf, M.; Lindner, J.R.; Gharib, M.; Sahn, D. Echocardiographic particle image velocimetry: A novel technique for quantification of left ventricular blood vorticity pattern. J. Am. Soc. Echocardiogr. Off. Publ. Am. Soc. Echocardiogr. 2010, 23, 86–94. [Google Scholar] [CrossRef]
- Mele, D.; Smarrazzo, V.; Pedrizzetti, G.; Capasso, F.; Pepe, M.; Severino, S.; Luisi, G.A.; Maglione, M.; Ferrari, R. Intracardiac Flow Analysis: Techniques and Potential Clinical Applications. J. Am. Soc. Echocardiogr. Off. Publ. Am. Soc. Echocardiogr. 2019, 32, 319–332. [Google Scholar] [CrossRef]
- Kim, W.Y.; Walker, P.G.; Pedersen, E.M.; Poulsen, J.K.; Oyre, S.; Houlind, K.; Yoganathan, A.P. Left ventricular blood flow patterns in normal subjects: A quantitative analysis by three-dimensional magnetic resonance velocity mapping. J. Am. Coll. Cardiol. 1995, 26, 224–238. [Google Scholar] [CrossRef]
- Stugaard, M.; Koriyama, H.; Katsuki, K.; Masuda, K.; Asanuma, T.; Takeda, Y.; Sakata, Y.; Itatani, K.; Nakatani, S. Energy loss in the left ventricle obtained by vector flow mapping as a new quantitative measure of severity of aortic regurgitation: A combined experimental and clinical study. Eur. Heart J.—Cardiovasc. Imaging 2015, 16, 723–730. [Google Scholar] [CrossRef]
- Uejima, T.; Koike, A.; Sawada, H.; Aizawa, T.; Ohtsuki, S.; Tanaka, M.; Furukawa, T.; Fraser, A.G. A new echocardiographic method for identifying vortex flow in the left ventricle: Numerical validation. Ultrasound Med. Biol. 2010, 36, 772–788. [Google Scholar] [CrossRef]
- Fiorencis, A.; Pepe, M.; Smarrazzo, V.; Martini, M.; Severino, S.; Pergola, V.; Evangelista, M.; Incarnato, P.; Previtero, M.; Maglione, M.; et al. Noninvasive Evaluation of Intraventricular Flow Dynamics by the HyperDoppler Technique: First Application to Normal Subjects, Athletes, and Patients with Heart Failure. J. Clin. Med. 2022, 11, 2216. [Google Scholar] [CrossRef] [PubMed]
- Kilner, P.J.; Yang, G.Z.; Wilkes, A.J.; Mohiaddin, R.H.; Firmin, D.N.; Yacoub, M.H. Asymmetric redirection of flow through the heart. Nature 2000, 404, 759–761. [Google Scholar] [CrossRef] [PubMed]
- Rodríguez Muñoz, D.; Moya Mur, J.L.; Fernández-Golfín, C.; Becker Filho, D.C.; González Gómez, A.; Fernández Santos, S.; Lázaro Rivera, C.; Rincón Díaz, L.M.; Casas Rojo, E.; Zamorano Gómez, J.L. Left ventricular vortices as observed by vector flow mapping: Main determinants and their relation to left ventricular filling. Echocardiography 2015, 32, 96–105. [Google Scholar] [CrossRef]
- Poh, K.K.; Lee, L.C.; Shen, L.; Chong, E.; Tan, Y.L.; Chai, P.; Yeo, T.C.; Wood, M.J. Left ventricular fluid dynamics in heart failure: Echocardiographic measurement and utilities of vortex formation time. Eur. Heart J. Cardiovasc. Imaging 2012, 13, 385–393. [Google Scholar] [CrossRef]
- Gharib, M.; Rambod, E.; Kheradvar, A.; Sahn, D.J.; Dabiri, J.O. Optimal vortex formation as an index of cardiac health. Proc. Natl. Acad. Sci. USA 2006, 103, 6305–6308. [Google Scholar] [CrossRef]
- Pugliese, N.R.; Colli, A.; Falcetta, G.; Del Punta, L.; Puccinelli, C.; Fiocco, A.; Petronio, A.S.; Taddei, S.; Masi, S.; Besola, L. Flow dynamic assessment of native mitral valve, mitral valve repair and mitral valve replacement using vector flow mapping intracardiac flow dynamic in mitral valve regurgitation. Front. Cardiovasc. Med. 2023, 10, 1047244. [Google Scholar] [CrossRef]
- Kheradvar, A.; Rickers, C.; Morisawa, D.; Kim, M.; Hong, G.-R.; Pedrizzetti, G. Diagnostic and prognostic significance of cardiovascular vortex formation. J. Cardiol. 2019, 74, 403–411. [Google Scholar] [CrossRef]
- Pagel, P.S.; Hudetz, J.A. Chronic pressure-overload hypertrophy attenuates vortex formation time in patients with severe aortic stenosis and preserved left ventricular systolic function undergoing aortic valve replacement. J. Cardiothorac. Vasc. Anesth. 2013, 27, 660–664. [Google Scholar] [CrossRef] [PubMed]
- Pagel, P.S.; Boettcher, B.T.; De Vry, D.J.; Freed, J.K.; Iqbal, Z. Moderate Aortic Valvular Insufficiency Invalidates Vortex Formation Time as an Index of Left Ventricular Filling Efficiency in Patients with Severe Degenerative Calcific Aortic Stenosis Undergoing Aortic Valve Replacement. J. Cardiothorac. Vasc. Anesth. 2016, 30, 1260–1265. [Google Scholar] [CrossRef]
- Borrelli, N.; Avesani, M.; Sabatino, J.; Ibrahim, A.; Josen, M.; Paredes, J.; Di Salvo, G. Blood speckle imaging: A new echocardiographic approach to study fluid dynamics in congenital heart disease. Int. J. Cardiol. Congenit. Heart Dis. 2021, 2, 100079. [Google Scholar] [CrossRef]
- Goliasch, G.; Goscinska-Bis, K.; Caracciolo, G.; Nakabo, A.; Smolka, G.; Pedrizzetti, G.; Narula, J.; Sengupta, P.P. CRT improves LV filling dynamics: Insights from echocardiographic particle imaging velocimetry. JACC Cardiovasc. Imaging 2013, 6, 704–713. [Google Scholar] [CrossRef]
- Mangual, J.O.; Kraigher-Krainer, E.; De Luca, A.; Toncelli, L.; Shah, A.; Solomon, S.; Galanti, G.; Domenichini, F. Comparative numerical study on left ventricular fluid dynamics after dilated cardiomyopathy. J. Biomech. 2013, 46, 1611–1617. [Google Scholar] [CrossRef]
- Ouyang, D.; He, B.; Ghorbani, A.; Yuan, N.; Ebinger, J.; Langlotz, C.P.; Heidenreich, P.A.; Harrington, R.A.; Liang, D.H.; Ashley, E.A.; et al. Video-based AI for beat-to-beat assessment of cardiac function. Nature 2020, 580, 252–256. [Google Scholar] [CrossRef]
- Marchese, P.; Cantinotti, M.; Van den Eynde, J.; Assanta, N.; Franchi, E.; Pak, V.; Santoro, G.; Koestenberger, M.; Kutty, S. Left ventricular vortex analysis by high-frame rate blood speckle tracking echocardiography in healthy children and in congenital heart disease. Int. J. Cardiol. Heart Vasc. 2021, 37, 100897. [Google Scholar] [CrossRef]


| Imaging Technique | Description | Key Benefits |
|---|---|---|
| 2D Echocardiography | Sound waves to create 2D images of the heart | Widely available, provides basic structural information. |
| 3D Echocardiography | Provides three-dimensional images of cardiac structures | Enhanced visualization and accurate volumetric measurements. |
| Myocardial Strain Imaging | Measures myocardial deformation during the cardiac cycle | Sensitive to subtle myocardial changes, useful for the early detection of dysfunction. |
| Vortex Analysis | Analyzes swirling patterns of blood flow in the heart | Offers insights into cardiac flow dynamics and function. |
| Application | Description | Clinical Impact |
|---|---|---|
| Cardiac Function Assessment | Evaluates myocardial deformation to identify dysfunction | Enhances the early detection of cardiac impairment |
| Risk Stratification | Uses strain metrics to predict adverse outcomes | Improves risk assessment and management strategies |
| Treatment Monitoring | Assesses changes in strain to evaluate therapy effectiveness | Provides insights into treatment responses |
| Clinical Scenario | 3D Echocardiography | Myocardial Strain Imaging | Vortex Imaging |
|---|---|---|---|
| Left Ventricular Function | Accurate evaluation of LV function, avoiding geometric assumptions. Reproducible measurements of volumes and ejection fraction. Visualization of rendered 3DE images for comprehensive cardiac structure analysis. | Detects early subclinical myocardial dysfunction, especially in conditions like chemotherapy-induced cardiotoxicity. Offers a sensitive measure of myocardial function, correlating well with outcomes in heart failure. | Visualizes and measures the intracardiac vortices crucial for efficient blood ejection and filling. Diastolic vortices assess left atrial function and ventricular filling pressures, valuable in HFpEF. |
| LV Dyssynchrony | Tracks segmental LV volumes throughout the cardiac cycle. The SDI predicts response to CRT. Optimal pacing lead placement guided by 3DE improves CRT outcomes. | Assesses desynchrony in CRT patients. Guides optimal pacing lead placement to improve outcomes. | Assesses changes in intracavitary flow patterns before and after CRT implantation. Visualizes improvement in flow efficiency post-CRT. |
| Valve Assessment | Detailed visualization of heart valves. Measures valve orifice size, leaflet prolapse, and severity of regurgitation or stenosis. | Detects early myocardial dysfunction in valvular diseases like aortic stenosis and mitral regurgitation. Helps determine timing for surgical intervention. | Depicts altered flow patterns in valve diseases like mitral regurgitation and aortic stenosis. Visualizes hemodynamic burden on the LV. |
| Atrial Function | Detailed evaluation of atrial size, shape, and function. Valuable in atrial fibrillation and atrial septal defects. | Provides global insight into cardiac function, which can include atrial contribution. | Not directly used in assessing atrial function but could offer insights into atrioventricular coupling dynamics. |
| Cardiomyopathies | Assists in the detailed assessment of LV structure and function in hypertrophic and dilated cardiomyopathy. Important for risk stratification and management. | Identifies abnormal myocardial mechanics in HCM. Assesses global and regional myocardial function in DCM, aiding in disease monitoring. Apical sparing as red flag in cardiac amyloidosis. | Evaluates the impact of dilated chambers on flow in DCM. |
| Congenital Heart Diseases | Provides comprehensive views essential for surgical planning. Monitors structural changes post-repair. | Monitors myocardial function in repaired congenital heart defects. Detects early signs of dysfunction post-surgery. | Visualizes complex flow abnormalities in congenital heart disease. Monitors restoration of normal flow patterns post-surgery. |
Disclaimer/Publisher’s Note: The statements, opinions and data contained in all publications are solely those of the individual author(s) and contributor(s) and not of MDPI and/or the editor(s). MDPI and/or the editor(s) disclaim responsibility for any injury to people or property resulting from any ideas, methods, instructions or products referred to in the content. |
© 2024 by the authors. Licensee MDPI, Basel, Switzerland. This article is an open access article distributed under the terms and conditions of the Creative Commons Attribution (CC BY) license (https://creativecommons.org/licenses/by/4.0/).
Share and Cite
Galzerano, D.; Savo, M.T.; Castaldi, B.; Kholaif, N.; Khaliel, F.; Pozza, A.; Aljheish, S.; Cattapan, I.; Martini, M.; Lassandro, E.; et al. Transforming Heart Failure Management: The Power of Strain Imaging, 3D Imaging, and Vortex Analysis in Echocardiography. J. Clin. Med. 2024, 13, 5759. https://doi.org/10.3390/jcm13195759
Galzerano D, Savo MT, Castaldi B, Kholaif N, Khaliel F, Pozza A, Aljheish S, Cattapan I, Martini M, Lassandro E, et al. Transforming Heart Failure Management: The Power of Strain Imaging, 3D Imaging, and Vortex Analysis in Echocardiography. Journal of Clinical Medicine. 2024; 13(19):5759. https://doi.org/10.3390/jcm13195759
Chicago/Turabian StyleGalzerano, Domenico, Maria Teresa Savo, Biagio Castaldi, Naji Kholaif, Feras Khaliel, Alice Pozza, Saif Aljheish, Irene Cattapan, Marika Martini, Eleonora Lassandro, and et al. 2024. "Transforming Heart Failure Management: The Power of Strain Imaging, 3D Imaging, and Vortex Analysis in Echocardiography" Journal of Clinical Medicine 13, no. 19: 5759. https://doi.org/10.3390/jcm13195759