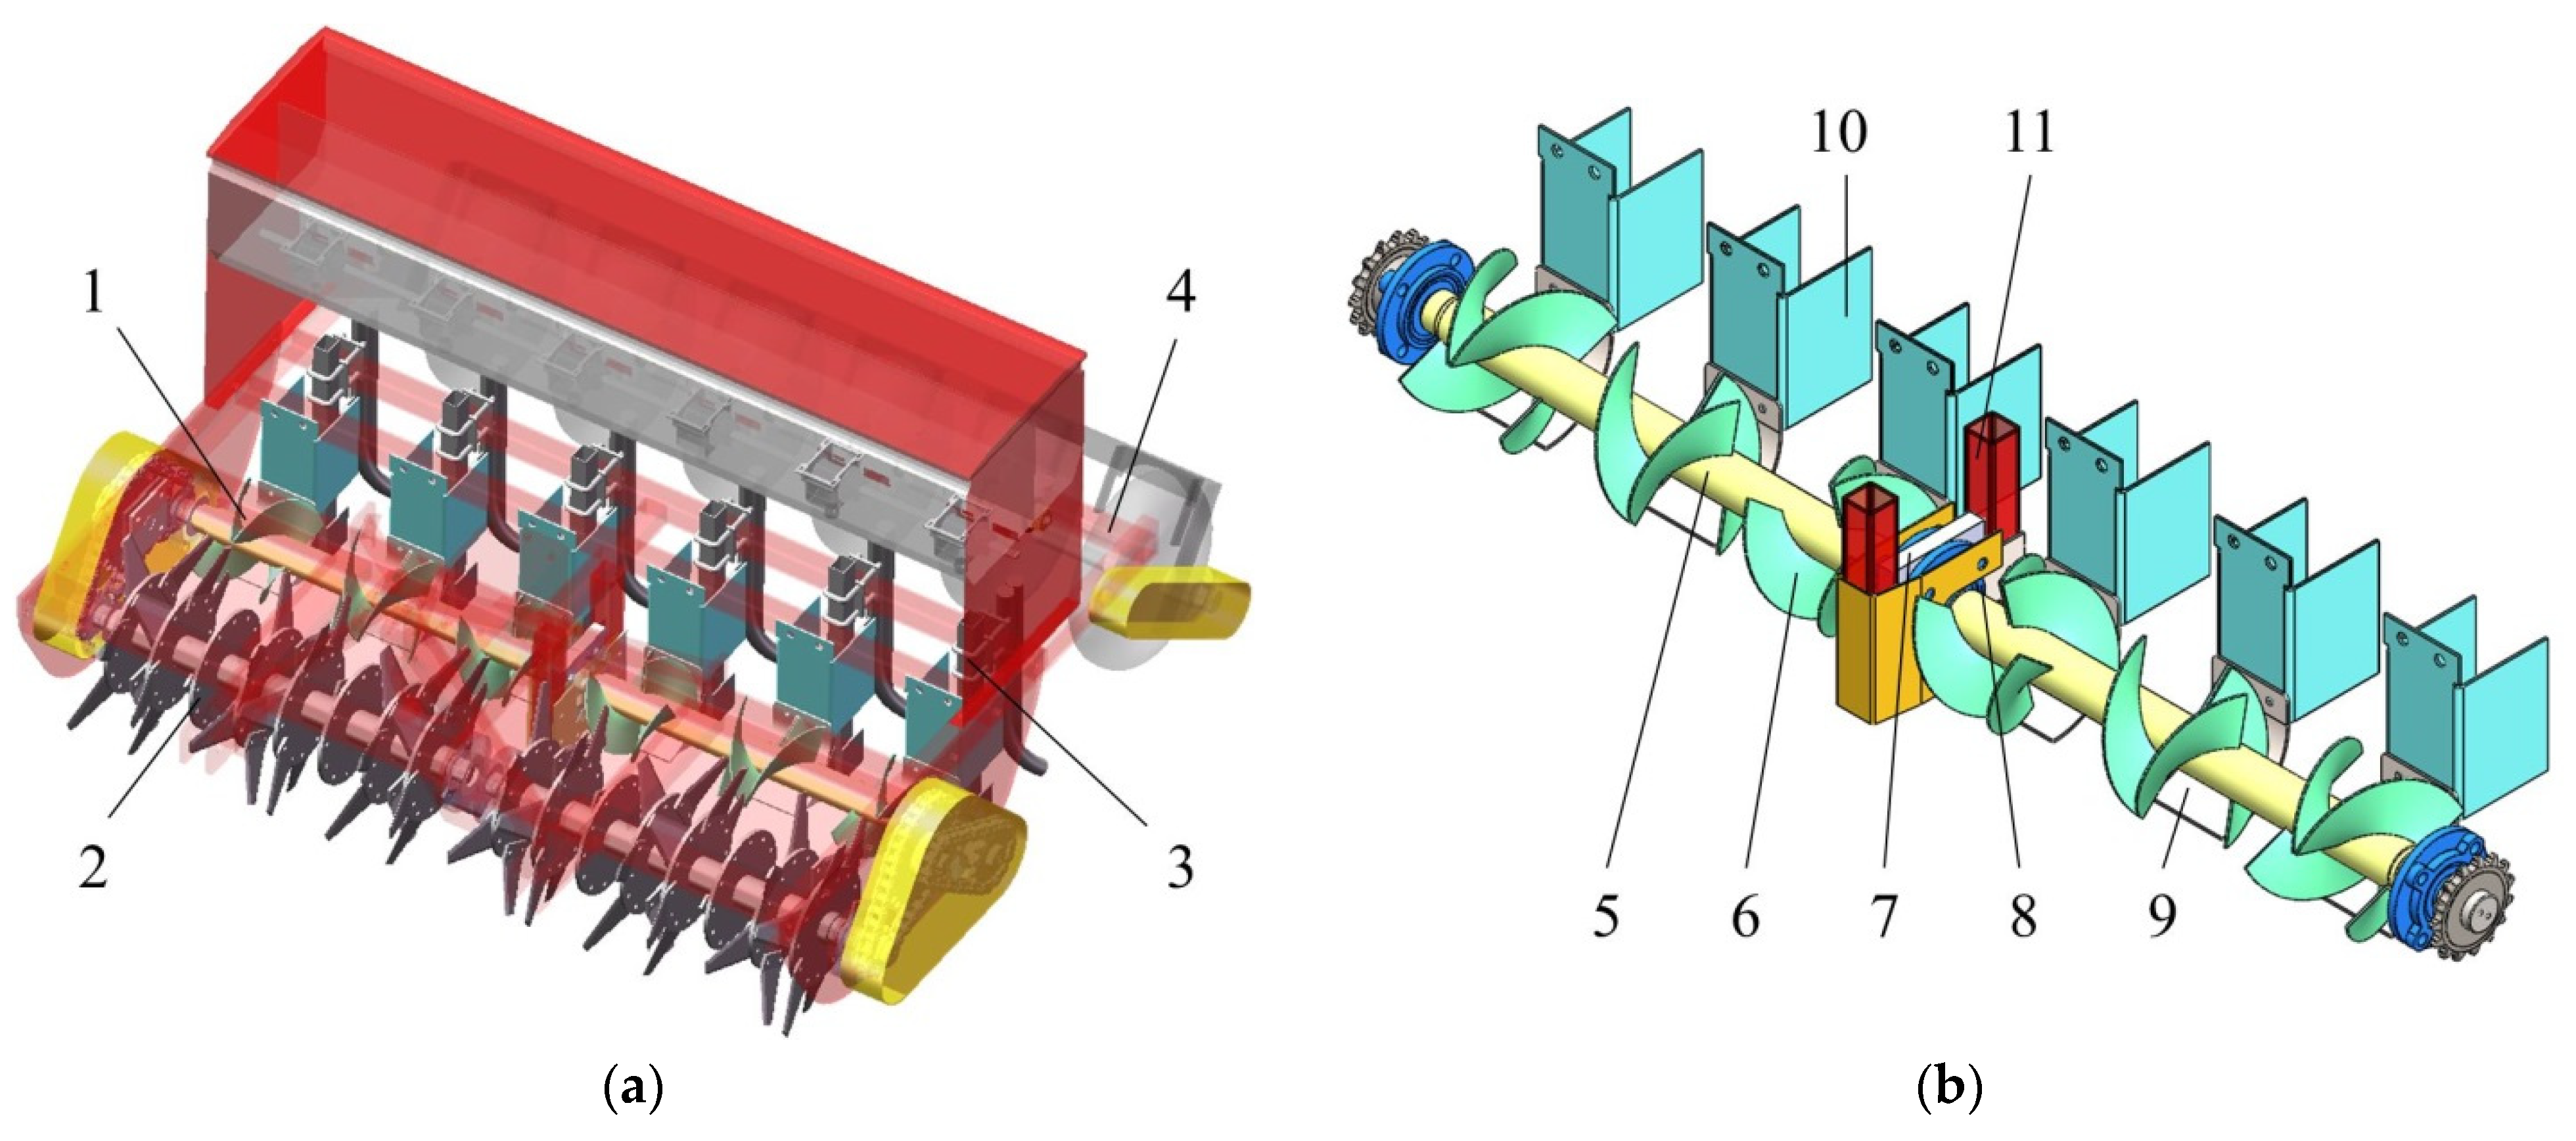
Figure 1.
SSRSD with its specific position. (a) Installation position of SSRSD of wheat no-till planter; (b) the structure of SSRSD. Note: 1, SSM; 2, no-till anti-blocking knife; 3, furrowing opener; 4, frame; 5, spiral shaft; 6, RB; 7, spiral shaft positioning plate; 8, rolling bearing; 9, straw hopper; 10, straw baffle; 11, support-connecting frame.
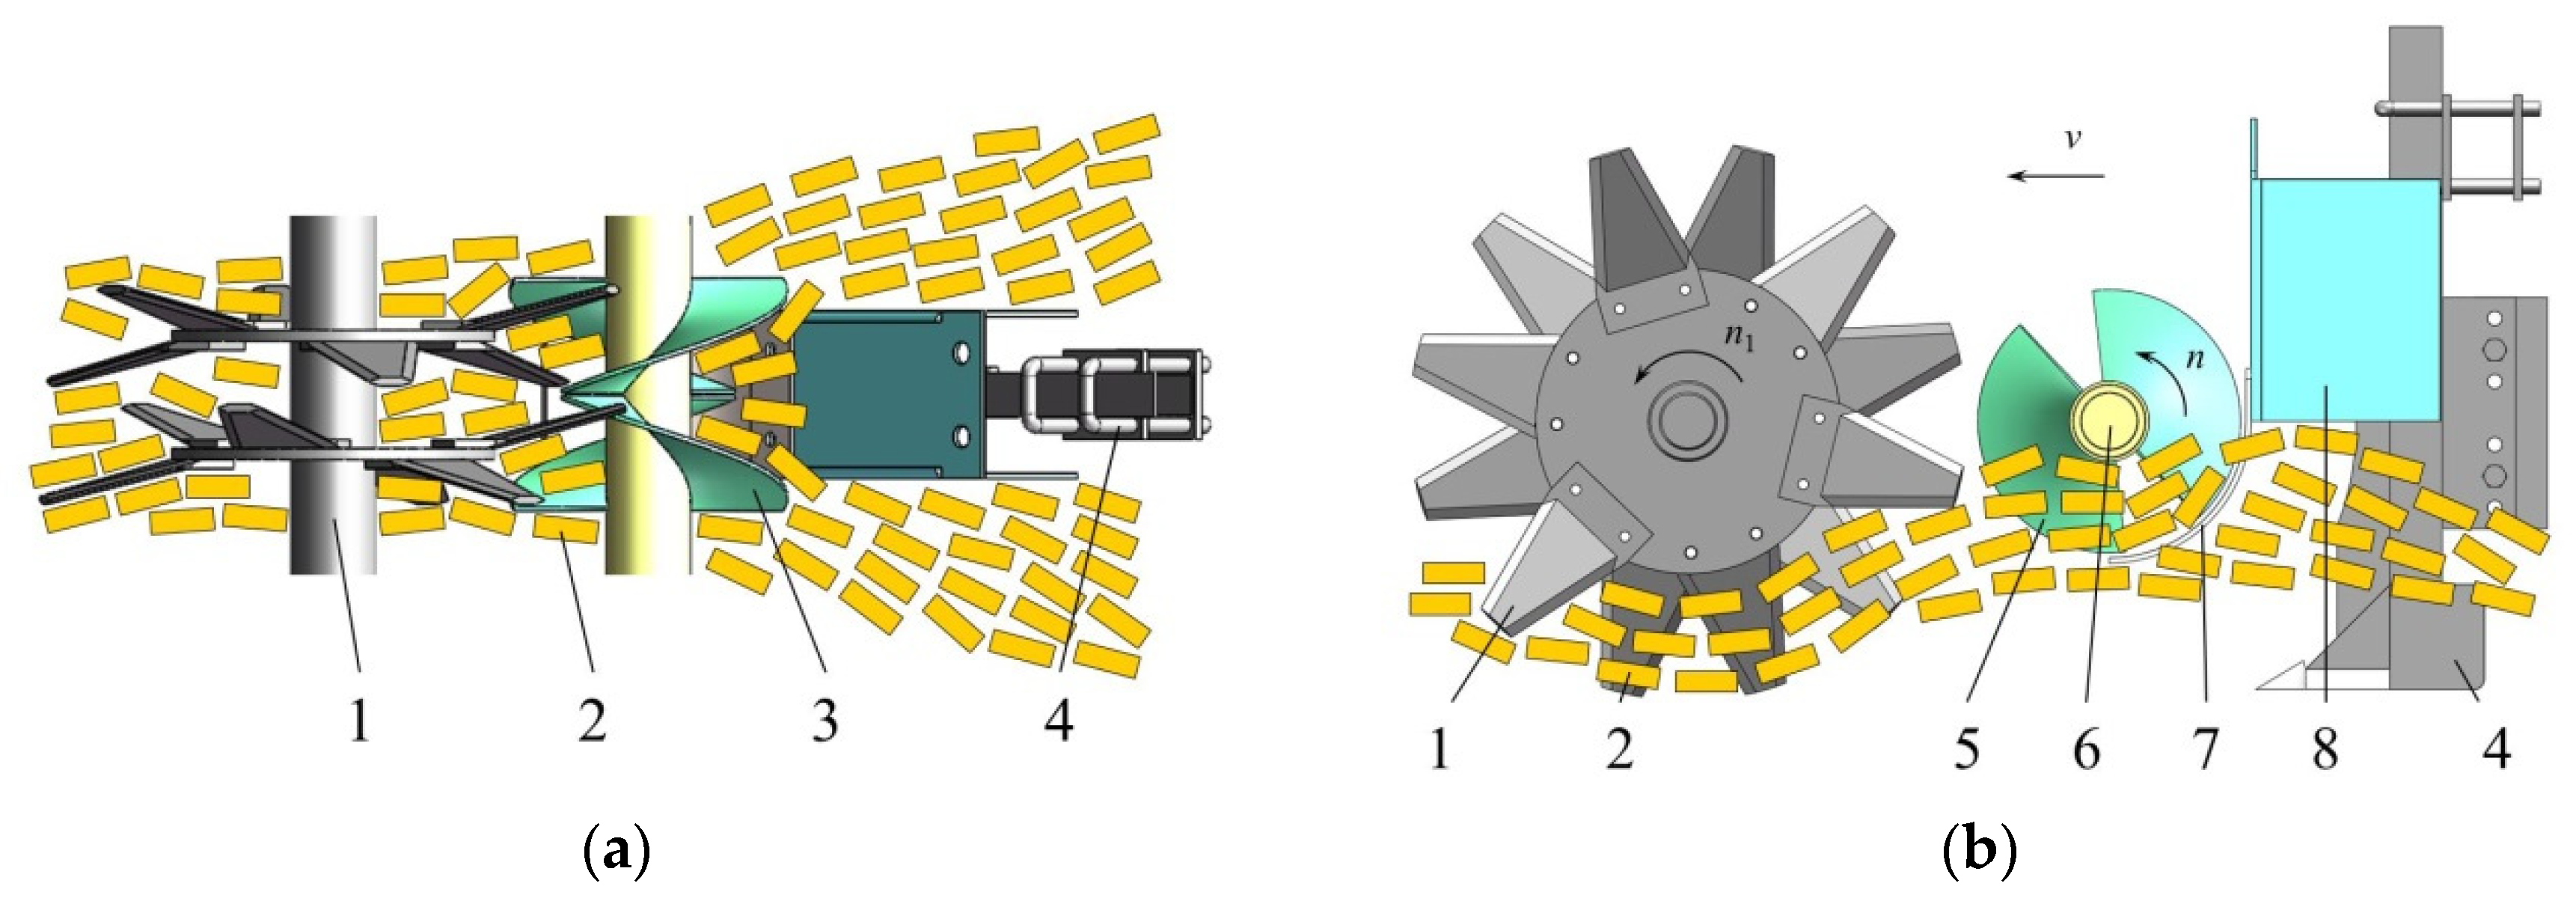
Figure 2.
Working principle of SSRSD. (a) Vertical view; (b) side view. Note: 1, no-till anti-blocking knife; 2, straw; 3, SSM; 4, furrowing opener 5, RB; 6, spiral shaft; 7, straw hopper; 8, straw baffle. v is the operating velocity of machines, km/h; n1 is the rotary velocity of no-till anti-blocking knife, rpm; n is the rotary velocity of the spiral shaft (RVSS), rpm.
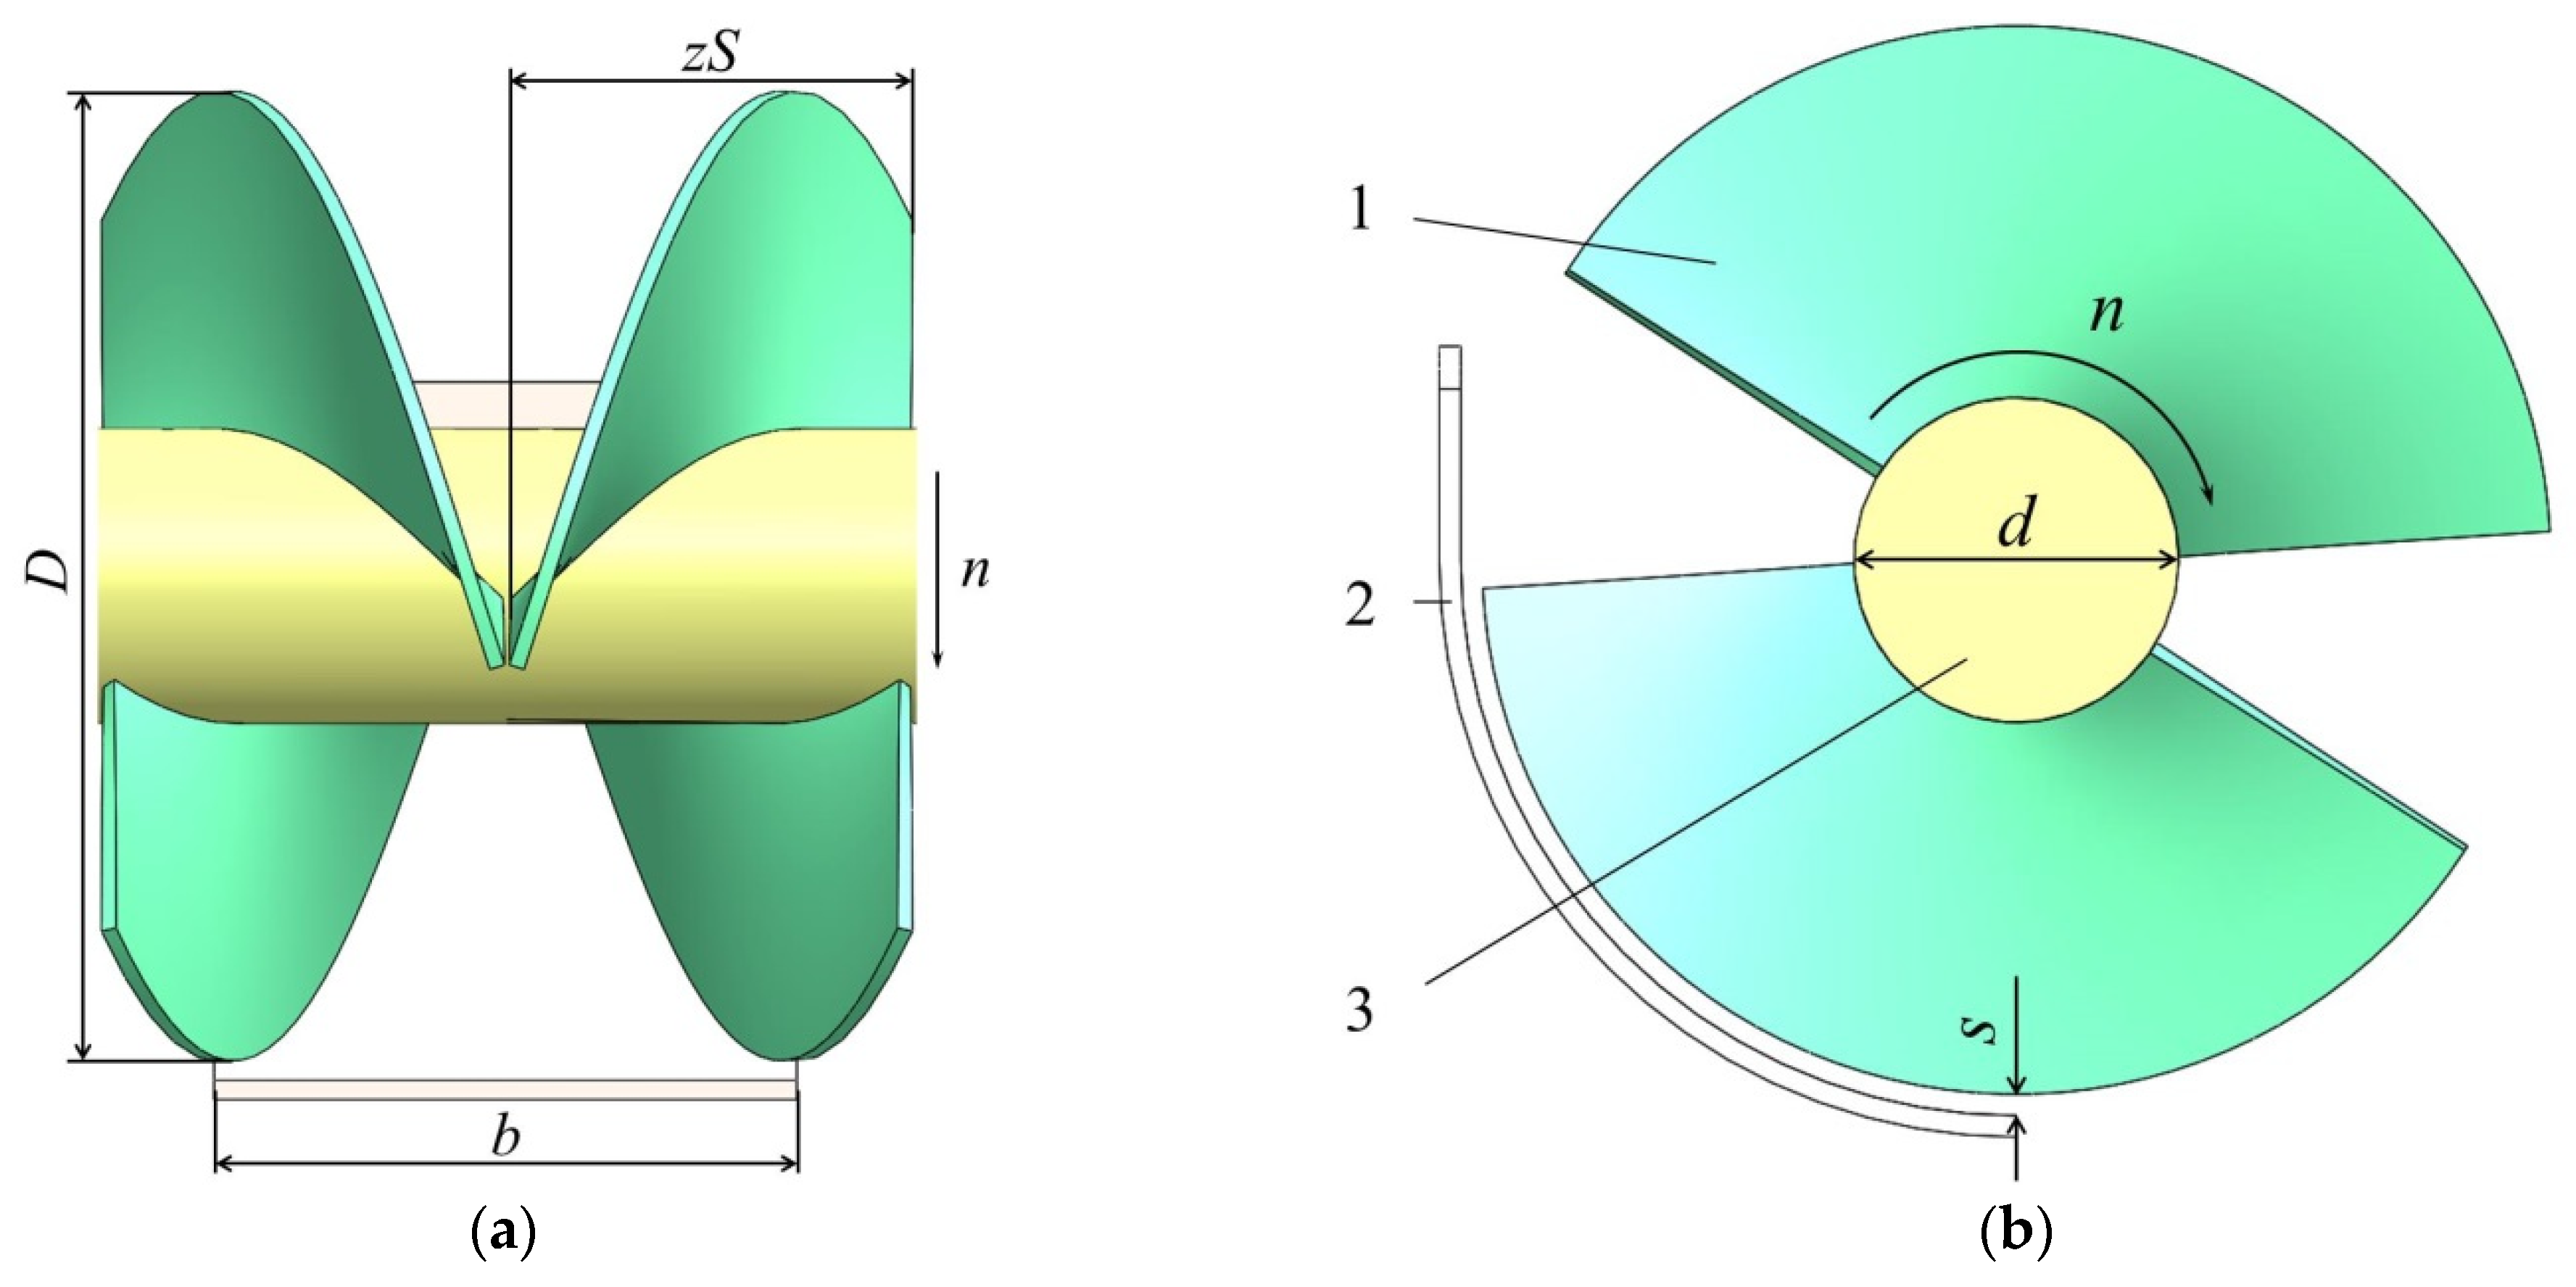
Figure 3.
The critical parameters of SSM. (a) Main view; (b) side view. Note: 1, SRB; 2, straw hopper; 3, spiral shaft; D is the the outer diameter of the row-sorting blade (ODRB), mm; n is the RVSS. rpm; b is the width of the straw hopper, mm; d is the diameter of the spiral shaft (DSS), m; S is the pitch of the spiral blade, m; z is the number of turns of the RB, z ≥ k; s is the gap between the RB and the straw hopper, m.
Figure 4.
Field straw before operation.
Figure 4.
Field straw before operation.
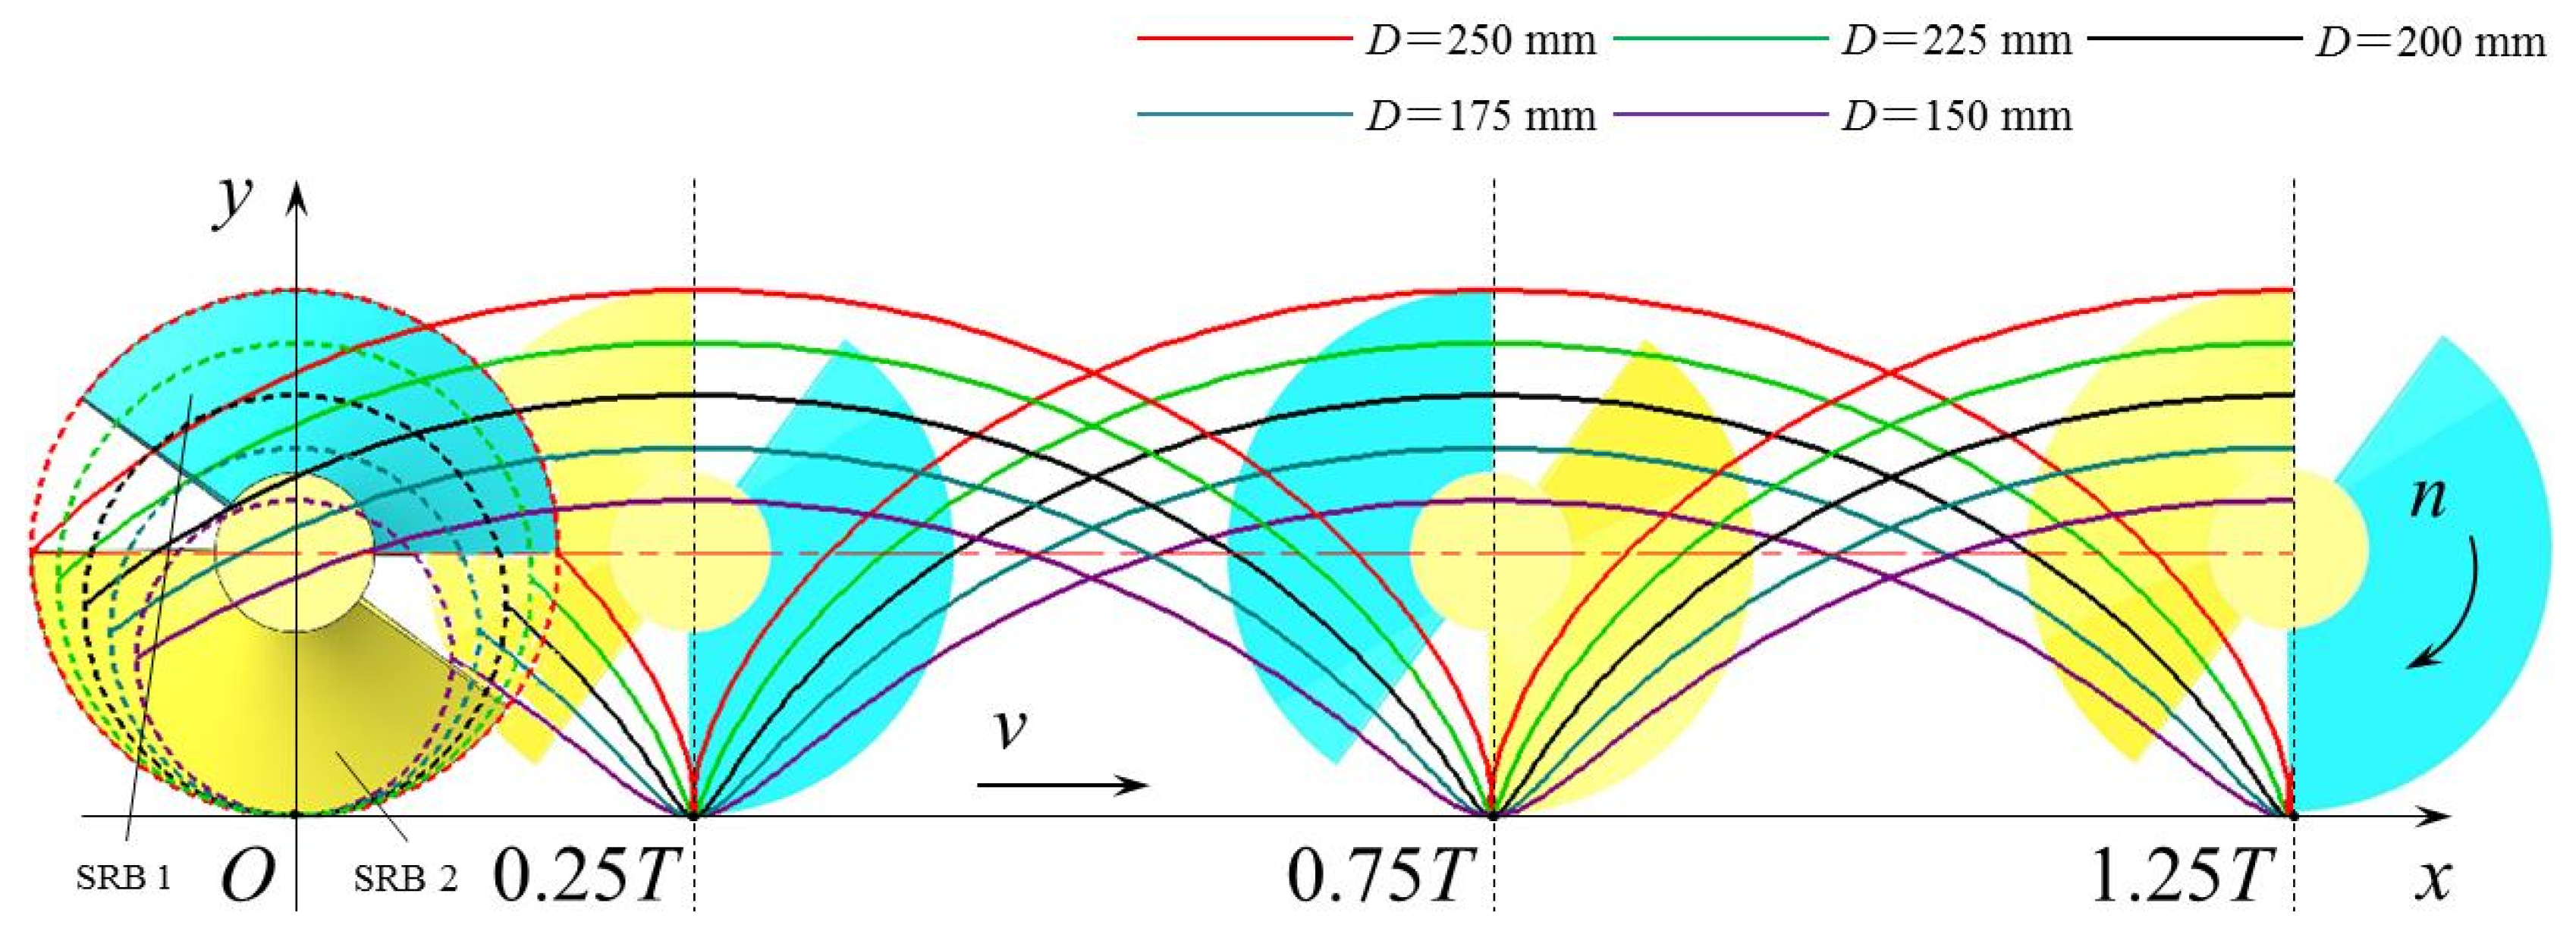
Figure 5.
The motion trajectory of the tip of the SRB at different D values. Note: D is the ODRD, mm; n is the RVSS, rpm; v is the operating velocity of machines, km/h. In order to describe the motion law of the SSM more clearly, the two sets of SRB in green are expressed as the blue SRB 1 and the yellow SRB 2.
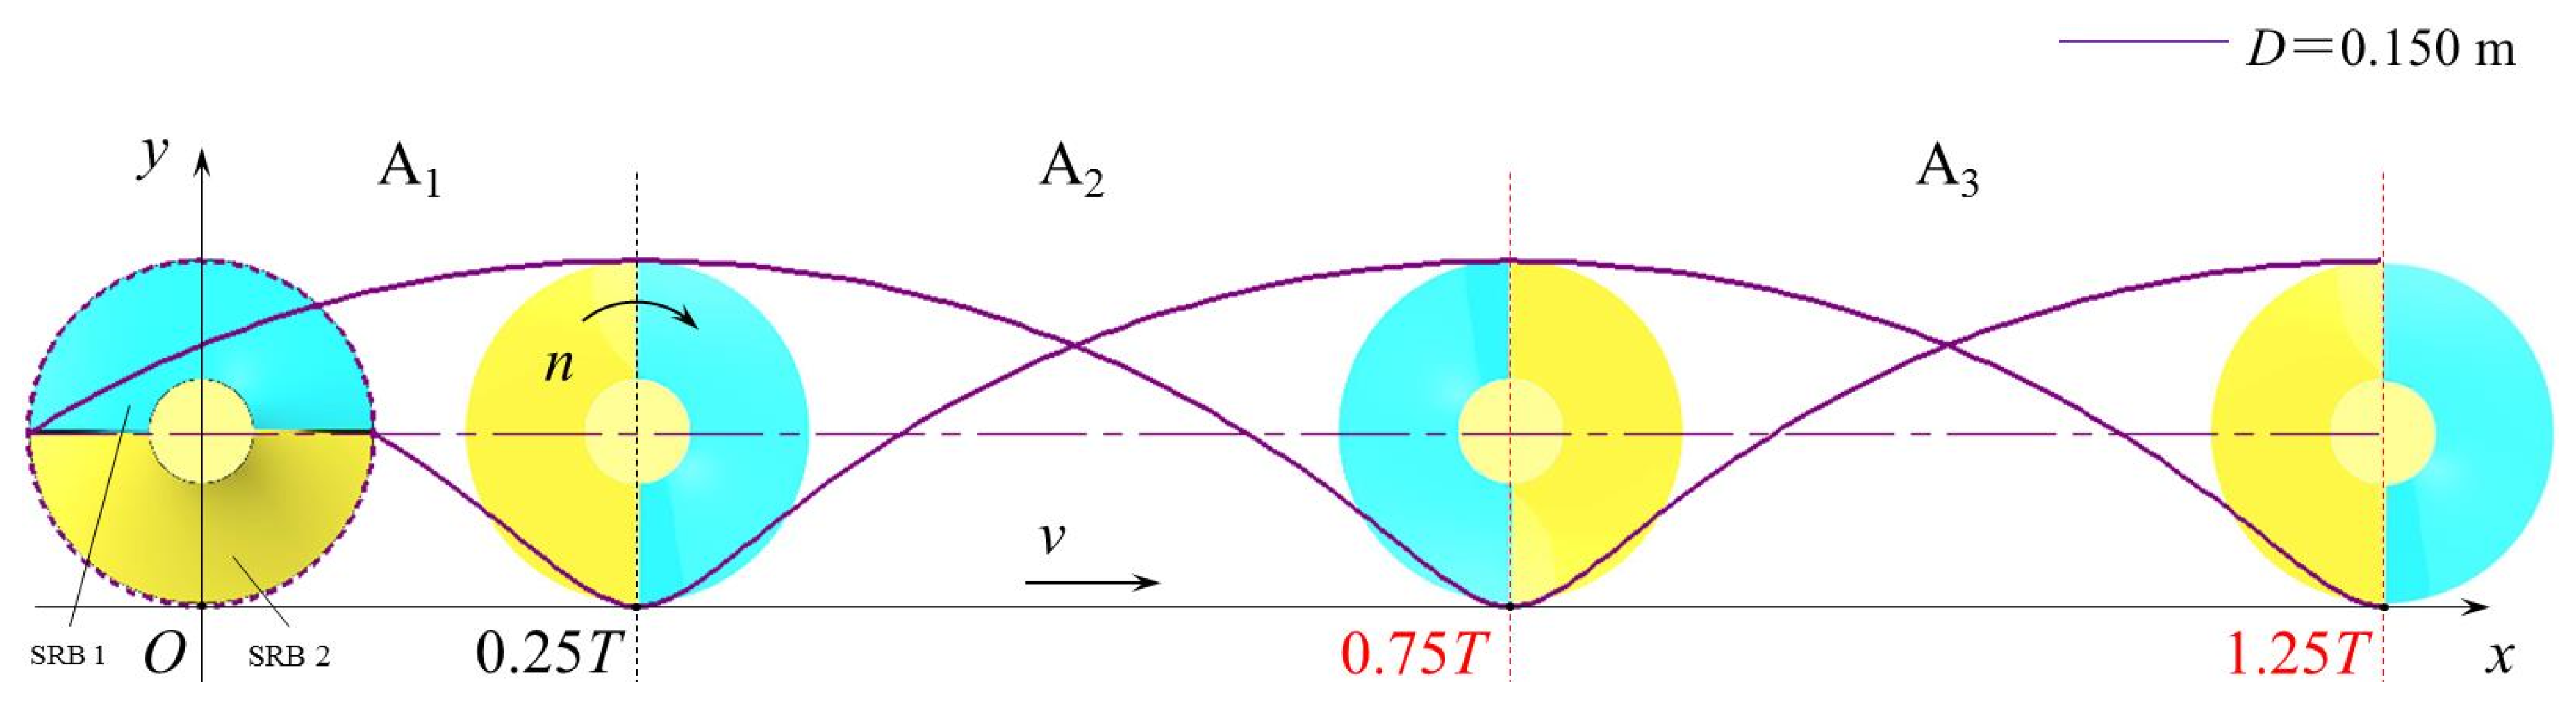
Figure 6.
The trajectory of the tip of the SRB when D = 150 mm. Note: D is the ODRD, mm; n is the RVSS, rpm; v is the operating velocity of machines, km/h. In order to describe the motion law of the SSM more clearly, the two sets of SRB in green are expressed as the blue SRB 1 and the yellow SRB 2.
Figure 6.
The trajectory of the tip of the SRB when D = 150 mm. Note: D is the ODRD, mm; n is the RVSS, rpm; v is the operating velocity of machines, km/h. In order to describe the motion law of the SSM more clearly, the two sets of SRB in green are expressed as the blue SRB 1 and the yellow SRB 2.
Figure 7.
The trajectory of the tip of the SRB when D = 250 mm. Note: D is the ODRD, mm; n is the RVSS, rpm; v is the operating velocity of machines, km/h. In order to describe the motion law of the SSM more clearly, the two sets of SRB in green are expressed as the blue SRB 1 and the yellow SRB 2.
Figure 7.
The trajectory of the tip of the SRB when D = 250 mm. Note: D is the ODRD, mm; n is the RVSS, rpm; v is the operating velocity of machines, km/h. In order to describe the motion law of the SSM more clearly, the two sets of SRB in green are expressed as the blue SRB 1 and the yellow SRB 2.
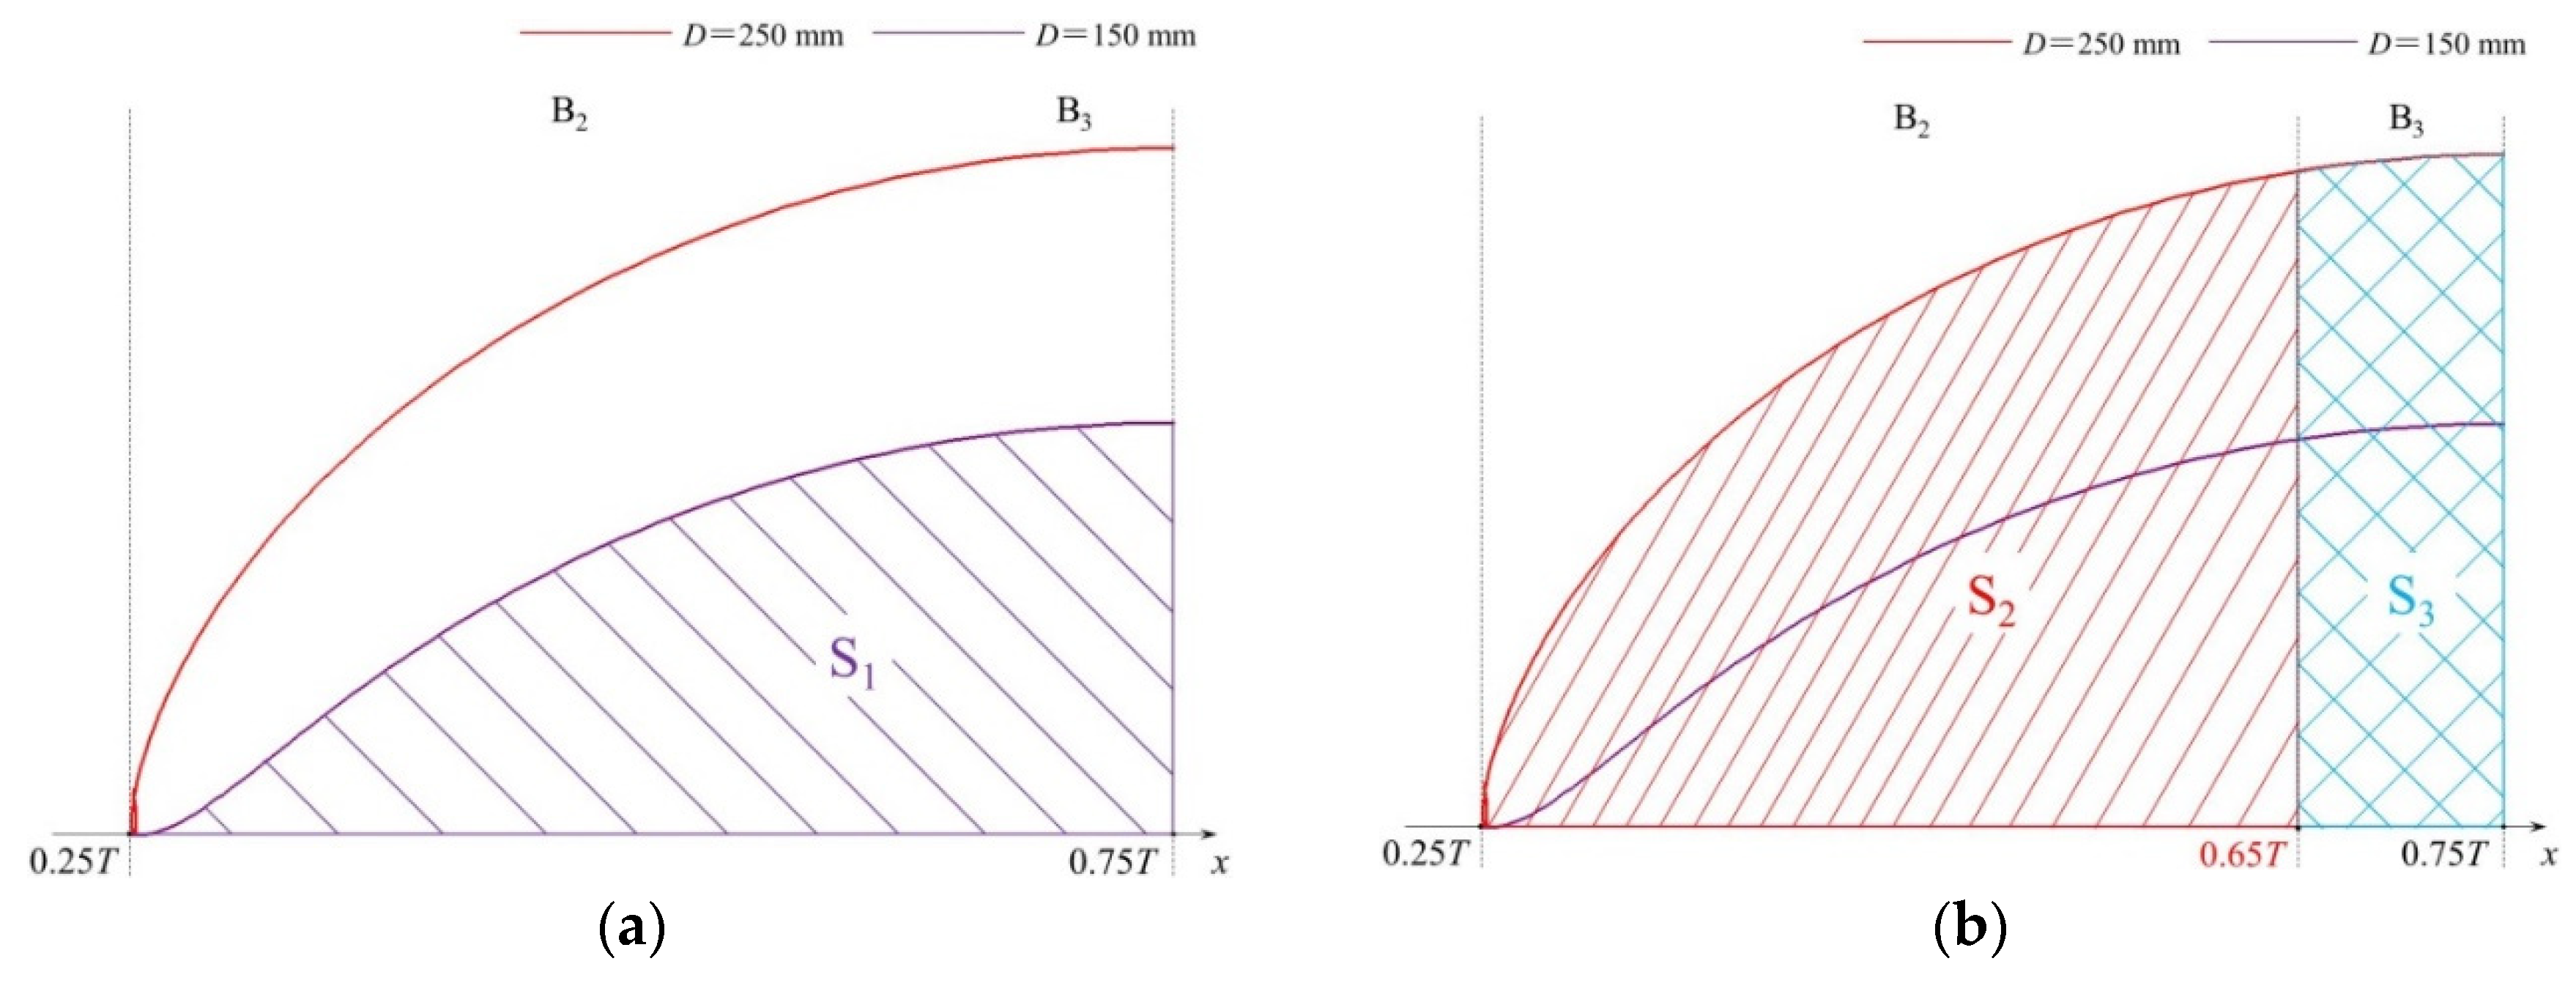
Figure 8.
Part of the operating area of the SRB. (a) The operating of the SRB when D = 150 mm; (b) the operating of the SRB when D = 250 mm. Note: The purple area S1 is the operating area of the SRB when D = 150 mm; the red area S2 is the operating area of the SRB when D = 250 mm; the blue area S3 is the buffer/idling area of the SRB when D = 250 mm.
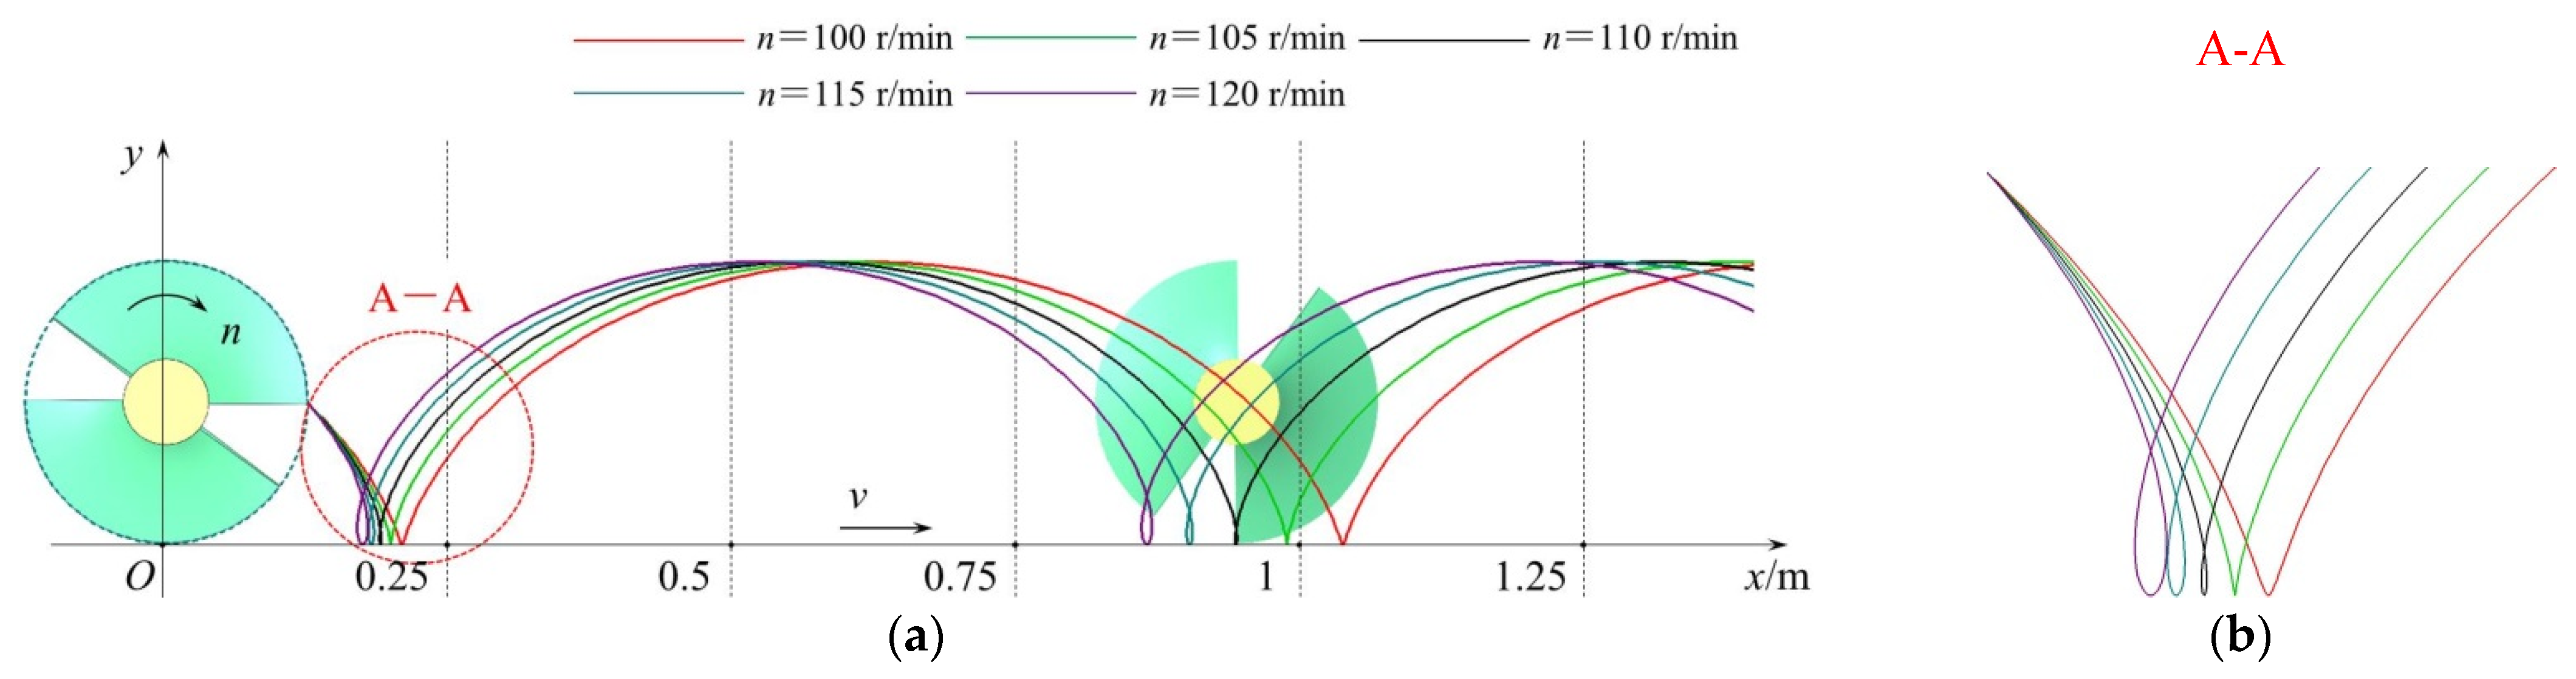
Figure 9.
The motion trajectory of the tip of the RB with different values of n. (a) The overall trend of the moving trajectory of the RB during the operation; (b) partially enlarged schematic of area A-A. Note: n is the RVSS, rpm; v is the operating velocity of machines, km/h.
Figure 9.
The motion trajectory of the tip of the RB with different values of n. (a) The overall trend of the moving trajectory of the RB during the operation; (b) partially enlarged schematic of area A-A. Note: n is the RVSS, rpm; v is the operating velocity of machines, km/h.
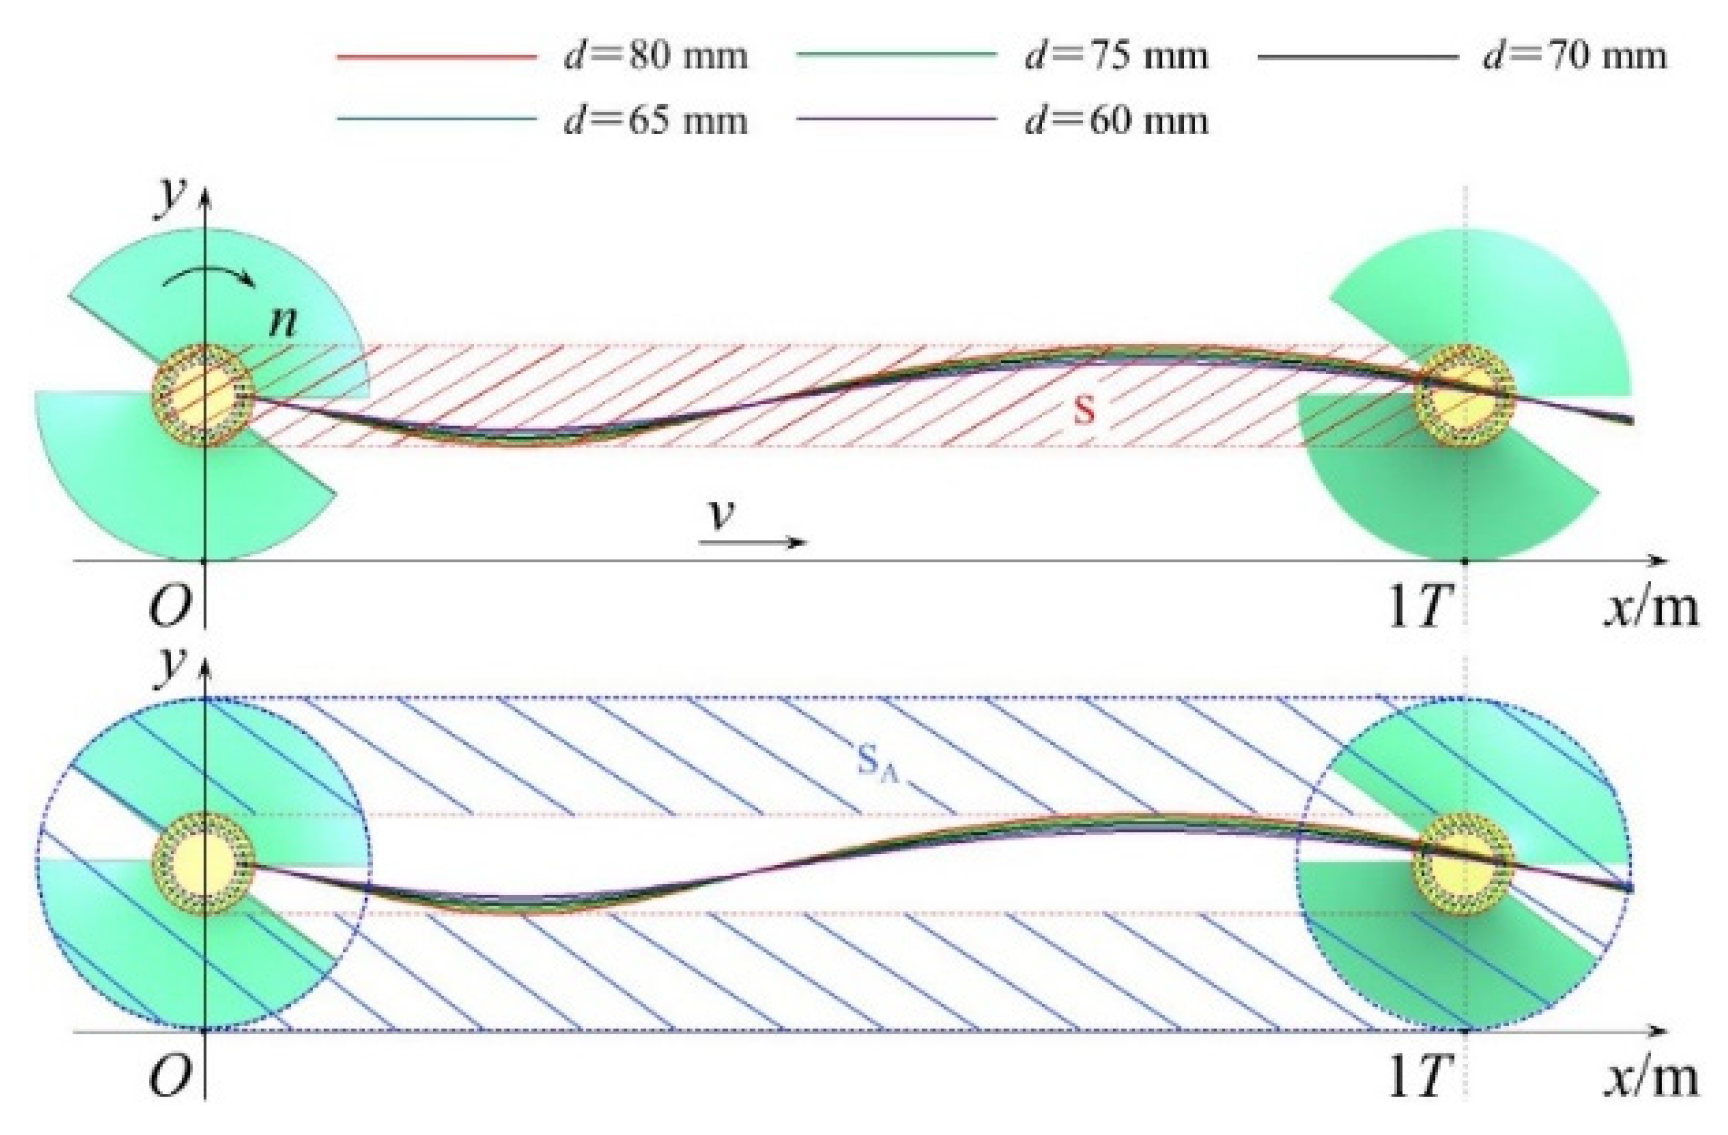
Figure 10.
The motion trajectory of the spiral shaft under different d values. Note: d is the DSS, mm. S is the ineffective operation area of the SSM, mm2; SA is the effective operation area of the SSM, mm2; n is the RVSS, rpm; v is the operating velocity of machines, km/h.
Figure 10.
The motion trajectory of the spiral shaft under different d values. Note: d is the DSS, mm. S is the ineffective operation area of the SSM, mm2; SA is the effective operation area of the SSM, mm2; n is the RVSS, rpm; v is the operating velocity of machines, km/h.
Figure 11.
Field verification test.
Figure 11.
Field verification test.
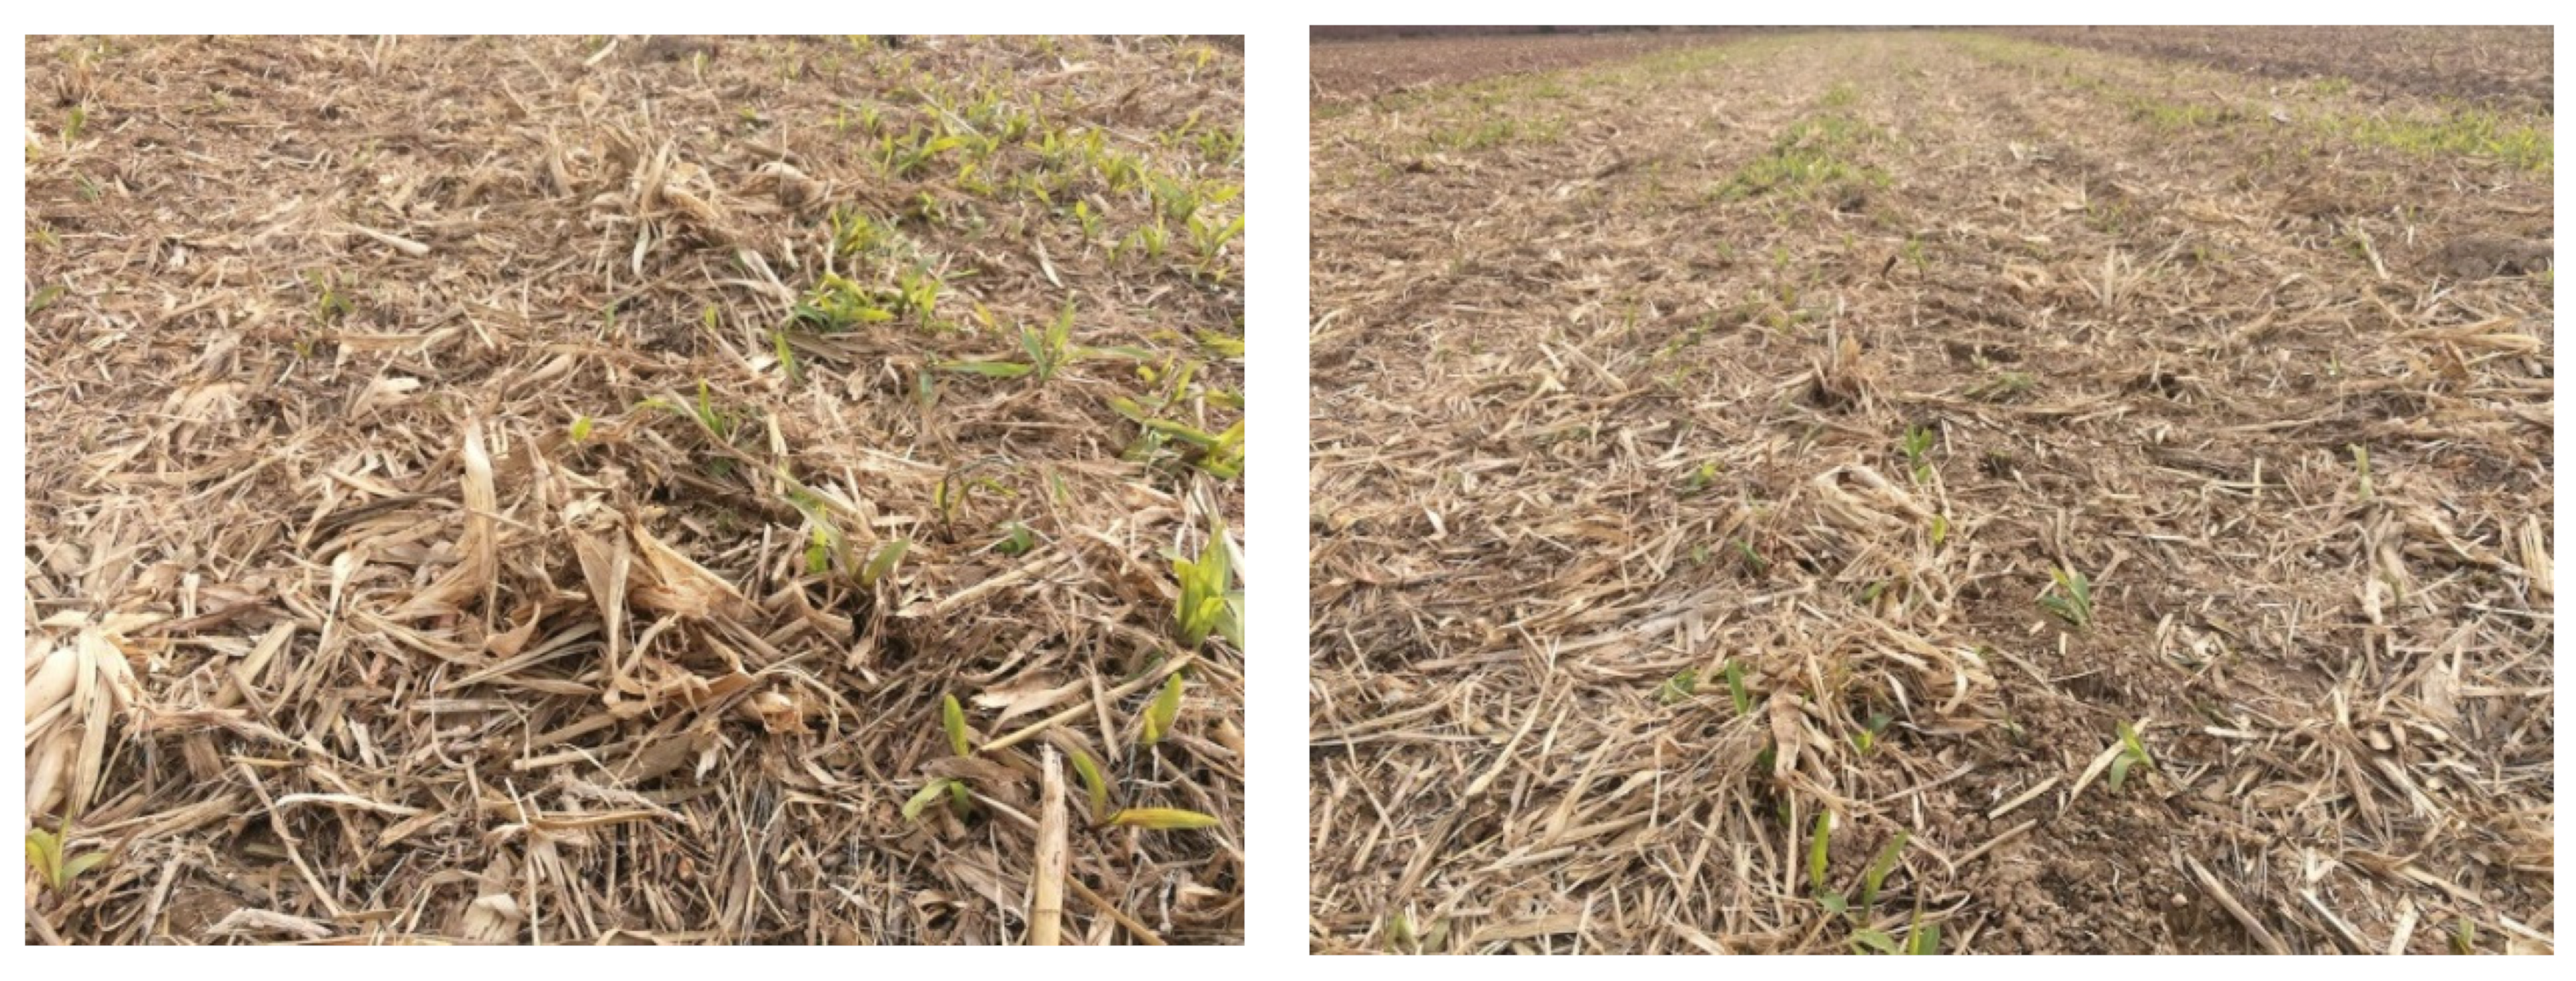
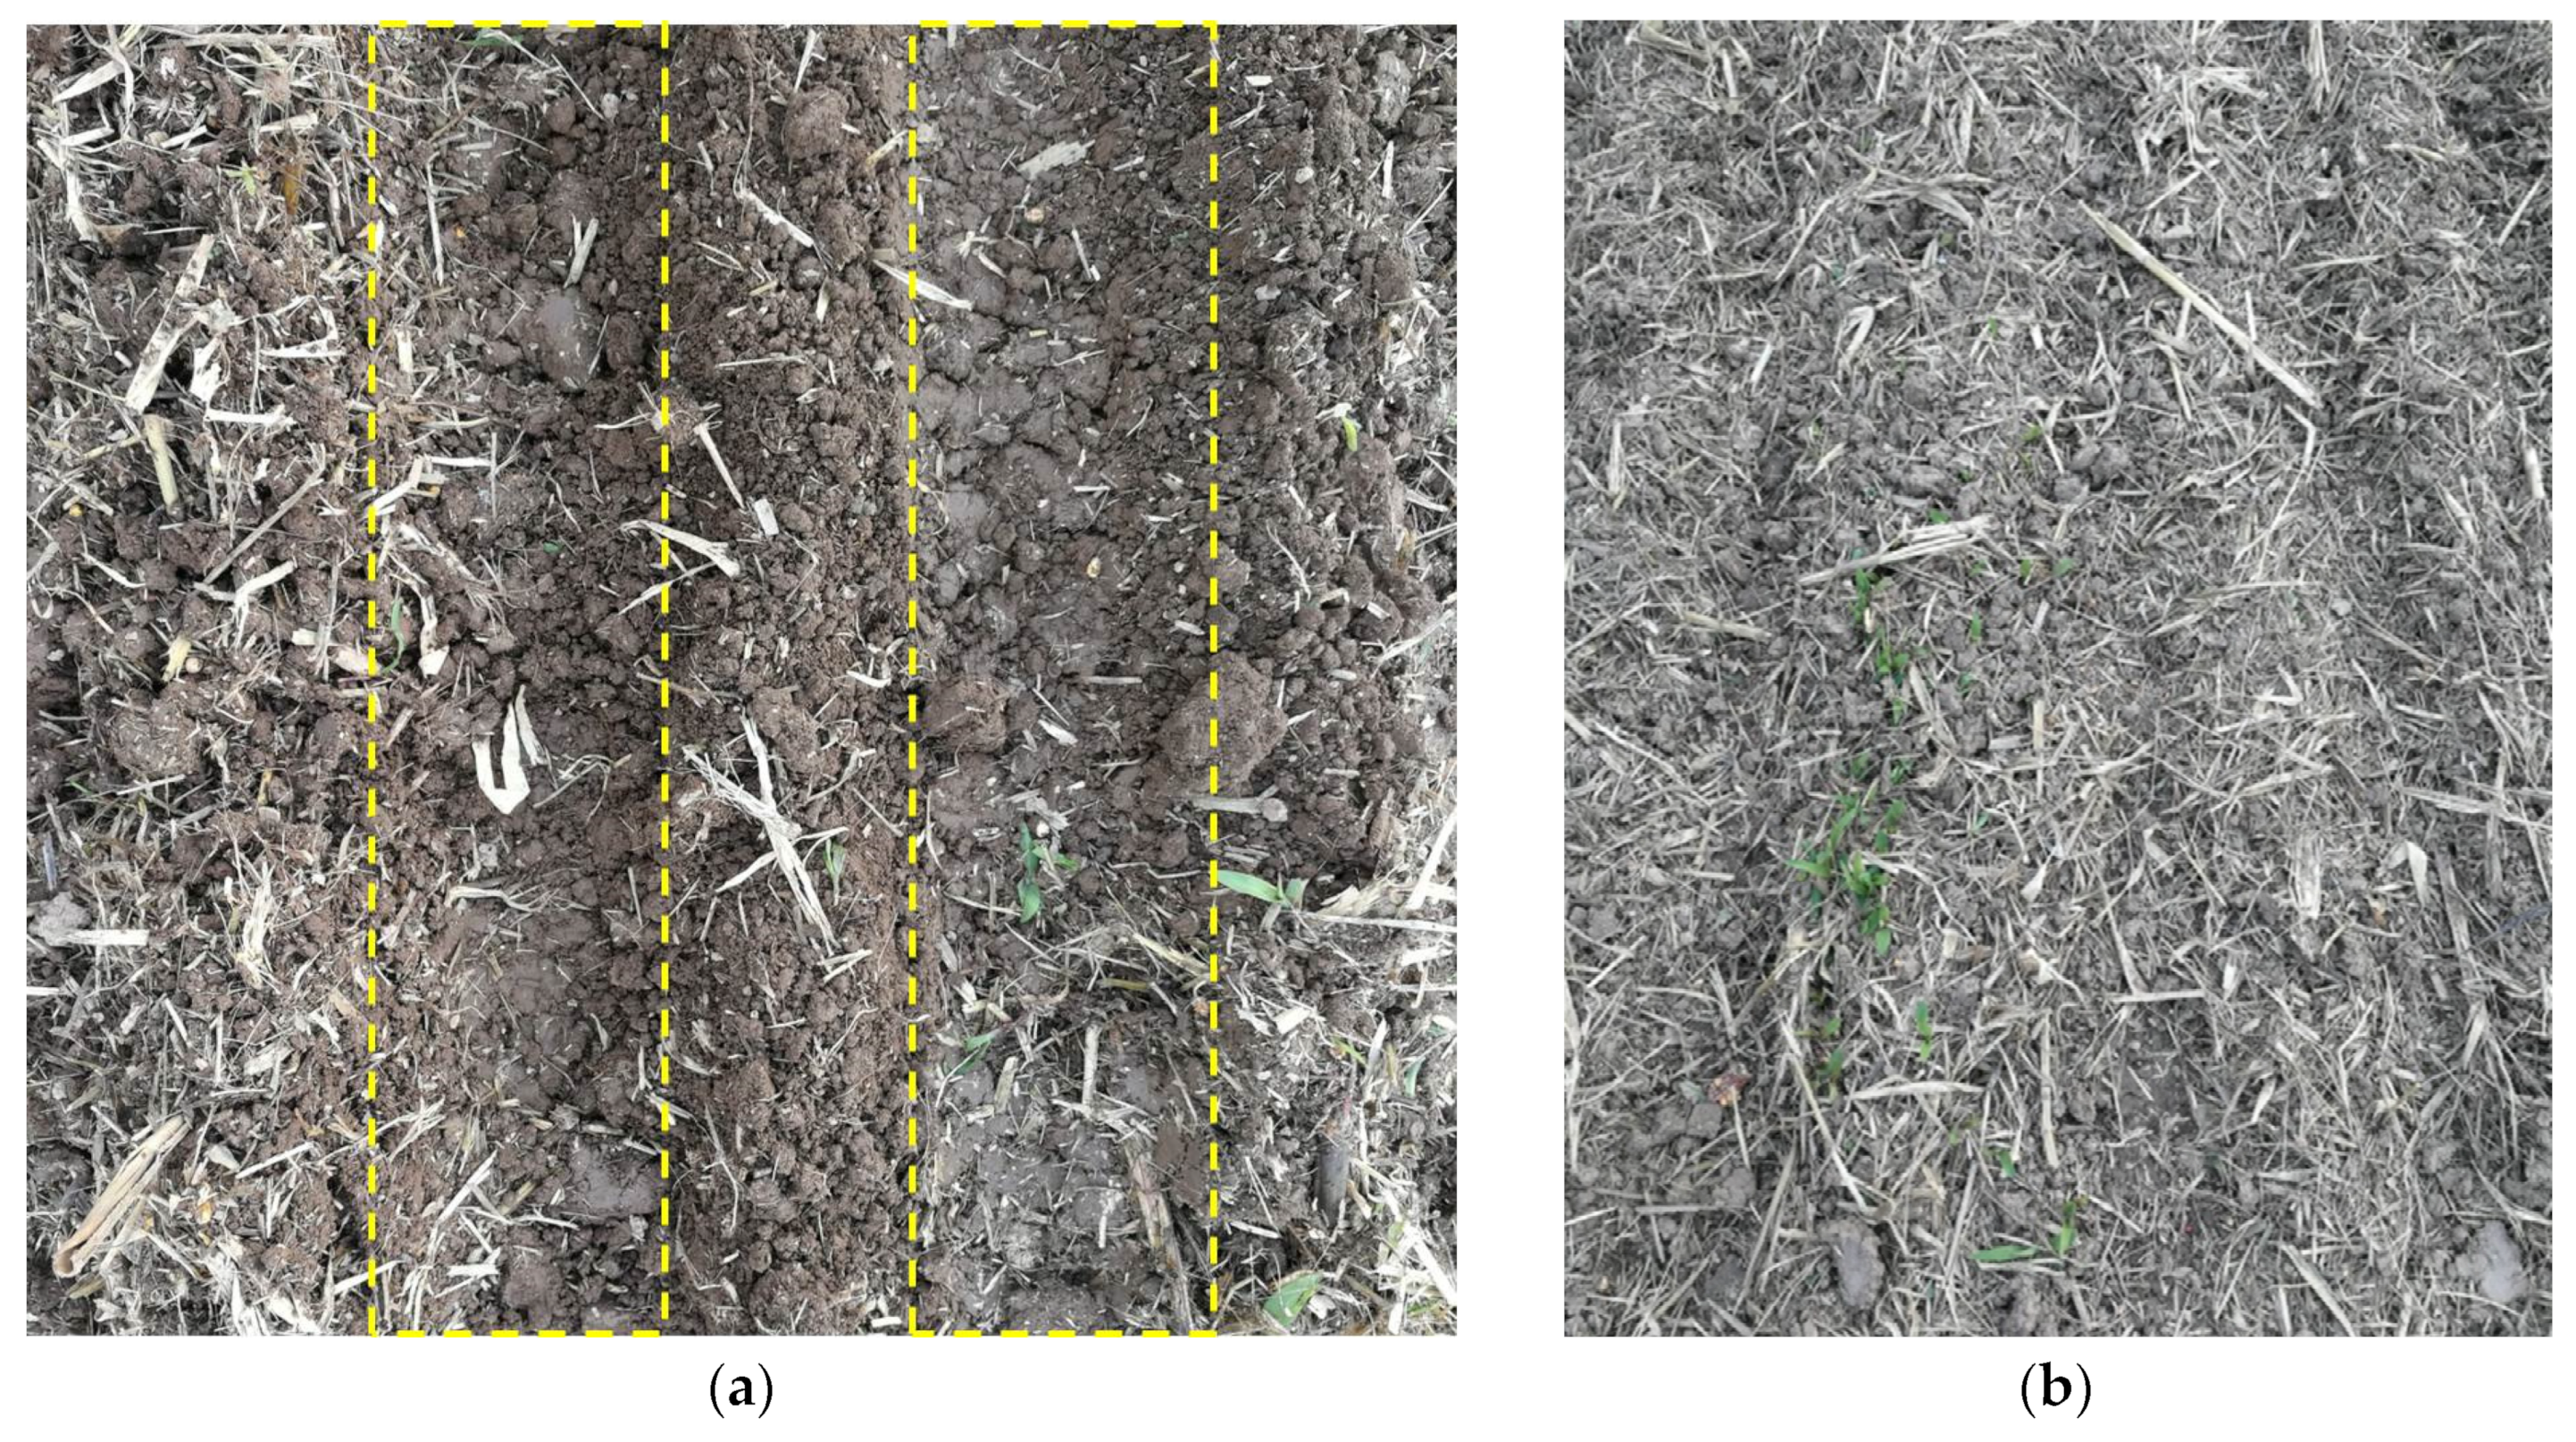
Figure 12.
Straw cleaning effect in sowing belt after the operation. (a) Sowing belt cleaning effect with SSARD; (b) sowing belt cleaning effect without SSARD.
Figure 12.
Straw cleaning effect in sowing belt after the operation. (a) Sowing belt cleaning effect with SSARD; (b) sowing belt cleaning effect without SSARD.
Table 1.
Factors and level.
Table 1.
Factors and level.
| | Factors |
|---|
| | ODRB/mm | RVSS/rpm | DSS/mm |
|---|
| Level | 150 | 100 | 60 |
| 175 | 105 | 65 |
| 200 | 110 | 70 |
| 225 | 115 | 75 |
| 250 | 120 | 80 |
Table 2.
Main parameters of field tests.
Table 2.
Main parameters of field tests.
| Items | Parameters | Values |
|---|
| The straw of the field | Average length/mm | 138 |
| Length range/mm | 65–220 |
| Average diameter/mm | 4.32 |
| Diameter range/mm | 1–12 |
| Covering thickness/mm | 47 |
| SMQ/(kg/m2) | 1.66 |
| Moisture content/% | 78.23 |
| 0–100 mm soil layer | Firmness/kPa | 507 |
| Moisture content/% | 25.39 |
| Bulk density/(g/cm3) | 1.41 |
| Temperature/℃ | 16.2 |
Table 3.
Calculation results of ineffective operation area S, effective operation area SA and ineffective operation rate η.
Table 3.
Calculation results of ineffective operation area S, effective operation area SA and ineffective operation rate η.
| | d = 60 mm | d = 65 mm | d = 70 mm | d = 75 mm | d = 80 mm |
|---|
| S/mm2 | 25,560 | 27,940 | 30,370 | 32,830 | 35,330 |
| SA/mm2 | 118,200 | 115,900 | 113,400 | 111,000 | 108,500 |
| η/% | 21.62 | 24.11 | 26.78 | 29.58 | 32.56 |
Table 4.
Calculation results of torsional shear stress τT.
Table 4.
Calculation results of torsional shear stress τT.
| | d = 60 mm | d = 65 mm | d = 70 mm | d = 75 mm | d = 80 mm |
|---|
| τT/MPa | 30.15 | 23.71 | 18.98 | 15.43 | 12.72 |
Table 5.
Main technical parameters of SSARD.
Table 5.
Main technical parameters of SSARD.
| Parameters | Values |
|---|
| Dimensions (length × width × height)/mm | 2000 × 440 × 425 |
| h−1 | 3~5 |
| ODRB D/mm | 250 |
| Pitch S/mm | 250 |
| RVSS n/rpm | 110 |
| DSS d/mm | 76 |
| Turns of RB | 0.4 |
| Width of the straw hopper b/mm | 150 |
| Gap between RB and the straw hopper s/mm | 2 |
Table 6.
Field test results of straw cleaning effect of sowing belt.
Table 6.
Field test results of straw cleaning effect of sowing belt.
| Parameters | The SRR of Sowing Belt Installed with SSARD/% | The SRR of Sowing Belt Installed without SSARD/% |
|---|
| Average | 87.98 | 72.91 |
| Variation | 4.38 | 9.54 |


 ,
, 


