
Stability Dynamics of Main Qualitative Traits in Maize Cultivations across Diverse Environments regarding Soil Characteristics and Climate

 and
and
Abstract
:1. Introduction
2. Materials and Methods
2.1. Crop Establishment and Experimental Procedures
2.2. Measurements
2.3. Data Analysis
3. Results
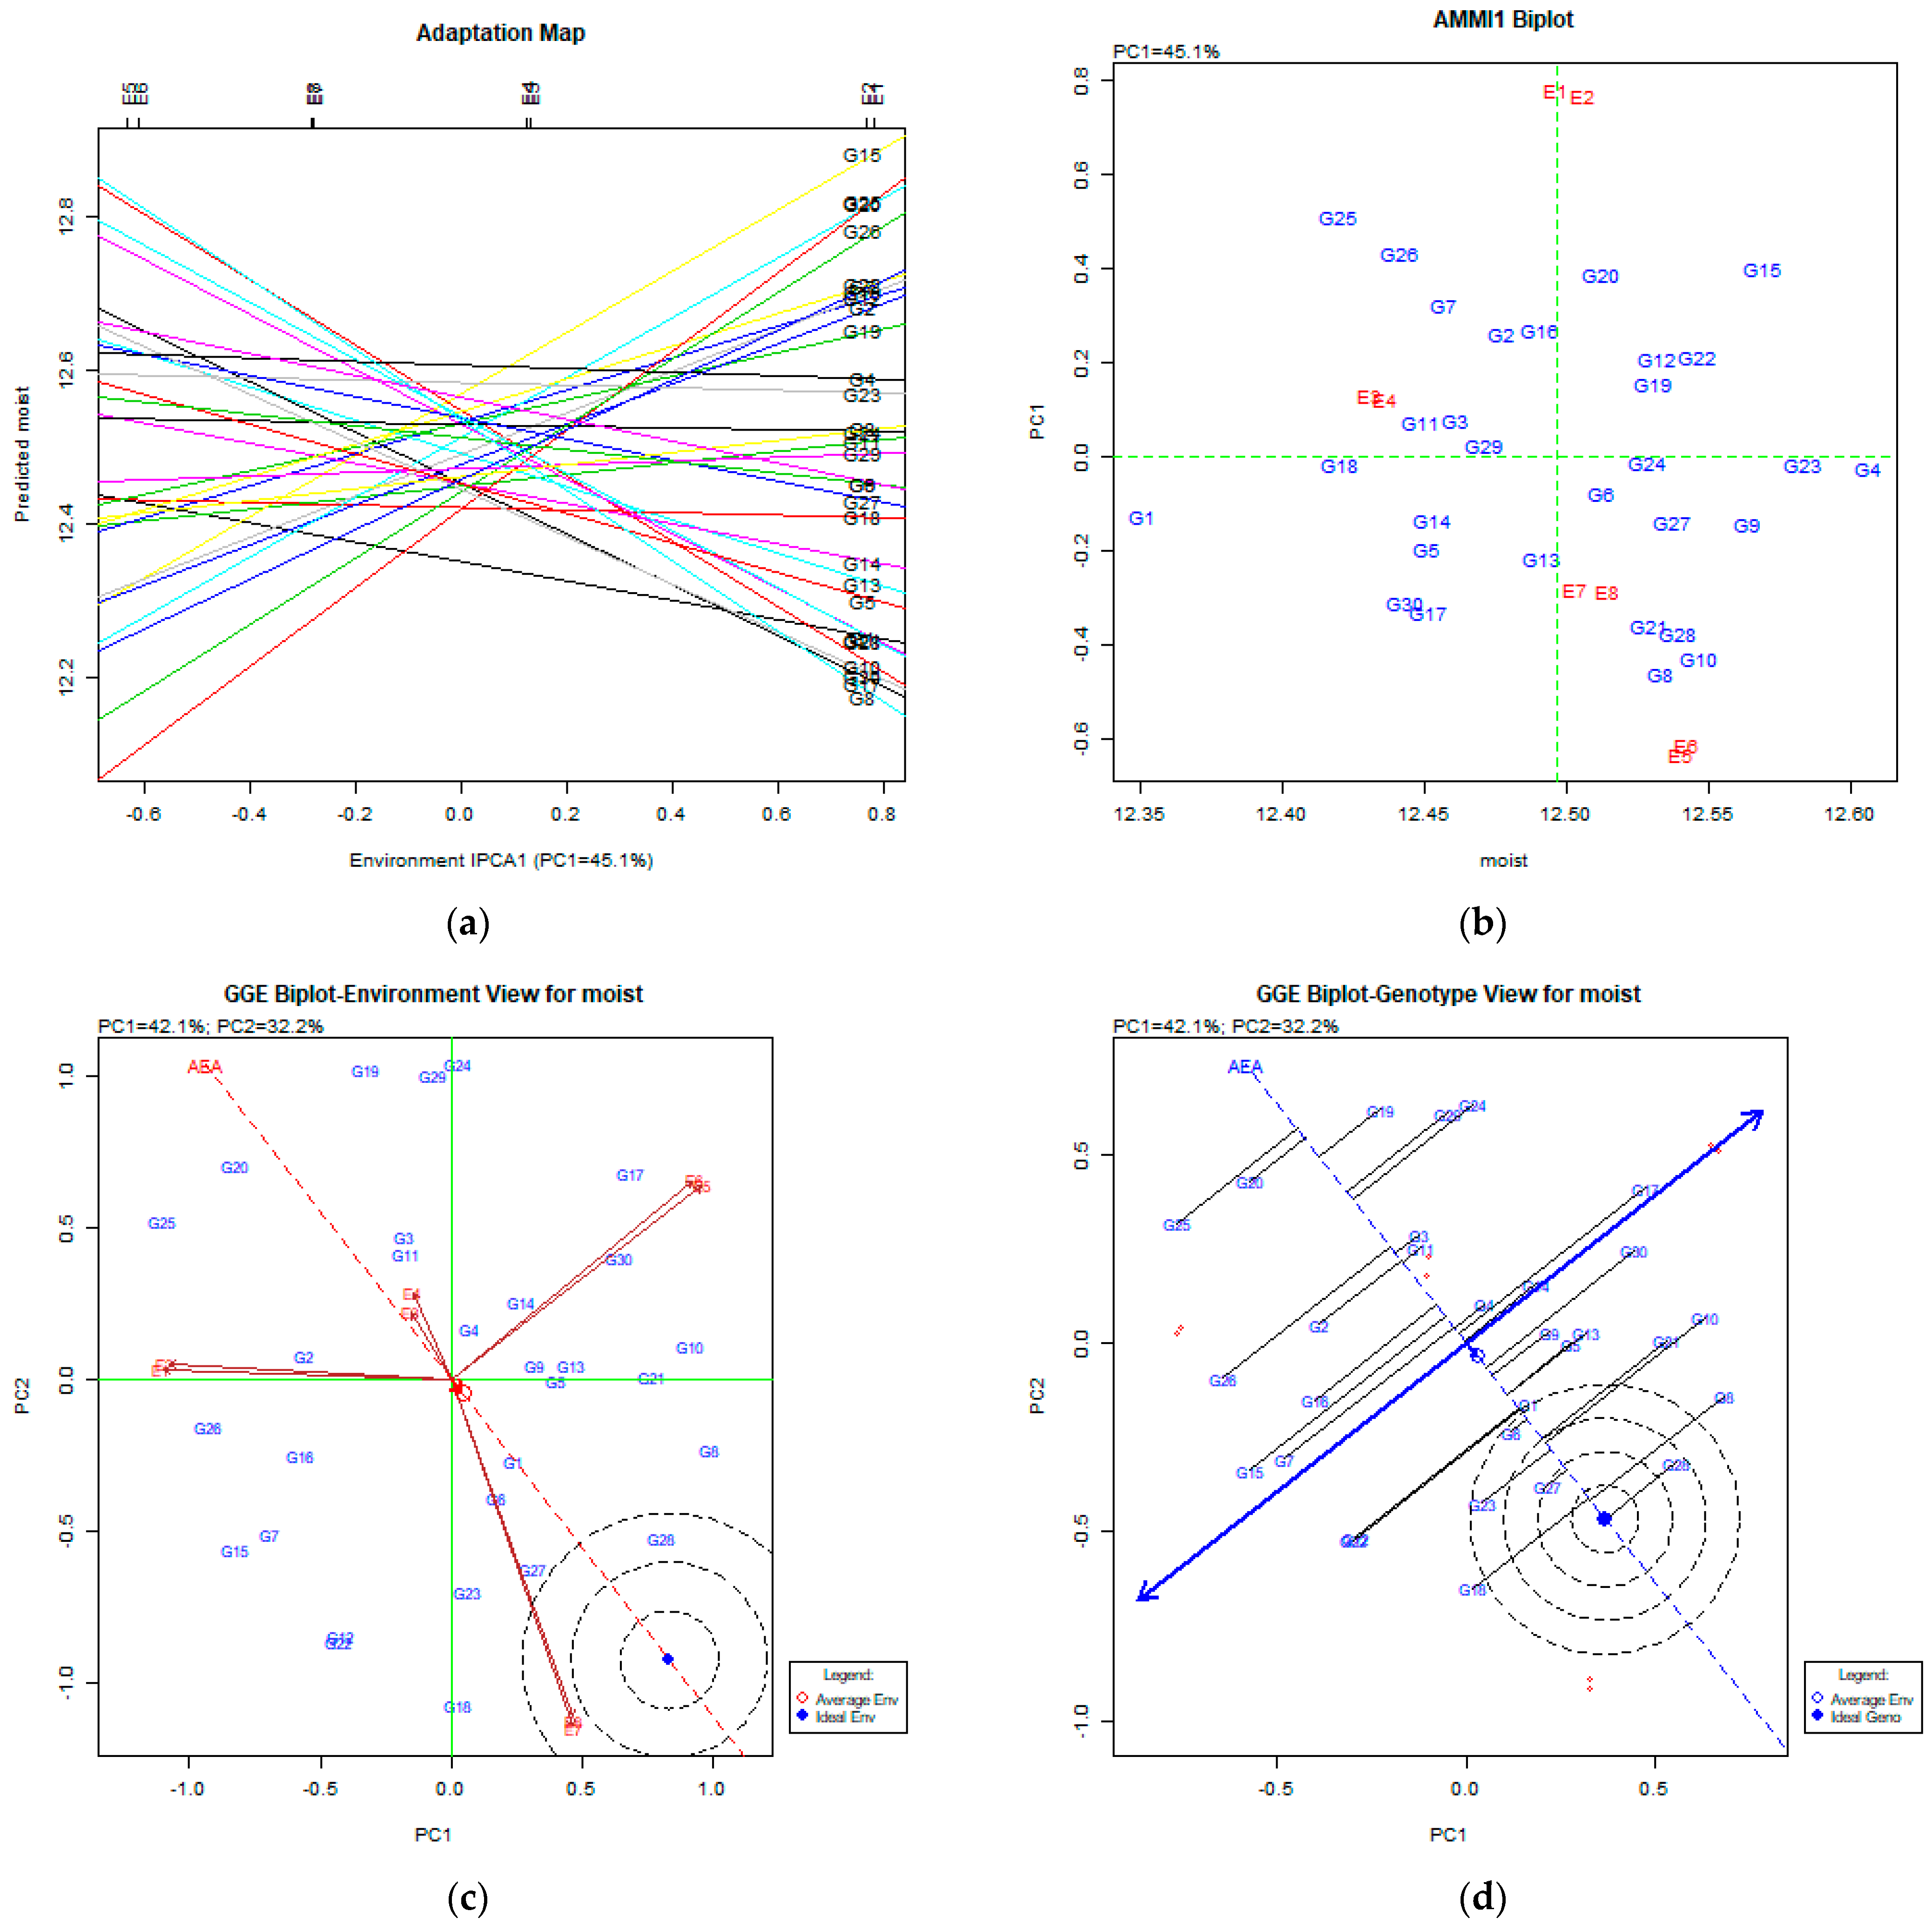
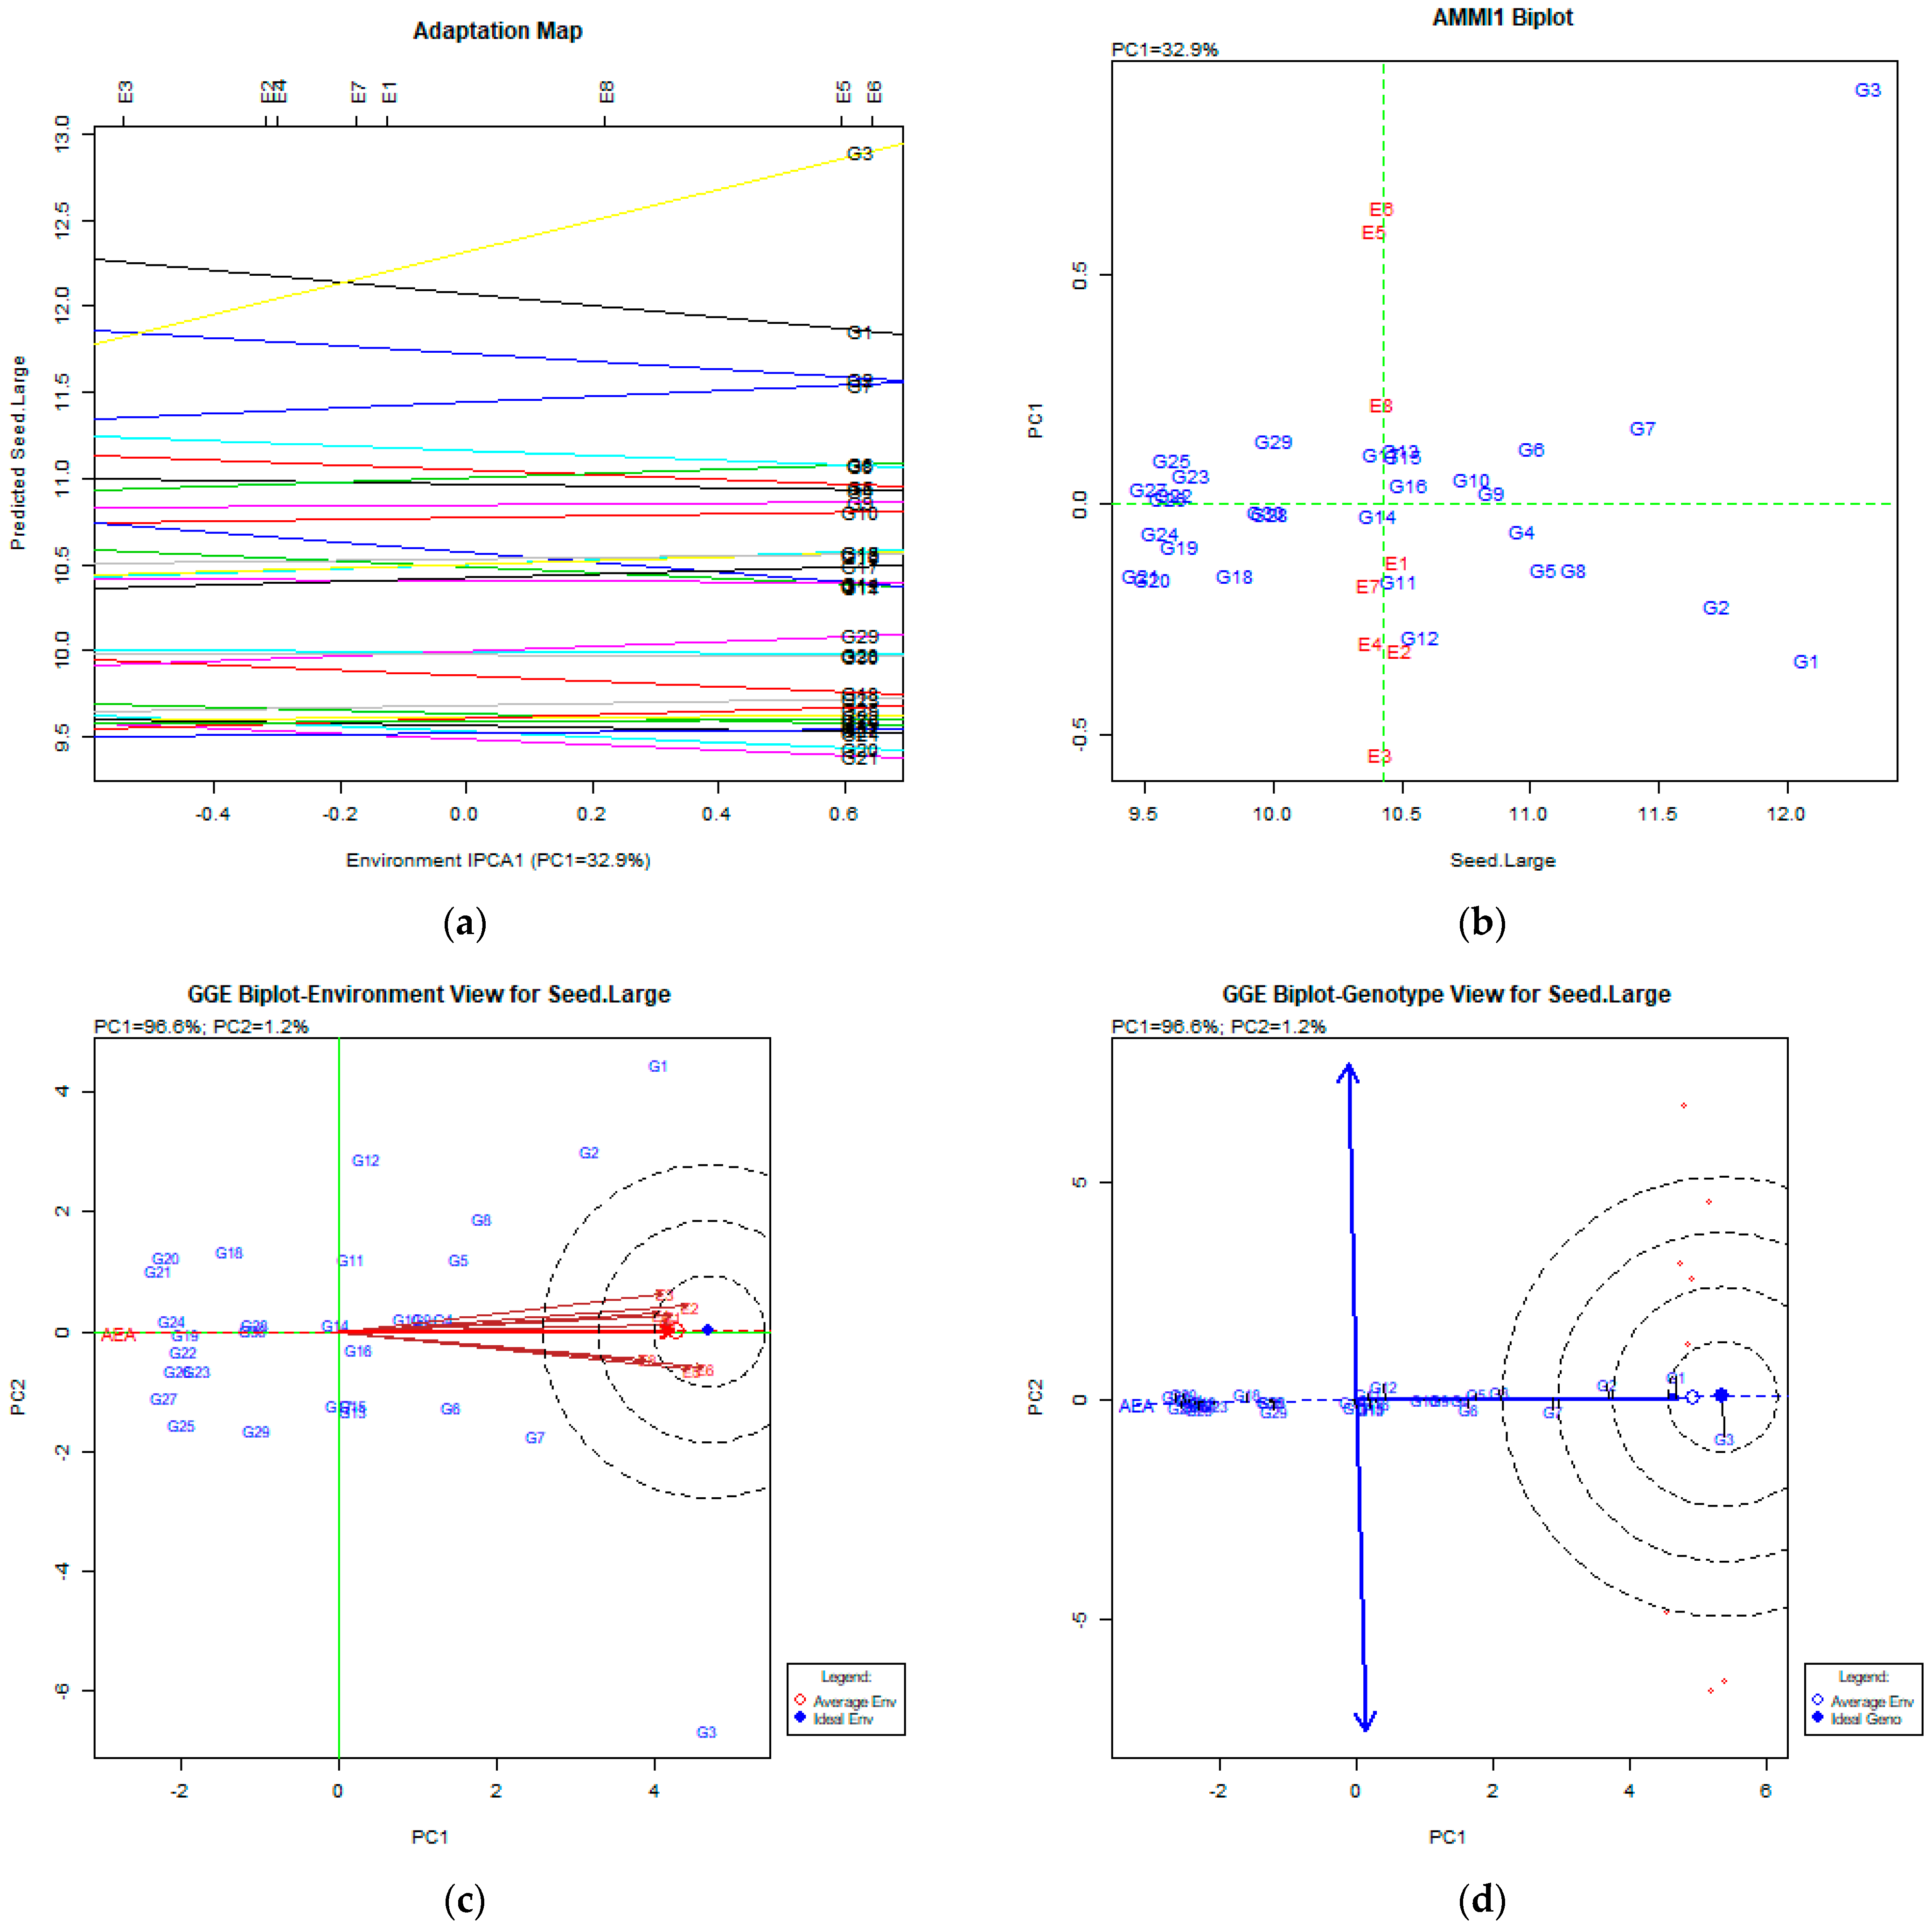
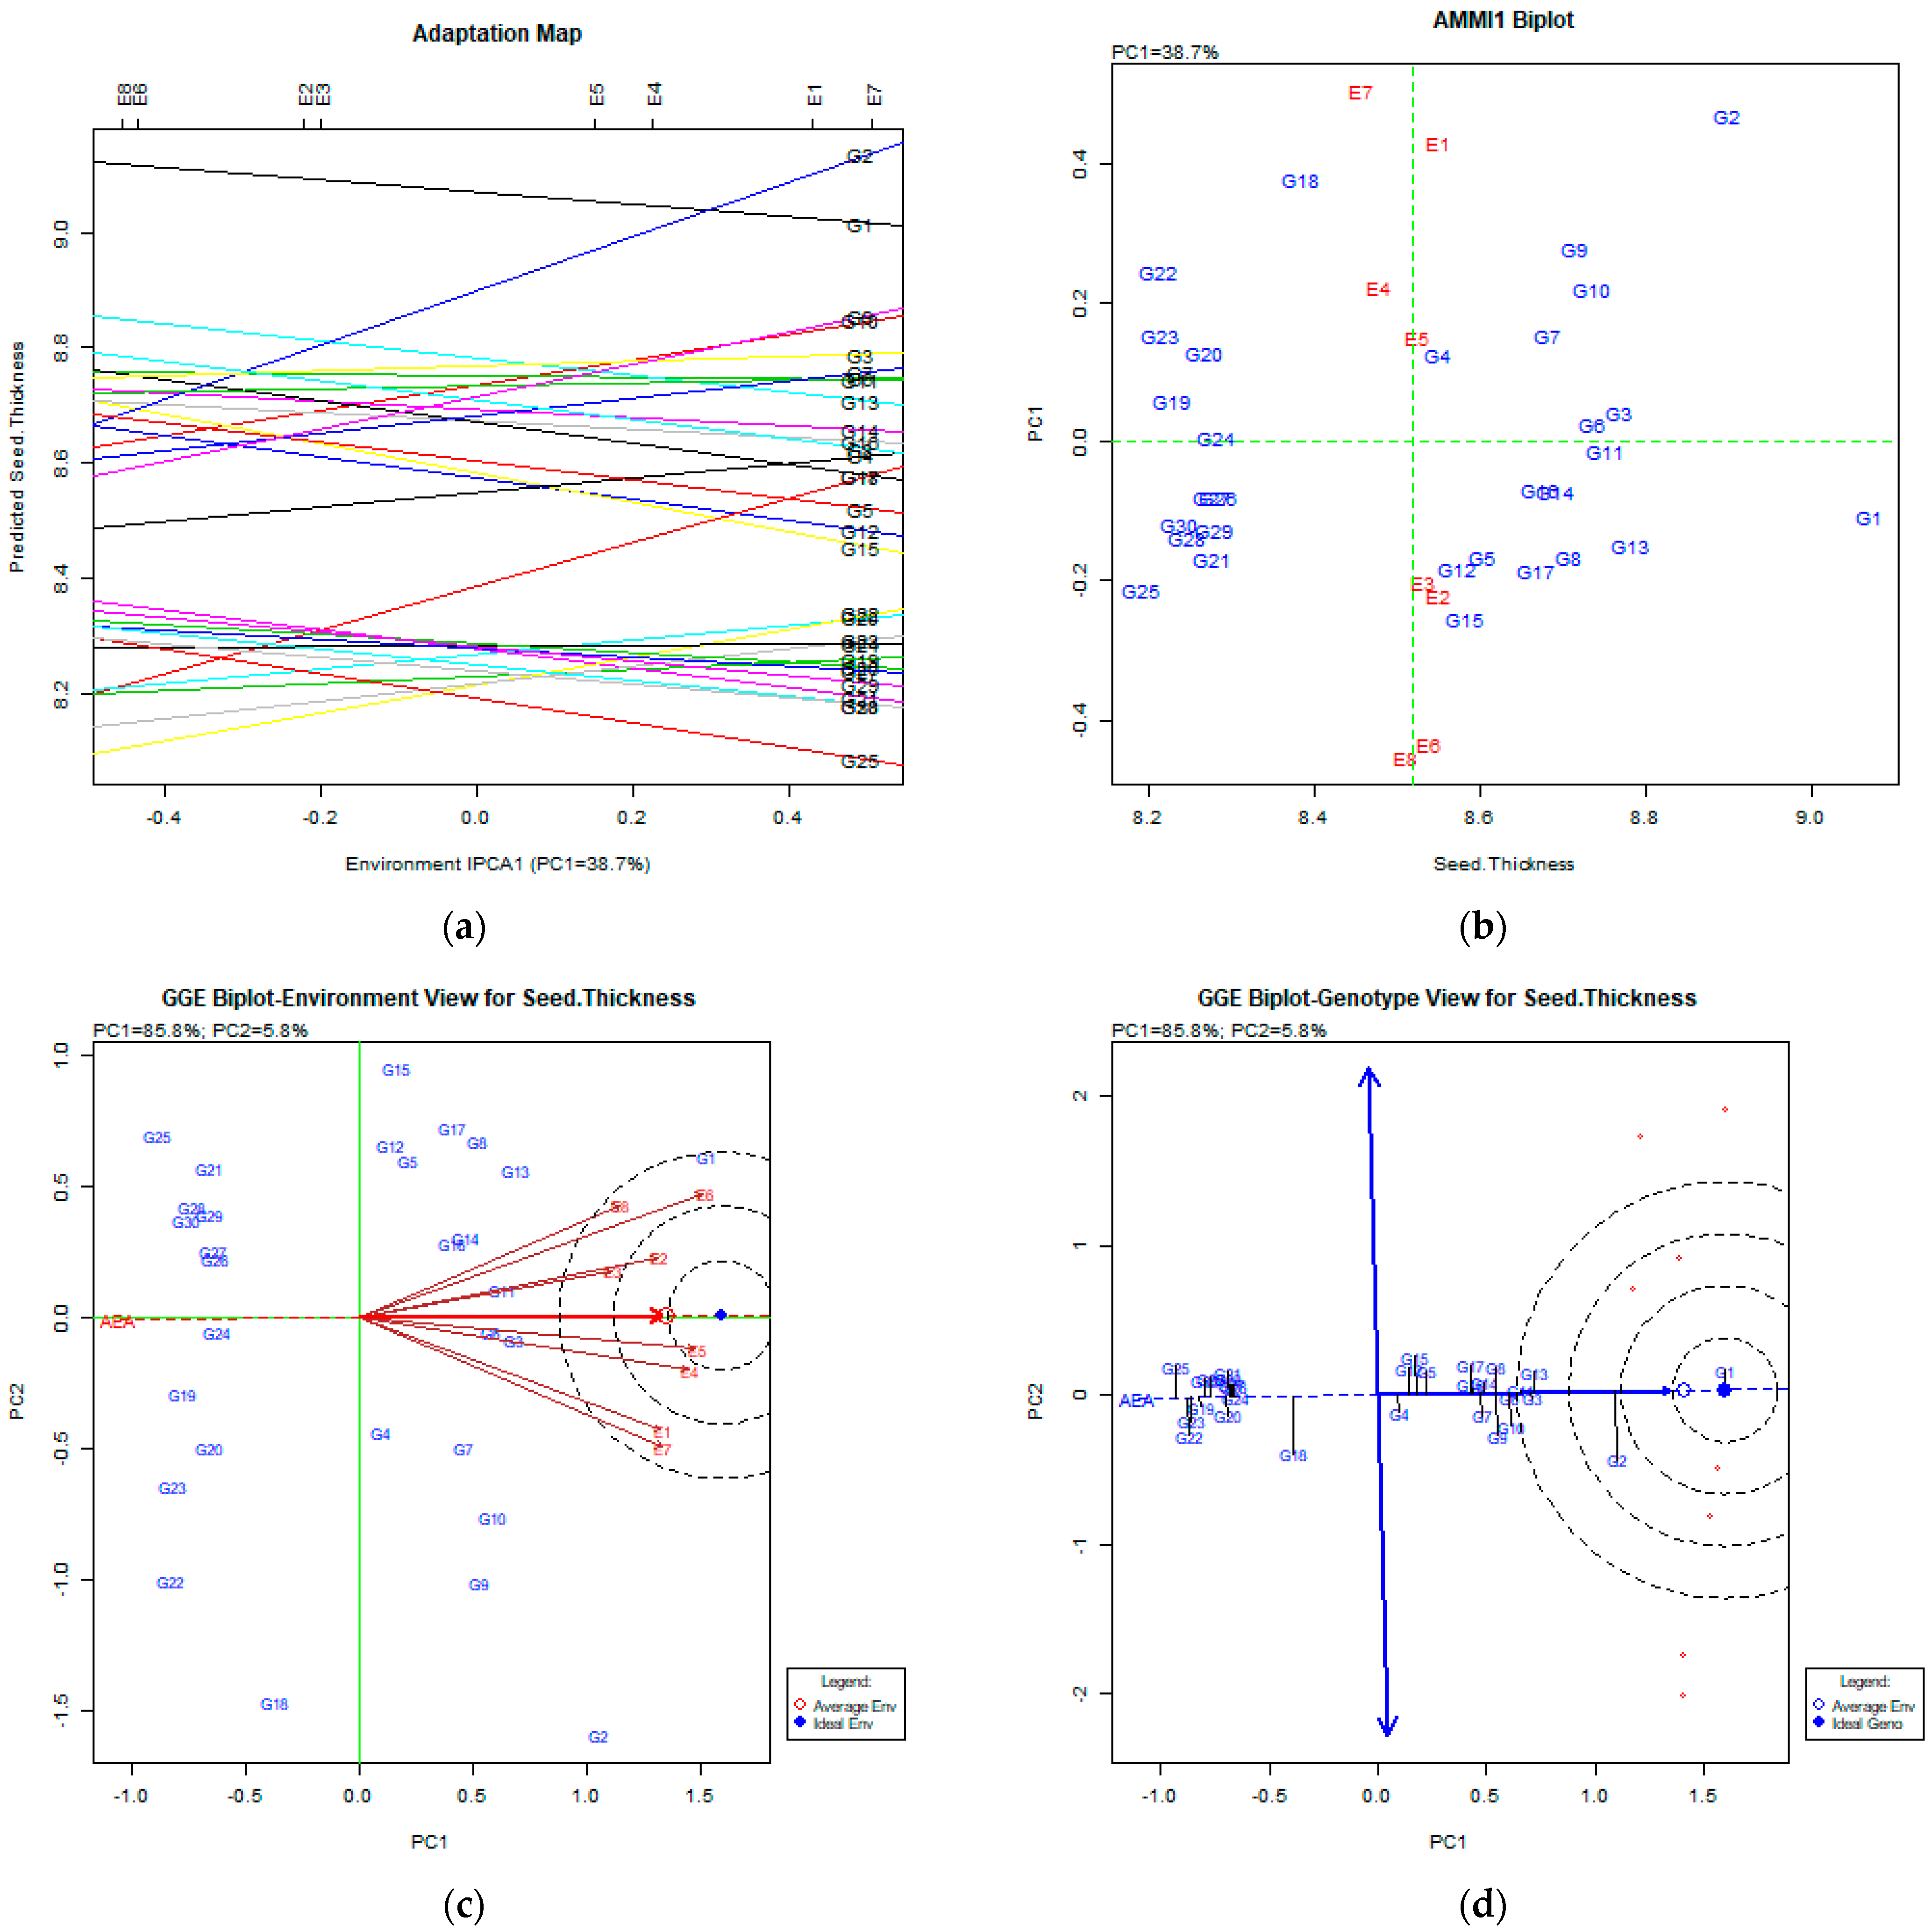
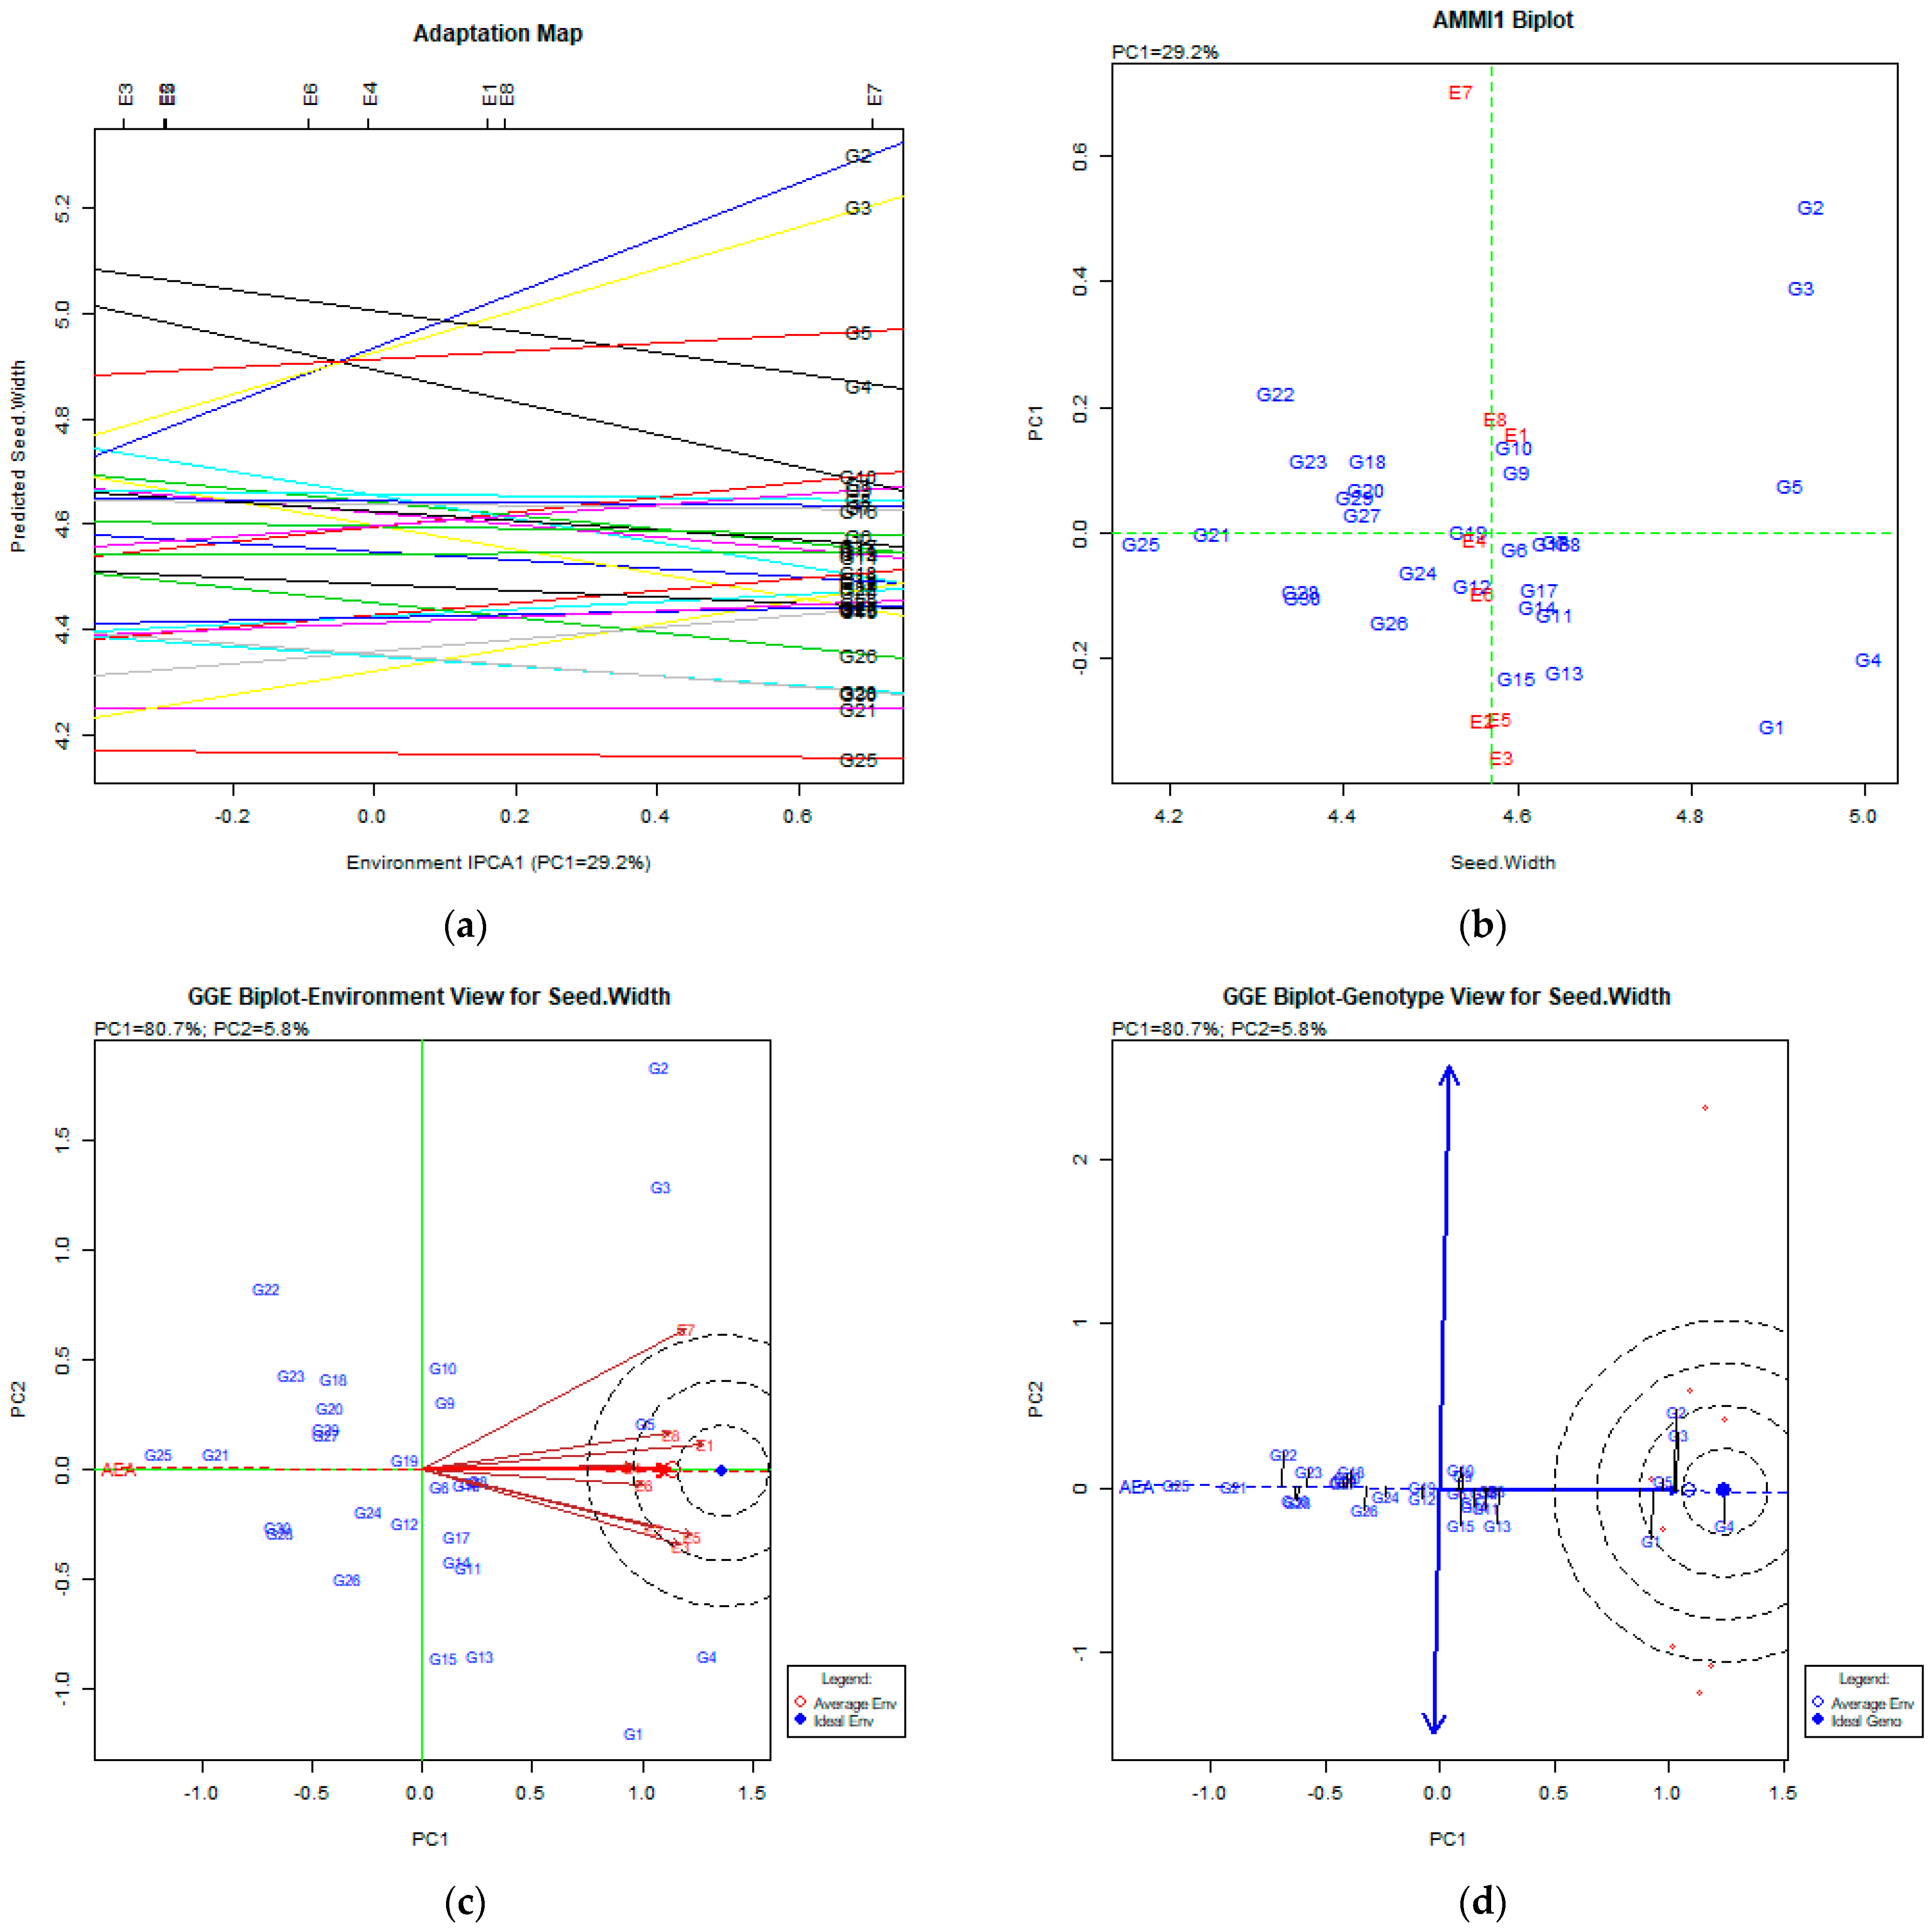
The AMMI Tool for Multi-Environment Evaluations
4. Discussion
4.1. Moisture Content (%)
4.2. Seed Length
4.3. Seed Thickness
4.4. Seed Width
5. Conclusions
Author Contributions
Funding
Institutional Review Board Statement
Data Availability Statement
Conflicts of Interest
References
- Food and Agriculture Organization of the United Nations. 2023 FAOSTAT Online Database. Available online: http://www.fao.org (accessed on 21 April 2023).
- Pond, W.G.; Church, D.B.; Pond, K.R.; Schoknecht, P.A. Basic Animal Nutrition and Feeding, 5th ed.; John Wiley & Sons, Inc.: Hoboken, NJ, USA, 2004. [Google Scholar]
- Watson, S.A. Description, development, structure, and composition of the corn kernel. In Corn: Chemistry and Technology, 2nd ed.; White, P.J., Johnson, L.A., Eds.; American Association of Cereal Chemists Inc.: St. Paul, MN, USA, 2003; pp. 69–106. [Google Scholar]
- Langade, D.M.; Shahi, J.P.; Agrawal, V.K.; Sharma, A. Maize as emerging source of oil in India: An overview. Maydica 2013, 58, 224–230. [Google Scholar]
- Kahrıman, F.; Egesel, C.Ö.; Egesel, B. A comparative study on changes and relationships of kernel biochemical components in diferent types of maize. J. Am. Oil Chem. Soc. 2015, 92, 1451–1459. [Google Scholar] [CrossRef]
- Musila, R.N.; Diallo, A.O.; Makumbi, D.; Njoroge, K. Combining ability of early- maturing quality protein maize inbred lines adapted to Eastern Africa. Field Crops Res. 2010, 119, 231–237. [Google Scholar] [CrossRef]
- Özdemir, E.; Sade, B. Genetic Analysis of Some Quality Traits in Maize. Adnan Menderes Üniv. Ziraat Fak. Derg. 2019, 16, 193–199. [Google Scholar] [CrossRef]
- Jaradat, A.A.; Goldstein, W. Diversity of maize kernels from a breeding program for protein quality: I. Physical, biochemical, nutrient, and color traits. Crop Sci. 2013, 53, 956–976. [Google Scholar] [CrossRef]
- Sibiya, J.; Tongoona, P.; Derera, J.; Rij, N. Genetic analysis and genotype by environment (G X E) for grey leaf spot disease resistance in elite African maize (Zea mays L.) germplasm. Euphytica 2012, 185, 349–362. [Google Scholar] [CrossRef]
- Falconer, D.S.; Mackay, T.F.C. Introduction to Quantitative Genetics; Longman: New York, NY, USA, 1996. [Google Scholar]
- Gauch, H.G.; Zobel, R.W. Identifying mega-environments and targeting genotypes. Crop Sci. 1997, 37, 311–326. [Google Scholar] [CrossRef]
- Loucka, R.; Tyrolová, Y.; Jancík, F.; Kubelková, P.; Homolk, P.; Jambor, V. Variation for In Vivo Digestibility in Two Maize Hybrid Silages. Czech J. Anim. Sci. 2018, 63, 17–23. [Google Scholar] [CrossRef]
- Orhun, G.E. Investigation of Agronomic and Kernel Quality Traits of Registered Maize Varieties using Principal Component Biplot Analysis. Maydica 2020, 65, 7. [Google Scholar]
- Vafias, B.; Goulas, C.; Lolas, G.; Ipsilandis, C.G. A triple stress effect on monogenotypic and multigenotypic maize populations. Asian J. Plant Sci. 2007, 6, 29–35. [Google Scholar] [CrossRef]
- Fasoulas, A.C. The Honeycomb Methodology of Plant Breeding; Department of Genetics and Plant Breeding, Aristotle University of Thessaloniki: Thessaloniki, Greece, 1988; p. 168. [Google Scholar]
- Fasoula, V.A. A novel equation paves the way for an everlasting revolution with cultivars characterized by high and stable crop yield and quality. In Proceedings of the 11th National Hellenic Conference in Genetics and Plant Breeding, Orestiada, Greece, 31 October–2 November 2006; pp. 7–14. [Google Scholar]
- Ipsilandis, C.G.; Vafias, B.N. Plant density effects on grain yield per plant in maize: Breeding implications. Asian J. Plant Sci. 2005, 4, 31–39. [Google Scholar] [CrossRef]
- Greveniotis, V.; Bouloumpasi, E.; Zotis, S.; Korkovelos, A.; Ipsilandis, C.G. Estimations on Trait Stability of Maize Genotypes. Agriculture 2021, 11, 952. [Google Scholar] [CrossRef]
- Greveniotis, V.; Sioki, E.; Ipsilandis, C.G. Estimations of fibre trait stability and type of inheritance in cotton. Czech J. Genet. Plant Breed. 2018, 54, 190–192. [Google Scholar] [CrossRef]
- Fasoula, V.A. Selection of High Yielding Plants Belonging to Entries of High Homeostasis Maximizes Efficiency in Maize Breeding. In Proceedings of the XXI International Eucarpia Conference in Maize and Sorghum Breeding in the Genomics Era, Bergamo, Italy, 21–24 June 2009; p. 29. [Google Scholar]
- Fasoula, V.A. Prognostic breeding: A new paradigm for crop improvement. Plant Breed. Rev. 2013, 37, 297–347. [Google Scholar]
- Greveniotis, V.; Bouloumpasi, E.; Zotis, S.; Korkovelos, A.; Ipsilandis, C.G. Assessment of interactions between yield components of common vetch cultivars in both conventional and low-input cultivation systems. Agriculture 2021, 11, 369. [Google Scholar] [CrossRef]
- Greveniotis, V.; Bouloumpasi, E.; Zotis, S.; Korkovelos, A.; Ipsilandis, C.G. A Stability Analysis Using AMMI and GGE Biplot Approach on Forage Yield Assessment of Common Vetch in Both Conventional and Low-Input Cultivation Systems. Agriculture 2021, 11, 567. [Google Scholar] [CrossRef]
- Greveniotis, V.; Bouloumpasi, E.; Zotis, S.; Korkovelos, A.; Ipsilandis, C.G. Yield components stability assessment of peas in conventional and low-input cultivation systems. Agriculture 2021, 11, 805. [Google Scholar] [CrossRef]
- Greveniotis, V.; Bouloumpasi, E.; Zotis, S.; Korkovelos, A.; Ipsilandis, C.G. Stability, the Last Frontier: Forage Yield Dynamics of Peas under Two Cultivation Systems. Plants 2022, 11, 892. [Google Scholar] [CrossRef]
- Kang, M.S. Simultaneous selection for yield and stability in crop performance trials: Consequences for growers. Agron. J. 1993, 85, 754–757. [Google Scholar] [CrossRef]
- Katsenios, N.; Sparangis, P.; Chanioti, S.; Giannoglou, M.; Leonidakis, D.; Christopoulos, M.V.; Katsaros, G.; Efthimiadou, A. Genotype× environment interaction of yield and grain quality traits of maize hybrids in Greece. Agronomy 2021, 11, 357. [Google Scholar] [CrossRef]
- Steel, R.G.D.; Torrie, H.; Dickey, D.A. Principles and Procedures of Statistics. A Biometrical Approach, 3rd ed.; McGraw-Hill: New York, NY, USA, 1997. [Google Scholar]
- American Association of Cereal Chemists (AACC). Approved Methods of the American Association of Cereal Chemists, 10th ed.; AACC: St. Paul, MN, USA, 2000. [Google Scholar]
- Association of Official Analytical Chemists (AOAC). Official Methods of Analysis, 18th ed.; AOAC International: Washington, DC, USA, 2005. [Google Scholar]
- Koundinya, A.V.V.; Ajeesh, B.R.; Hegde, V.; Sheela, M.N.; Mohan, C.; Asha, K.I. Genetic parameters, stability and selection of cassava genotypes between rainy and water stress conditions using AMMI, WAAS, BLUP and MTSI. Sci. Hortic. 2021, 281, 109949. [Google Scholar]
- Yadav, O.; Prasanna, B.; Yadava, P.; Jat, S.; Kumar, D.; Dhillon, B.; Solanki, I.S.; Sandhu, J.S. Doubling maize (Zea mays) production of India by 2025-challenges and opportunities. Indian J. Agric. Sci. 2016, 86, 427–434. [Google Scholar]
- Aliu, S.; Rusinovci, I.; Fetahu, S.; Simeonovska, E. Genetic diversity and correlation estimates for grain yield and quality traits in Kosovo local maize (Zea mays L.) populations. Not. Sci. Biol. 2012, 4, 121–128. [Google Scholar] [CrossRef]
- Haş, V.; Haş, I.; Pamfil, D.; Copândean, A.; Campean, S. Evaluation of “Turda” maize germplasm for phenotypic variability in grain chemical composition. Maydica 2009, 54, 313–320. [Google Scholar]
- Prasanna, B.M.; Vasal, S.K.; Kassahun, B.; Singh, N.N. Quality protein maize. Curr. Sci. 2001, 81, 1308–1319. [Google Scholar]
- Mpofu, I.D.T.; Sibanda, S.; Shonihwa, A.; Pixley, K. The nutritional value of quality protein maize for weaner pigs. J. Pet. Environ. Biotechnol. 2012, 3, 129. [Google Scholar]
- Prandini, A.; Sigolo, S.; Moschini, M.; Giuberti, G.; Morlacchini, M. Effect of the inclusion of dry pasta by-products at different levels in the diet of typical Italian finishing heavy pigs: Performance, carcass characteristics, and ham quality. Meat Sci. 2016, 114, 38–45. [Google Scholar] [CrossRef]
- Dei, K.H. Assesment of Maize (Zea mays) as a Fed Resource for Poultry; Book Chapter; Open Access Book Publisher Intech Open Limited: London, UK, 2017; pp. 1–32. [Google Scholar]
- Scrob, S.; Muste, S.; Haş, I.; Mureşan, C.; Socaci, S.; Fărcaş, A. The biochemical composition and correlation estimates for grain quality in maize. J. Agroaliment. Process. Technol. 2014, 20, 150–155. [Google Scholar]
- Saleem, M.; Ahsan, M.; Salam, M.; Majeed, A. Comparative evaluation and correlation estimates for grain yield and quality attributes in maize. Pak. J. Bot. 2008, 40, 2361–2367. [Google Scholar]


| Environments | Longitude | Latitude | Elevation (m) | Sand | Silt | Clay | Soil Texture | pH | Organic Matter | Planting Date | Harvesting Date |
|---|---|---|---|---|---|---|---|---|---|---|---|
| Giannitsa | 22°39′ E | 40°77′ N | 10 | 8.9% | 37.4% | 53.7% | clay (C) | 8.18 | 3.50% | middle April 2011 and 2012 | late September 2011 and 2012 |
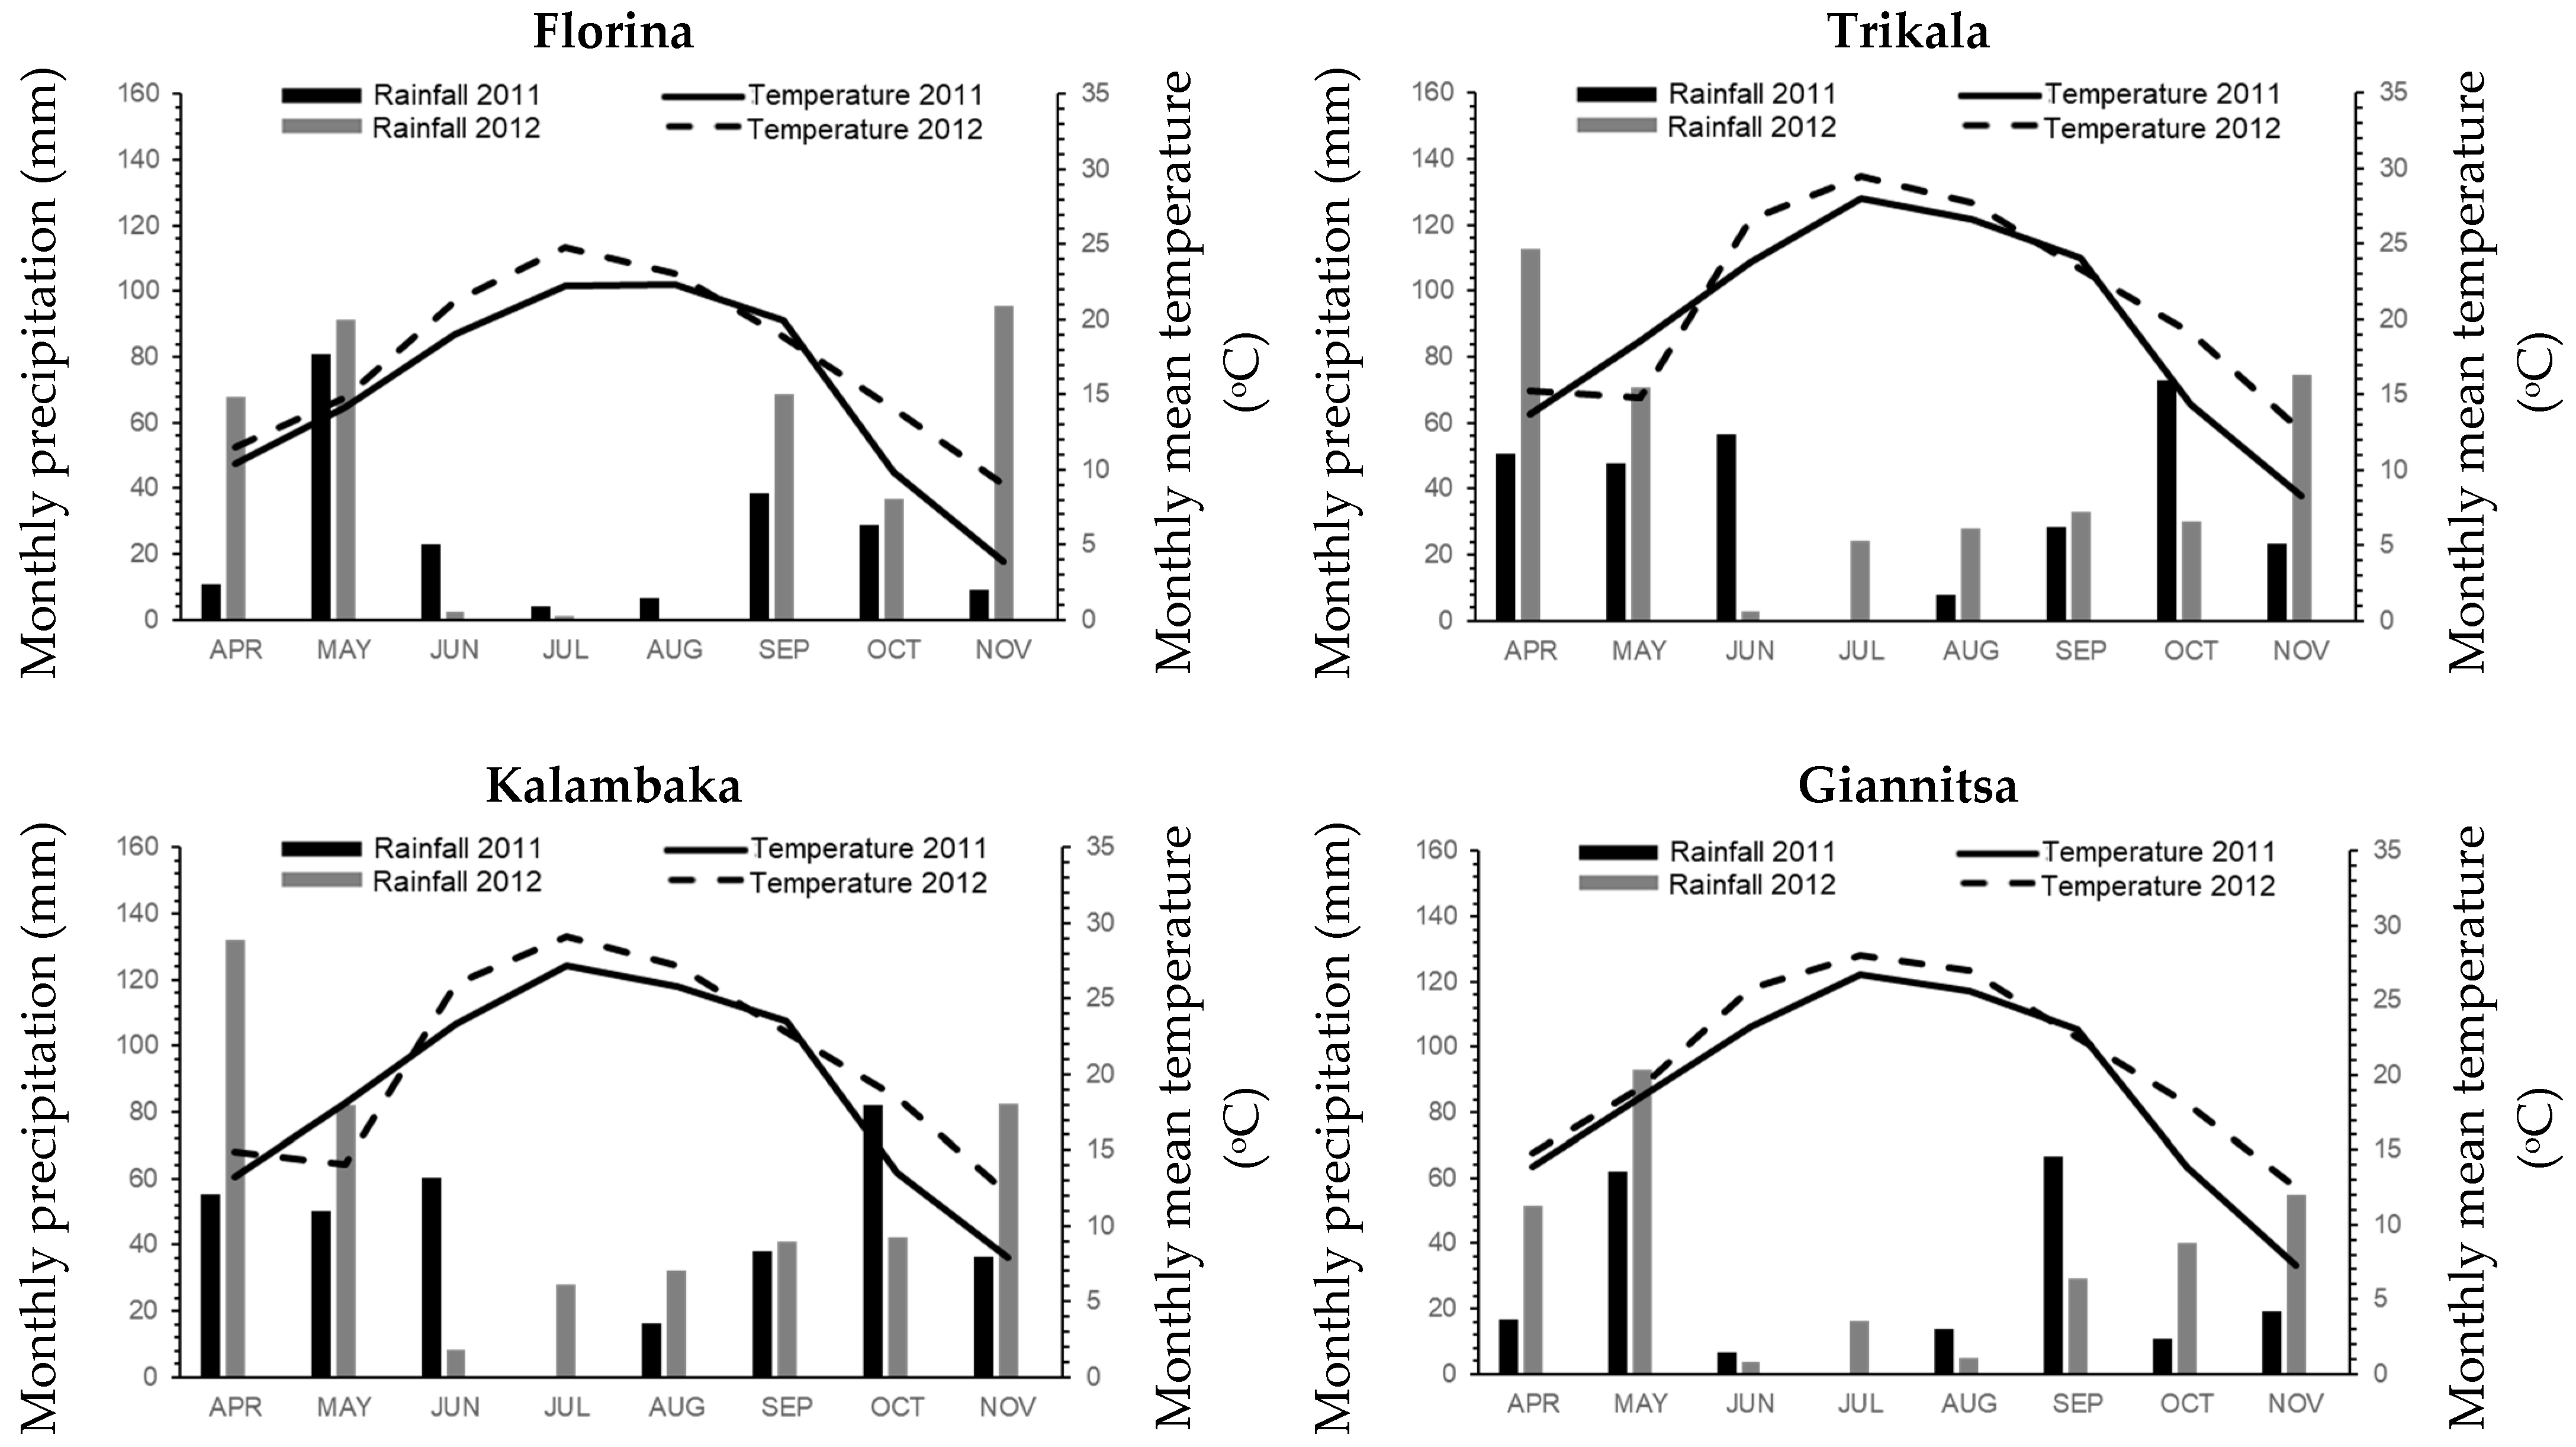
| Florina | 21°22′ E | 40°46′ N | 705 | 61.2% | 27.6% | 11.2% | sandy loam (SL) | 6.25 | 1.29% | early May 2011, middle May 2012 | middle December 2011, early November 2012 |
| Trikala | 21°64′ E | 39°55′ N | 120 | 49.0% | 19.0% | 32.0% | Sandy clay loam (SCL) | 8.0 | 2.40% | early April 2011 and 2012 | Early October 2011 and 2012 |
| Kalambaka | 21°65′ E | 39°64′ N | 190 | 1.6% | 49.1% | 49.3% | silty clay (SiC) | 8.18 | 2.14% | early April 2011 and 2012 | Early October 2011, late September 2012 |
| Source of Variation | Protein Content (%) | Fat Content (%) | Ash Content (%) | Starch Content (%) | Crude Fiber Content (%) | Moisture Content (%) | Seed Length (mm) | Seed Thickness (mm) | Seed Width (mm) |
|---|---|---|---|---|---|---|---|---|---|
| Environments (E) | 0.122 ns | 0.016 * | 0.001 ns | 1.197 ** | 0.021 ns | 0.212 ** | 0.238 ** | 0.137 ** | 0.069 * |
| REPS/Environments | 0.055 ns | 0.006 ns | 0.001 ns | 0.534 ns | 0.016 ns | 0.003 ns | 0.071ns | 0.055 ns | 0.048 ns |
| Genotypes (G) | 11.910 ** | 0.579 ** | 0.113 ** | 4.615 ** | 0.112 ** | 0.105 ** | 20.158 ** | 2.002 ** | 1.419 ** |
| Genotypes × Environments (G × E) | 0.038 ns | 0.008 ns | 0.001 ns | 0.470 ns | 0.012 ns | 0.204 ** | 0.109 ** | 0.051 * | 0.051 * |
| Error | 0.075 | 0.007 | 0.001 | 0.420 | 0.017 | 0.003 | 0.064 | 0.044 | 0.039 |
| GENOTYPES | Protein Content (%) | Fat Content (%) | Ash Content (%) | Starch Content (%) | Crude Fiber Content (%) | Moisture Content (%) | Seed Length (mm) | Seed Thickness (mm) | Seed Width (mm) |
|---|---|---|---|---|---|---|---|---|---|
| 31Y43 | 1176 | 1589 | 3592 | 9110 | 228 | 21,040 | 770 | 2828 | 530 |
| FACTOR | 1124 | 2404 | 2239 | 5781 | 426 | 5771 | 1131 | 2610 | 298 |
| COSTANZA | 859 | 874 | 6623 | 7991 | 488 | 38,183 | 909 | 2993 | 1037 |
| ARMA | 858 | 1093 | 2342 | 7428 | 170 | 22,708 | 1765 | 4138 | 1087 |
| 31A34 | 984 | 1051 | 2154 | 31,219 | 256 | 4167 | 1807 | 4410 | 669 |
| ELEONORA | 1431 | 2298 | 1533 | 6330 | 337 | 66,523 | 1590 | 1445 | 446 |
| FAMOSO | 1081 | 2256 | 2554 | 9751 | 276 | 1915 | 1724 | 1367 | 1776 |
| 6818 | 949 | 1894 | 2289 | 27,505 | 277 | 1131 | 1917 | 3981 | 1165 |
| MITIC | 916 | 1142 | 1957 | 11,082 | 409 | 5428 | 2295 | 1180 | 2983 |
| 6040 | 1173 | 1310 | 3252 | 12,045 | 481 | 1103 | 1297 | 3710 | 661 |
| KERMESS | 1062 | 2003 | 2984 | 7023 | 147 | 40,125 | 817 | 2477 | 1015 |
| 31G98 | 846 | 925 | 2945 | 11,546 | 265 | 3424 | 920 | 774 | 350 |
| LG3535 | 1228 | 962 | 2712 | 9703 | 290 | 4315 | 3803 | 2574 | 592 |
| 33A46 | 743 | 2511 | 2561 | 11,140 | 326 | 7435 | 2324 | 879 | 335 |
| 31P41 | 1273 | 1678 | 2062 | 11,112 | 417 | 1409 | 2641 | 14,372 | 658 |
| 1T | 754 | 1509 | 2004 | 20,134 | 326 | 4172 | 2832 | 2212 | 470 |
| 2T | 1017 | 1346 | 3104 | 6308 | 336 | 1357 | 5618 | 1939 | 1678 |
| 3Τ | 1022 | 835 | 2360 | 8201 | 382 | 35,384 | 3925 | 1836 | 973 |
| 4Τ | 1138 | 1032 | 3229 | 5619 | 221 | 93,347 | 3889 | 1704 | 494 |
| 5Τ | 1115 | 1324 | 2683 | 5942 | 363 | 4423 | 2518 | 4305 | 646 |
| 1F | 966 | 790 | 2350 | 7739 | 290 | 1723 | 1895 | 4139 | 630 |
| 2F | 931 | 1172 | 2851 | 23,876 | 434 | 3154 | 1709 | 1504 | 572 |
| 3F | 1233 | 1633 | 3134 | 11,794 | 236 | 28,987 | 1471 | 2515 | 994 |
| 4F | 1040 | 1673 | 846 | 24,707 | 219 | 10,148 | 1215 | 3245 | 521 |
| 5F | 788 | 1709 | 2269 | 17,964 | 430 | 1488 | 2940 | 1034 | 566 |
| 6F | 914 | 1218 | 2638 | 6032 | 260 | 1541 | 2360 | 1745 | 365 |
| 7F | 885 | 421 | 3247 | 4406 | 249 | 43,753 | 984 | 960 | 341 |
| 8F | 855 | 1058 | 2504 | 5924 | 430 | 2514 | 1249 | 1781 | 878 |
| 9F | 945 | 1476 | 2225 | 8012 | 287 | 13,359 | 638 | 2227 | 536 |
| 10F | 976 | 1515 | 3038 | 29,253 | 303 | 1536 | 1902 | 3633 | 728 |
| GENOTYPES | Protein (%) | Fat (%) | Ash (%) | Starch (%) | Crude Fiber (%) | Moisture (%) | Seed Length (mm) | Seed Thickness (mm) | Seed Width (mm) |
|---|---|---|---|---|---|---|---|---|---|
| 31Y43 | 853 | 1607 | 1709 | 7115 | 199 | 13,063 | 3442 | 597 | 430 |
| FACTOR | 750 | 2173 | 9280 | 5087 | 206 | 4825 | 610 | 2656 | 449 |
| COSTANZA | 1023 | 1430 | 1626 | 14,170 | 256 | 126,070 | 576 | 1872 | 313 |
| ARMA | 1443 | 1078 | 3321 | 15,815 | 559 | 24,051 | 1320 | 879 | 387 |
| 31A34 | 1155 | 2026 | 6946 | 7199 | 511 | 6112 | 3088 | 2229 | 545 |
| ELEONORA | 832 | 1192 | 2223 | 7191 | 329 | 33,084 | 1873 | 992 | 394 |
| FAMOSO | 906 | 856 | 2767 | 12,740 | 613 | 2051 | 1128 | 2008 | 493 |
| 6818 | 1111 | 1376 | 3639 | 29,684 | 314 | 1611 | 3077 | 1624 | 3389 |
| MITIC | 939 | 1788 | 2175 | 32,629 | 527 | 12,197 | 1634 | 787 | 264 |
| 6040 | 1223 | 3155 | 2087 | 20,412 | 415 | 1292 | 2723 | 4029 | 1218 |
| KERMESS | 937 | 1469 | 2889 | 10,016 | 392 | 59,319 | 1510 | 2005 | 1060 |
| 31G98 | 1392 | 3010 | 2554 | 6063 | 359 | 2527 | 1417 | 3140 | 767 |
| LG3535 | 1015 | 1816 | 2752 | 7254 | 471 | 5254 | 694 | 1706 | 575 |
| 33A46 | 1245 | 1284 | 3812 | 7888 | 347 | 9634 | 2575 | 1006 | 660 |
| 31P41 | 905 | 1727 | 2678 | 7105 | 312 | 1468 | 2375 | 1319 | 808 |
| 1T | 1255 | 1670 | 5209 | 4720 | 299 | 4043 | 1106 | 1662 | 371 |
| 2T | 1056 | 1089 | 2867 | 6393 | 237 | 1327 | 2529 | 790 | 358 |
| 3Τ | 980 | 1648 | 2163 | 6467 | 326 | 17,108 | 2378 | 2620 | 668 |
| 4Τ | 867 | 2449 | 2605 | 8814 | 487 | 65,561 | 1919 | 943 | 375 |
| 5Τ | 1042 | 1947 | 3620 | 9327 | 346 | 3946 | 1163 | 1685 | 352 |
| 1F | 1062 | 3774 | 5189 | 7582 | 398 | 1808 | 1693 | 14,877 | 326 |
| 2F | 1169 | 1541 | 2308 | 7425 | 346 | 3014 | 2700 | 850 | 498 |
| 3F | 1002 | 1527 | 2245 | 4800 | 465 | 60,878 | 2636 | 3231 | 499 |
| 4F | 958 | 962 | 1794 | 6683 | 573 | 6925 | 1968 | 2650 | 510 |
| 5F | 1201 | 1005 | 3993 | 8228 | 294 | 1754 | 1512 | 2929 | 811 |
| 6F | 1410 | 1202 | 2470 | 15,470 | 420 | 1447 | 2686 | 2430 | 1014 |
| 7F | 1159 | 570 | 2916 | 8300 | 582 | 19,503 | 1273 | 2076 | 967 |
| 8F | 1292 | 2914 | 2905 | 10,091 | 327 | 2143 | 883 | 2263 | 849 |
| 9F | 1085 | 2027 | 2471 | 5557 | 297 | 16,786 | 4450 | 1773 | 1744 |
| 10F | 1200 | 2181 | 3236 | 13,005 | 423 | 1789 | 2319 | 1143 | 379 |
| GENOTYPES | Protein (%) | Fat (%) | Ash (%) | Starch (%) | Crude Fiber (%) | Moisture (%) | Seed Length (mm) | Seed Thickness (mm) | Seed Width (mm) |
|---|---|---|---|---|---|---|---|---|---|
| 31Y43 | 1009 | 1261 | 883 | 8747 | 406 | 7352 | 1768 | 3101 | 238 |
| FACTOR | 502 | 2191 | 2519 | 3499 | 287 | 26,327 | 866 | 2146 | 191 |
| COSTANZA | 660 | 1201 | 3913 | 14,386 | 558 | 2665 | 2395 | 3956 | 616 |
| ARMA | 965 | 1499 | 2342 | 9812 | 247 | 21,293 | 2168 | 1990 | 271 |
| 31A34 | 842 | 2481 | 10,199 | 14,812 | 288 | 25,310 | 3689 | 975 | 379 |
| ELEONORA | 935 | 1429 | 1611 | 10,697 | 423 | 3727 | 1306 | 3768 | 1051 |
| FAMOSO | 787 | 1644 | 3601 | 31,467 | 268 | 12,988 | 1128 | 1506 | 452 |
| 6818 | 799 | 796 | 3044 | 13,060 | 222 | 2997 | 1721 | 1312 | 973 |
| MITIC | 883 | 2136 | 1910 | 15,236 | 462 | 25,540 | 1890 | 2571 | 2452 |
| 6040 | 1369 | 2566 | 3191 | 11,663 | 339 | 25,965 | 1114 | 3122 | 637 |
| KERMESS | 1353 | 1218 | 2446 | 9176 | 294 | 42,910 | 2802 | 1701 | 380 |
| 31G98 | 896 | 1870 | 3835 | 7531 | 805 | 1584 | 7007 | 926 | 345 |
| LG3535 | 761 | 3372 | 2712 | 8299 | 522 | 4688 | 1085 | 1738 | 429 |
| 33A46 | 774 | 1434 | 2893 | 18,705 | 336 | 7183 | 1437 | 1152 | 413 |
| 31P41 | 1178 | 1048 | 2839 | 6781 | 780 | 22,095 | 2329 | 824 | 330 |
| 1T | 1545 | 1798 | 2248 | 14,429 | 315 | 7279 | 2312 | 1000 | 432 |
| 2T | 1332 | 1941 | 2259 | 11,303 | 334 | 13,322 | 1786 | 736 | 1673 |
| 3Τ | 830 | 1044 | 3542 | 10,062 | 260 | 3244 | 3744 | 1260 | 770 |
| 4Τ | 1086 | 1309 | 2360 | 7771 | 187 | 4443 | 2794 | 3636 | 1387 |
| 5Τ | 1252 | 1006 | 2804 | 7156 | 168 | 2486 | 6734 | 1240 | 311 |
| 1F | 1086 | 1861 | 3176 | 6012 | 311 | 11,634 | 4261 | 2244 | 550 |
| 2F | 1136 | 1844 | 2499 | 9319 | 320 | 5098 | 2022 | 3479 | 1050 |
| 3F | 989 | 1478 | 2922 | 13,209 | 355 | 1434 | 899 | 2472 | 386 |
| 4F | 927 | 1301 | 2460 | 6845 | 362 | 5293 | 1441 | 1501 | 889 |
| 5F | 1021 | 1245 | 3838 | 7837 | 436 | 2852 | 2647 | 1132 | 740 |
| 6F | 1155 | 1584 | 3680 | 16,028 | 482 | 28,191 | 1676 | 1290 | 392 |
| 7F | 960 | 416 | 3010 | 3899 | 330 | 1199 | 1216 | 1345 | 371 |
| 8F | 1296 | 1462 | 2330 | 10,464 | 536 | 5391 | 858 | 918 | 895 |
| 9F | 955 | 1984 | 4397 | 7052 | 244 | 11,259 | 1416 | 1138 | 388 |
| 10F | 1554 | 1412 | 3140 | 9867 | 170 | 15,922 | 1797 | 3854 | 264 |
| GENOTYPES | Protein (%) | Fat (%) | Ash (%) | Starch (%) | Crude Fiber (%) | Moisture Content (%) | Seed Length (mm) | Seed Thickness (mm) | Seed Width (mm) |
|---|---|---|---|---|---|---|---|---|---|
| 31Y43 | 668 | 2054 | 1687 | 6159 | 107 | 5206 | 1340 | 2178 | 309 |
| FACTOR | 1349 | 1735 | 3064 | 10,733 | 239 | 34,483 | 1450 | 630 | 731 |
| COSTANZA | 1018 | 2840 | 2157 | 8782 | 265 | 3705 | 1007 | 4240 | 192 |
| ARMA | 1030 | 2210 | 3823 | 12,293 | 361 | 7744 | 939 | 1253 | 602 |
| 31A34 | 1127 | 1784 | 1627 | 8753 | 597 | 100,640 | 4511 | 1890 | 226 |
| ELEONORA | 1028 | 1255 | 2774 | 7575 | 348 | 4034 | 5382 | 2122 | 899 |
| FAMOSO | 985 | 2083 | 2405 | 16,974 | 317 | 9429 | 757 | 1698 | 381 |
| 6818 | 968 | 1646 | 2678 | 23,748 | 2906 | 4354 | 1907 | 935 | 777 |
| MITIC | 1042 | 1643 | 5023 | 29,778 | 427 | 14,756 | 2616 | 2377 | 847 |
| 6040 | 1041 | 1660 | 3625 | 31,207 | 597 | 37,199 | 1408 | 2139 | 490 |
| KERMESS | 3003 | 2115 | 2840 | 8543 | 370 | 16,848 | 2587 | 2241 | 894 |
| 31G98 | 991 | 1884 | 2481 | 16,875 | 221 | 1427 | 1041 | 2067 | 461 |
| LG3535 | 1367 | 1196 | 2848 | 11,483 | 255 | 3246 | 1713 | 1426 | 543 |
| 33A46 | 1725 | 1493 | 2709 | 13,853 | 476 | 7960 | 1936 | 1960 | 2772 |
| 31P41 | 1112 | 1110 | 2119 | 9457 | 234 | 24,804 | 3370 | 1492 | 702 |
| 1T | 1280 | 1706 | 4040 | 17,896 | 348 | 7518 | 2189 | 1512 | 949 |
| 2T | 1338 | 1532 | 3612 | 7988 | 366 | 23,123 | 2544 | 872 | 333 |
| 3Τ | 1113 | 2565 | 2101 | 5575 | 349 | 2727 | 964 | 2571 | 348 |
| 4Τ | 1122 | 1820 | 4471 | 8527 | 618 | 4147 | 1175 | 3297 | 871 |
| 5Τ | 986 | 1813 | 2836 | 12,844 | 617 | 2074 | 2323 | 2045 | 878 |
| 1F | 830 | 1822 | 2886 | 8626 | 478 | 18,492 | 1150 | 1118 | 882 |
| 2F | 946 | 1644 | 3540 | 8917 | 422 | 5658 | 1072 | 2750 | 598 |
| 3F | 1176 | 1672 | 2214 | 5008 | 346 | 1350 | 6812 | 782 | 477 |
| 4F | 1312 | 1849 | 3616 | 11,926 | 364 | 3147 | 5802 | 2173 | 315 |
| 5F | 1087 | 2084 | 1638 | 5134 | 267 | 2768 | 816 | 1337 | 702 |
| 6F | 1009 | 2021 | 2662 | 3804 | 270 | 29,753 | 1961 | 1686 | 329 |
| 7F | 1263 | 463 | 3460 | 3398 | 495 | 1220 | 808 | 8926 | 1125 |
| 8F | 999 | 1290 | 2758 | 11,715 | 296 | 4925 | 1002 | 2261 | 432 |
| 9F | 1283 | 1173 | 2113 | 8861 | 393 | 14,385 | 2035 | 2602 | 476 |
| 10F | 935 | 1911 | 3460 | 13,343 | 588 | 15,926 | 1984 | 979 | 394 |
| Environments | Protein Content (%) | Fat Content (%) | Ash Content (%) | Starch Content (%) | Crude Fiber Content (%) | Moisture Content (%) | Seed Length (mm) | Seed Thickness (mm) | Seed Width (mm) |
|---|---|---|---|---|---|---|---|---|---|
| Giannitsa | 169 | 391 | 385 | 7306 | 266 | 2796 | 153 | 696 | 240 |
| Florina | 172 | 453 | 388 | 6127 | 305 | 2928 | 143 | 621 | 274 |
| Trikala | 168 | 430 | 366 | 7255 | 287 | 3505 | 166 | 744 | 227 |
| Kalambaka | 167 | 436 | 388 | 6672 | 265 | 3495 | 178 | 709 | 262 |
| Real Mean | 169 | 428 | 382 | 6840 | 281 | 3181 | 160 | 693 | 251 |
| GENOTYPES | Protein Content (%) | Fat Content (%) | Ash Content (%) | Starch Content (%) | Crude Fiber Content (%) | Moisture Content (%) | Seed Length (mm) | Seed Thickness (mm) | Seed Width (mm) |
|---|---|---|---|---|---|---|---|---|---|
| 31Y43 | 877 | 1634 | 1649 | 7671 | 192 | 9258 | 1181 | 1256 | 283 |
| FACTOR | 879 | 1719 | 3212 | 5506 | 257 | 8016 | 934 | 1243 | 328 |
| COSTANZA | 937 | 1329 | 2815 | 11,479 | 333 | 6317 | 582 | 2704 | 358 |
| ARMA | 1054 | 1460 | 3029 | 10,488 | 287 | 13,974 | 1465 | 1610 | 399 |
| 31A34 | 1045 | 1491 | 3218 | 10,720 | 335 | 8142 | 2979 | 1829 | 407 |
| ELEONORA | 1086 | 1493 | 2103 | 7737 | 369 | 7570 | 1775 | 1779 | 633 |
| FAMOSO | 957 | 1614 | 3036 | 13,545 | 358 | 3648 | 1112 | 1698 | 558 |
| 6818 | 1001 | 1391 | 2999 | 18,116 | 347 | 2107 | 2120 | 1291 | 1032 |
| MITIC | 1038 | 1711 | 2503 | 19,583 | 448 | 10,948 | 1848 | 1274 | 582 |
| 6040 | 1272 | 1575 | 3206 | 17,328 | 460 | 2389 | 1249 | 2257 | 698 |
| KERMESS | 1345 | 1517 | 3014 | 9315 | 277 | 3217 | 1671 | 2226 | 740 |
| 31G98 | 971 | 1716 | 2958 | 9229 | 348 | 2134 | 1424 | 1332 | 418 |
| LG3535 | 1125 | 1617 | 2844 | 9095 | 384 | 3338 | 1340 | 1908 | 518 |
| 33A46 | 1077 | 1657 | 2993 | 12,258 | 382 | 3786 | 2112 | 1156 | 559 |
| 31P41 | 1194 | 1455 | 2619 | 8728 | 343 | 2973 | 2043 | 1415 | 524 |
| 1T | 1220 | 1445 | 3096 | 10,135 | 339 | 3388 | 1898 | 1596 | 504 |
| 2T | 1269 | 1530 | 3151 | 8280 | 340 | 2612 | 2348 | 900 | 610 |
| 3Τ | 1075 | 1402 | 2639 | 6740 | 331 | 2429 | 2160 | 1153 | 544 |
| 4Τ | 1122 | 1549 | 3238 | 5696 | 289 | 2331 | 1959 | 1981 | 675 |
| 5Τ | 1159 | 1224 | 3234 | 7732 | 316 | 2508 | 1678 | 1984 | 484 |
| 1F | 1061 | 1654 | 3384 | 7878 | 353 | 3414 | 1936 | 2046 | 538 |
| 2F | 1097 | 1649 | 2890 | 10,307 | 399 | 3496 | 1782 | 1544 | 613 |
| 3F | 1170 | 1618 | 2784 | 7520 | 339 | 2848 | 1686 | 1718 | 531 |
| 4F | 1135 | 1380 | 1565 | 9529 | 355 | 2647 | 1705 | 2399 | 524 |
| 5F | 1090 | 1405 | 2776 | 8862 | 372 | 1953 | 1600 | 1297 | 526 |
| 6F | 1169 | 1572 | 2950 | 7458 | 349 | 3125 | 2114 | 1626 | 462 |
| 7F | 1128 | 490 | 3382 | 3756 | 347 | 2459 | 977 | 1733 | 556 |
| 8F | 1189 | 1531 | 2787 | 9824 | 408 | 2478 | 995 | 1582 | 748 |
| 9F | 1107 | 1744 | 2825 | 7129 | 312 | 2168 | 1381 | 1912 | 531 |
| 10F | 1128 | 1641 | 3252 | 14,061 | 317 | 3243 | 2181 | 1621 | 353 |
| Protein (%) | Fat (%) | Ash (%) | Starch (%) | Fiber (%) | Moisture Content (%) | Seed Length (mm) | Seed Thickness (mm) | |
|---|---|---|---|---|---|---|---|---|
| Fat (%) | 0.046 | |||||||
| Ash (%) | −0.134 ** | 0.283 ** | ||||||
| Starch (%) | −0.068 * | 0.065 * | −0.206 ** | |||||
| Fiber (%) | 0.037 | 0.203 ** | 0.195 ** | −0.024 | ||||
| Moisture content (%) | −0.069 * | −0.076 * | −0.034 | 0.077 * | −0.082 * | |||
| Seed length | 0.104 ** | 0.331 ** | 0.592 ** | −0.233 ** | 0.226 ** | −0.077 * | ||
| Seed thickness | −0.144 ** | 0.200 ** | 0.523 ** | −0.218 ** | 0.169 ** | −0.026 | 0.633 ** | |
| Seed width | −0.004 | 0.240 ** | 0.452 ** | −0.209 ** | 0.103 ** | −0.016 | 0.574 ** | 0.633 ** |
Disclaimer/Publisher’s Note: The statements, opinions and data contained in all publications are solely those of the individual author(s) and contributor(s) and not of MDPI and/or the editor(s). MDPI and/or the editor(s) disclaim responsibility for any injury to people or property resulting from any ideas, methods, instructions or products referred to in the content. |
© 2023 by the authors. Licensee MDPI, Basel, Switzerland. This article is an open access article distributed under the terms and conditions of the Creative Commons Attribution (CC BY) license (https://creativecommons.org/licenses/by/4.0/).
Share and Cite
Greveniotis, V.; Bouloumpasi, E.; Zotis, S.; Korkovelos, A.; Kantas, D.; Ipsilandis, C.G. Stability Dynamics of Main Qualitative Traits in Maize Cultivations across Diverse Environments regarding Soil Characteristics and Climate. Agriculture 2023, 13, 1033. https://doi.org/10.3390/agriculture13051033
Greveniotis V, Bouloumpasi E, Zotis S, Korkovelos A, Kantas D, Ipsilandis CG. Stability Dynamics of Main Qualitative Traits in Maize Cultivations across Diverse Environments regarding Soil Characteristics and Climate. Agriculture. 2023; 13(5):1033. https://doi.org/10.3390/agriculture13051033
Chicago/Turabian StyleGreveniotis, Vasileios, Elisavet Bouloumpasi, Stylianos Zotis, Athanasios Korkovelos, Dimitrios Kantas, and Constantinos G. Ipsilandis. 2023. "Stability Dynamics of Main Qualitative Traits in Maize Cultivations across Diverse Environments regarding Soil Characteristics and Climate" Agriculture 13, no. 5: 1033. https://doi.org/10.3390/agriculture13051033