1. Introduction and Background
Agriculture is one of the most important sectors of the economy and plays a crucial role in providing food to the world’s population. With the growing demand for food and shrinking fertile land, precision agriculture has become a necessity to improve the yield and quality of crops. One of the key factors that impacts agricultural productivity is weather conditions. Remote weather monitoring systems are increasingly being used to monitor environmental conditions and provide real-time data to farmers to make informed decisions. In this context, the development of a solar tracking system for remote weather monitoring in agriculture can have a significant impact, improving agricultural productivity while also reducing the dependence on traditional power sources.
In the current age of technology, energy is a crucial topic of discussion, and renewable energy sources such as lunar, thermal, vibration, and wind energies are gaining increasing interest. Since the cost of electricity is increasing every year, renewable energy is considered the best source of energy. However, renewable energy sources are difficult to predict, making it challenging to optimize their production and consumption [
1]. A cost-effective energy solution is required to balance supply and demand. Energy storage is becoming increasingly important, and the market for solar energy harvesting is growing rapidly. Ambient energy sources, e.g., solar energy, play an important role in monitoring human activities in the last decade and cannot be underestimated. Over the years, the introduction of energy management schemes that seek to prolong the lifetime of the sensor node and the overall network have been proposed, but the amount of energy required by the sensors to be operational all the time remains a challenge [
2,
3].
Solar energy has gained tremendous attention in recent years due to various reasons such as the fluctuating price of crude oil, public awareness of environmental issues, supporting policies and subsidies enacted by local governments to boost renewable energy sectors, the price reduction of photovoltaic (PV) panels, etc. Many large-scale solar farms have been commissioned in the US, Europe, and China, as the global PV price has been dropping rapidly in recent years, which is in agreement with Swanson’s law [
4]. However, PV-generated electricity is not competitive enough compared to fossil fuels (oil, gas, and coal), especially in urban areas. Hence, more extensive research and development on PV cell material science is required to overcome the conversion efficiency hurdle and reduce manufacturing costs. Meanwhile, several approaches other than exploring new materials for PV cells have been proposed. For instance, a concentrated photovoltaic (CPV) system was designed to concentrate large amounts of sunlight into PV cells [
4,
5]. Similarly, a maximum power point tracker can draw maximum power by tracking and operating on the maximum power point of the PV arrays [
6], and solar tracking can enable a maximized power captured from the sun by following the sun path [
7]. These methods can increase the energy production of PV to various degrees of success. Above all, solar tracking poses a great advantage to enhance the PV system efficiency as compared to a static solar system [
8]. A dual-axis solar tracker (DAS) is a type of solar tracker with two rotational axes, which always enable it to align the PV panels and point directly towards the solar disk [
9,
10]. Solar irradiance (W/m
) is a measure of the amount of sunlight that falls on a surface. It is the most fundamental factor in determining the performance of a PV panel to be underestimated. Over the years, the introduction of energy management schemes has led to many efficient approaches [
11].
A single-axis system may require more space to accommodate the solar panels and collects energy along one axis, which reduces its efficiency. A dual-axis solar tracking system is designed to follow the sun and optimize the amount of sunlight collected by PV cells. The system follows the sun’s movement in both the horizontal and vertical planes, from east to west and north to south, respectively. It is widely used in the agricultural field to optimize the amount of collected solar energy, thereby increasing the efficiency of the system. Wireless sensor networks (WSNs) are making a huge impact among emerging technologies [
12]. WSNs have consistently ranked highly in this field of research for over a decade [
13]. Since the system is WSN-based, the term quality of service (QoS) is defined as the network’s assurance to fulfill the desired services for an individual, including delay and other parameters. To meet the QoS requirements, the optimal path between the source and destination needs to be located, and other components for QoS are resources, request, response, and reservation [
14]. The authors [
15] conducted a study that explored the primary parameters of QoS which include delay, loss, jitter, and latency. However, extending QoS to WSNs faces several challenges due to features such as mobility, radio channel frequency, and battery issues [
9]. Numerous research institutes have worked in this field and developed research projects that have made significant advancements in all aspects, including hardware, software, design, and standard applications [
16]. WSNs are special-purpose equipment that gather information from the physical world and transmit it to users and applications, such as environmental monitoring, military operations, agriculture, and energy efficiency [
17].
As energy is crucial to power various operations and applications, relying solely on electricity is not always a cost-effective solution. Renewable energy production, on the other hand, provides a better alternative for such requirements [
18]. One type of energy collection system is the solar harvesting system, which converts heat into energy [
19]. Intensive research has led to the optimization of QoS for solar systems. The main aim is to explore new developments and interests in this field [
20]. Energy collection systems are used to gather strength from background resources. The energy harvesting system produces power that can be utilized for various applications [
21]. The equation for converting heat into electrical energy in a solar harvesting system [
22] is
where
P is the electrical power output,
is the conversion efficiency,
A is the solar panel area,
G is the solar irradiance, and
is the fill factor of the solar cells. The formula for calculating Quality of Service (
) in a Wireless Sensor Network (WSN) [
17] is
where
R is the reliability,
C is the coverage, and
is the weight given to each parameter. The formula for calculating delay in a WSN [
13] is
where
is the time when the packet is received,
is the time when the packet is sent,
is the processing time,
is the queuing delay,
is the transmission delay, and
is the propagation delay. The equation for estimating solar irradiance on a tilted surface [
18] is
where
is the beam irradiance,
is the diffuse irradiance,
is the reflected irradiance, and
is the angle of incidence of the sun on the tilted surface.
Solar-based energy tracking systems are proving to be fruitful for various industries, providing more output than other types of systems. It is expected that solar tracking systems will be the best systems for energy sources in the future, with their output efficiency depending on the tracking method used and weather conditions [
23]. Energy harvesting technologies are the best option to fulfill the needs of different fields [
24]. Energy harvesting is defined as a technique that is used to capture, harvest, and gather unused resources of natural energy such as energy produced from the sun, wind, ocean, etc. These natural resources are big energy sources and can provide large-scale harvested energy [
25]. The energy harvesting system consists of four main parts, namely, harvester, energy collector, power manager or conditioning circuit, and energy storage unit [
26]. As a result, several energy harvesting, energy optimization, and distribution approaches have been designed recently.
In [
27], the authors developed a particle swarm optimization (PSO), which is modeled after the social behavior of animals such as fish schooling and birds flocking. This approach employs a swarm of artificial agents or particles, and each agent’s motion is influenced by three factors. It involves separation, where agents maintain a safe distance; alignment, where each agent moves toward the average behavior of the swarm; and cohesion, where each agent moves toward the average behavior of its neighbors. Several unused ambient energy resources are available that can be utilized for energy harvesting. These energy resources are enough to meet our energy needs and there is no need for extra resources such as burning fossil fuels to rotate turbines to produce energy [
28]. Environmental resources are renewable and can exist for a longer period. Different experiments have been performed to find energy resources that could be produced from natural resources [
29].
The study [
30] increased the overall efficiency of the energy harvesting system in WSN using maximum power point tracking (MPPT) techniques coupled with an artificial intelligence (AI)-based algorithm. Simulations for the system were run using Matlab 2021b. After a successful simulation, a testbed was built to verify the results. An AI neural network algorithm was deployed to obtain solutions to problems that are hard to solve using common methods such as pattern matching, computer vision, design identification, speech credit, classification, and control system. Neural network models are similar to learning algorithms, but may vary in terms of rules, parameters, weights, and network structures [
31].
The study [
32] designed an energy management scheme using a trio energy management scheme for harvesting, transferring, and conserving energy. This maintained the network lifetime to make it more operation and efficient. However, the cost of experimentation, testbed installation, and simulation tools were expensive. Similarly, Ref. [
33] presented an MPPT-based energy harvesting scheme using a perturbation-based micro-solar approach. Results indicated increased efficiency with lower overhead.
The authors presented an ambient-energy-based solution for WSN networks in [
34]. The authors employed a pulse width modulation scheme and MPPT approach to increase the efficiency of the system by 87%. The study [
35] created a method for selecting optimal parameters of the PSO by considering the topology and parameters of the DC–DC converter and other configuration settings of solar panels. The parameters of a buck converter connected to a battery were estimated using the newly proposed approach. The authors used weaseled, distributed cluster head re-selection and polynomial time-scheduling algorithms for that purpose. The outcomes indicated that improved performance can be obtained with reduced battery depletion. To address these challenges, we present the proposed model outlined in the following section.
Table 1 provides an overview of existing works in this field.
In this paper, we have provided a solar energy harvesting scheme that, when fully implemented, reduces the issues of limited energy. The main source of solar power is the sun, which can be used to obtain solar energy. The sun’s rays strike the earth, delivering 174,000 terawatts of energy, which can be used for our needs. This alone makes the solar panel the best choice for a renewable energy source—according to the United Nations Development Program in 2000, if we can harness the full power of the sun’s rays coming to Earth, we can create 1575 to 49,837 Joules of energy, which is far greater than the world’s needs. However, the problem lies in the solar panel, i.e., that the technology behind the solar panel is not efficient enough to fully harness this abundant energy. Thus, to make the soar panel more efficient, we created a movable solar panel that can adjust its position regarding the sun’s current position to obtain the optimal sunlight. In addition to energy maximization, the proposed system can also give parameters such as humidity, temperature, and air quality from the remote agricultural fields onto the mobile app, which can greatly facilitate the farmers to make informed decisions. The main contributions of this research study are as follows:
To improve the efficiency of solar panels, the paper proposes a solar tracking system with dual axes that can move to adjust its position. The solar tracking system aims to maximize energy generation by optimizing the orientation of the solar panels;
The proposed system not only maximizes energy but also provides additional parameters such as humidity, temperature, and air quality from remote agricultural fields;
The collected parameters can be accessed through a mobile app, making it easier fo farmers to monitor and manage their agricultural activities. The implementation of the proposed system shows enhanced energy generation and provides valuable data for agricultural purposes.
The article is structured as follows.
Section 2 presents the proposed approach. Results are discussed in
Section 3. At the end,
Section 4 provides the conclusion.
3. Results
To evaluate the performance of our model and algorithm, we conducted various experiments. The results of these experiments are presented in the following sections.
3.1. System Efficiency
We must compare the power provided by the sun to the electricity generated in order to determine the efficiency of the panel. A panel would be 100% efficient if it could convert all of the light that struck it into energy. Unfortunately, achieving such efficiency is impossible. We used the following equation to analyze the efficiency of the proposed system (the length and width of the panel are given in meters (m)):
3.2. Daily Analysis
Different experiments were carried out in the spring season to evaluate the performance of the proposed approach.
Table 5 shows the average values of different experiments. These values then can be used by the farmers for making further decisions. These real-time data on weather parameters such as temperature, humidity, etc. can help farmers make informed decisions on irrigation, pest control, and other crop management practices.
Table 5 shows the average values across multiple test days, rather than being tied to a specific date. The metrics such as temperature, humidity, and air quality were averaged across several experiments. Even without the specific dates, these data can still provide some useful insights:
The temperature range and fluctuations give an indication of typical conditions that may be experienced. This could help with system design considerations;
The humidity and air quality averages establish baseline levels for the location. This is valuable reference information;
The diurnal temperature profile shows the temperature variation over a 24 h cycle. This can inform solar energy generation modeling;
The values then can be used by the farmers for making further decisions. These real-time data on weather parameters such as temperature, humidity, etc. can help farmers make informed decisions on irrigation, pest control, and other crop management practices.
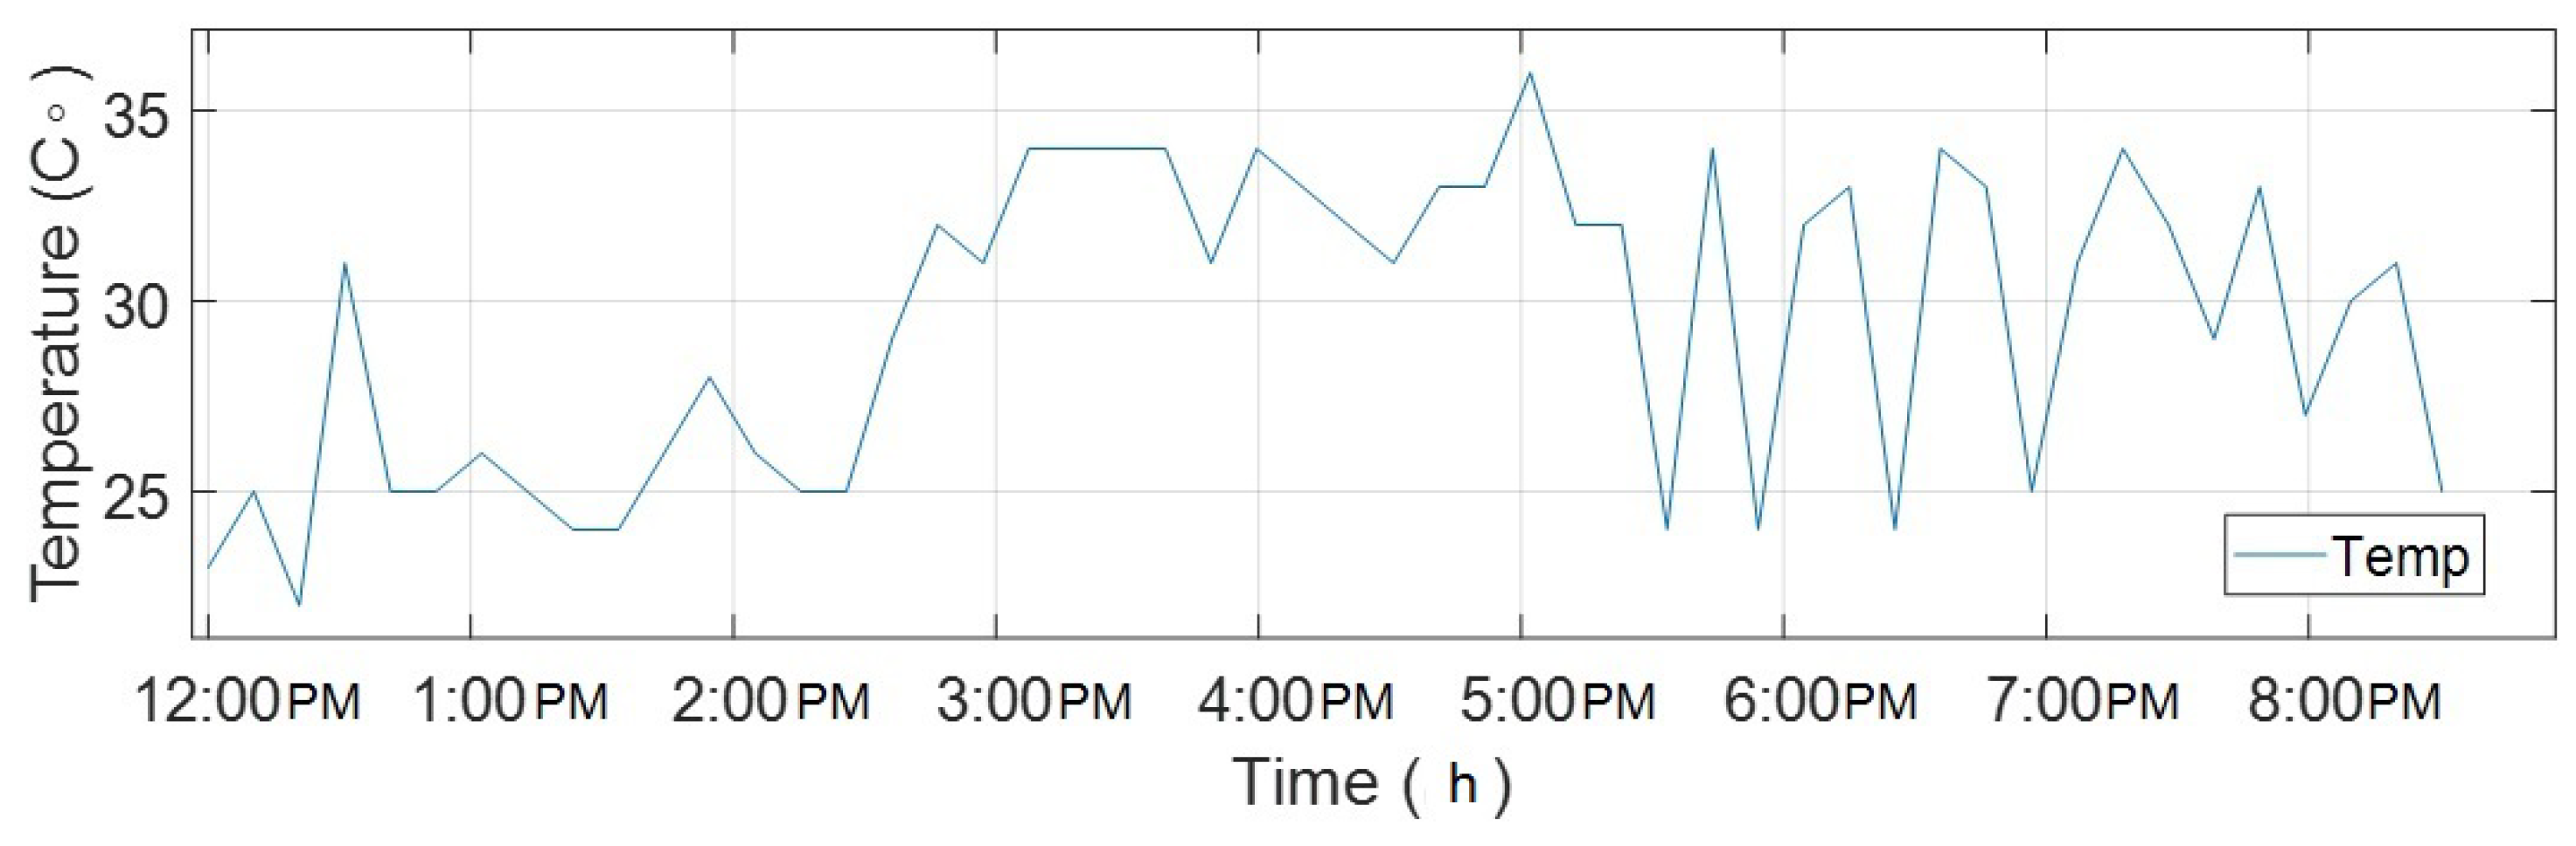
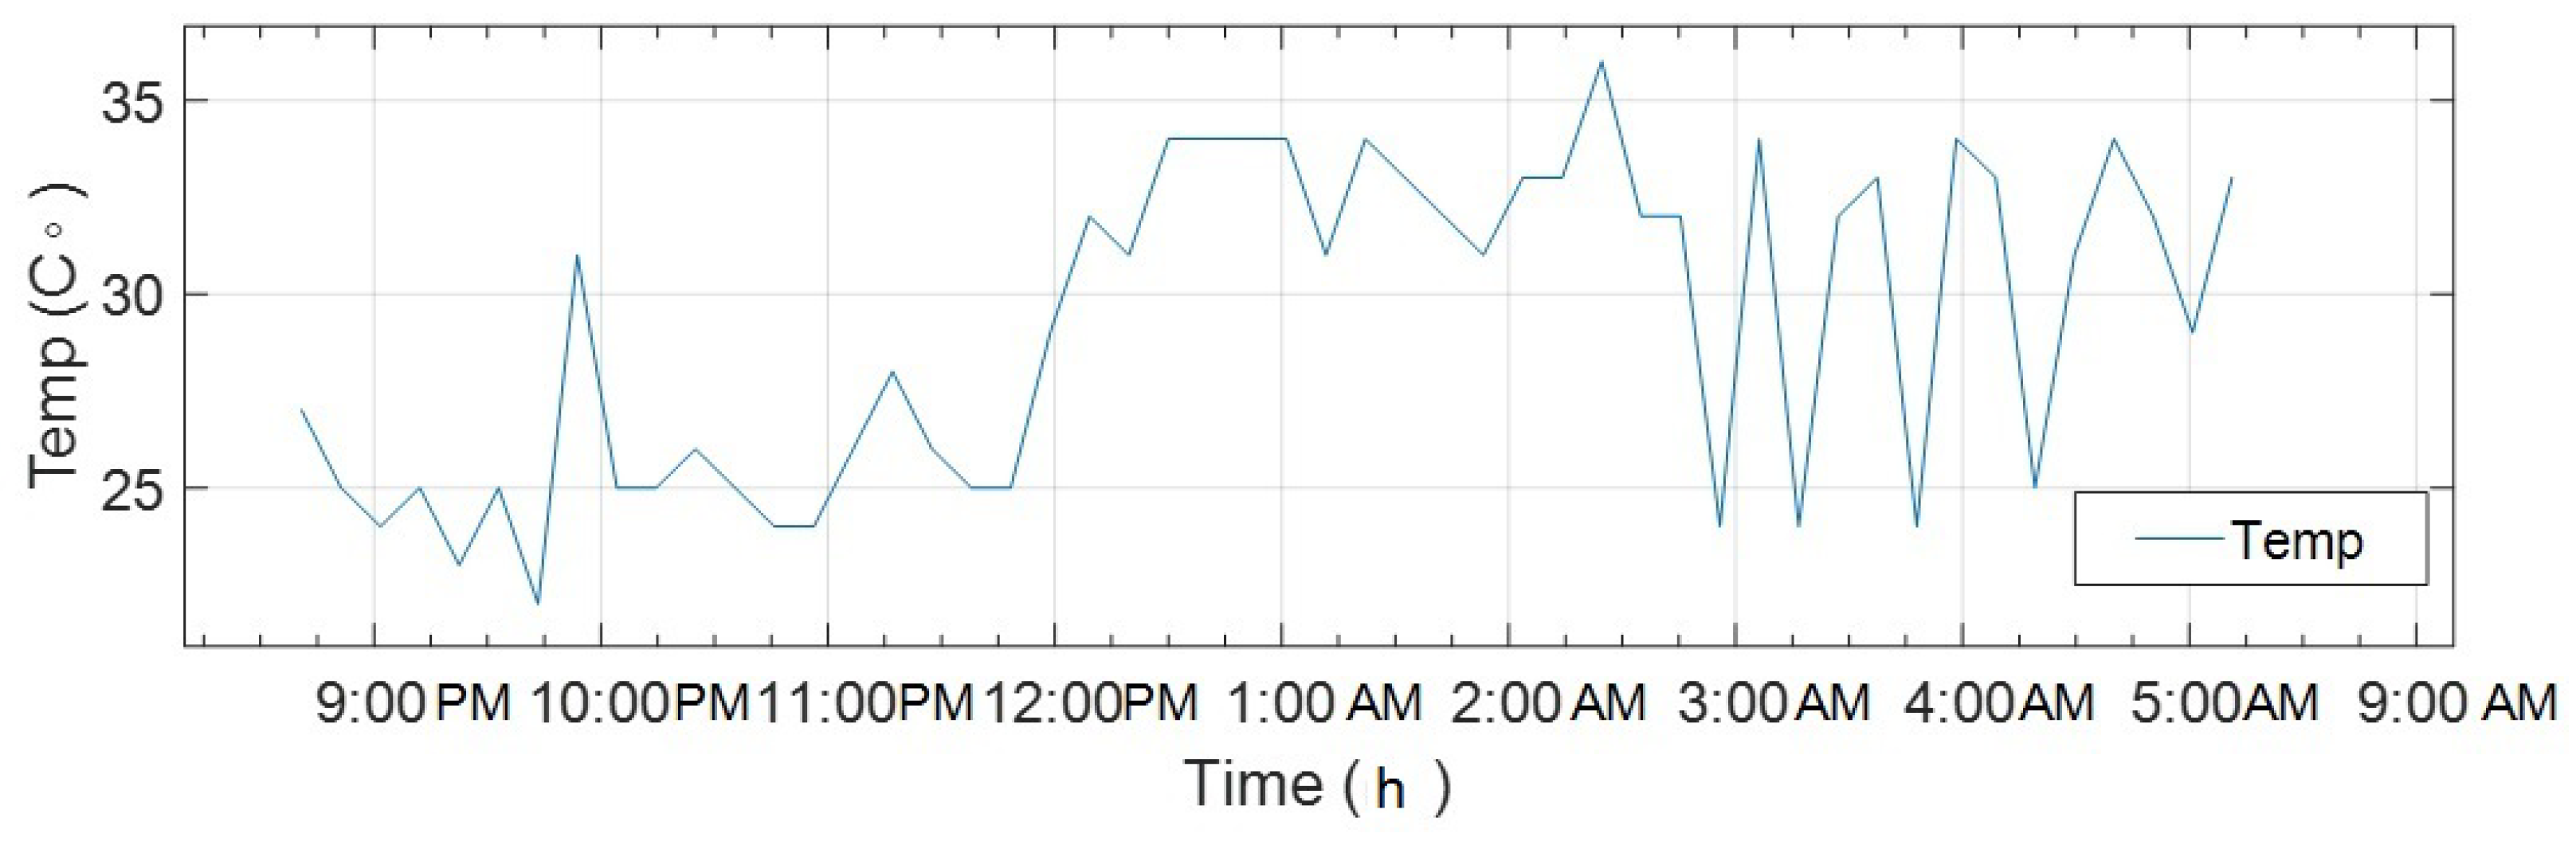
Figure 3 provides a graph representing temperature values obtained from a temperature sensor installed on the system. The temperature data were recorded at regular intervals, typically hourly. These recorded values can be utilized by farmers for various purposes. Upon observing the graph, it becomes apparent that the temperature fluctuates within specific ranges throughout the day. By glancing at the graph, one can easily identify the highest and lowest temperature points.
On day 1, as shown in
Figure 4, the humidity demonstrated a rising trend as the day progressed. This indicates that the humidity levels increase gradually over time. Simultaneously, the carbon dioxide levels showed a decreasing trend, suggesting a decline in the concentration of carbon dioxide in the environment. Thus, the graph illustrates the trend of humidity increasing as the day progresses, while the levels of carbon dioxide decrease. The temperature readings generally remained within a favorable range. However, there was a spike in temperature at some point, which can be attributed to irregularities in the sensors used for measurement.
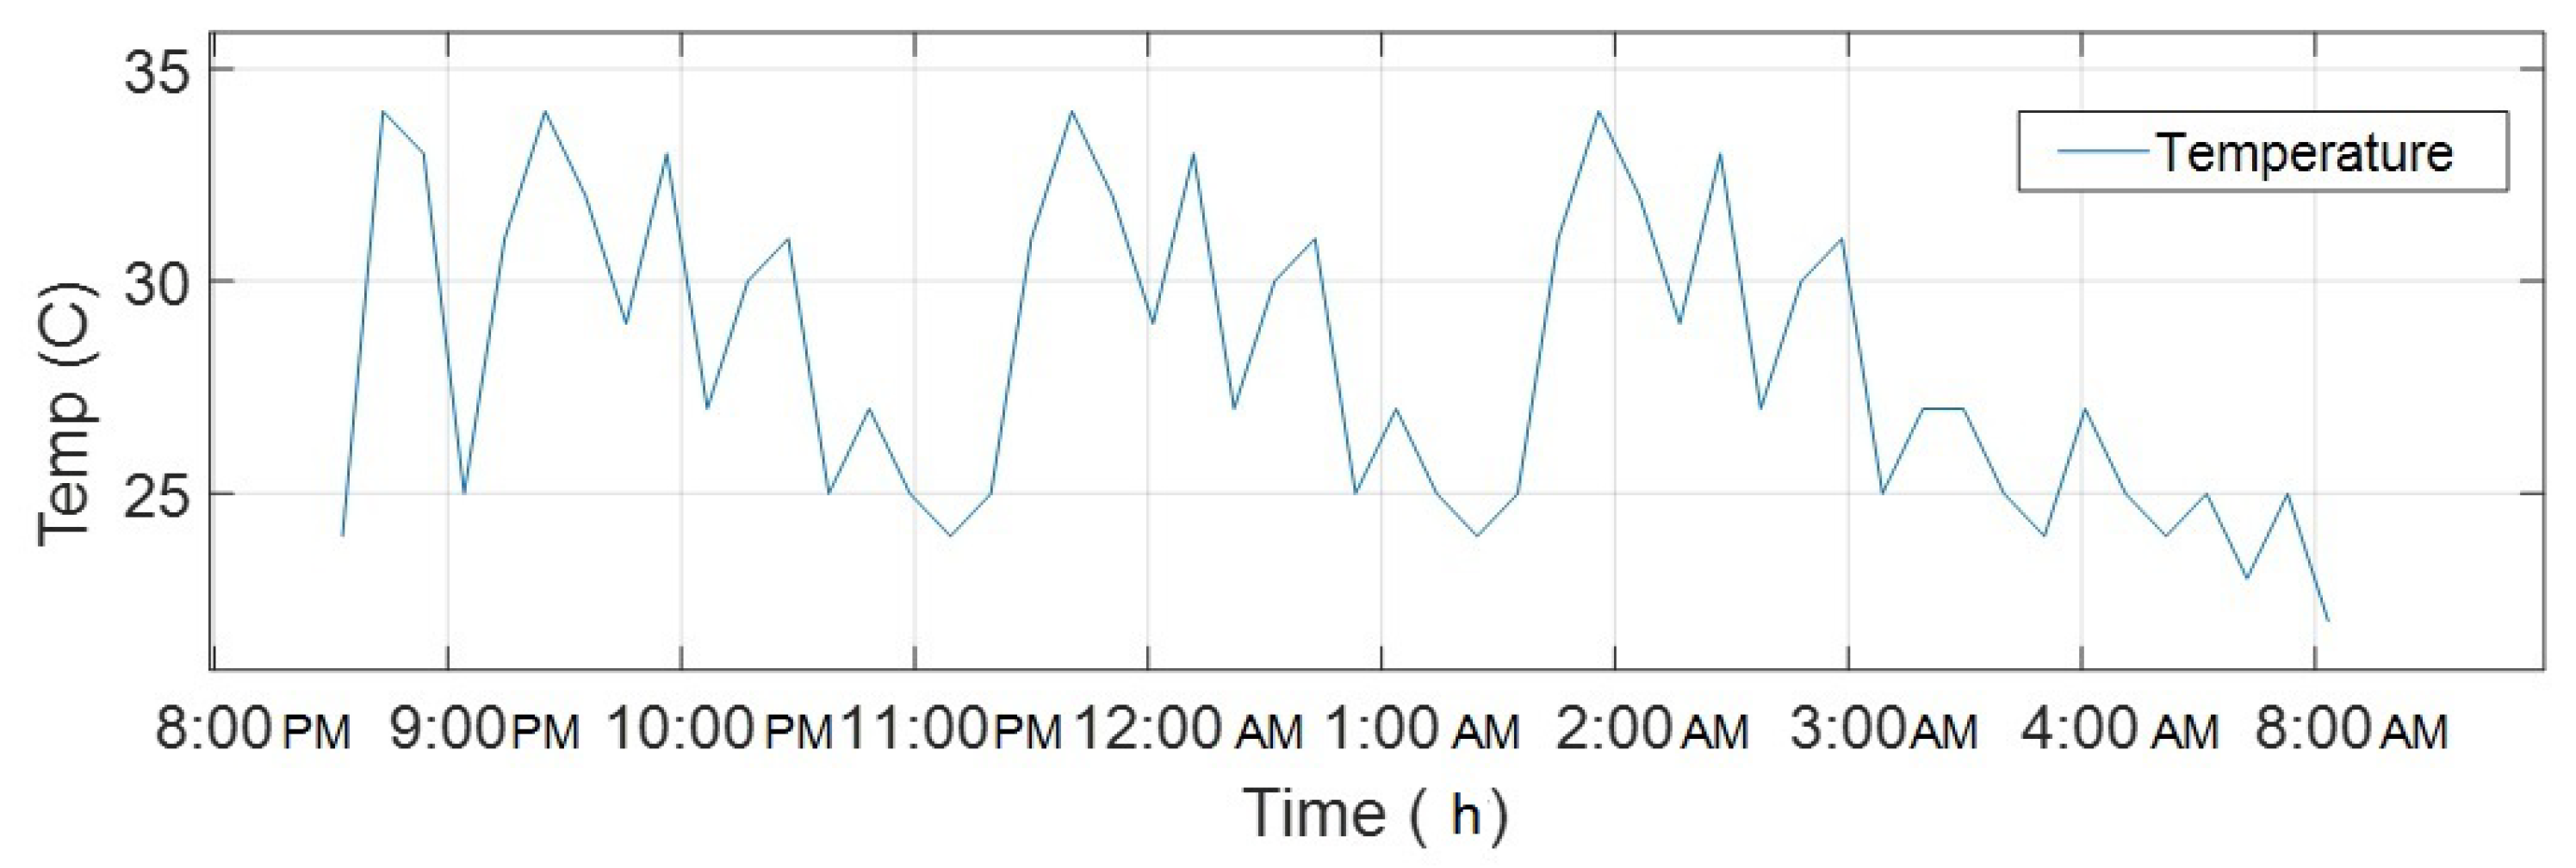
In the results for experiment 2, shown in
Figure 5, a similar trend is observed, with the graphs displaying small variations in values. The temperature readings ranged between 25 and 35 degrees, indicating a relatively stable temperature range. The temperature graph shows that the temperature remained within a favorable range of 25 to 30 degrees Celsius throughout the day. This consistent temperature level suggests stable conditions. However, it is important to note that there was a spike in temperature at some point, which can be attributed to irregularities or inaccuracies in the sensors used to measure temperature. Overall, the observed trends on day 1 indicate increasing humidity, decreasing carbon dioxide levels, and a stable temperature within a desirable range. The irregular temperature spike should be considered with caution due to potential sensor inaccuracies.
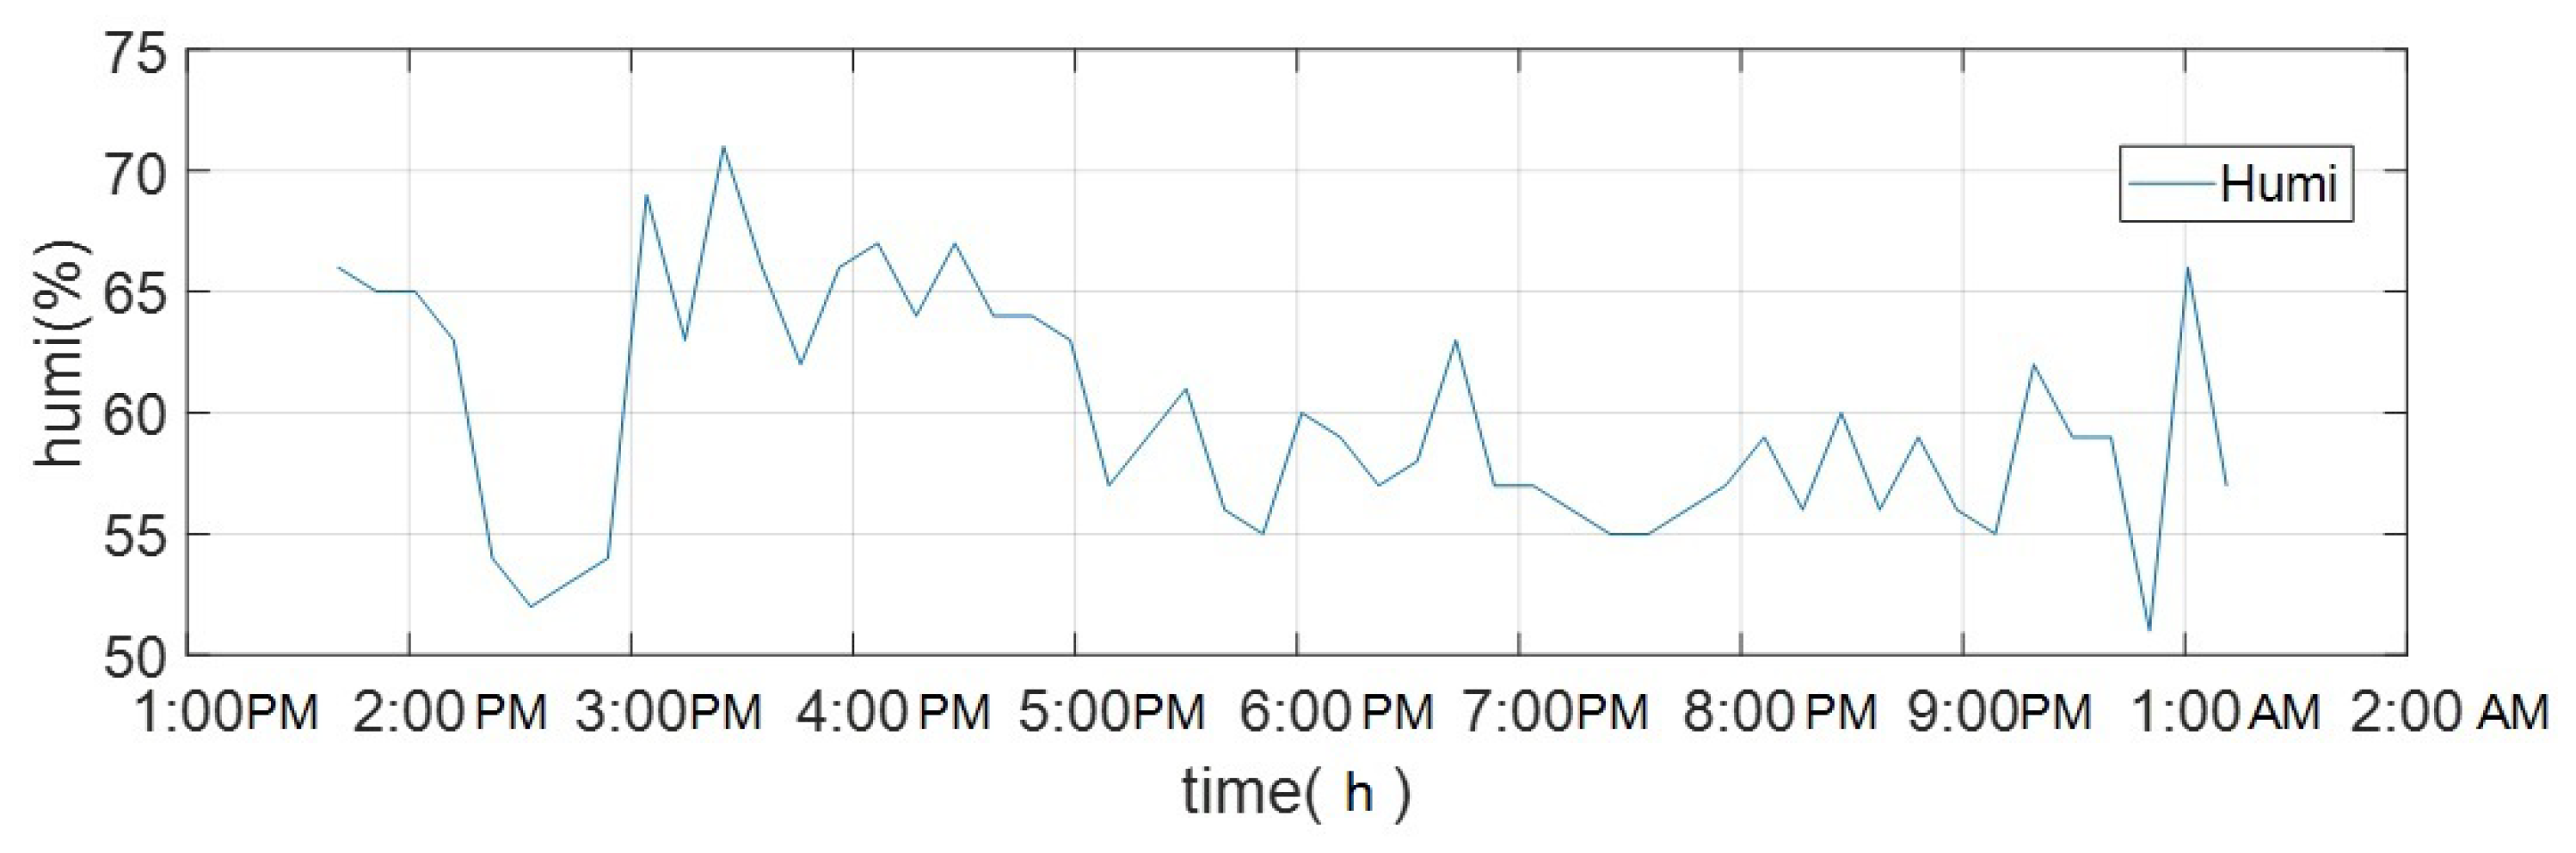
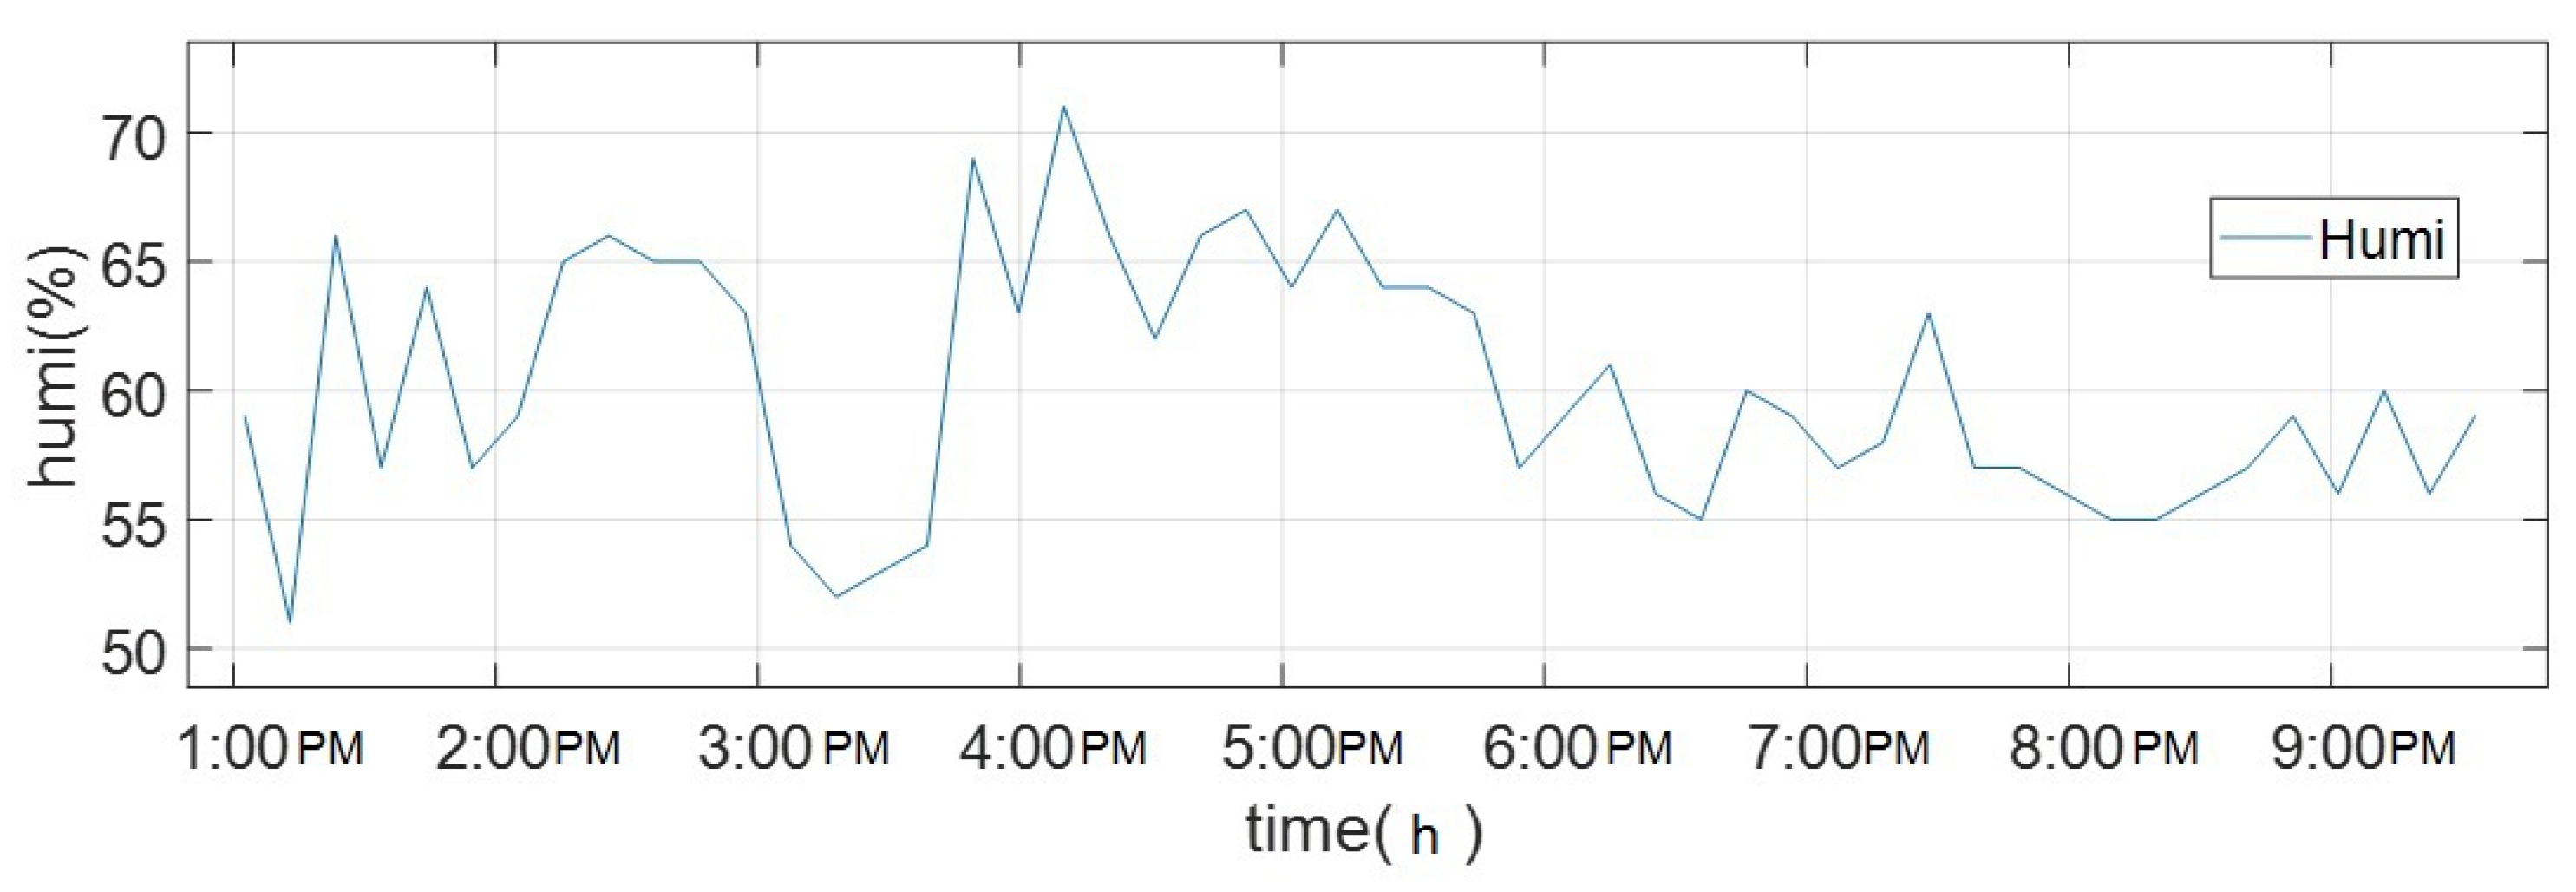
Figure 6 shows that the humidity values fluctuated within a narrow range of 55 to 57 points. This suggests a consistent level of humidity throughout the experiment. The close proximity of the temperature and humidity values implies a potential correlation between these two variables. The similarity in trends between experiment 1 and experiment 2 may indicate that the factors influencing temperature and humidity remain relatively constant or have similar patterns during both experiments. It is worth noting that further analysis and data collection would be necessary to determine the significance and implications of these observations accurately.
On day 3, as shown in
Figure 7, a similar trend to the previous days was observed. The temperature graph indicates that the temperature ranged between 23 and 26 degrees Celsius, with small variations within this range. Similarly, the humidity values fluctuated between 51 and 65 points, suggesting relatively stable humidity levels. The consistency in the trends of temperature and humidity between day 1, day 2, and day 3 may indicate a continued pattern or stable environmental conditions during this period.
On day 3 as shown in
Figure 8, the humidity demonstrated a rising trend as the day progressed. This indicates that the humidity levels increase gradually over time. Simultaneously, the carbon dioxide levels showed a decreasing trend, suggesting a decline in the concentration of carbon dioxide in the environment.
In experiment 4, as shown in
Figure 9, a distinct trend was observed, where the temperature increased as the day progressed, indicating hotter days. The temperature readings staredt at 20 degrees and gradually rose to 35 degrees. This trend aligns with scientific understanding, as temperatures tend to increase during the daytime due to factors such as solar radiation and atmospheric conditions. Additionally, it is noted that the nights were colder, suggesting a drop in temperature during nighttime hours. This is a common occurrence, as heat is radiated back into the atmosphere during the night, resulting in cooler temperatures. Furthermore, the maximum temperature recorded during the day reaches a high, indicating a particularly hot day during the course of the experiment.
The provided graphs, as shown in
Figure 10, represent humidity values and air quality values obtained from a temperature sensor placed in a system. The humidity values were recorded per minute, while the air quality values specifically measured carbon dioxide (CO
) levels and were also recorded per minute. These values were collected at regular intervals and can be utilized by farmers for various purposes. In the humidity graph, it can be observed that there were fluctuations in humidity levels. Notably, when water was sprinkled or introduced into the system, the humidity level varied accordingly. This suggests that the addition of water affects the humidity levels, which can be valuable information for farmers in determining irrigation or moisture management strategies.
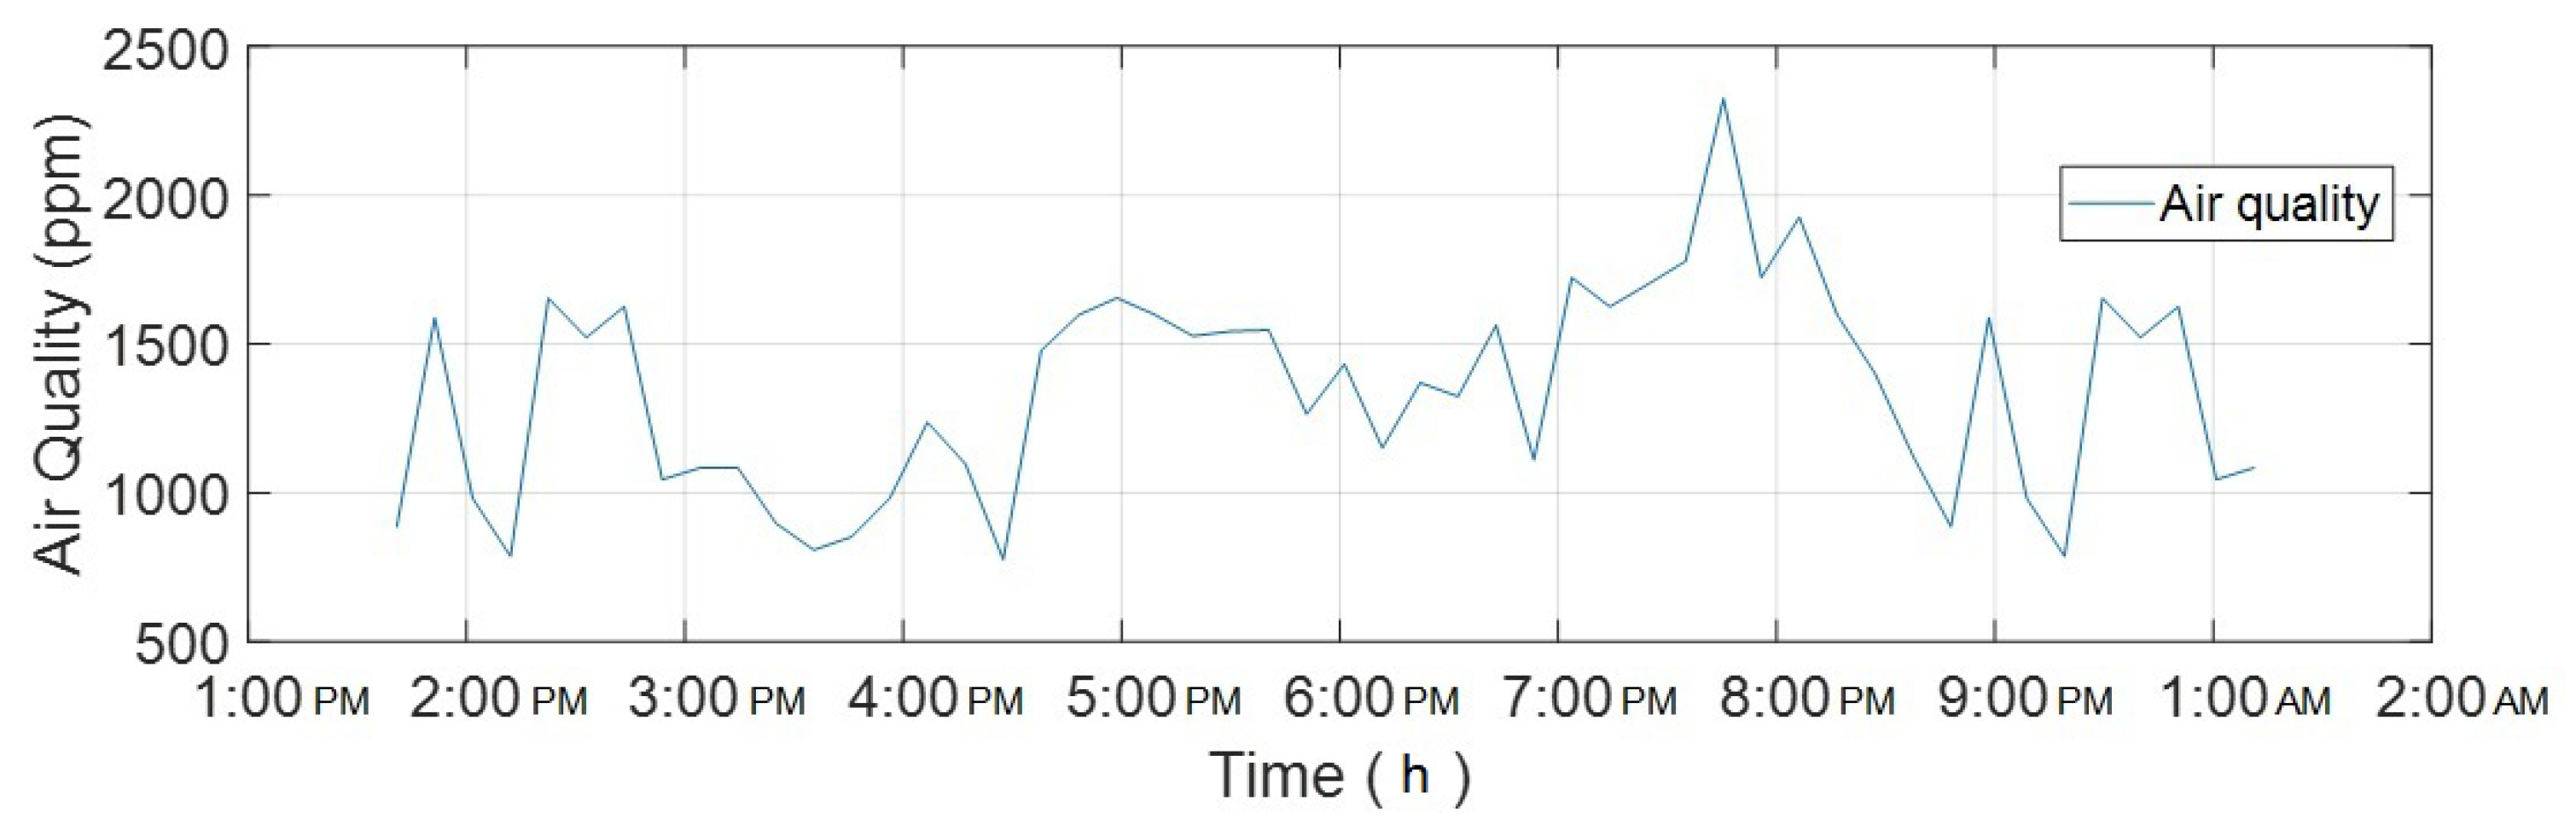
In the air quality graph, the values represent the concentration of carbon dioxide in the air. It is evident that the CO levels varied over time, and there were distinct increases in value when plants released carbon dioxide. This information can be beneficial for farmers to monitor the health and growth of plants and potentially adjust ventilation or other environmental factors to optimize plant growth. The availability of real-time humidity and air quality data can assist farmers in making informed decisions regarding irrigation, moisture control, and environmental management practices, ultimately improving agricultural productivity and plant health.
In the air quality graph, as shown in
Figure 11, the values represent the concentration of carbon dioxide in the air. It is evident that the CO
levels varied over time, and there were distinct increases in value when plants released carbon dioxide. This information can be beneficial for farmers to monitor the health and growth of plants and potentially adjust ventilation or other environmental factors to optimize plant growth.
3.3. Annual Analysis
Based on the results obtained from various systems observed over the course of a year, it has been found that the dual-axis system exhibited the highest output efficiency, specifically measuring 98.7%. In comparison, the horizontal-axis system achieved an output efficiency of 98.2%, while the vertical-axis system achieved an output efficiency of 98.3%, both with a sloped angle. These output efficiency values indicate the effectiveness of each system in converting irradiance (solar energy) into usable output. The higher the output efficiency, the more effectively the system is able to harness solar energy and convert it into usable forms such as electricity or heat. To further understand the context and implications of these findings, the irradiance values are provided. Irradiance refers to the power per unit area received from the sun, typically measured in Watts per square meter.
Figure 12 presents the likely variations in irradiance throughout the year, which can help explain the differences in output efficiency observed across the different systems. By analyzing the irradiance values and correlating them with the system’s output efficiency, it becomes possible to gain insights into how solar energy availability and intensity impact the performance of each system.
In
Figure 12, the graph displays the values of irradiance generated from a simulation over a one-year time period. The graph likely shows the variations in irradiance levels throughout different seasons or months of the year. The purpose of this comparison is to evaluate the performance of a simple harvesting system that lacks a tracking feature. It is observed that the simple system, without tracking, is unable to capture the full irradiance available. As a result, the system experiences lower output power compared to the simulated values of irradiance. The comparison of the difference in performance of different components is provided in
Table 6.
The comparison between the simulated irradiance values and the performance of the simple system highlights the importance of tracking features in maximizing the capture of solar energy. Tracking systems are designed to align solar panels or collectors with the direction of the sun, optimizing the absorption of sunlight and increasing output efficiency. The lower output power of the simple system underscores the potential benefits of implementing more advanced tracking systems, such as dual-axis or other sophisticated tracking mechanisms. These systems can adjust their position to follow the sun’s path, ensuring optimal exposure to irradiance and maximizing the energy harvested from solar sources. This comparison serves as evidence supporting the use of tracking systems for enhancing the performance and output power of solar harvesting systems. In the provided figure, it is documented that the dual-axis tracking system has demonstrated the capability to capture the highest amount of sunlight or sun rays throughout the year. The graph likely depicts the irradiance values or solar energy received by the dual-axis tracking system over different time periods.
Furthermore, a comparison was made between the horizontal system and the dual-axis tracking system, as shown in
Figure 13. It is observed that the horizontal system, which is a fixed system without any tracking capability, exhibits a consistent and linear line over the entire year on the graph. This implies that the horizontal system does not adjust its position to track the movement of the sun. In contrast, the dual-axis tracking system, which has the ability to adjust its position both horizontally and vertically to track the sun’s movement, shows more variability in irradiance values over the year. This indicates that the dual-axis tracking system is able to align itself optimally with the sun’s position, maximizing the capture of sunlight and resulting in higher irradiance levels compared to the fixed horizontal system.
The comparison between the two systems further emphasizes the advantages of incorporating tracking capabilities in solar harvesting systems. By tracking the sun’s movement throughout the day and year, the dual-axis system can consistently optimize its orientation and capture a higher amount of sunlight, leading to increased irradiance and potentially higher energy output. These findings highlight the importance of considering tracking systems, such as the dual-axis system, for maximizing solar energy utilization and enhancing the performance of solar harvesting systems.
3.4. Performance of Artificial Neural Network
The best validation performance is described with the help of
Figure 14, in which the system’s performance is explained after running an ANN simulation. Results obtained after simulation showed that performance remains stable at the same value but, without using this, it may decrease over time. In
Figure 14, the histogram shows that there were many faults but, after using the ANN technique, quality increased.
A neural network was proposed to optimize the system’s efficiency. It contained different layers—3, 10, and 15 layers and neurons were used to obtain an optimal architecture. The data were split into train, test, and validation sets. The training process proceeded, provided that the system continuously enhanced the authentication established. The test pair offered an autonomous way of measuring network precision completely.
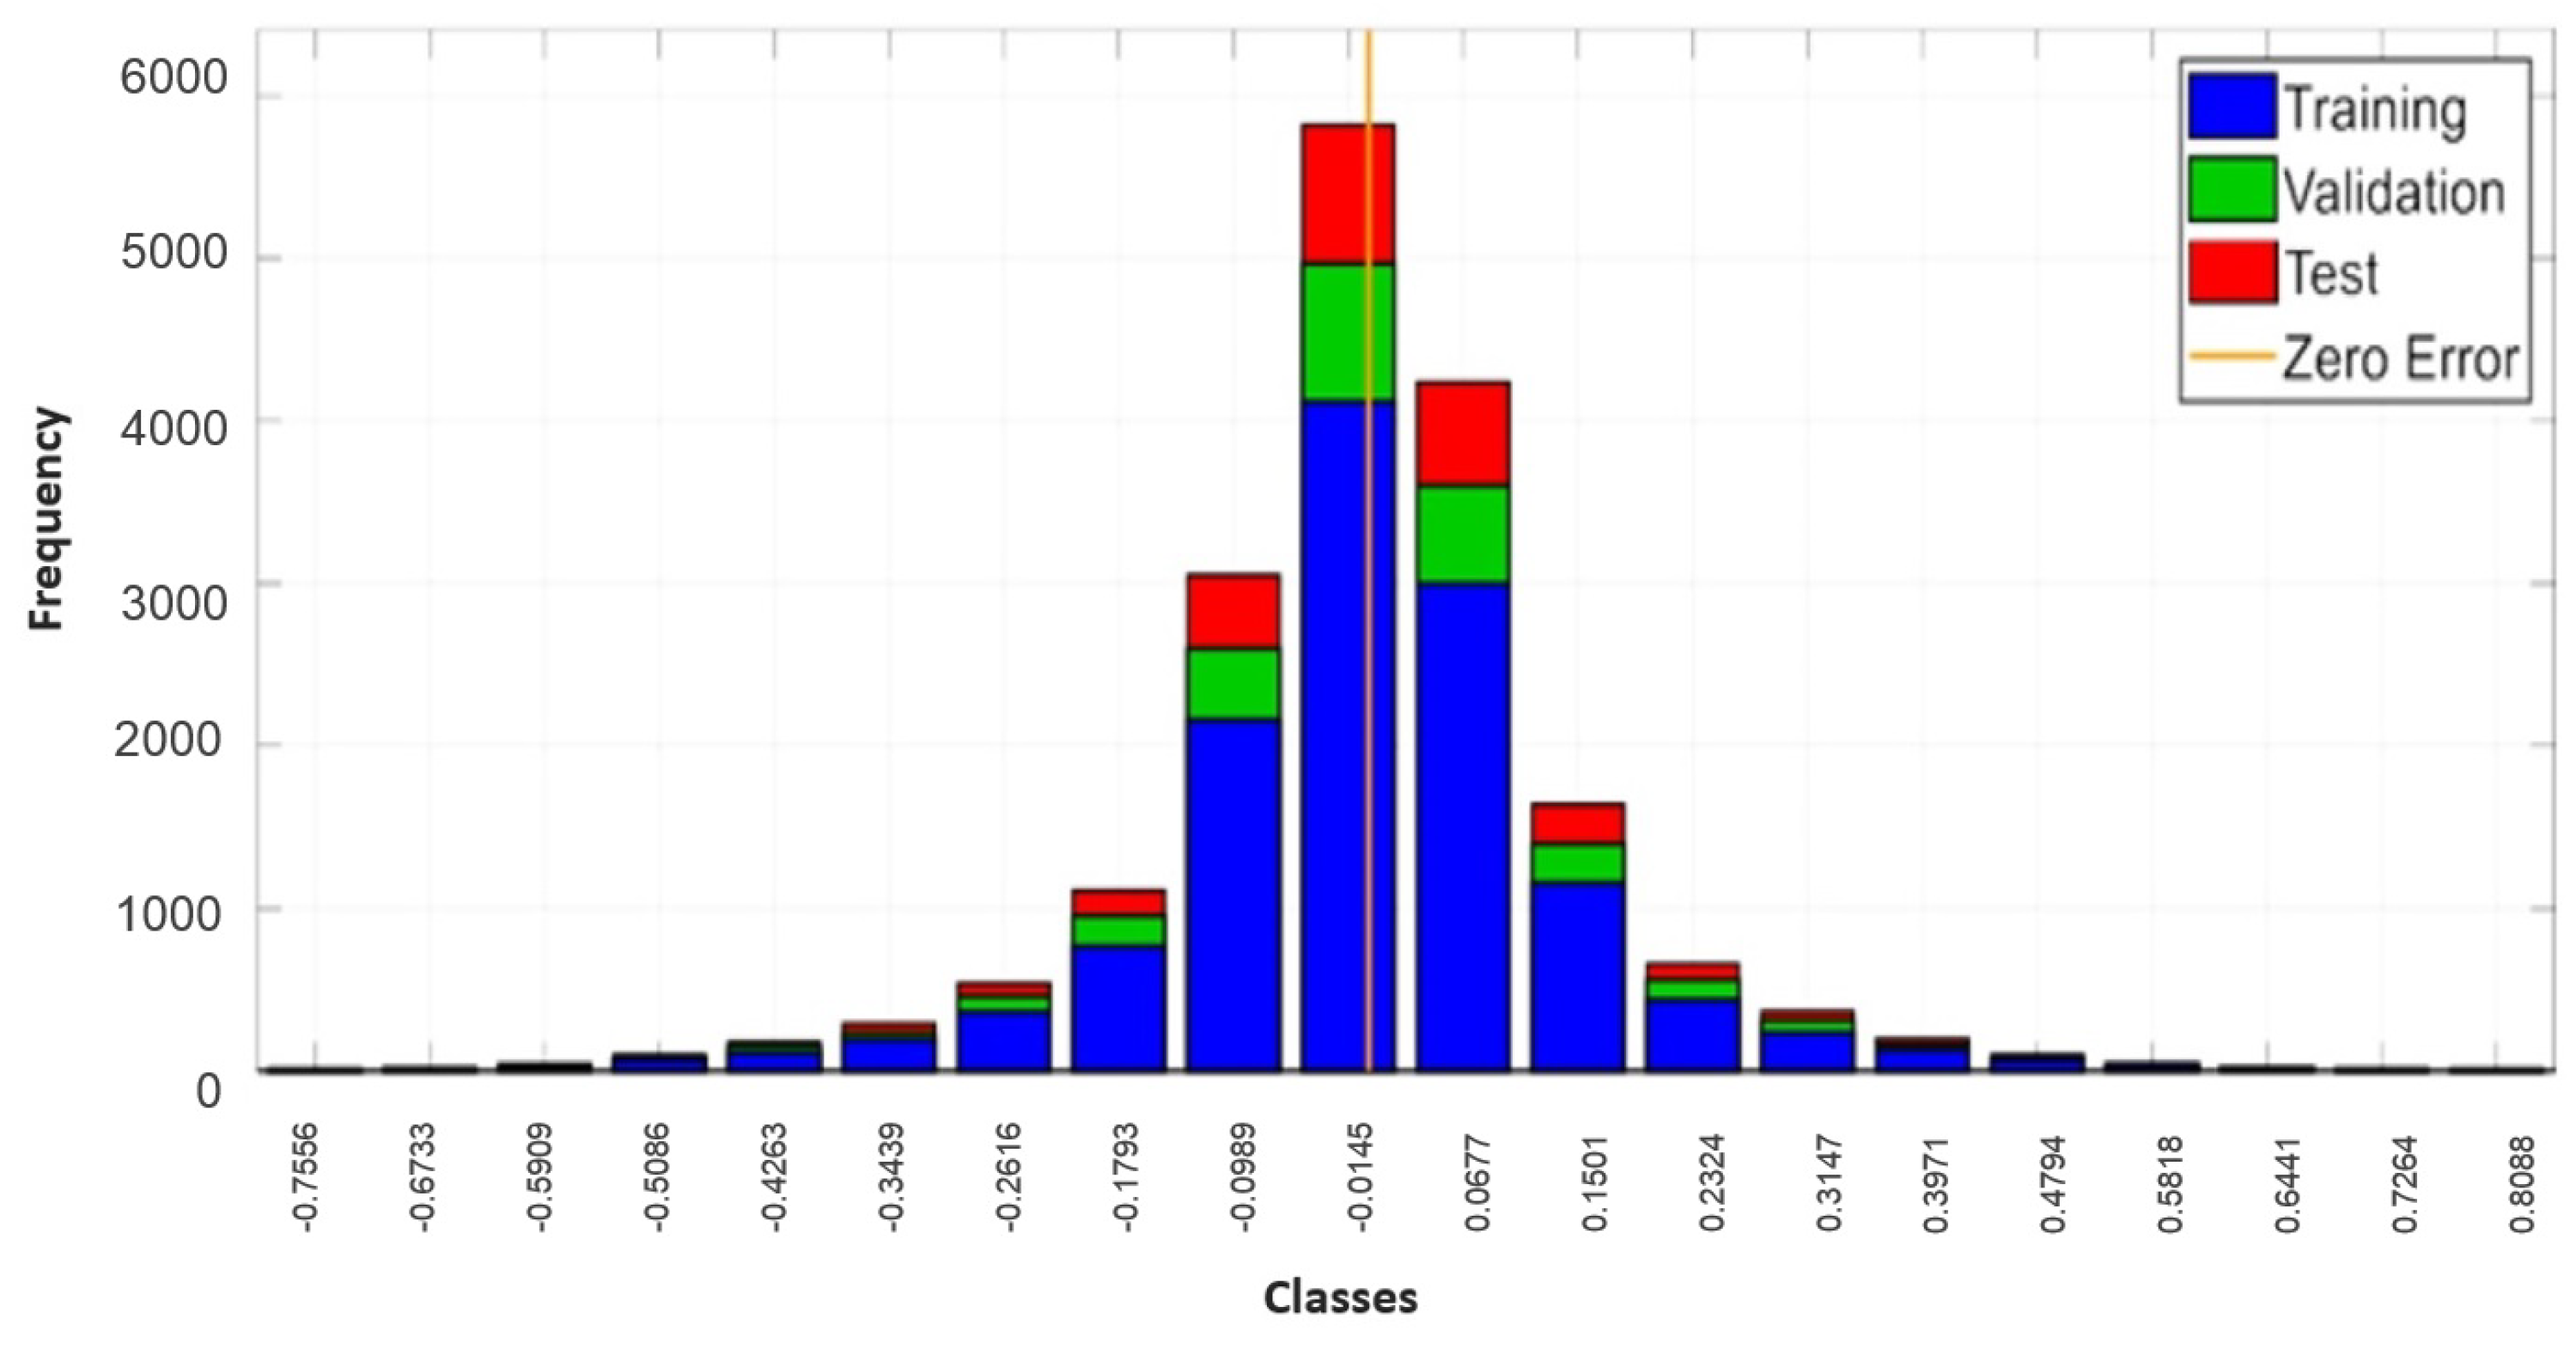
The final architecture of ANN contained 3 hidden layers, each with 10 neurons, while the output had 3 possibilities. This structure provided the best functionality in classification among all examined architectures. The number of epochs used for training the ANN was 500; however, the best results were obtained at 416 epochs. A histogram analysis of ANN is shown in
Figure 15. For training ANN, there were three algorithms:
The Levenberg–Marquardt algorithm consumes more memory, but, positively, it takes less time. Training automatically halts when there is no further improvement in generalization. This algorithm was chosen for simulation. In the Bayesian regularization procedure, more time is consumed but the output is satisfactory, even for datasets which are small, noisy, or difficult. The process stops with weight minimization. A scaled conjugate gradient algorithm does not use more memory. It stops when there is no further improvement, which is identified by increasing the value of the mean square fault of a sample.
3.5. Important Characteristics of the Proposed Approach
The approach presented in this paper improves the existing system in several ways:
Improved Efficiency: The main objective of this research is to enhance the efficiency of solar panels in providing constant power to sensors in agricultural fields. By implementing a solar tracking system that changes its direction in two axes based on the sun’s position, the proposed approach optimizes the orientation of the solar panels for maximum energy generation;
Real-time Data Collection: In addition to energy maximization, the proposed system also focuses on collecting real-time data on weather parameters such as temperature, humidity, and rainfall. These data can be used by farmers to make informed decisions regarding irrigation, pest control, and other crop management practices. The collected data are transferred to a mobile app, making it easier for farmers to access and utilize the information;
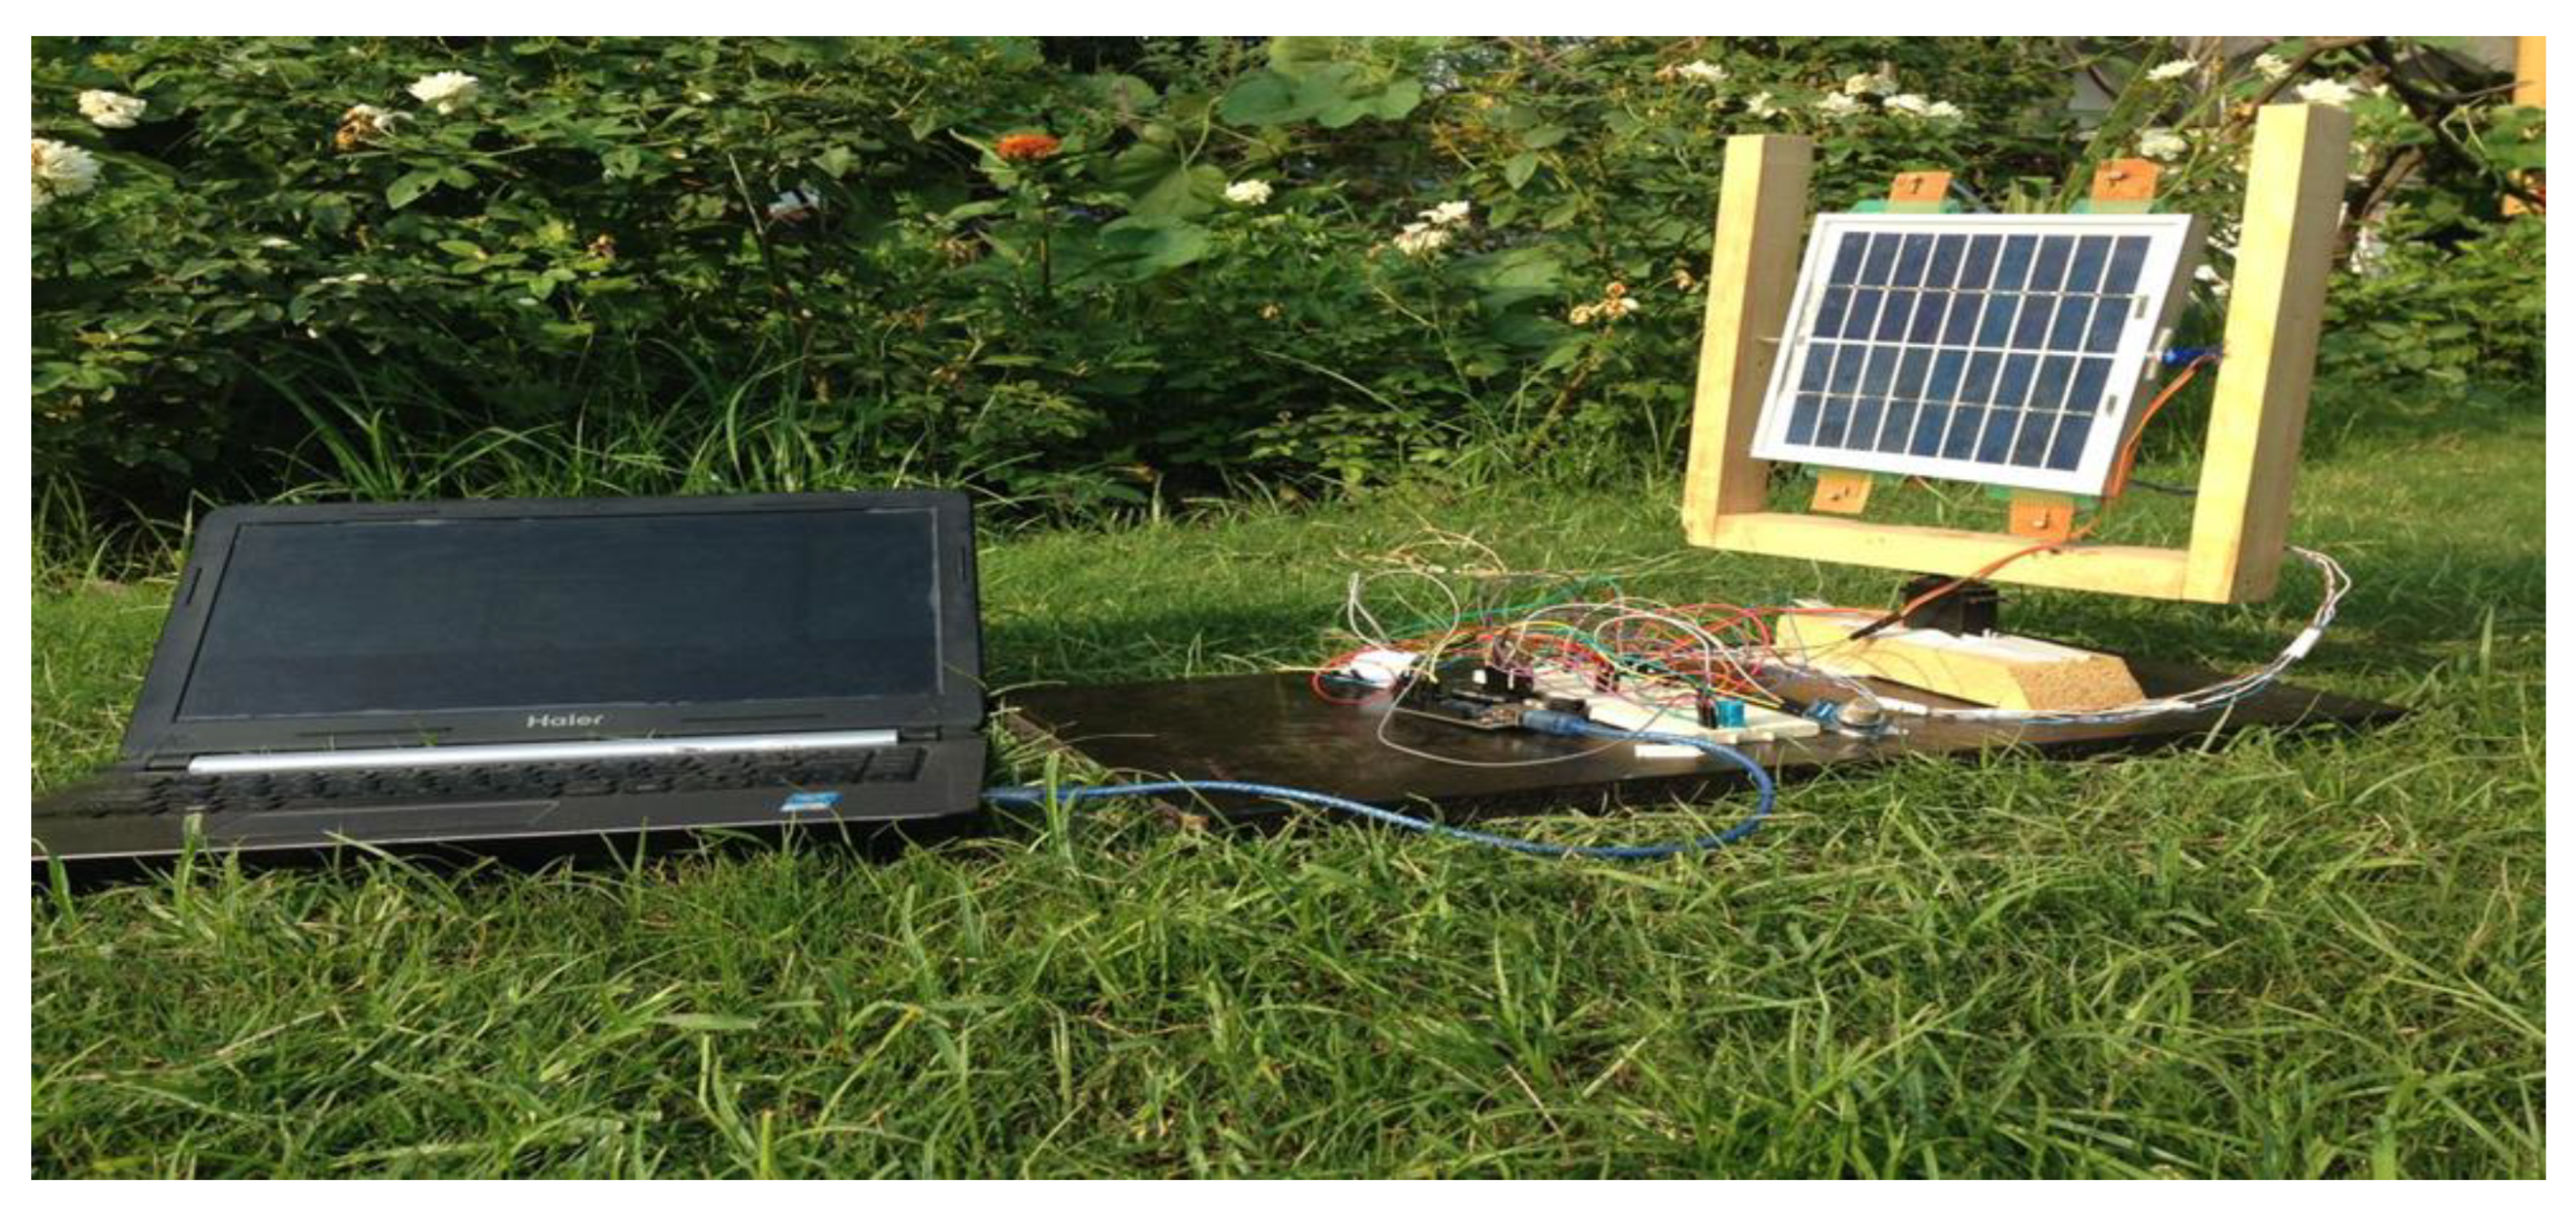
Hardware Experimental Setup: A testbed with a hardware experimental setup is designed to evaluate the system’s capability to track the sun effectively. This allows for practical testing and validation of the proposed approach;
Integration of AI Techniques: The research incorporates AI techniques along with a QoS algorithm to improve the quality of service provided by the existing system. This integration enhances the overall performance and functionality of the system;
Improved Results: The research demonstrates that the proposed system leads to a relative increase in efficiency of up to 52% compared to the existing system. These improved results highlight the effectiveness of the proposed approach in maximizing energy generation and providing valuable data for agricultural purposes.
In summary, the approach presented in this paper introduces a solar tracking system that enhances the efficiency of solar panels, collects real-time weather data, incorporates AI techniques, and achieves significant improvements in performance compared to the existing system.
3.6. Limitations and Future Work
The yearly energy efficiency results show that the values for dual-axis (98.7%), single-axis (98.2%), and fixed tilt (98.3%) are very close, and these small differences may not justify the added complexity and cost of dual-axis tracking. A fixed tilt system is likely much cheaper and simpler than a dual-axis tracker. The paper could have included estimated system costs and discussed whether the fractional efficiency gain of the dual-axis justifies the expense. A detailed cost–benefit analysis would strengthen these results in the future.
Similarly, highlighting the economic trade-offs and costs, not just the technical efficiency gains, would give a more complete picture, but this research focused on the technical capabilities of the dual-axis tracking system to optimize energy yield. Dual-axis tracking is a known technique, and the novelty lies in the application focus. The lack of economic analysis makes the real-world value unclear.
While this initial research focused primarily on demonstrating a proof of concept and evaluating the energy optimization capabilities, further studies on the reliability, robustness, and maintenance requirements would provide valuable additional insights. We could address reliability and maintainability in future work that includes the following:
Conducting reliability engineering analyses such as FMEA to identify potential failure modes and their effects. This can help highlight vulnerabilities to be mitigated;
Performing accelerated life testing on system components to evaluate lifespan and deterioration over time. These data can inform maintenance schedules;
Implementing self-diagnostic features and fault-tolerant architectures to improve reliability and reduce downtime;
Evaluating ease of repair, replacement, and upkeep to minimize maintenance labor time/costs;
Considering the use of higher-durability components, weatherproofing, and corrosion-resistance to withstand harsh outdoor conditions;
Analyzing tradeoffs between reliability gains and additional costs to find the optimal balance.
Incorporating these factors into future work on the solar tracking system could provide a more complete picture of overall performance and feasibility. While this research focused on the technical capabilities of the dual-axis tracking system to optimize energy yield, economic considerations are also important. As the paper notes in the introduction, a key challenge with solar PV is improving conversion efficiency and reducing manufacturing costs to be competitive with conventional power.
The work on comparing the costs of expanding the fixed array footprint versus adding dual-axis tracking is excellent. The paper compares energy efficiency metrics across different systems but does not factor in land usage. As the small footprint increase may be acceptable for agricultural applications, it is a good avenue for future work. Incorporating the economic analysis described would strengthen the paper by balancing the technical potential against practical cost factors in the future.


 ,
, 


