Article

Multivariate Analysis of Grain Yield and Main Agronomic Traits in Different Maize Hybrids Grown in Mountainous Areas

1
Key Laboratory of Southwest China Wildlife Resources Conservation (Ministry of Education), College of Life Science, China West Normal University, Nanchong 637009, China
2
Nanchong Academy of Agricultural Sciences, Nanchong 637000, China
*
Authors to whom correspondence should be addressed.
Agriculture 2024, 14(10), 1703; https://doi.org/10.3390/agriculture14101703 (registering DOI)
Submission received: 22 August 2024 / Revised: 20 September 2024 / Accepted: 26 September 2024 / Published: 28 September 2024
(This article belongs to the Section Crop Production)

Abstract

:
Inconsistent reports exist on the relationships between key agronomic traits and maize yield. We performed a multivariate analysis of yield and 10 agronomic traits in 59 hybrids to explore maize yields in mountainous areas. The yield per plant (YP) was significantly and positively correlated with kernel weight (KW), growth period (GP), and kernel row number (KRN). KW and KRN had positive effects on YP, whereas kernel rows per ear (KRE) had a negative effect. GP indirectly affected YP. GP, KW, KRN, and ear length (EL) showed the highest grey relational degree with YP. The first four principal components cumulatively accounted for 73.36% of variation. EL, KW, plant height (PH), ear height (EH), GP, KRN, and YP contributed positively to the variation, whereas KRE, shelling percentage (SP), bald-tip length (BTL), and ear girth (EG) contributed negatively. Based on trait similarity, the 59 maize hybrids were classified into two clusters, Clusters I and II. A total of 11 traits were grouped into four clusters, Clusters A–D. Cluster D included KW, GP, KRN, EL, EH, PH, and YP, and the 22 maize hybrids in Cluster I performed better in these traits. These results provide a theoretical basis for the breeding of high-yield maize varieties in mountainous areas.

1. Introduction

Maize is a critically important staple and forage crop for global economic development, agricultural production, and food security [1]. Recently, human population, livestock, and industrial developments have influenced an increase in maize demand and production [2]. Improved varieties are important for enhancing maize yield per unit and total maize production. Maize yield is a quantitative trait controlled by multiple genes, resulting from the combined action and mutual influence of various agronomic traits [3,4]. Changes in one trait can lead to alterations in other related traits owing to their interconnection and mutual restraint [5]. Therefore, it is essential to study the effect of different maize traits on yield to enhance production and cultivate new varieties.
Recently, extensive research has been conducted on the relationship between agronomic traits and maize yield. Yahaya et al. showed that plant height (PH), ear length (EL), ear diameter, and 1000-grain weight were significantly correlated with maize grain yield and with each other [6]. The path coefficient analysis revealed that plant height had the highest direct effect on grain yield, followed by 1000-grain weight [6]. Roy et al. evaluated 25 maize genotypes and found that 1000-grain weight had the strongest positive correlation with yield, followed by husk girth and EL [7], whereas days to anthesis, days to maturity, and seed number per row showed a negative correlation with yield. Path coefficient analysis revealed that 1000-grain weight had the largest direct positive effect on grain yield, followed by husk girth and EL [7]. Wang et al. investigated 26 hybrid sweet corn combinations in their study [8]. Principal component analysis (PCA) indicated that the first five principal components (yield, quality, row number, bald-tip length (BTL), and growth period) collectively explained 87.74% of the variance, and grey relational analysis indicated that single ear weight, ear diameter, and grain number per row significantly influenced yield, while ear height (EH) and BTL had a relatively minor impact [8]. Singh et al. studied 11 agronomic traits of 25 maize genotypes and found that five principal components explained 86.62% of the cumulative variation, with the first principal component accounting for 28.78% of the total variation; they showed that EL, ear row number, and grain number per row had the greatest positive contribution to yield [9].
Despite extensive research on the relationships between key agronomic traits and maize yield, inconsistencies in results remain due to differences in research sites, experimental materials and other factors. Furthermore, most research has neglected mountainous case studies [10,11]. Mountain terrain and climate have significant effects on the growth period (GP), yield, and quality of maize [12]. In this study, we conducted a multivariate analysis of 10 agronomic traits and yields of 59 maize hybrids grown in mountainous areas. By examining how different agronomic traits interact and contribute to the yield, we aimed to uncover the factors driving maize productivity, and provide a theoretical basis for breeding high-yield maize varieties.

2. Materials and Methods

2.1. Experimental Materials

A total of 59 maize hybrids provided by the Nanchong Academy of Agricultural Sciences were employed to evaluate main agronomic traits and yield, including NT1602, SZ1701, Bisheng 9918, Chengdan 387, Chengdan 389, Chengdan 607, Chengdan 608, Chengdan 615, Chengdan 626, Chuandan 2011, Chuandan 2012, Chuandan 820, Chuanxiyu 7, Demin 88, Enhedan 1, Guohaoyu 187, Guohaoyu 199, Haodan 653, Jifeng 88, Jishengyu 887, Jinhe 880, Jinrong 1717, Jinyu 4579, Jinyu 679, Jinyu 802, Kunyu 16, Le 1838, Le 1918, Liaohe 308, Mian 1904, Miandan 717, Minyu 202, Qian 7860, Quanyu 9, Ruiyu 612, Shanyu 8, Shengkeyu 202, Shengkeyu 901, Shengyu 369, Shufeng 616, Shuyu 989, Tiansheng 5, Wugu 8518, Xikangyu 191, Xianyu 1986, Xinyu 168, Yayu 2289, Yayu 2581, Yayu 798, Yayu 8521, Yayu 9698, Yudan 901, Zhenghong 411, Zhenghong 504, Zhenghong 613, Zhenghong 729, Zhenghong 939, Zhongyu 335, and Zhuyu 177.

2.2. Experimental Site

Field experiments were conducted in 2022−2023 at Lvshui Town (26°10′34″ N, 101°58′07″ E), Huili County, Liangshan Prefecture, Sichuan Province, China. The experimental site is situated at an altitude of 1500 m and is characterised by a subtropical monsoon climate with distinct seasons. Influenced by the Qinghai–Tibet Plateau and Indian Ocean monsoons, the region experiences moderate summers, cold winters, and significant diurnal temperature variations. The annual precipitation is 800–1200 mm, primarily concentrated in the summer, with an average annual temperature of approximately 15 °C.

2.3. Experimental Design

The experiment employed a randomised block design with three replicates, each consisting of five rows. The row spacing was 0.68 m, the row length was 6.0 m, and the plot area was 20.4 m2. The maize varieties were manually planted at a density of 60,000 plants ha−1. Prior to planting, compound fertiliser (15-15-15) was added at a rate of 750 kg/ha. Subsequently, 80 and 120 kg/ha of N fertiliser were applied during the elongation and heading stages, respectively. Conventional cultivation techniques have been used, and diseases and insects are rigorously controlled using chemical measures to mitigate production loss. Herbicides are used for weed management.

2.4. Determination of Agronomic and Yield Traits

Agronomic traits and yield were determined according to the “Guidelines for Testing the Distinctness, Uniformity, and Stability of New Varieties of Plants: Corn” (GB/T 19557.24-2018) [13]. The GP was calculated from the day of sowing to maturity. During the initial stage of grain filling, 10 randomly selected healthy plants were sampled from the plot to measure PH (the distance from the ground to the top of the male spike) and EH (the distance from the ground to the node where the visible ear was attached). During the mature stage, the yield of each plot was determined by measuring the middle three rows of corn and dividing the yield by the number of ears to calculate the yield per plant (YP). After the maize harvest, 10 randomly selected ears from each plot were sampled to measure ear traits. EL was measured from the base of the female ear to the tip. The ear girth (EG) is indicated by the midsection diameter, whereas a short diameter represents a flat ear. Kernel rows per ear (KRE) and kernel row number (KRN) were documented. The length of the unfilled portion at the top of the ear was measured as the BTL. Ten selected maize ears were weighed, and the kernels were removed and weighed. The shelling percentage (SP = ear weight/kernel weight × 100%) was calculated and the 100-kernel weight (KW) measured simultaneously.

2.5. Data Analysis

SPSS (version 22.0; SPSS Inc., Chicago, IL, USA) was used for the descriptive statistical analysis, Z-score standardisation of data, and path coefficient analysis. Pearson’s correlation analysis was performed using Origin 2022b software (OriginLab, Northampton, MA, USA). The SPSSPRO online data analysis platform (https://www.spsspro.com/, accssed on 1 August 2024) was used for grey relational analysis and PCA. Two-way hierarchical clustering analysis was conducted using PAST software (version 4.17c; SCIEM, Vienna, Austria).

3. Results

3.1. Descriptive Statistical Analysis

We performed a descriptive statistical analysis of 10 agronomic traits and grain yields of 59 hybrid maize varieties (Table 1). YP ranged from 161.17 to 211.13 g, with an average of 185.56 g; GP ranged from 132.22 to 143.78 days, with an average of 136.35 days; EG ranged from 4.92 to 6.78 cm, with an average of 5.65 cm; BTL ranged from 0.35 to 1.88 cm, with an average of 0.87 cm; and SP ranged from 79.68% to 86.13%, with an average of 82.59%. The CV for the 11 traits ranged from 1.75% to 38.19%. GP and SP showed the least variation, with a CV of 1.75% and 1.83%, respectively, whereas BTL exhibited the greatest variation, at 38.19%. In addition, the CV of the EG had a CV close to 10%. These findings suggest that GP and SP had stable performance in mountainous regions, displaying minimal susceptibility to external factors. In contrast, the performance of BTL and EG across different varieties showed significant variation, indicating substantial potential for improvement. The absolute skewness and kurtosis values of these 11 traits were all less than 1, verifying that all traits generally conformed to a normal distribution and exhibited typical quantitative traits.

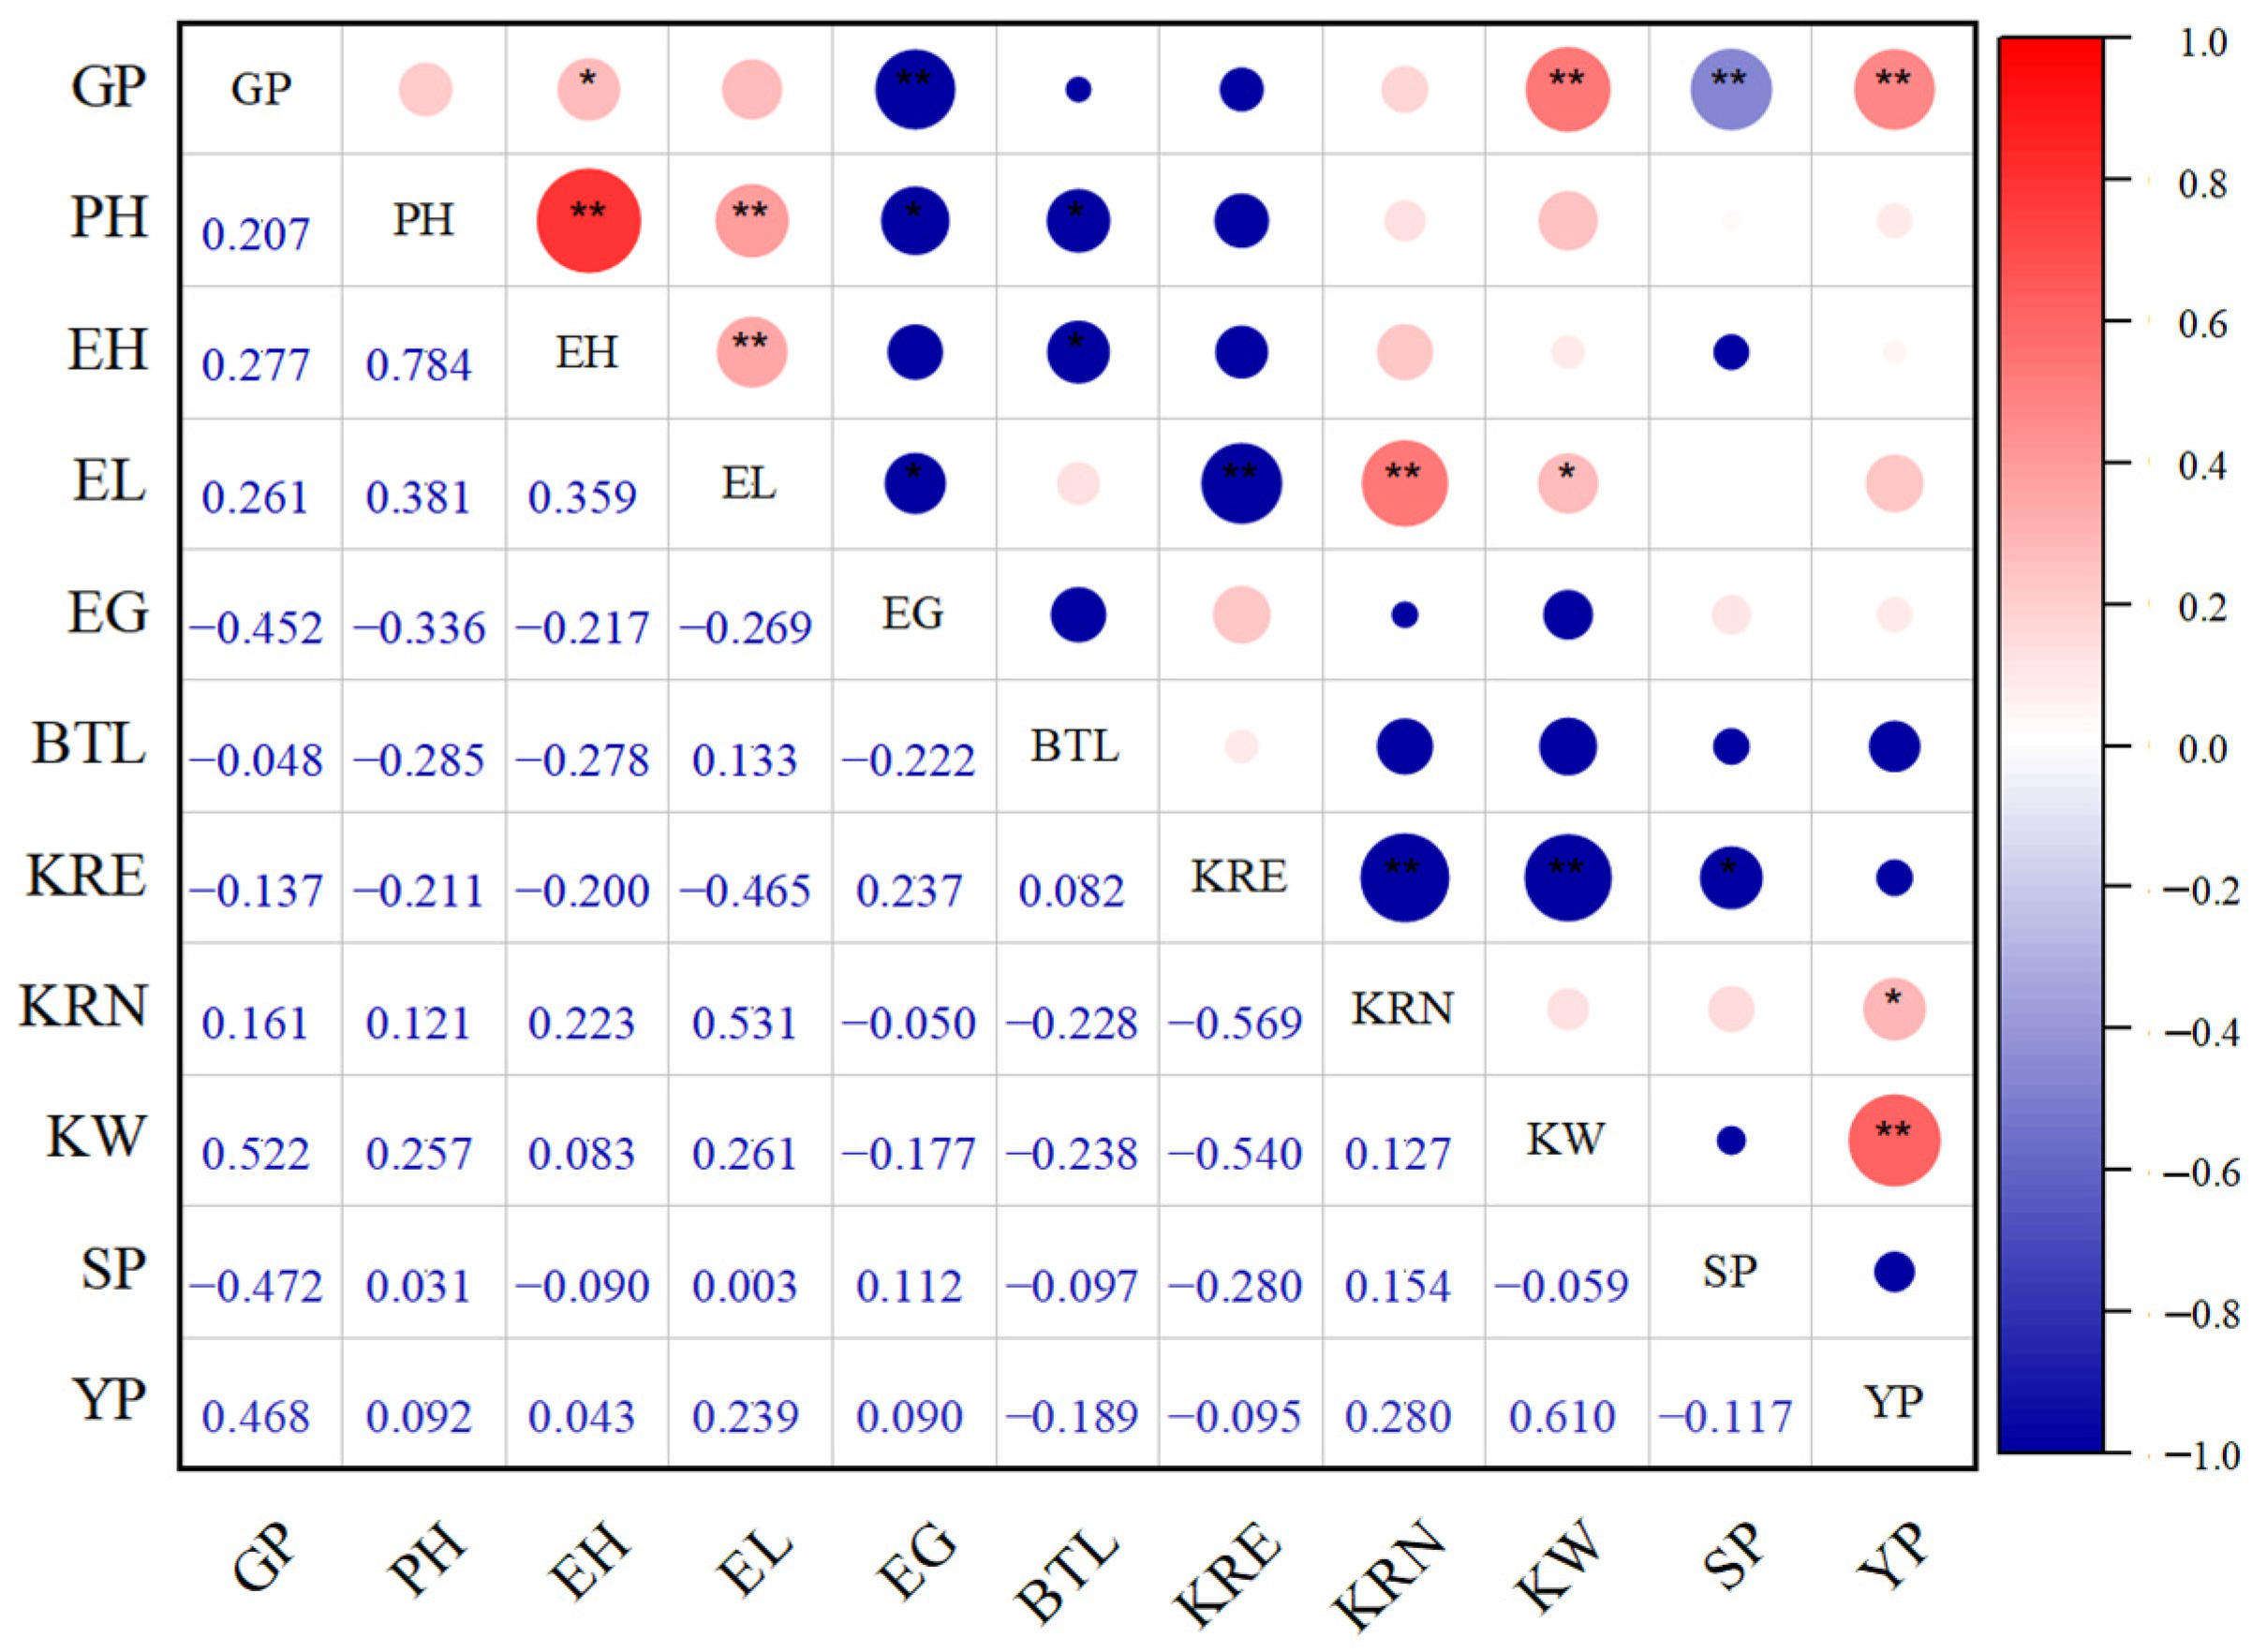
3.2. Correlation Analysis

Bivariate correlation analysis of the main agronomic traits and yields of different varieties indicated varying degrees of correlation between these traits and yield (Figure 1). YP was significantly and positively correlated with KW and GP, with correlation coefficients of 0.610 and 0.468 (p < 0.01), respectively. It also showed a significant positive correlation with KRN, with a correlation coefficient of 0.280 (p < 0.05); however, YP was not significantly correlated with other agronomic traits. KW showed significant positive correlations with GP (0.522) and EL (0.261), whereas KRN exhibited a significant positive correlation with EL (0.531). PH, EH, and EL were significantly and positively correlated with each other. Moreover, KRE showed significant negative correlations with KRN (−0.569), KW (−0.540), EL (−0.465), and SP (−0.280). BTL was significantly negatively correlated with PH (−0.285) and EH (−0.278), while EG showed a significant negative correlation with GP (−0.452), PH (−0.336), and EL (−0.269). Additionally, SP exhibited a significant negative correlation with GP (−0.472) and KRE (−0.280). These results indicate that interrelationships and mutual constraints exist among the various agronomic traits of maize in mountainous areas. In conclusion, EH and PH may positively influence EL, which in turn positively affects KRN and KW, and ultimately affects YP. Conversely, KRE negatively affected EL, KW, and KRN, thereby negatively affecting YP. In addition, EG had a negative impact on YP by negatively influencing GP and EL.

3.3. Path Coefficient Analysis

To assess the direct and indirect effects of various agronomic traits on yield, path analysis of the genetic correlation coefficients was conducted (Table 2). KW, KRE, and KRN had the highest direct path coefficients, with a YP of 0.967, 0.782, and 0.576, respectively, all of which were positive and significant (p < 0.01). Other agronomic traits had an insignificant direct effect on YP. The direct path and correlation coefficients between KW and YP were the highest, positive, and statistically significant among all the traits. Simultaneously, KW exerted a substantial negative indirect effect on YP through KRE, with an indirect path coefficient of −0.522. Similar to the case of KW, the direct path coefficient and the correlation coefficient between KRN and YP were both significantly positive, while KRN was indirectly negatively affected by KRE, with an indirect path coefficient of −0.445. KRE exhibited a significant positive direct effect on YP, whereas an insignificant negative correlation was noted between the two. This suggested indirect negative effects of KRE on YP through KW and KRN, with indirect path coefficients of −0.522 and −0.328, respectively; therefore, overall, KRE had a negative effect on YP. In summary, KW, KRN, and KRE have both direct and indirect effects on YP. Overall, KW and KRN positively influenced YP, whereas KRE had a negative effect on YP.
GP was significantly positively correlated with YP, but the direct path coefficient between them was very small at 0.084. GP had a substantial indirect positive effect on YP through KW, with an indirect path coefficient of 0.505. This indicates that the GP primarily influences the YP through indirect effects. In addition, PH and EL showed positive indirect effects on YP, whereas BTL and SP had a negative indirect effect on YP, although their direct path coefficients and correlation coefficients were not significant.

3.4. Grey Relational Analysis

Based on Deng’s grey system theory [14], this study assessed the relationships and impact levels among 11 maize traits in mountainous areas (Table 3). Typically, a higher relational value indicates a greater effect of a trait on a reference trait. The grey relational analysis, with YP as the reference series and 10 traits as the comparison series, revealed that KW and GP had the greatest impact on YP, followed by EL and KRN, with relational coefficients of 0.791, 0.778, 0.748, and 0.743, respectively. Using 10 agronomic traits as the reference series, each trait was considered the corresponding reference and comparison series for grey relational analysis, thereby forming a correlation matrix (Table 3). GP was most strongly associated with KW, EH, EL, and PH, whereas KW was most strongly associated with GP, PH, EH, and EL. The correlations between GP and KW, EH, EL, and PH were the strongest. KW exhibited the strongest correlation with GP, PH, EH, and EL. KRN showed the strongest association with EL, EH, GP, and KW. In addition, EL exerted the greatest influence on KRN as well as on EH and PH. Therefore, a close relationship existed among the agronomic traits of GP, KW, KRN, EL, PH, and EH. GP, KW, KRN, and EL also showed strong correlations with YP.

3.5. Principal Component Analysis

PCA was performed to determine the yield and 10 yield-contributing traits of maize grown in mountainous areas. Of the 11 quantitative traits, four principal components (PCs: PC1–4) presented more than 1.00 eigenvalue and contributed to approximately 73.36% of the cumulative variation (Figure 2a, Table 4). The contribution of PC1 was 30.43% of the total divergence of the studied population, in which the major contributing traits were EL (0.690), KW (0.667), and PH (0.662), with the maximum positive contribution being towards genetic divergence, whereas KRE (−0.639) and EG (−0.476) displayed notable negative impacts. PC2 accounted for 15.58% of the total variability. The traits GP (0.648) and YP (0.514) had the maximum positive contribution to genetic diversity, whereas SP (−0.654) showed a strong negative contribution. PC3 was responsible for approximately 14.30% of the variation, with positive contributions from EG (0.600), YP (0.540), and KW (0.367), and a negative contribution from BTL (−0.468). PC4 accounted for 13.05% of the variance, with positive contributions from PH (0.504) and EH (0.532), and a negative contribution from BTL (−0.704). The biplot revealed that PH, EH, EL, and KRN were clustered together, whereas GP, YP, and KW were in close proximity. Conversely, KRE, BTL, EG, and SP were distantly positioned relative to the other traits and exhibited opposite trends (Figure 2b). These findings suggest that KRE, SP, and BTL exhibited negative effects in explaining the genetic variation of the 59 maize hybrid varieties, which is consistent with the results obtained from the path analysis.
The loading plot based on the first two PCs showed a high degree of variation among most varieties and traits, with these hybrids distantly positioned from the others, indicating their potential utility in future breeding efforts (Figure 2b). Table 5 presents the ranking of the top 15 maize hybrids in terms of their scores for the first four PCs. A high PC score for a particular variety in a particular factor denotes high values for the traits of that particular variety. Chuandan 2011, Chuandan 2012, and Minyu 202 scored the highest in PC1, indicating high EL, KW, PH, and EH values. In PC2, Le 1918, Shufeng 616, and Yayu 9698 scored the highest, indicating that they performed better at GP and YP. Chuandan 2011, Jifeng 88, and Miandan 717 achieved the highest PC3 scores, indicating superior performance in EG, YP, and KW. MinYu 202, Shanyu 8, and SZ1701 achieved the highest scores for PC4, suggesting higher PH and EH levels. Therefore, maize hybrids with high PC scores have a greater potential for further breeding to produce high-yielding varieties.

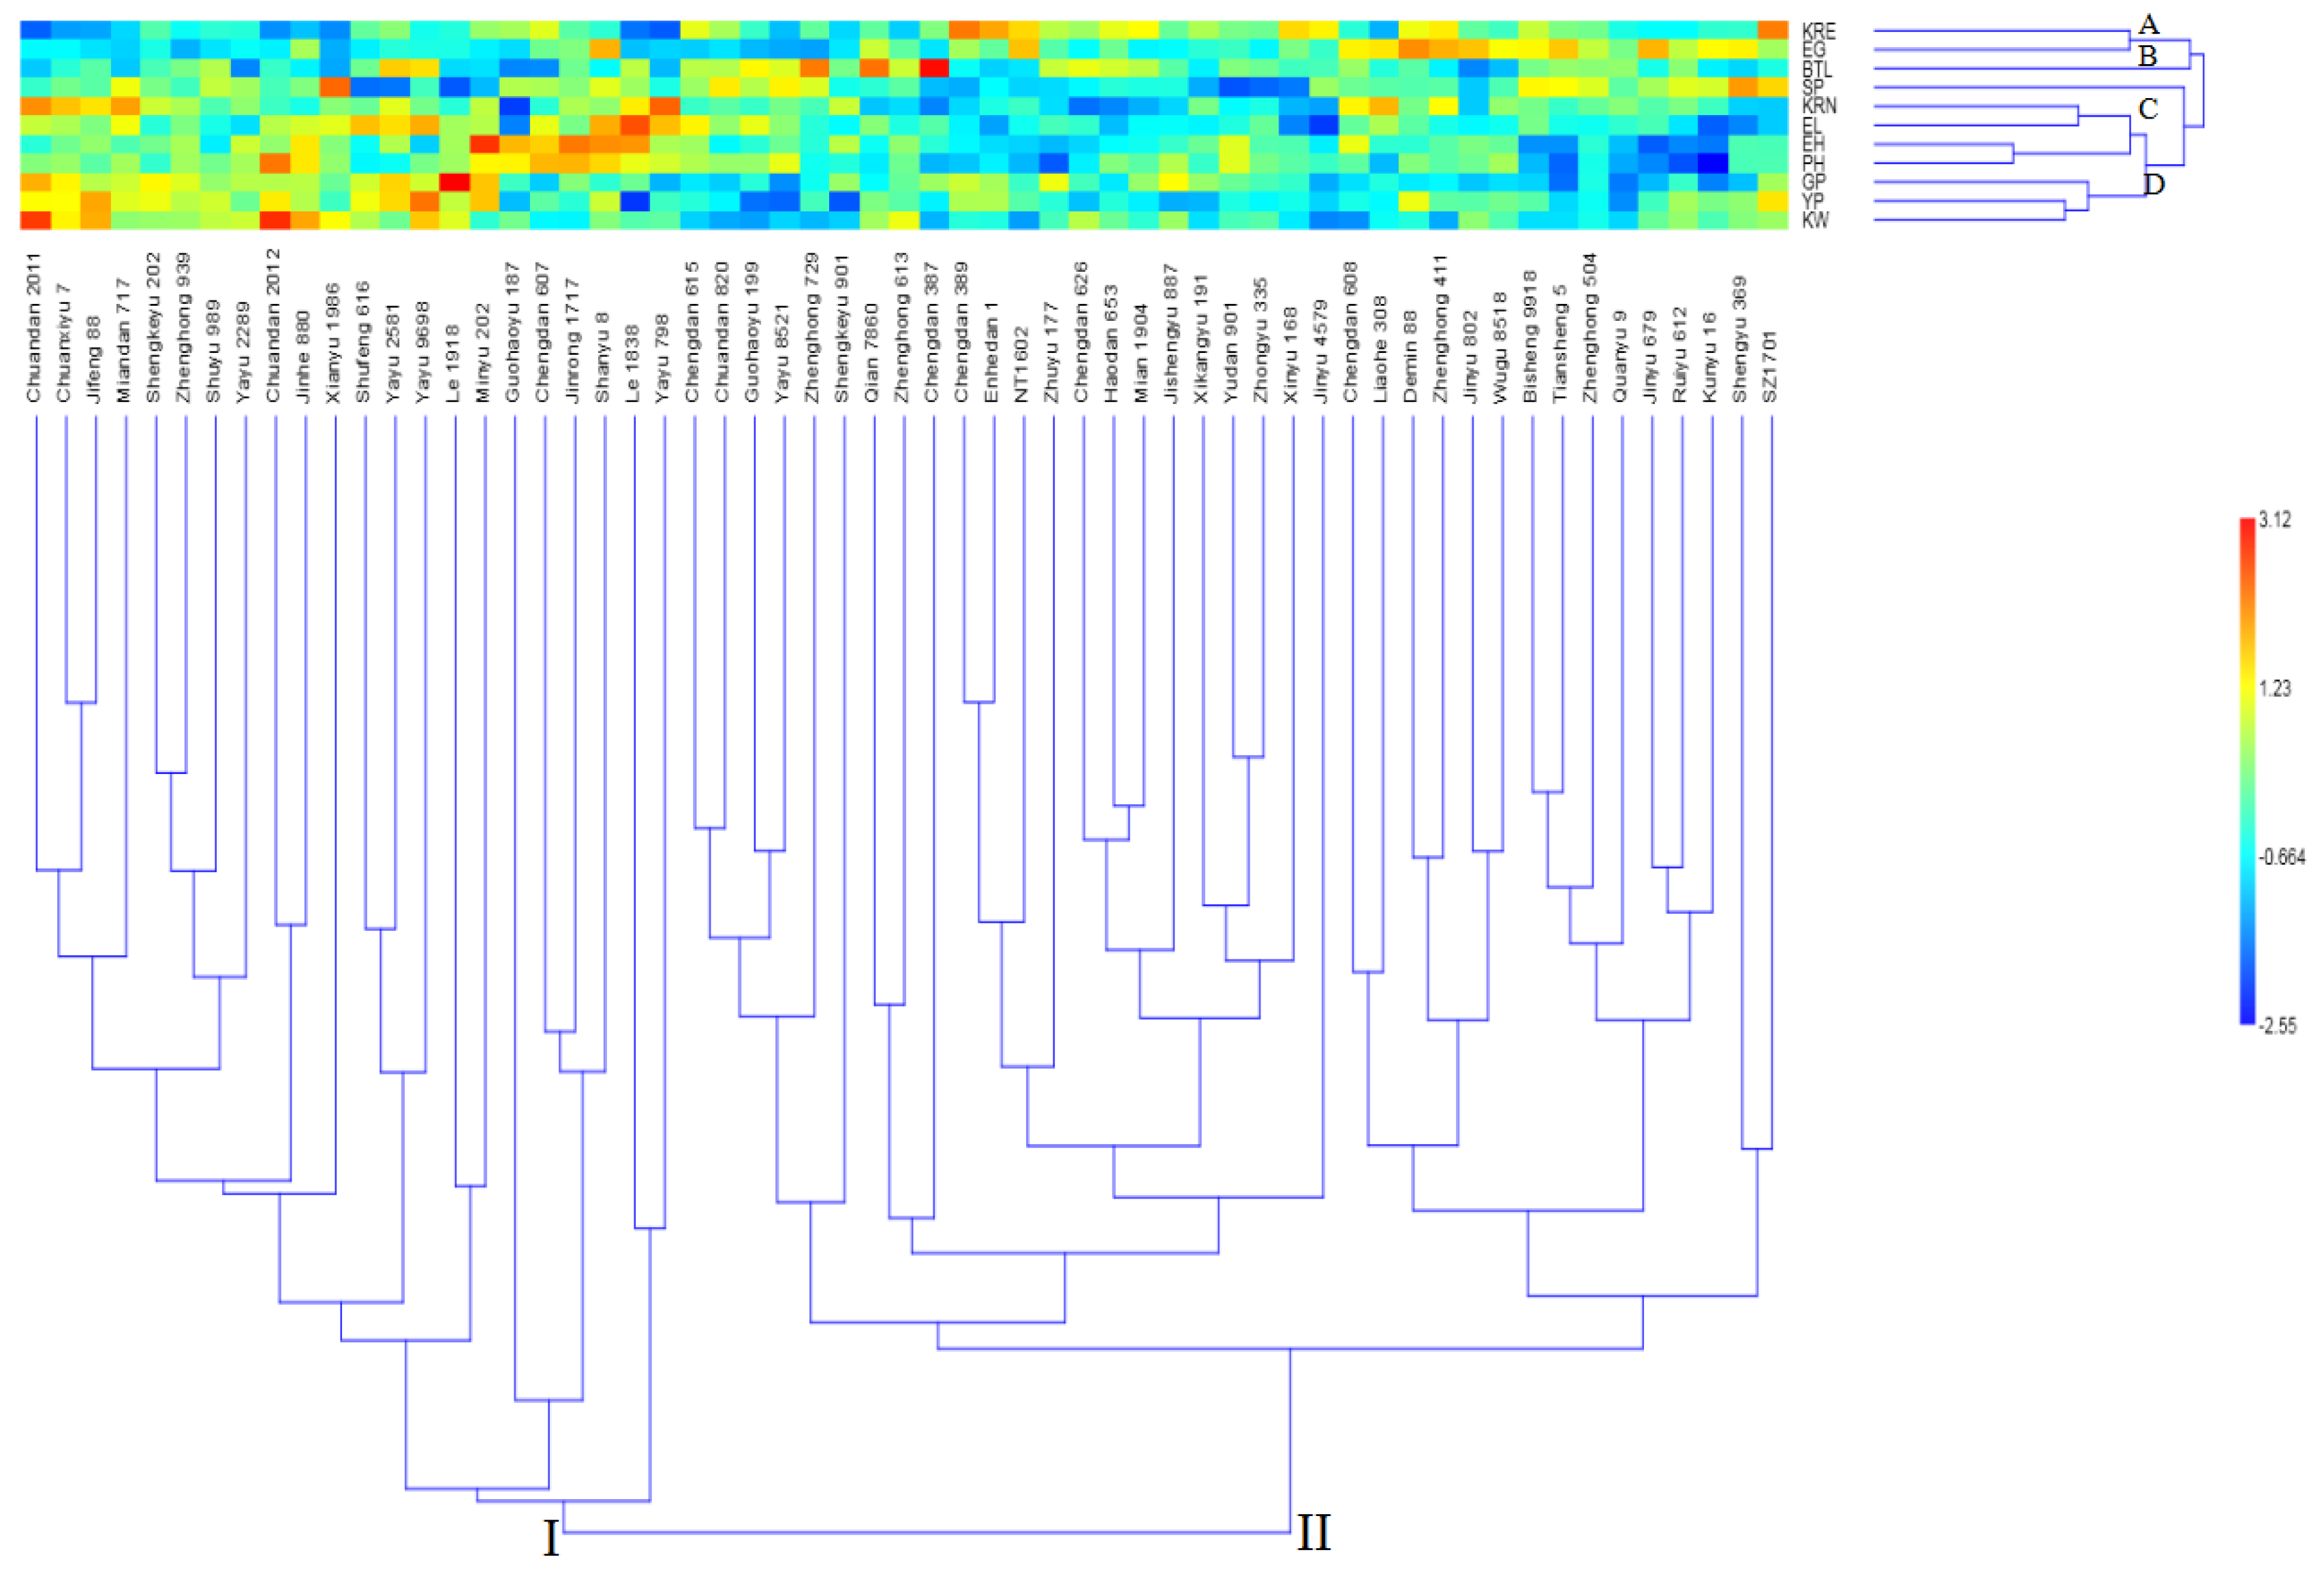
3.6. Cluster Analysis

Two-way hierarchical clustering was used to simultaneously investigate the potential intra- and inter-relationships among the maize hybrids and traits (Figure 3). Based on trait similarity, the 59 maize hybrid varieties were classified into two clusters, Clusters I and II, comprising 22 and 37 varieties, respectively. Eleven traits, including yield, were grouped into four clusters: Cluster A (two traits), Cluster B (one trait), Cluster C (one trait), and Cluster D (seven traits). Cluster A included the traits KRE and EG, whereas Clusters B and C each had only one trait, BTL and SP, respectively. Cluster D contained the most traits, including KRN, EL, EH, PH, GP, YP, and KW. Among them, YP was the closest to KW, followed by GP. According to the clustering heat map, Cluster I maize hybrids exhibited higher values for KRN, EL, EH, PH, GP, YP, and KW, while Cluster II varieties demonstrated better performance in terms of KRE, EG, BTL, and SP. Moreover, the top 15 maize hybrids based on PC scores, except for SZ1701, belonged to Cluster I, indicating mutual validation between the cluster analysis and PCA (Table 5, Figure 3). In summary, KW, GP, KRN, EL, EH, PH, and YP are closely related. The relationships between KW, GP, and YP were the closest. The maize hybrids in Cluster I outperformed the others in these traits, indicating that Cluster I had a greater potential for breeding high-yielding varieties, supporting greater efficiency.

4. Discussion

4.1. Influence of Different Agronomic Traits on Maize Yield

The factors contributing to the yield of maize hybrids are complex, with most studies focusing on the components of yield formation. However, there are limitations in the current findings [15,16,17]. Here, multivariate analysis was conducted on 10 agronomic traits associated with YP in 59 maize hybrids cultivated in mountainous areas, including GP, PH, EH, EL, EG, BTL, KRE, KRN, KW, and SP. The results of the correlation analysis indicated a significant positive correlation between YP and KW, KRN, and GP (Figure 1), which is similar to the results of previous studies [18,19]. The path analysis demonstrated that KW and KRN had a strong positive direct effect on YP (Table 2), which is supported by Prakash’s study [20]. In addition, consistent with Wang’s findings [8], the grey relational analysis revealed that YP had the strongest association with KW, GP, and KRN (Table 3). Few studies have used cluster analysis to examine associations between traits. In the present study, two-way hierarchical clustering grouped seven traits KW, GP, KRN, EL, EH, PH, and YP into the same cluster (Figure 3). According to the PCA, these seven traits contributed positively to the genetic variation of the 59 maize hybrid varieties for the first four PCs (Table 4). Grey relational analysis revealed a close relationship among the agronomic traits of GP, KW, KRN, EL, PH, and EH. These findings suggest that KW, GP, and KRN may exert the most substantial influence on YP, whereas EL, PH, and EH also play a role in promoting high YP.
KRE, BTL, SP, and EG were negatively correlated with other traits. PCA also showed that these four traits contributed negatively to variation in the 59 maize hybrids. The path analysis suggested that KRE, BTL, and SP had negative indirect effects on YP. These results revealed that KRE, BTL, SP, and EG were not conducive to achieving a high maize yield. Ma et al. showed that KRE and EG are negatively correlated with YP, consistent with the results of this study [21]. On the contrary, a few other studies found that KRE and EG are positively correlated with YP [22,23]. The reason for these different outcomes might be that quantitative traits are significantly influenced by the environment [24,25]. Therefore, it is critical to select specific breeding strategies that are tailored to different environments.

4.2. Characteristics of High-Yielding Maize Varieties in Mountainous Areas

The cultivation of crops in mountainous areas yields fewer benefits than cultivation in other regions, possibly because of the high altitude and significant temperature variations in mountainous terrain and uneven rainfall patterns [26]. In addition, natural disasters such as landslides and mudslides frequently occur in these areas [27]. Croplands located near forests may be surrounded by trees and shrubs, resulting in substantial shading that adversely affects the growth and development of crops [28]. These conditions of mountainous areas lead to low maize cultivation yields and reduced farmer incomes. Therefore, it is crucial to develop high-yield corn varieties that are well suited for this specific area.
The findings of this study suggest that high-yielding maize varieties in mountainous areas exhibit higher KW, longer GP, and higher KRN. In addition, they demonstrated higher PH and EH, as well as longer EL. Longer GP can promote the growth and development of crops by extending the duration of light exposure, which can increase the amount of photosynthesis accumulated by plants, thereby improving crop yields [29]. Extending the duration of light exposure can also help to reduce the disadvantages caused by shading, allowing plants to better perform photosynthesis and absorb more nutrients, maintaining healthy growth. Higher PH and EH can increase the chances of plants receiving more light, thus reducing poor growth or decreased yield due to insufficient light [30]. In addition, high-yield maize in mountainous areas exhibited lower levels of KRE and SP, shorter BTL, and smaller EG according to this study. Therefore, when breeding for high yields, it is important to prioritise the selection of KW, GP, and KRN while also making appropriate choices for PH and EH. The positive and negative correlations between various agronomic traits to achieve higher yields must also be determined. The 15 maize hybrids listed in Table 4 had the highest comprehensive scores in the four PCs and outperformed the other hybrids in terms of KW, GP, KRN, EL, EH, PH, and YP, making them promising materials for further selection.

5. Conclusions

Our multivariate analysis of 10 yield-related agronomic traits and grain yield per plant in 59 maize hybrids grown in a mountainous area indicated that YP was significantly positively correlated with KW, GP, and KRN. Further, path coefficient analysis showed that KW, KRN, and KRE had both direct and indirect effects on YP. However, KW and KRN positively impacted YP, whereas KRE had a negative influence on YP. GP primarily exerted its influence on YP through indirect effects. Grey relational analysis indicated strong correlations between GP, KW, KRN, and EL with YP, as well as close interrelationships among the agronomic traits GP, KW, KRN, EL, PH, and EH. In the 11 quantitative traits, the first four PCs explained 73.36% of the cumulative phenotypic variation. EL, KW, PH, EH, GP, KRN, and YP positively contributed to explaining variation, while KRE, SP, BTL, and EG had a negative contribution. The two-way hierarchical clustering analysis classified 59 maize hybrids and 11 agronomic traits into two and four clusters, respectively. Cluster D included KW, GP, KRN, EL, EH, PH, and YP, and 22 maize hybrids belonging to Cluster I performed better in these traits. Therefore, for breeding of high-yield maize varieties in mountainous areas, those with a high 100-kernel weight, long growth period, and large number of kernels per row should be prioritised, while simultaneously considering ear length, plant height, and ear height. However, this study fails to address the complex climate factors in mountainous areas. Analyzing the relationship between these factors and agronomic traits as well as yield is crucial for breeding varieties suited to local climatic conditions. Future research should delve deeper into the role of mountainous climate factors in maize cultivtion and provide more reliable data support for high-yield maize breeding.

Author Contributions

Conceptualization, Y.Y.; methodology, Y.L.; software, Y.L. and Y.Z.; investigation, Y.Z. and Y.L.; resources, Y.Y. and X.L.; data curation, Y.Z. and Y.L.; writing—original draft preparation, Y.L.; writing—review and editing, Y.Y. and Y.L.; visualization, Y.Y.; supervision, Y.L.; funding acquisition, Y.L. All authors have read and agreed to the published version of the manuscript.

Funding

This research was funded by the Fundamental Research Funds of China West Normal University (grant number 412906 and 465060).

Institutional Review Board Statement

Not applicable.

Data Availability Statement

The data presented in this study are available on request from the corresponding author due to the maize hybrids employed in this study were jointly selected and bred by our laboratory and cooperative units and have certain commercial value, the specific phenotypic traits of these varieties cannot be disclosed to the public for the present.

Conflicts of Interest

The authors declare no conflicts of interest.

References

  1. Shiferaw, B.; Prasanna, B.M.; Hellin, J.; Bänziger, M. Crops that feed the world 6. Past successes and future challenges to the role played by maize in global food security. Food Secur. 2011, 3, 307–327. [Google Scholar] [CrossRef]
  2. Yaheliuk, S.; Fomych, M.; Rechun, O. Global market trends of grain and industrial crops. Commod. Bull. 2024, 1, 134–145. [Google Scholar] [CrossRef]
  3. Zhao, Y.; Su, C. Mapping quantitative trait loci for yield-related traits and predicting candidate genes for grain weight in maize. Sci. Rep. 2019, 9, 16112. [Google Scholar] [CrossRef] [PubMed]
  4. Zhang, H.; Lu, Y.; Ma, Y.; Fu, J.; Wang, G. Genetic and molecular control of grain yield in maize. Mol. Breed. 2021, 41, 18. [Google Scholar] [CrossRef] [PubMed]
  5. Khan, A.S.; Ullah, H.; Shahwar, D.; Fahad, S.; Khan, N.; Yasir, M.; Wahid, F.; Adnan, M.; Noor, M. Heritability and correlation analysis of morphological and yield traits in Maize. J. Plant Biol. Crop Res. 2018, 2, 1–8. [Google Scholar] [CrossRef]
  6. Yahaya, M.; Bello, I.; Unguwanrimi, A. Correlation and path-coefficient analysis for grain yield and agronomic traits of maize (Zea mays L.). Sci. World J. 2021, 16, 10–13. [Google Scholar]
  7. Roy, P.R.; Haque, M.A.; Ferdausi, A.; Al Bari, M.A. Genetic variability, correlation and path co-efficients analyses of selected maize (Zea mays L.) genotypes. Fundam. Appl. Agric. 2018, 3, 382–389. [Google Scholar] [CrossRef]
  8. Wang, J.-H.; Yan, J.-B.; Wang, R.G. Comprehensive evaluation of super sweet maize cross combinations based on principal component analysis, cluster analysis and gray correlation analysis. J. South. Agric. 2020, 51, 1108–1114. [Google Scholar] [CrossRef]
  9. Singh, D.; Swapnil, N.K.; Mohanty, T.A.; Kumar, A.; Kumar, R.; Singh, M.K. Multivariate analysis for yield and its component traits in Quality Protein Maize (QPM). Int. J. Adv. Biochem. Res. 2024, 8, 736–741. [Google Scholar] [CrossRef]
  10. Zhao, J.; Yang, X. Spatial patterns of yield-based cropping suitability and its driving factors in the three main maize-growing regions in China. Int. J. Biometeorol. 2019, 63, 1659–1668. [Google Scholar] [CrossRef]
  11. Chen, J.; Ren, B.; Zhao, B.; Liu, P.; Zhang, J. The environment, especially the minimum temperature, affects summer maize grain yield by regulating ear differentiation and grain development. J. Integr. Agric. 2024, 23, 2227–2241. [Google Scholar] [CrossRef]
  12. Wang, M.; Li, Y.; Ye, W.; Bornman, J.F.; Yan, X. Effects of climate change on maize production, and potential adaptation measures: A case study in Jilin Province, China. Clim. Res. 2011, 46, 223–242. [Google Scholar] [CrossRef]
  13. GB/T 19557.24; Guidelines for Testing the Distinctness, Uniformity, and Stability of New Varieties Plants: Corn. Ministry of Agriculture and Rural Affairs of the People’s Republic of China: Beijing, China, 2018.
  14. Deng, J.-L. Control problems of grey systems. Syst. Control Lett. 1982, 1, 288–294. [Google Scholar] [CrossRef]
  15. Abadassi, J. Maize agronomic traits needed in tropical zone. Int. J. Sci. Environ. Technol. 2015, 4, 371–392. [Google Scholar]
  16. Setimela, P.S.; Gasura, E.; Tarekegne, A.T. Evaluation of grain yield and related agronomic traits of quality protein maize hybrids in Southern Africa. Euphytica 2017, 213, 289. [Google Scholar] [CrossRef]
  17. Naggar, A.A.; Shafik, M.; Musa, R.Y.; Younis, A.S.; Anany, A.H. Genetic variability of maize hybrids and populations and interrelationships among grain yield and its related traits under drought and low N using multivariate analysis. Asian J. Biochem. Genet. Mol. Biol. 2020, 4, 26–44. [Google Scholar] [CrossRef]
  18. Shahrokhi, M.; Khavarikhorasani, S. Study of morphological traits, yield and yield components on 28 commercial corn hybrids (Zea mays L.). Int. J. Agron. Plant Prod. 2013, 4, 2649–2655. [Google Scholar]
  19. Rajasekar, A.; Kumar, A.; Narayan, A.; Niranjana; Singh, S.K. Combining ability studies for grain yield and its component traits in sweet corn (Zea mays var. saccharata). J. Adv. Biol. Biotechnol. 2024, 27, 1070–1082. [Google Scholar] [CrossRef]
  20. Prakash, R.; Ravikesavan, R.; Vinodhana, N.K.; Senthil, A. Genetic variability, character association and path analysis for yield and yield component traits in maize (Zea mays L.). Electron. J. Plant Breed. 2019, 10, 518–524. [Google Scholar] [CrossRef]
  21. Ma, X.; Wang, P.; Wu, X.; Jin, X.; Wang, H.; Chen, S. Grey correlation degree and path analysis of agronomic traits and yield per plant of maize. J. Henan Inst. Sci. Technol. (Nat. Sci. Ed.) 2023, 51, 7–13. [Google Scholar]
  22. Ghimire, B.; Timsina, D. Analysis of yield and yield attributing traits of maize genotypes in Chitwan, Nepal. World J. Agric. Res. 2015, 3, 153–162. [Google Scholar] [CrossRef]
  23. Ahmed, N.; Chowdhury, A.K.; Uddin, M.S.; Rashad, M.M.I. Genetic variability, correlation and path analysis of exotic and local hybrid maize (Zea mays L.) genotypes. Asian J. Med. Biol. Res. 2020, 6, 8–15. [Google Scholar] [CrossRef]
  24. Anderson, J.T.; Wagner, M.R.; Rushworth, C.A.; Prasad, K.V.; Mitchell-Olds, T. The evolution of quantitative traits in complex environments. Heredity 2014, 112, 4–12. [Google Scholar] [CrossRef] [PubMed]
  25. Yue, H.; Gauch, H.G.; Wei, J.; Xie, J.; Chen, S.; Peng, H.; Bu, J.; Jiang, X. Genotype by environment interaction analysis for grain yield and yield components of summer maize hybrids across the Huanghuaihai region in China. Agriculture 2022, 12, 602. [Google Scholar] [CrossRef]
  26. Pepin, N.C.; Arnone, E.; Gobiet, A.; Haslinger, K.; Kotlarski, S.; Notarnicola, C.; Palazzi, E.; Seibert, P.; Serafin, S.; Schöner, W.; et al. Climate changes and their elevational patterns in the mountains of the world. Rev. Geophys. 2022, 60, e2020RG000730. [Google Scholar] [CrossRef]
  27. Hewitt, K.; Mehta, M. Rethinking risk and disasters in mountain areas. J. Alp. Res. Rev. Geogr. Alp. 2012, 100-1. [Google Scholar] [CrossRef]
  28. Wang, Y.H.; Li, X.B.; Xin, L.J. Characteristics of cropland fragmentation and its impact on agricultural production costs in mountainous areas. J. Nat. Resour. 2019, 34, 2658–2672. [Google Scholar] [CrossRef]
  29. Zhu, X.-G.; Long, S.P.; Ort, D.R. Improving photosynthetic efficiency for greater yield. Annu. Rev. Plant Biol. 2010, 61, 235–261. [Google Scholar] [CrossRef]
  30. Givnish, T.J. Adaptation to sun and shade: A whole-plant perspective. Funct. Plant Biol. 1988, 15, 63–92. [Google Scholar] [CrossRef]
Figure 1. Correlations among 11 agronomic traits in 59 maize varieties. GP, PH, EH, EL, EG, BTL, KRE, KRN, KW, SP, and YP represent growth period, plant height, ear height, ear length, ear girth, bald tip length, kernel rows ear−1, kernel numbers row−1, 100-kernel weight, kernel ratio, and yield plant−1, respectively. * Correlation is significant at 0.05 level. ** Correlation is significant at 0.01 level.
Agriculture 14 01703 g001
Figure 2. PCA of 11 agronomic traits and 59 maize hybrids grown in mountainous areas. (a) Scree plot and respective eigenvalues; (b) Biplot for 59 maize hybrids and 11 agronomic traits. GP, PH, EH, EL, EG, BTL, KRE, KRN, KW, SP, and YP represent growth period, plant height, ear height, ear length, ear girth, bald tip length, kernel rows ear−1, kernel numbers row−1, 100-kernel weight, kernel ratio, and yield plant−1, respectively.
Agriculture 14 01703 g002
Figure 3. Dendrogram analysis based on two-way hierarchal clustering among 11 agronomic traits and 59 maize varieties. GP, PH, EH, EL, EG, BTL, KRE, KRN, KW, SP, and YP represent growth period, plant height, ear height, ear length, ear girth, bald tip length, kernel rows ear−1, kernel numbers row−1, 100-kernel weight, kernel ratio, and yield plant−1, respectively. Letters A–D represent that the 11 agronomic traits is classified into four groups. I and II indicate that 59 maize varieties is divided into two groups.
Agriculture 14 01703 g003
Table 1. Descriptive statistics of agronomic traits in 59 maize varieties.
Agronomic TraitsMinimumMaximumMeanSDKURTSKEWCV %
GP (day)132.22143.78136.352.390.190.451.75
PH (cm)254.07326.31292.5515.07−0.02−0.255.15
EH (cm)108.96151.32126.089.240.300.617.33
EL (cm)17.5721.1819.210.78−0.200.254.04
EG (cm)4.926.785.650.54−0.980.589.61
BTL (cm)0.351.880.870.330.520.6538.19
KRE14.6419.3616.801.15−0.420.176.84
KN32.3939.8735.891.67−0.250.294.66
KW (g)29.7940.6933.692.510.410.707.45
SP (%)79.6886.1382.591.51−0.43−0.091.83
YP (g)161.17211.13185.5611.33−0.480.026.11
SD = Standard Deviation, KURT = kurtosis, SKEW = skewness, CV = Coefficient of Variability.
Table 2. Path analysis of main agronomic traits and yield per plant of maize varieties.
FactorPearson CorrelationDirect Path CoefficientIndirect Path Coefficient
GP-YPPH-YPEH-YPEL-YPEG-YPBTL-YPKRE-YPKRN-YPKW-YPSP-YPTotal
GP0.468 **0.084 −0.0130.0250.007−0.086−0.008−0.1070.0930.505−0.0440.372
PH0.092−0.0640.017 0.0720.0100.064−0.048−0.1650.0700.2490.0030.272
EH0.0430.0920.023−0.050 0.009−0.041−0.047−0.1560.1280.080−0.008−0.062
EL0.2390.0250.022−0.0240.033 −0.0510.022−0.3640.3060.2520.0000.196
EG0.0900.191−0.0380.022−0.020−0.007 −0.0380.185−0.029−0.1710.010−0.086
BTL−0.1890.169−0.0040.018−0.0260.003−0.042 0.064−0.131−0.230−0.009−0.357
KRE−0.0950.782 **−0.0120.014−0.018−0.0120.0450.014 −0.328−0.522−0.026−0.845
KRN0.280 *0.576 **0.014−0.0080.0210.013−0.010−0.039−0.445 0.1230.014−0.317
KW0.610 **0.967 **0.044−0.0160.0080.007−0.034−0.040−0.4220.073 −0.005−0.385
SP−0.1170.093−0.040−0.0020.0080.0000.021−0.016−0.2190.089−0.057 −0.216
GP, PH, EH, EL, EG, BTL, KRE, KRN, KW, SP, and YP represent the growth period, plant height, ear height, ear length, ear girth, bald tip length, kernel rows ear−1, kernel numbers row−1, 100-kernel weight, kernel ratio, and yield plant−1, respectively; ** and * indicate significance at the 0.01 and 0.05 level, respectively.
Table 3. Correlation matrix of grey relational analysis among 11 agronomic traits.
GPPHEHELEGBTLKREKRNKWSP
YP0.7780.7140.7220.7480.7170.6680.6840.7430.7910.710
27536109418
GP 0.7420.7570.7430.6740.7280.6960.7410.7760.680
423967518
PH0.710 0.8290.7320.6510.6800.6580.6920.7180.718
5 12978643
EH0.7120.818 0.7250.6450.6540.6350.6970.6940.682
31 2879456
EL0.7120.7330.739 0.6570.7210.6660.7460.7040.706
532 948176
EG0.6260.6380.6490.644 0.6560.6910.6510.6610.692
9867 42531
BTL0.7130.6960.6870.7360.685 0.7220.7070.6940.716
46819 2573
KRE0.6760.6730.6660.6790.7160.719 0.6740.6650.663
467321 589
KRN0.7260.7080.7280.7600.6820.7070.677 0.7130.708
3521879 46
KW0.7580.7300.7220.7170.6860.6910.6650.709 0.691
12348695 7
SP0.6790.7470.7270.7350.7330.7300.6830.7230.710
915234867
GP, PH, EH, EL, EG, BTL, KRE, KRN, KW, SP, and YP represent growth period, plant height, ear height, ear length, ear girth, bald tip length, kernel rows ear−1, kernel numbers row−1, 100-kernel weight, kernel ratio, and yield plant−1, respectively. The values represent the grey relational degree (upper) and sequence (lower).
Table 4. Eigenvalues, proportion of the total variance represented by first four principal components, and component loading of different characters in maize.
ParticularsPC1PC2PC3PC4
Eigen value (root)3.3481.7141.5731.435
Percentage of variance (%)30.43315.58314.29713.05
Cumulative proportion30.43346.01660.31373.362
GP0.6180.648−0.134−0.063
PH0.662−0.221−0.3390.504
EH0.627−0.217−0.3680.532
EL0.69−0.249−0.096−0.324
EG−0.476−0.0490.60.29
BTL−0.2190.048−0.468−0.704
KRE−0.6390.412−0.1960.386
KRN0.562−0.3770.345−0.227
KW0.6670.3560.367−0.09
SP−0.067−0.6540.363−0.014
YP0.4580.5140.540.027
Table 5. Principal component scores of the top 15 maize hybrid varieties.
RankingMaize HybridsSynthesis ScorePC1PC2PC3PC4
1Chuandan 20111.152.070.701.54−0.87
2Chuandan 20121.011.910.560.320.21
3Le 19181.011.372.10−0.420.41
4Minyu 2020.961.600.83−0.801.58
5Jinhe 8800.851.410.070.470.92
6Jifeng 880.801.510.501.05−0.77
7Chuanxiyu 70.751.570.200.87−0.63
8Shanyu 80.601.08−1.160.721.42
9Yayu 22890.580.720.020.411.10
10Miandan 7170.561.40−0.610.93−0.39
11Yayu 96980.521.141.140.62−1.80
12Shengkeyu 2020.460.600.700.52−0.19
13SZ17010.38−0.531.060.861.20
14Shufeng 6160.370.681.41−0.07−1.13
15Zhenghong 9390.371.020.34−0.37−0.33
Disclaimer/Publisher’s Note: The statements, opinions and data contained in all publications are solely those of the individual author(s) and contributor(s) and not of MDPI and/or the editor(s). MDPI and/or the editor(s) disclaim responsibility for any injury to people or property resulting from any ideas, methods, instructions or products referred to in the content.

