Article

A Low-Tech Approach to Mobilize Nutrients from Organic Residues to Produce Bioponic Stock Solutions

1
Fraunhofer Institute for Interfacial Engineering and Biotechnology, Nobelstr. 12, 70569 Stuttgart, Germany
2
Hans-Ruthenberg Institute for Tropical Agricultural Sciences, University of Hohenheim, Garbenstr. 13, 70599 Stuttgart, Germany
*
Author to whom correspondence should be addressed.
Agriculture 2024, 14(6), 928; https://doi.org/10.3390/agriculture14060928
Submission received: 9 April 2024 / Revised: 2 June 2024 / Accepted: 4 June 2024 / Published: 12 June 2024
(This article belongs to the Special Issue Innovative Hydroponic Systems for Sustainable Agriculture)

Abstract

:
Organic residues, as a nutrient source suitable of producing solutions for hydroponic crop production, have the potential to reduce the dependence on mineral fertilizers. Especially in remote and resource-constrained regions, organic residues might be the only option to produce hydroponic nutrient solutions. However, nutrient solutions made from organic residues, called bioponic solutions, are usually unbalanced in their nutrient composition, which leads to deficiencies and poor plant growth. This study aimed to experimentally develop a low-tech approach to produce bioponic stock solutions rich in NO3, P, and K, to create a balanced bioponic solution. The mixed bioponic solution contained 58 mg L−1 NH4+-N, 43 mg L−1 NO3-N, 50 mg L−1 PO43−-P, and 246 mg L−1 K+. This approach resulted in satisfactory levels of P, K and micronutrients. The solution was tested pure and spiked with Ca(NO3)2 on lettuce in comparison with a mineral Hoagland nutrient solution. Neither the bioponic nor the spiked bioponic solution achieved comparable lettuce yields to the Hoagland solution. The poor growth of the plants in the bioponic solution was attributed to an unfavorable NH4+:NO3 ratio, high microorganism load, and elevated pH levels. However, the approach of preparing bioponic stock solutions could be promising for future research into the production of balanced bioponic nutrient solutions from organic residues.

1. Introduction

Hydroponics, a soilless cultivation method, has the potential to improve food security in remote environments where rainfed agriculture is at high risk, such as drylands. Drylands cover about 35% of the earth’s land surface and are home to 20% of the world’s population [1]. With their semi-arid to arid climate [1], drylands are less suitable for horticulture and pastoralism is the main form of land use [2]. The use of hydroponics in these regions could make a decisive contribution to diversifying the predominantly meat-based diet [3,4], and thus to food security. However, mineral fertilizers, required to produce hydroponic nutrient solutions, are usually difficult to obtain in remote areas [5,6]. Therefore, nutrient solutions derived from locally available organic residues (bioponics) would be particularly interesting. This interest is reflected in the World Food Programme’s H2Grow initiative, which aims to make the potential of hydroponics accessible to a wider range of crop producers via low-tech approaches [7].
In previous studies, animal manure [8,9,10,11], household waste [12], and plant residues [13,14] were used to produce bioponic solutions with varying levels of success. Thus, the challenge still evident in producing bioponic solutions is to mineralize the nutrients bound in the organic matter into soluble, plant-available forms, and provide all essential nutrients, balanced well for optimal plant growth. The most commonly applied methods to produce bioponic solutions are the aerobic [11,15,16,17] and anaerobic digestion [9,10,14] of organic matter in an aqueous solution.
Anaerobic digestion results in the partial gasification, liquefaction, and mineralization of organic material, while CH4 and CO2 are released, leaving behind stable organic residues and a nutrient-rich digestate [18]. Several studies investigated the suitability of such digestate as a liquid fertilizer for hydroponics. Liedl et al. (2004) [10] used anaerobic chicken manure digestate to cultivate lettuce using a nutrient film technique. They compared different dilutions of the digestate and achieved the best results at a digestate dilution to a concentration of 100 mg L−1 total N. In two out of four trials, the harvested shoot fresh mass did not differ significantly from the mineral control solution [10]. Similarly, Krishnasamy et al. (2012) [9] tested different dilutions of food and vegetable waste digestate on the growth of silverbeet in deep water culture. The bioponic solution yielded only up to 8% of fresh mass of the mineral control. In both studies, the reduced plant growth in bioponic solutions was associated with phytotoxic NH4+ concentrations, low NO3 availability, low dissolved oxygen concentrations, high chemical oxygen demand, high pH, and phytotoxic compounds [9,10]. These findings are in line with other studies that emphasize the need for diluted digestate as a bioponic solution to reduce phytotoxic effects, even though it comes at the expense of nutrient concentration [14,19].
In aerobic digestion, organic material is oxidized by heterotrophic or autotrophic microorganisms [20]. In this process, nitrifying bacteria transform NH4+ into NO3, thus minimizing toxic effects of excessive NH4+. Accordingly, Shinohara et al. (2011) [16] were able to nitrify all NH4+ in an aerated aqueous solution containing soluble fish-based fertilizer. Further, the combination of anaerobic digestion for mineralization and a subsequent aerobic treatment for nitrification has been investigated in several studies [8,12,21,22]. However, problems such as phytotoxicity, high pH, and low and imbalanced nutrient concentrations, causing poor plant growth, also occurred regularly with aerobically produced bioponic solutions [8,11,12,21,22].
By processing individual substrates in separate reactors, the present study aimed to create bioponic stock solutions rich in either NO3, P, or K to address the problem of imbalanced nutrient concentrations in bioponic solutions. Those bioponic stock solutions were mixed in the optimal ratio to create a balanced bioponic solution. The study intends to contribute to the advancement of bioponics, in particular for applications, to promote food security in resource-constrained regions.

2. Materials and Methods

2.1. Production of Bioponic Stock Solutions

The experiment was conducted at the facilities of Fraunhofer IGB Stuttgart.
As the raw material for the bioponic solutions, nutrient-rich organic waste that could not be directly used as food or feed was selected. Thus, to produce bioponic stock solutions, blood meal, bone meal, and potato peel were selected as N, P, and K-rich organic residues, respectively. The careful blend of these was intended to produce a nutrient-balanced solution. Potato peel (Sautter potato processing, Bondorf, Germany) was dried at 110 °C for 48 h and ground to a powder using the Grindomix GM 200 (Retsch, Haan, Germany) with 8000 rpm for 30 s. Blood meal and bone meal (Beckmann & Brehm, Beckeln, Germany) were not further processed before digestion. N was analyzed using the Kjeldahl method [23] with the digestion apparatus K20-Behrotest (Behr laboratory technology, Düsseldorf, Germany) and the Vapodest 45s (Gerhardt analytical systems, Königswinter, Germany) for distillation. For P analysis, the organic residues were digested in the microwave [24], using the ETHOS.lab microwave (mws laboratory solutions, Leutkirch im Allgäu, Germany). The digestate was analyzed for PO43−-P using a Continuous Flow Analysis system (Alliance instruments, Salzburg, Austria). A hot water extract [25] was analyzed for K+ using the Jenway PFP7 flame photometer (Cole-Parmer, East Soccon, UK). The potato peel was only analyzed for K concentration with the same method (Table 1).
Each residue was processed in an individual 60 L HD polyethylene barrel with a screw-on lid as anaerobic digester. Anaerobic conditions for the digestion of blood meal, bone meal, and potato peel were created by sealing the reactors with a screwable lid and installing a gas wash bottle, allowing forming gas to escape.
A two-step process was used to produce the bioponic NO3 stock solution. The first step was the production of an NH4+ rich digestate from blood meal. In a first run, 370 g fresh mass blood meal and 225 g compost, as a source of microorganisms (Compost Plant Kirchheim, Kirchheim unter Teck, Germany), were anaerobically digested in 45 L of deionized water. Compost and blood meal were added in four 145-micron Baven mash bags also containing disinfected stones to prevent floating. To minimize NH3 losses, the pH was lowered to 6.0 by the manual addition of acetic acid when the pH increased above 7. Every third day, 1.5 g glucose per liter was added as readily available feed for heterotrophic anaerobic microorganisms. This first run lasted for 69 days and was designed to test the suitability of blood meal in releasing NH4+ under the mentioned conditions. On the last day of experiment, the organic residues were removed from the reactor and the second run was started. The barrel and mash bags of the first run were re-used. No new compost was added; otherwise, the same procedure as the first run was followed for 54 days. Based on the addition of compost and blood meal and their nutrient concentrations (Table 1, data from the composting plant [26]), a maximum NH4+-N yield of 1251 mg L−1 in the first run and 1174 mg L−1 in the second run was to be expected.
In the second step the NH4+-rich digestate was gradually transferred into an aerated moving bed biofilm reactor (MBBR) [27] for nitrification. The reactor was started on day 84 of the experiment by mixing 10 L desalinated water and 10 L activated sewage sludge (Teaching and Research Sewage Treatment Plant of the University of Stuttgart, Stuttgart, Germany). For an increased surface area, 1400 g of biofilters Kaldnes K1 (AnoxKaldnes K1-0.95 MBBR, Aquacultur Fischtechnik GmbH, Nienburg, Germany), were added to the reactor. Every third day, 180 g of glucose was added. The temperature was maintained at 30 °C and dissolved oxygen was kept between 4.5 and 5.5 mg L−1 by four 13 cm Ø Pondlife aeration plates (Thodi UG, 64319 Pfungstadt, Germany) connected to an air pump. The dissolved oxygen was monitored using the LDO HQ-10 O2 oxygen meter (Hach Lange, Düsseldorf, Germany). To minimize NH3 losses, the CLM253-ID0010 conductivity transmitter LIQUISYS-M (Endress+Hauser, Weil am Rhein, Germany) lowered the pH to 6.7 by adding acetic acid if the pH exceeded 7.6. The MBBR ran under these conditions for 21 days with the objective of developing a bacterial community capable of nitrifying the added N loads. On 16 days between day of experiment 105 and 123 one liter of blood meal digestate was fed to the MBBR to produce the bioponic NO3 stock solution.
For producing the P bioponic stock solution, 195 g fresh mass bone meal was digested anaerobically in 45 L deionized water for 123 days. The pH of the digestate was manually lowered to 4.5 if it exceeded 5.5 by adding acetic acid. Below a pH of 5.5 the main component of bones, hydroxyapatite Ca5(PO4)3(OH), dissolves to a greater extent [28,29], and plant-available PO43− is released. The temperature within the reactor was maintained at 30 °C. A maximum of 829 mg L−1 PO43−-P could theoretically be mobilized from the bone meal.
The bioponic K stock solution was produced by the anaerobic digestion of 3642 g potato peel powder in 30 L deionized water for 123 days. A total of 1992 g of the powder was added on the day 0 of the experiment, 910 g on day 24 of the experiment, and 740 g on day 84 of the experiment. A maximum of 2889 mg L−1 K+ could be mobilized from the potato peel.
On day 123, the remaining organic residues were removed, and the solutions were subsequently centrifuged at 7500 rpm for ten minutes (Beckman-coulter avanti j-26 xp, Krefeld, Germany) and filtered using 185 mm pleated filters. All stock solutions were stored at room temperature. The P and K stock solutions were stored in closed barrels, while the NO3 stock solution was aerated to maintain adequate dissolved oxygen levels for the nitrifying microorganisms until used in the hydroponic experiment.
The pH as well as dissolved oxygen was measured, and samples of the digestates were taken every third day for the first twelve days of the experiment. Consequently, samples were taken every twelfth day. The second blood meal digestion run was sampled every twelfth day and the MBBR solution every sixth day from the moment the transfer of blood meal digestate was carried out.
The samples were analyzed for NH4+ in the blood meal digestate, PO43− in bone meal digestate, K+ in potato peel digestate, and NH4+, NO2, and NO3 in the MBBR solution using LCK cuvette tests (Hach-Lange, Düsseldorf, Germany).
Samples of each solution from day 123 of the experiment were analyzed for NH4+, NO3 and PO43− using Continuous Flow analysis and for K+ and Na+ using a flame photometer (Cole-Parmer Jenway PFP7, East Soccon, UK). Furthermore, these samples were analyzed at the core facility of the University of Hohenheim for magnesium, sulfate, iron, manganese, copper, zinc, molybdenum, and boron by ICP-OES. At each sampling time, three samples were taken from the respective reactor and analyzed.

2.2. Testing the Bioponic Solution on Lettuce

The bioponic solution was tested on lettuce (Lactuca sativa L. var. Hawking) in a deep water culture system at the University of Hohenheim in a climate chamber (CLF PlantClimatics E-75L1, Wertingen, Germany), with 12 h of light, a temperature ranging between 20–22 °C and a relative humidity between 55–65%. The system consisted of twelve one-liter polyethylene containers, sealed with a detachable lid. A polystyrene sponge inserted in a hole in the center of each lid held the plants. The buckets were filled with 1 L of the respective nutrient solution and aerated via flexible hoses connected to an air pump for 45 min h−1.
Lettuce seeds of the variety Salanova Hawking (Rijk Zwaan GmbH, Welver, Germany) were germinated in moist quartz sand and grown for 22 days before transplanted into the containers. For the first seven days, after transplanting, the seedlings were grown in a diluted Hoagland solution (25%) [30], the following seven days in a 75% Hoagland solution, and the last ten days with undiluted Hoagland solution. After this initial phase, the bioponic solution, mixed from the bioponic NO3, P, and K stock solutions, was tested against a control of undiluted Hoagland as mineral solution. The mixing ratio of the bioponic solution was based on the mean concentrations of different hydroponic nutrient solutions (Table 2). Additionally, a solution was tested, consisting of the bioponic P and K stock solutions and spiked with Ca(NO3)2. The spiked bioponic solution had the same NO3-N concentration as the Hoagland control. The pH of each renewed solution was adjusted to 6.0 with acetic acid. Each treatment was tested with four replications for 25 days.
To compensate for potential nutrient deficiencies in the bioponic solution, all nutrient solutions were replaced twice a week, alternately, after three or four days. For this purpose, the nutrient solutions were re-mixed from the respective stock solutions. The Electrical Conductivity (EC) was measured with a AP2 EC meter (HM Digital, Carson, CA, USA). At each nutrient solution replacement, the fresh mass of the plants was determined.
Weekly, three samples of the fresh bioponic and spiked bioponic nutrient solution were taken to determine the exact mass of added nutrients. The samples were stored at 4 °C for two months and analyzed for NH4+, NO3, PO43−, and K+ via Continuous Flow analysis and the flame photometer.
At the final harvest, shoots and roots of each plant were separated, and the fresh and dry mass determined. The dried, finely ground shoots were analyzed at the core facility of the University of Hohenheim for C, N, P, K, Ca, Mg, S, Fe, B, Zn, Mn, Mo, and Cu using ICP-OES.
Three samples were taken of each remaining NO3, P, and K bioponic stock solution and were analyzed along with the samples taken during cultivation.

2.3. Statistical Analyses

Graphs were plotted using SigmaPlot 12.5 2011 Systat Software Inc. (San Jose, CA, USA). The harvested plant yield was analyzed using a one-way ANOVA followed by pairwise t-tests with Bonferroni correction. The results of the elemental analysis of the plants were analyzed using the non-parametric Kruskal–Wallis test followed by Dunn’s test with Bonferroni correction. A linear regression analysis was performed on the PO43−-P mobilized from bone meal versus the day of experiment. R-Studio 2022.12.0 Build 353, Posit Software, PBC (Boston, MA, USA) was used for the statistical analysis with a significance level of p ≤ 0.05.

3. Results

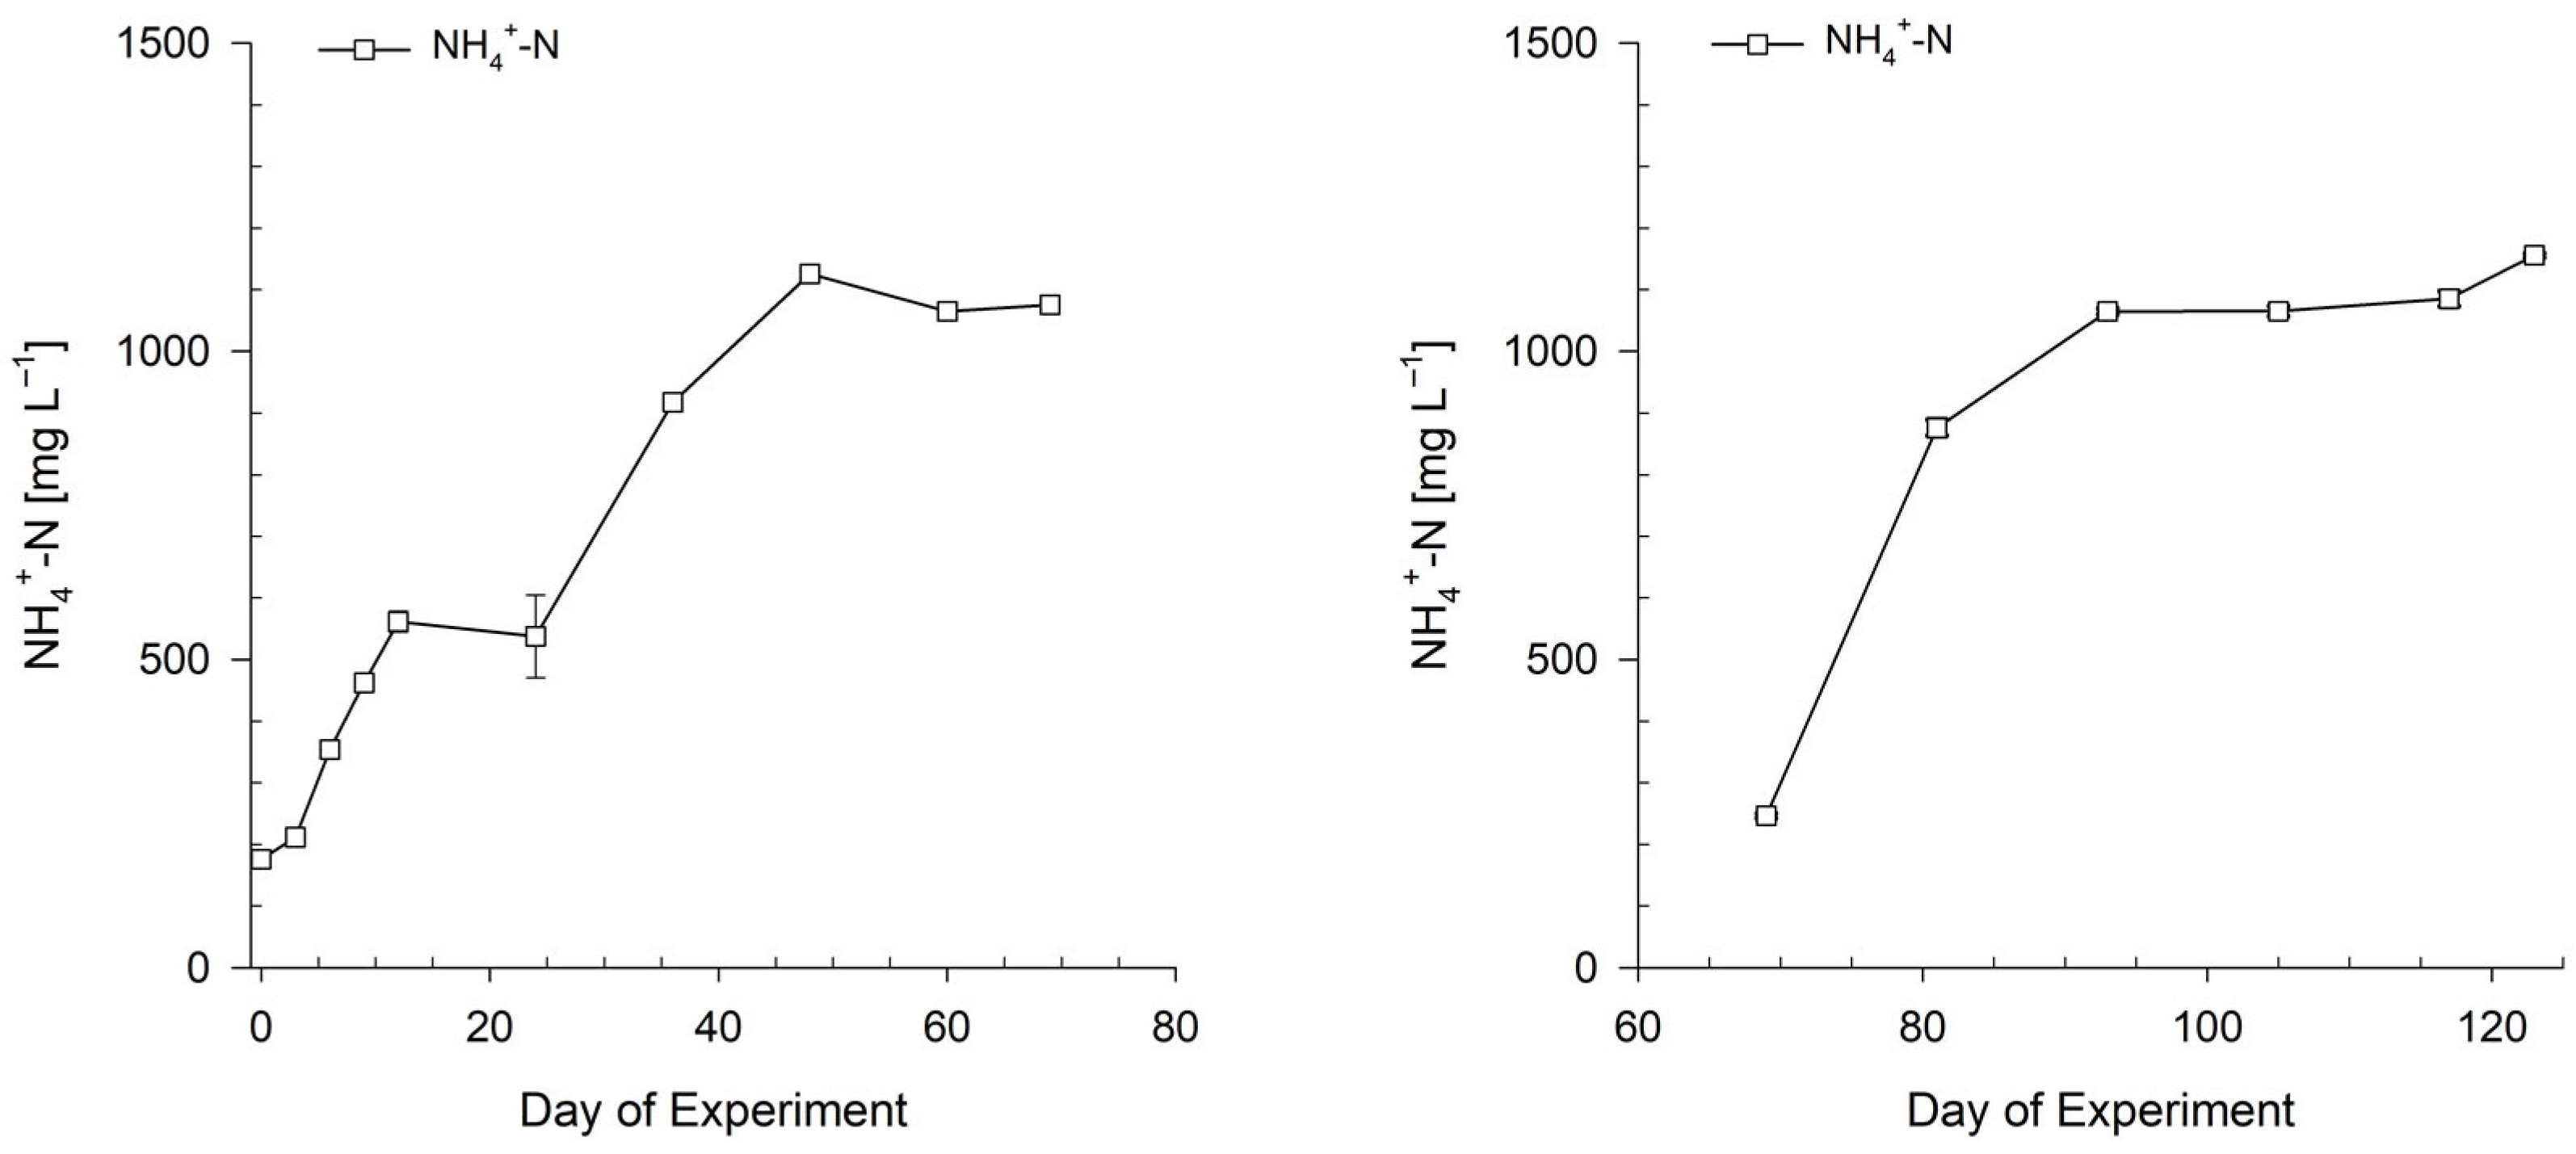
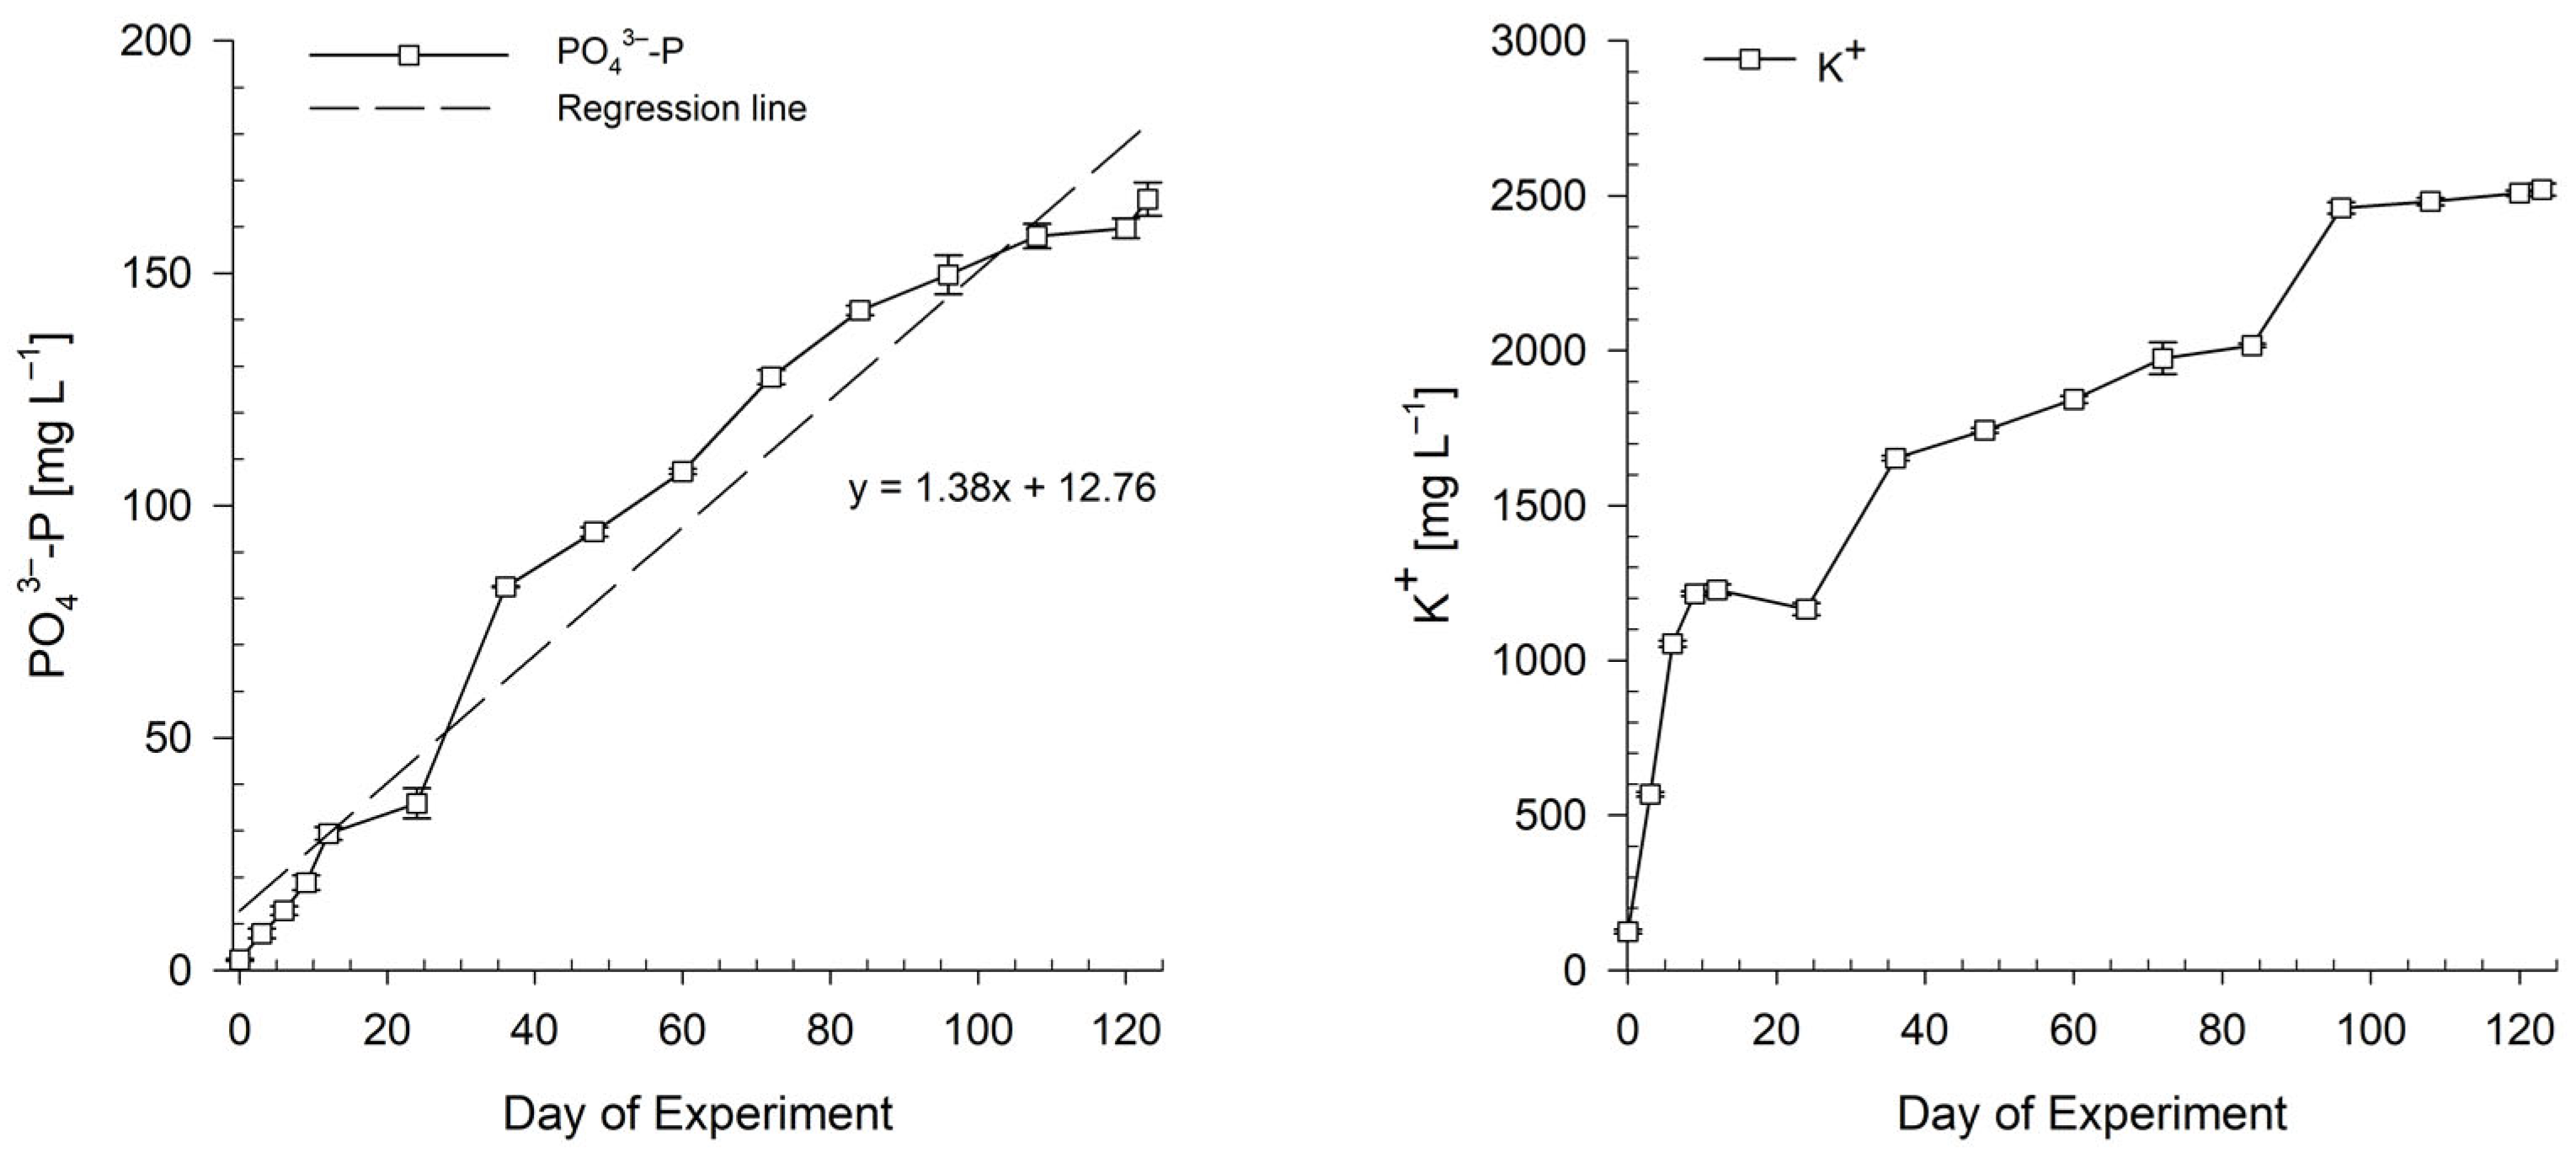
3.1. Preparation of Bioponic Stock Solutions

The anaerobic digestion of blood meal proved efficient and resulted in high NH4+ concentrations. In the first run, the highest NH4+-N concentration, with 1126 ± 7.8 mg L−1 on day 48 of the experiment, exceeded the value of 1000 mg L−1 (Figure 1), corresponding to a mineralization of 90% of the total N contained in the blood meal and compost into NH4+-N. In the second run, the NH4+-N concentration exceeded 1000 mg L−1 after only 24 days on day 93 of the experiment (Figure 1). The highest concentration in this run was measured after 54 days (day of experiment 123), at the end of the experiment. At this point in time 98% of the total added N were mineralized, resulting in an NH4+-N concentration of 1156 ± 3.3 mg L−1.
The concentration of NO3 did not increase notably during the first twelve days after transferring blood meal digestate into the MBBR (Figure 2). Only towards the last day of the experiment did NO3 increase strongly compared to the starting concentration on day 105, from 43.8 mg L−1 to 68.9 ± 0.3 mg L−1.
Based on the NH4+-N concentrations measured in the anaerobic digestate of blood meal on days 105, 117, and 123 of the experiment (Figure 1), a total of 17,632 mg NH4+-N was transferred to the MBBR. The increase in the NO3-N concentration in the MBBR indicated a nitrification of 876 mg of NH4+-N at the given volume, corresponding to a conversion of 5% of the added NH4+-N. As can be clearly seen in Figure 2, NH4+ was first converted to NO2 and then to NO3, resulting in a bell-shaped curve for NO2.
The anaerobic digestion of bone meal mineralized the contained P into PO43−-P almost linearly over the 123-day experimental period (Figure 3). A linear regression analysis of the PO43−-P data confirmed a significant correlation between the days of the experiment and the concentration of PO43−-P (p < 0.001), with an R2 = 0.968. The highest concentration of 166.0 ± 2.9 mg L−1 PO43−-P corresponding to a total P mineralization rate of 19.7% was measured on the last day of the experiment (Figure 3).
The addition of potato peel powder on days 0, 24, and 84 of the experiment was reflected in sharp increases in the K+ concentrations during the anaerobic digestion (Figure 3). The highest K+ concentration of 2520 ± 20 mg L−1 was measured on day 123 of the experiment, which corresponded to a mineralization rate of 87% of the potato peel K.
Table 3 shows the elementary analysis for each bioponic stock solution and the blood meal digestate on day 123 of the experiment. NH4+ showed by far the highest nutrient concentration in the blood meal digestate (Table 3).
In the NO3 stock solution, for which high NO3 concentrations were targeted, a slightly higher Ca concentration than NO3-N concentration was measured (Table 3). The NH4+-N concentration in the NO3 stock solution was also high, with 44% of the NO3-N concentration.
High concentrations of PO43−-P, Ca, and NH4+-N were measured in the P solution (Table 3).
The bioponic K stock solution had the highest nutrient concentration of the targeted nutrient (Table 3). In addition, high Mg, S, Fe and Zn concentrations were measured in the K stock solution compared to the other produced solutions.
All essential nutrients were present in at least one of the stock solutions. Na was highest in the blood meal digestate, with 25.3 ± 1.2 mg L−1 (Table 3).

3.1.1. Mixing Ratio of Bioponic Stock Solutions

Targeted on the mean values of the nutrient concentrations in the mineral nutrient solutions shown in Table 2, the mixing ratios of the stock solutions followed their nutrient concentrations (Table 3) to obtain NH4+-N, NO3-N, PO43−-P and K+ concentrations that were as similar as possible. The resulting mixing ratio equated to 621.3 mL NO3 stock solution, 297.0 mL P stock solution, and 81.7 mL of the K stock solution per liter of bioponic solution. The resulting concentrations were 58.2 ± 0.6 mg L−1 NH4+-N, 42.9 ± 1.0 mg L−1 NO3-N, 50.0 ± 1.1 mg L−1 PO43−-P, and 246.3 ± 4.2 mg L−1 K+ (Figure 4). Thus, the PO43−-P and K+ concentrations were perfectly in line with the target values, whereas the NH4+-N concentration exceeded the target value by a factor of 2.24 and the NO3-N concentration only reached a factor of 0.28 of the target value.
The NH4+:NO3 ratio of 1.4:1 of the final solution was thus below optimal compared to the recommended ratio of 1:3 for lettuce in closed hydroponics [32]. The concentrations of Ca, B, Zn, Mg, Mn and Mo of the bioponic solution were within the range of the reference table, whereas the concentrations of Cu and Fe were above and S below the range. The bioponic solution had a Na+ concentration of 20.2 ± 0.6 mg L−1 (see Supplementary Materials, Table S1).
Due to the unfavorable NH4+:NO3 ratio, a spiked bioponic solution was prepared in addition. It was mixed from 297.0 mL P stock solution and 93.5 mL K stock solution and brought to a NO3-N concentration with Ca(NO3)2 solution that corresponded to that in the Hoagland control solution (196.0 mg L−1 NO3-N). The solution was made up to 1 L with demineralized water. The use of Ca(NO3)2 led to a more than doubling of the Ca concentration in the spiked bioponic solution compared to the Hoagland control (Figure 4) and the referenced nutrient solutions (Table 2). In the spiked bioponic solution, fewer nutrient concentrations met the range of the reference table. While Fe and Zn had higher concentrations, Mg, S, B, Cu, and Mn were below the range.

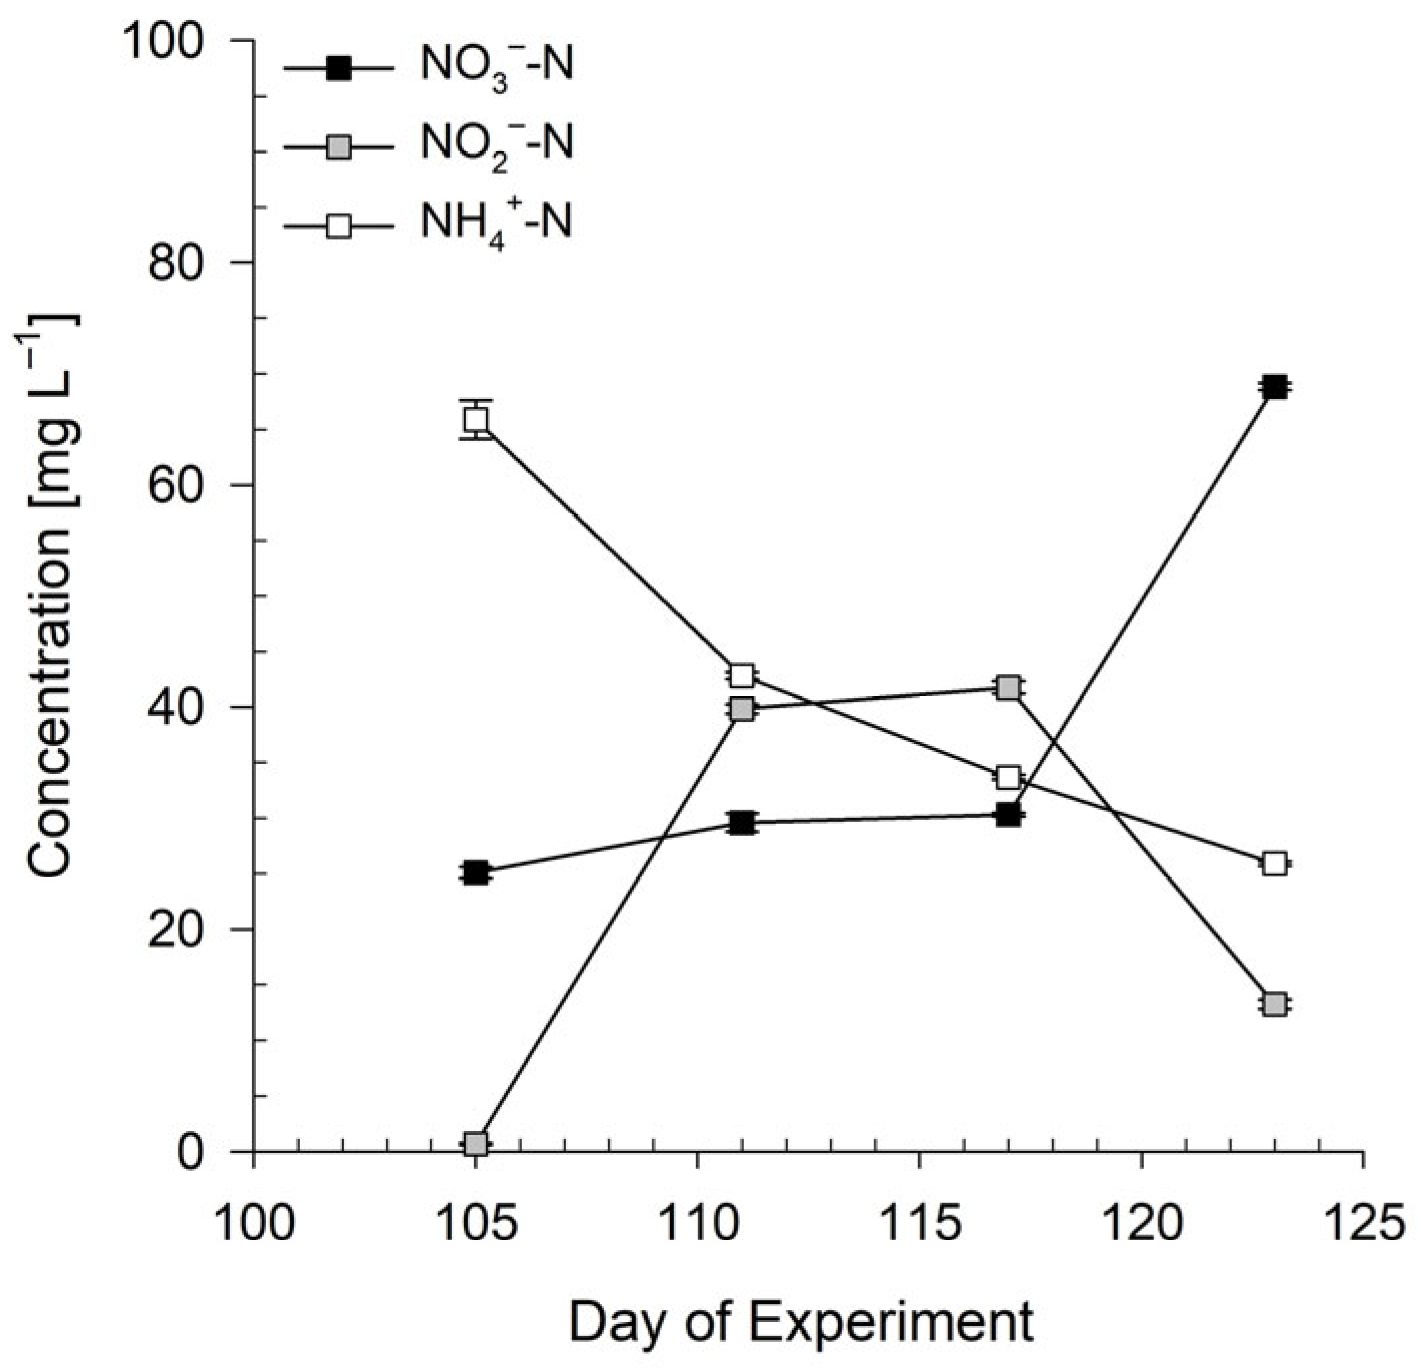
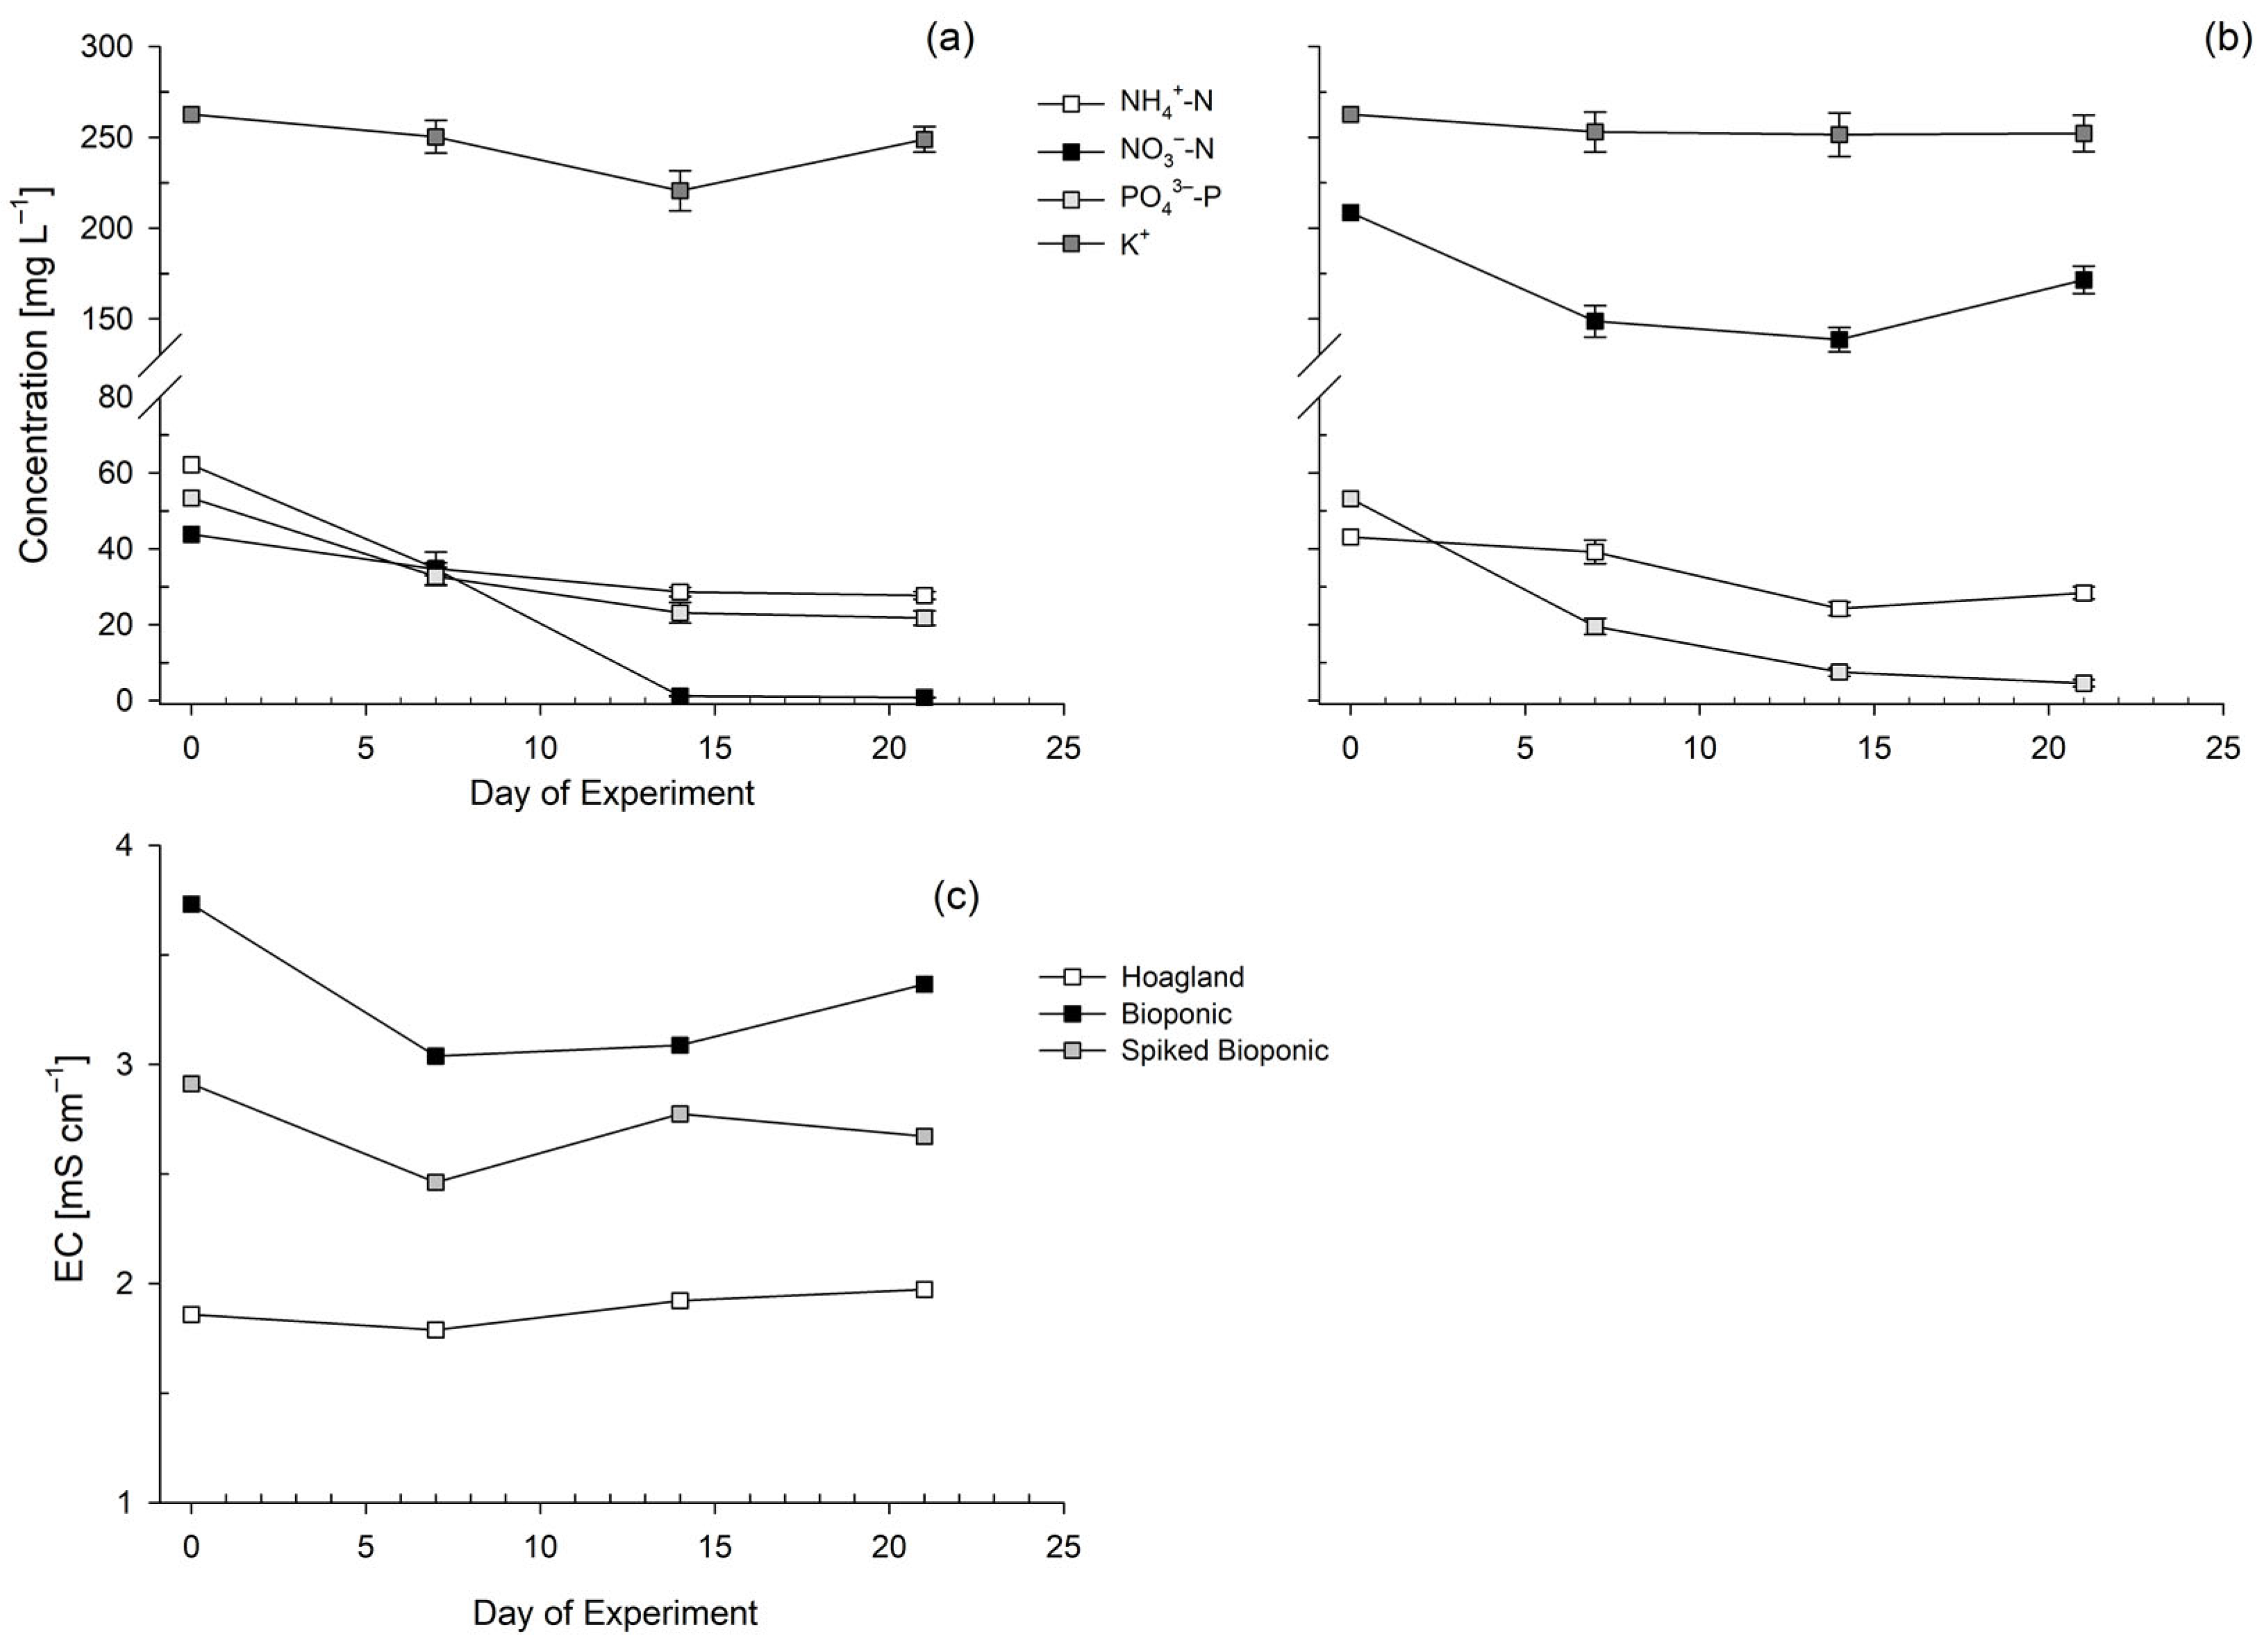
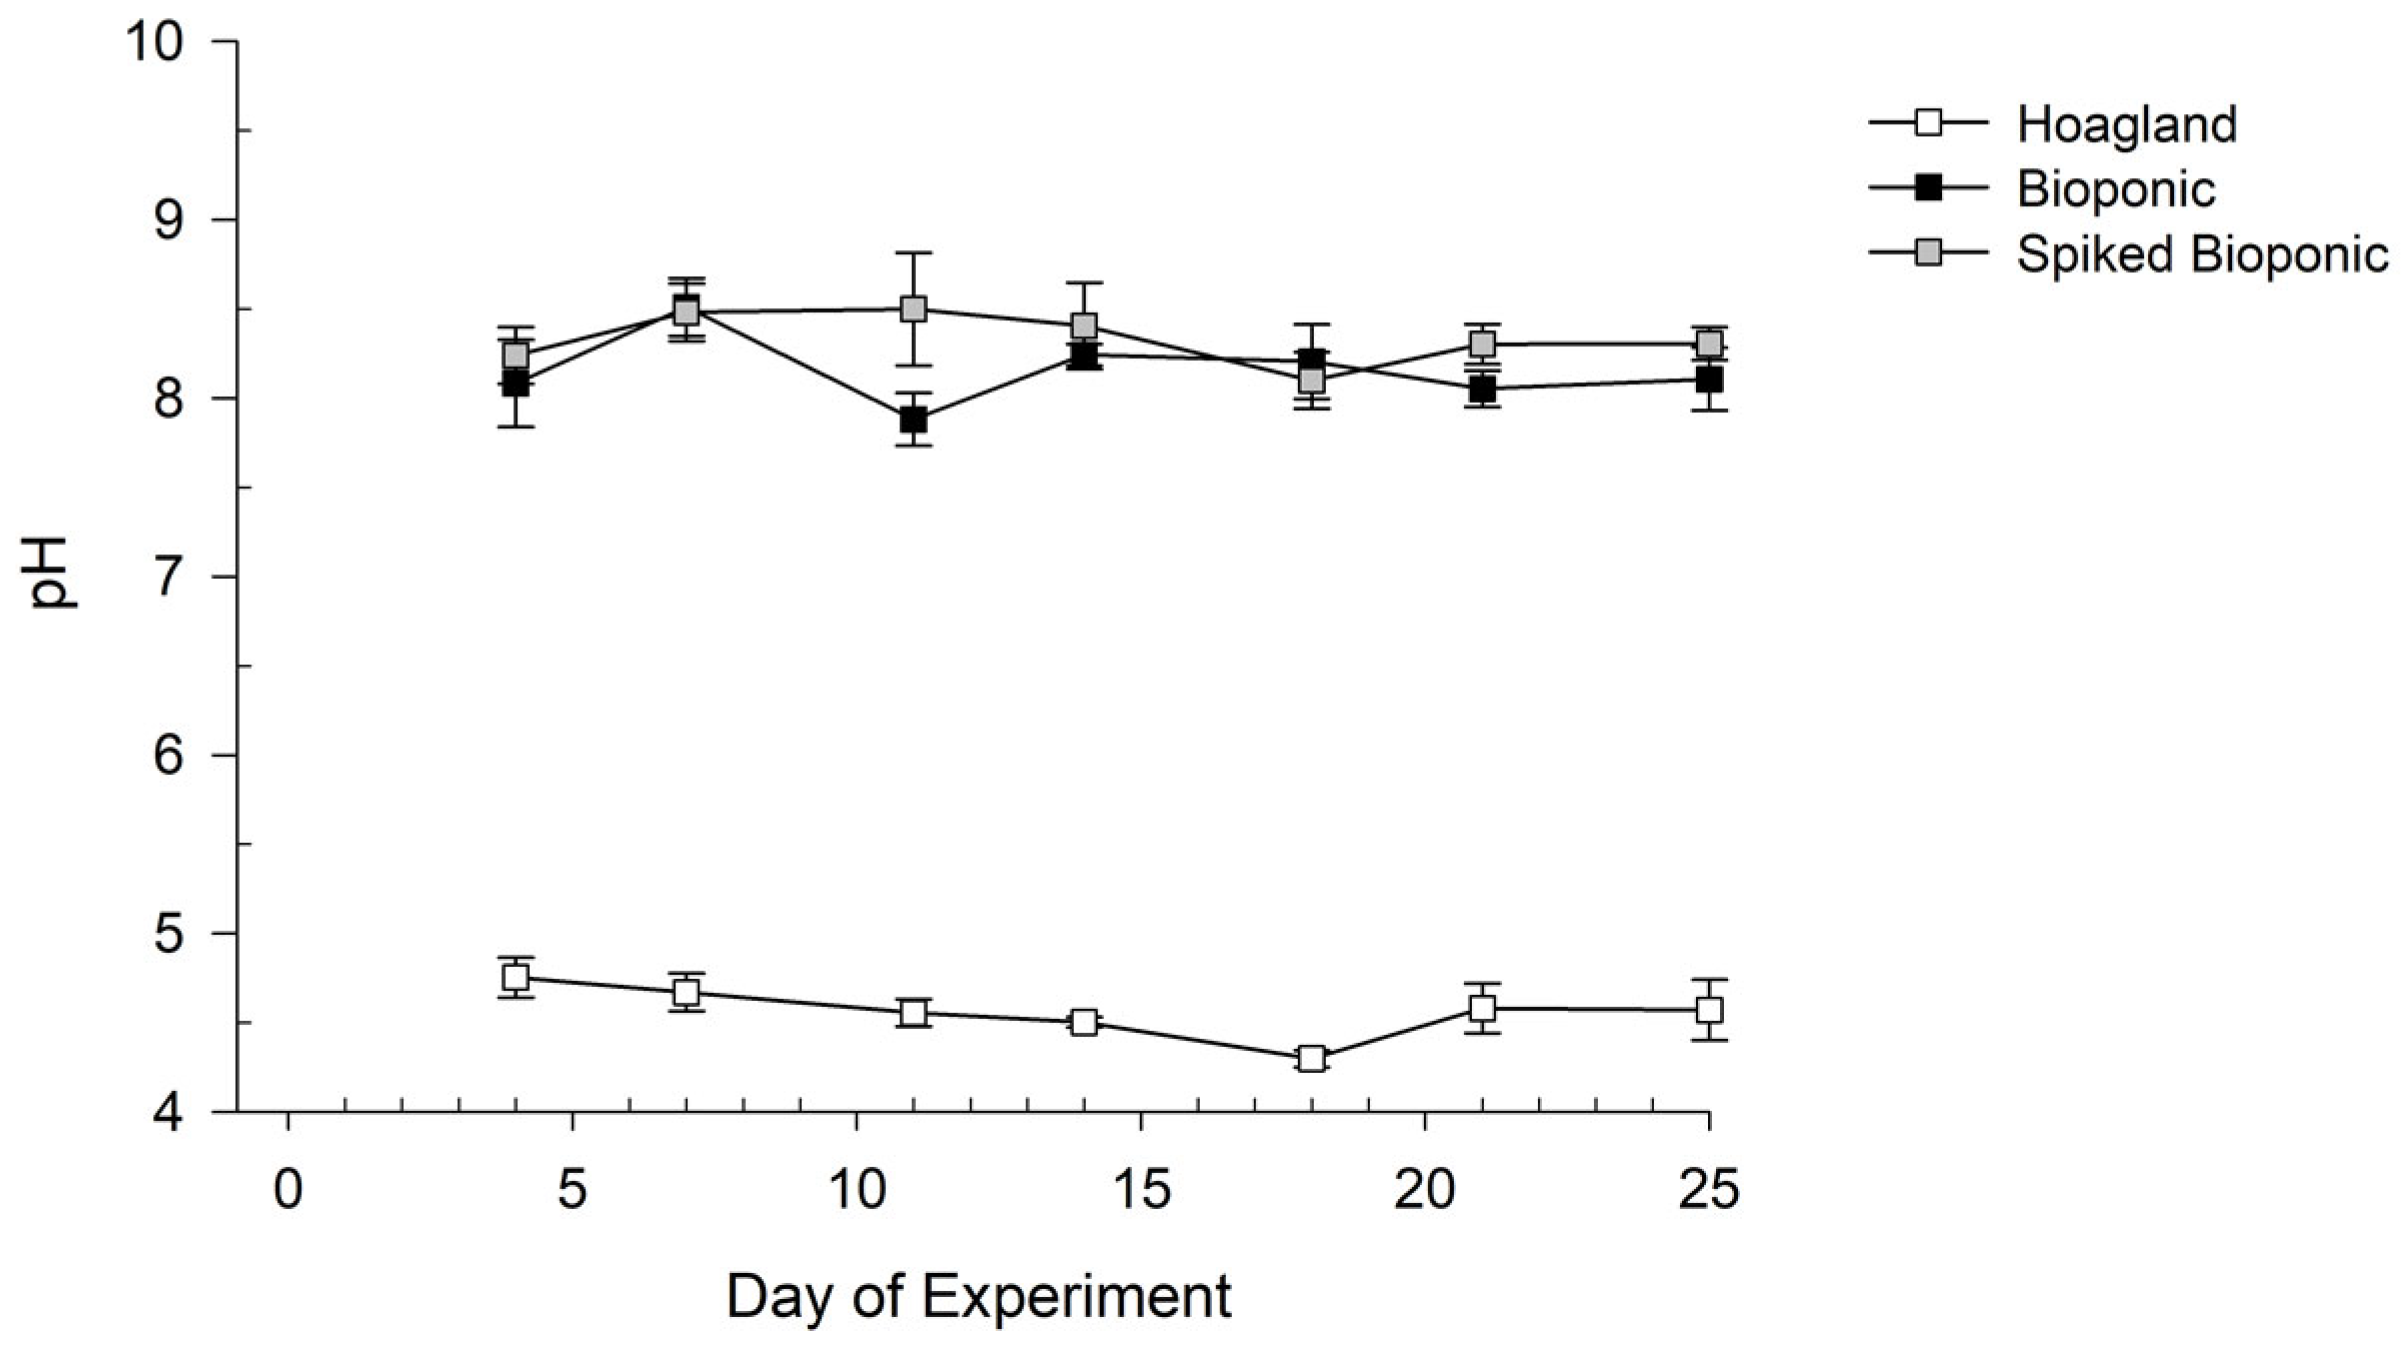
3.1.2. Nutrient Solution Stability

A massive loss of NH4+ and NO3 was observed during the storage of the stock solutions, whereas further PO43− became available (Table 4). The concentration of K+ in the K stock solution remained comparatively stable, decreasing by only 0.5% over the 35-day period between the analysis conducted before (Table 3) and after the hydroponic experiment (Table 4).

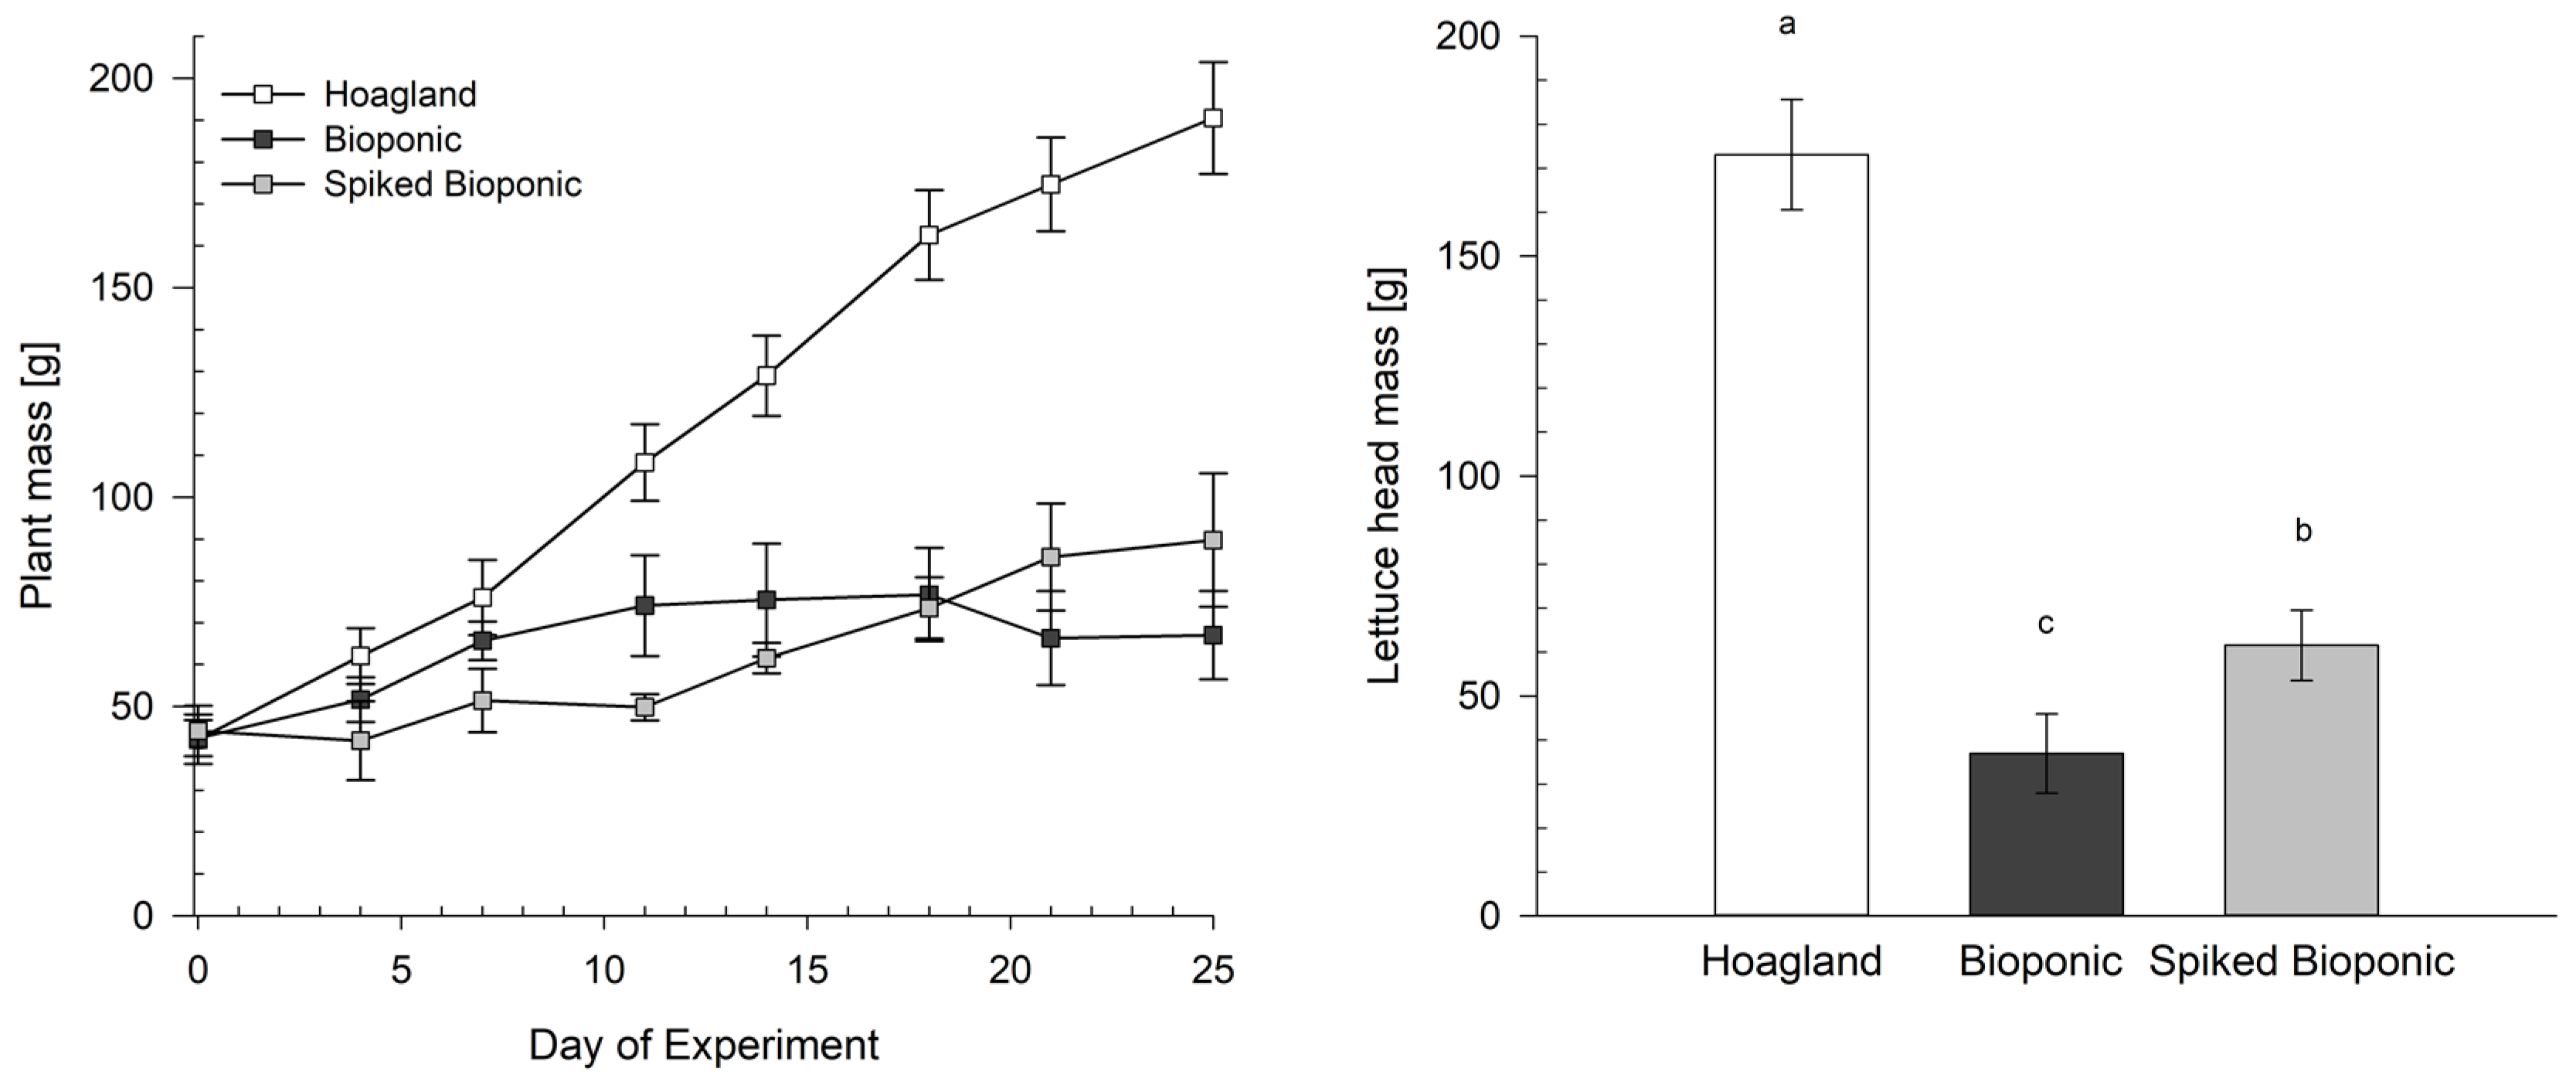
3.2. Testing of the Hoagland, Bioponic and Spiked Bioponic Solutions on Lettuce
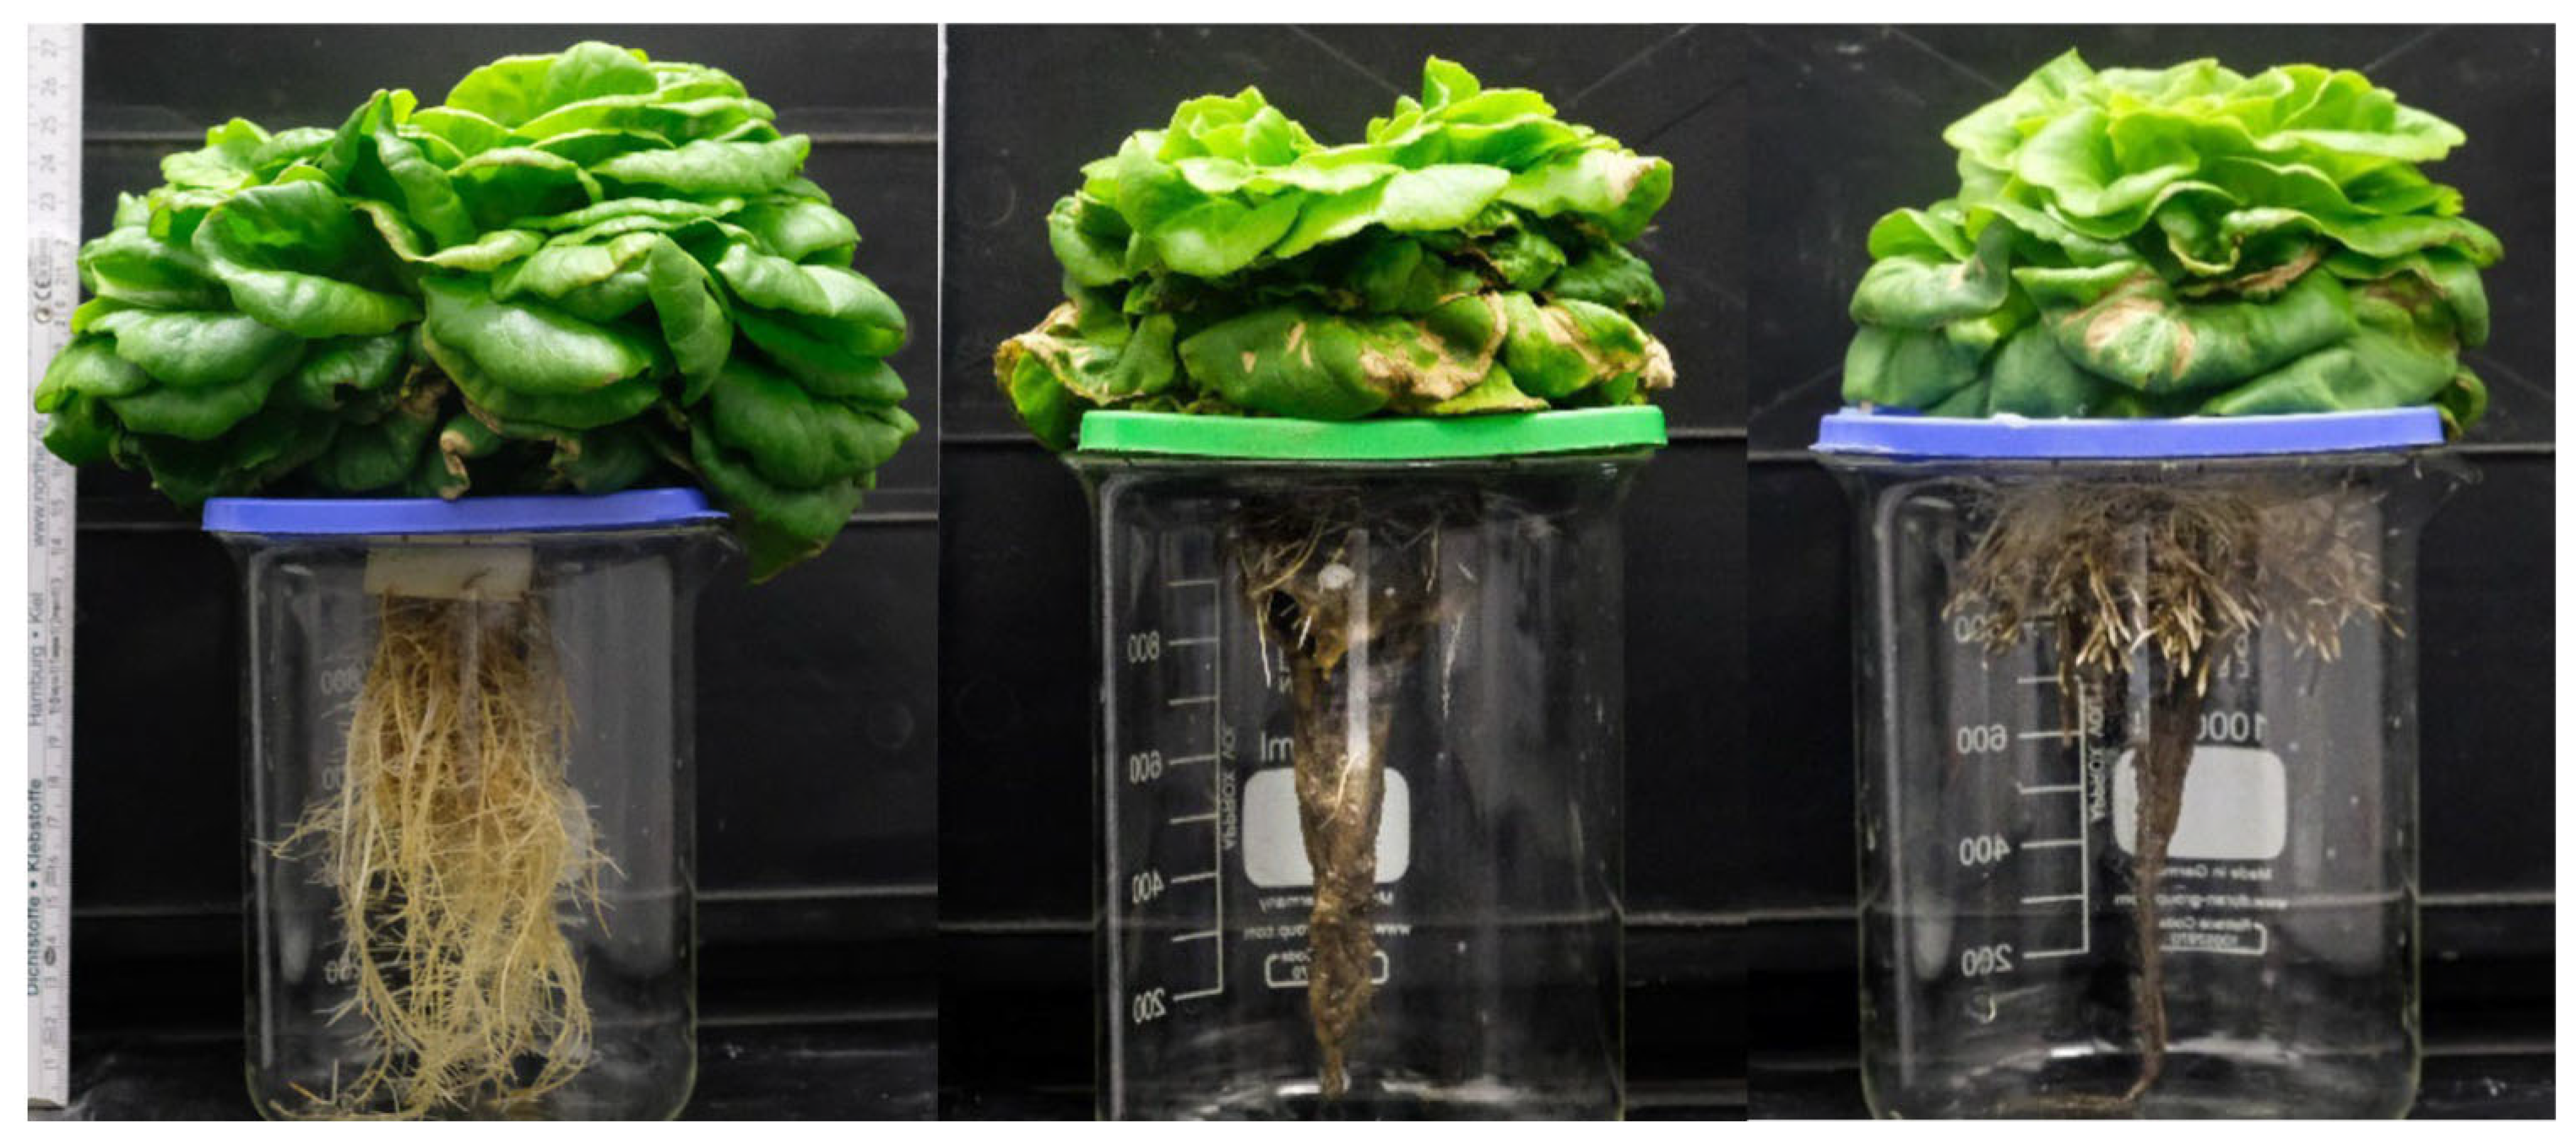
The fresh mass of the plants grown in the Hoagland solution increased faster than those grown in bioponic or spiked bioponic solution (Figure 5). The fresh mass at harvest was 190.5 ± 13.4 g for the plants grown in Hoagland, 67.0 ± 10.5 g in bioponic and 89.8 ± 16.0 g in spiked bioponic solution. Thus, the fresh mass of the plants grown in bioponic solution was only 35%, and when grown in the spiked bioponic solution 47% of the plants grown in Hoagland solution.
This difference was even more pronounced when only the harvested fresh lettuce heads were considered. The heads of plants grown in bioponic (p < 0.001) and spiked bioponic solution (p < 0.001) weighed significantly less than those grown in the Hoagland solution, with only 21% and 36%, respectively (Figure 5).
The low proportion of shoot mass was also evident in the high root to shoot ratio of 0.95 ± 0.08 and 0.56 ± 0.15 in the bioponic and spiked bioponic solutions, respectively. In contrast, the root to shoot ratio of the plants grown in the Hoagland solution was 0.10 ± 0.01.
The concentration of most anions and cations in the shoots of the plants grown in the bioponic and spiked bioponic solutions was lower than in plants grown in the Hoagland solution (Table 5). The plants grown in the bioponic solution showed significantly lower nutrient concentrations for N (p = 0.018) and Mg (p = 0.018), and the plants grown in spiked bioponic solutions showed significantly lower nutrient concentrations in P (p = 0.018), Fe (p = 0.024), Zn (p = 0.010), and Mo (p = 0.018), compared to those grown in the Hoagland solution.
The concentration of NH4+-N in the fresh bioponic solutions added to the hydroponic system during the last solution exchange was just under 30 mg L−1 (Figure 6a,b).
In both fresh bioponic solutions, the PO43− contained decreased, while only in the spiked bioponic solution was almost no PO43− added towards the end (Figure 6a,b). K in the fresh bioponic solutions remained most constant throughout the experiment.
The EC value of the fresh Hoagland solution was around 2 mS cm−1. With a maximum of 2.9 mS cm−1 in the fresh spiked bioponic and 3.7 mS cm−1 in the bioponic solution, the EC in these solutions was higher, even if it fell slightly over the course of the experiment (Figure 6c).
The pH values of the exchanged solutions were lower in the Hoagland solution (4–5) than in the two bioponic solutions, where they had risen sharply to 8-9 from the initially set pH value of 6 (Figure 7), suggesting a low nutrient availability for the plants.

Plant Development

Just one day after the lettuce plants were exposed to the bioponic solutions, the leaves showed a loss in turgor, and the older ones were especially affected. After one week, those leaves showed necrotic brown spots on their tips. However, the plants in both bioponic solutions developed new leaves thereafter.
In contrast to the roots grown in Hoagland solution, the roots grown in either bioponic solution were long and thin, brown, and covered with a thick dark biofilm (Figure 8). In both bioponic solutions, parts of the roots dissolved during the exchange of the solution.

4. Discussion

4.1. Bioponic Stock Solution of N, P and K

Different source materials were used to produce stock solutions of the three major nutrients N (blood meal), P (bone meal), and K (dried potato peel) for the bioponic solutions with varying success.
As a source for N, we showed that digesting blood meal was highly efficient as indicated by the high rates of mineralization into NH4+-N in both runs (90% and 98%) (Figure 1). The faster mineralization in the second run may have been due to an established anaerobic community of microorganisms that developed during the first run. Reusing the barrel and mash bags from the first run may also have contributed to a faster development of the relevant community of microorganisms through indirect inoculation. Compost, as a source of anaerobic microorganisms, could have delayed the mineralization in the first run since compost contains only a few anaerobic species of microorganisms. A source containing more anaerobic microorganisms, such as animal manures [33] or sewage sludge from anaerobic waste water treatment [34], should therefore be preferred for rapid N mineralization.
Nonetheless, the high mineralization rate of N into NH4+ during both runs indicates an efficient ammonifying community of microorganisms.
Lazicki et al. (2020) [35] examined different organic fertilizers, among them blood meal, on their N mineralization rate in a soil incubation experiment. After 84 days, over 70% of the N initially added through blood meal was mineralized, which they attributed to the low C:N ratio of blood meal of approximately 3.5. Other organic materials with higher C:N ratios led to the immobilization of N through microorganisms proliferating more rapidly due to the high C content, ultimately resulting in lower mineralization rates. Calderón et al. (2005) [36] and Gale et al. (2006) [37] reported the immobilization of N by microorganisms at C:N ratios higher than 15. In the present study, adding glucose and acetic acid had no adverse effect on the mineralization rate. Whether a smaller amount of glucose to feed the heterotrophic microorganisms would have been sufficient, has yet to be clarified. We were able to show that anaerobic digestion is well suited to mineralize blood meal-N into NH4+ and provide a digestate rich in NH4+.
However, we were not able to fully exploit the potential of blood meal as a source of N for bioponic solutions, as only 5% of the NH4+-N oxidized into NO3-N in the MBBR. Apparently, too few NO2-oxidizing bacteria were present in the MBBR; thus, NO2 accumulated. With the proliferation of NO2-oxidizing bacteria, NO2 was directly oxidized to NO3, resulting in a significant increase in NO3 towards the end of the experimental period. The dynamics of the N forms in the MBBR (Figure 2) resembled a phenomenon known in aquaristics as the “new tank syndrome”. In a new environment, bacteria that oxidize NH4+ to NO2 establish faster than NO2-oxidizing bacteria [38]. A more effective inoculation of biofilters in sewage sludge resulted in a nitrification rate of 42% in the MBBR [21], and, using chicken and goat manure without inoculating the biofilters, nitrification rates up to 81% were achieved using an MBBR by Szekely et al. [11]. Maybe targeting an entirely different population of microorganisms for the MBBR, such as chemolithoautotrophic nitrifiers [9], could enhance the efficacy of mobilizing organic N for bioponic solutions, since no additional source of C would be needed.
Ultimately, the NH4+ and NO2 concentrations found in the MBBR solution were low (Figure 2), relative to the total amount of NH4+ added from the blood meal digestate. Thus, most likely, most of the NH4+ was lost through NH3 volatilization caused by a high pH and aeration.
Bone meal as a source for P was not as effective as hoped, since even at a pH below 5.5 we observed mineralization rates into PO43−-P of less than 20% during anaerobic digestion. However, the bone meal digestate had a high concentration of Ca (Table 3), contributing to a well-balanced Ca concentration in the final bioponic solution (Figure 4). Thus, bone meal would be suitable for the preparation of a P and Ca rich bioponic stock solution if higher mineralization rates for P could be achieved, for example by adding more easily degradable organic residues, such as chicken manure [10,13]. This approach, combined with an additional aerobic treatment of the anaerobic digestate would probably also help in reducing the relatively high NH4+ concentration in the digestate of bone meal (Table 3) which otherwise may result in phytotoxic NH4+ concentrations in the final bioponic solution.
Potassium was mobilized easily from dried potato peel (Figure 3) due to the fact that K is present in organic material as an unbound, readily soluble K+ ion, facilitating its transfer through cell membranes and leaching [39,40]. This allows for a high degree of flexibility in the choice of organic feedstocks for the production of bioponic K stock solutions.

4.2. Nutrient Composition of the Bioponic and the Spiked Bioponic Solution

Plants require a balanced mixture of macro- and micronutrients for their growth. Many different hydroponic solutions have been designed to meet the requirements of different plant species. We used mean concentrations of different well-established hydroponic solutions to create a reference solution to measure our bioponic solution against (Table 2). We mixed our bioponic solution from the bioponic stock solutions to achieve a balanced nutrient solution, meeting the reference solutions as closely as possible.
For PO43−-P and K+ this turned out to be successful, as the concentrations of the bioponic solution, based on the mixing ratio, were in good agreement with the target values in the reference table (Table 2). However, a strong reduction in PO43− was detected in the fresh bioponic and spiked bioponic solutions (Figure 6a,b). This reduction can likely be attributed to a reduction in the stored samples before analysis, most certainly caused by high pH and Ca concentrations, causing P to precipitate, which is supported by the analyses of the stock solutions after the end of the hydroponic experiment (Table 4) [20,41].
For N concentrations and, particularly, the high ratio of NH4+ and NO3, the final solution deviated strongly from the reference solutions (Table 2) with potentially severely negative effects on plant growth in hydroponic systems. The NH4+:NO3 ratio of the fresh bioponic solutions increased even more over the course of the hydroponic experiment (Figure 6a,b). The excess uptake of NH4+ ions may result in leaf chlorosis, reduced growth, or even the death of the plant [42]. NH4+ toxicity has been shown to increase ethylene production, thus disrupting hormonal homeostasis [43,44], reducing essential cations such as K, Ca, and Mg in plant tissue, and increasing anions such as sulphate and phosphate [42,45]. Furthermore, there is evidence of reduced net photosynthesis [42,46,47], which may be caused by oxidative damages to the light-harvesting photosystems [42].
Many studies on bioponics identified NH4+ toxicities as one of the main causes of poor plant growth [9,10]. Most bioponic solutions, if subjected to aerobic treatment, were shown to have lower NH4+ concentrations than the bioponic solution of the present study [8,11,12,21]. Additional aerobic treatment of the anaerobic P and K digestate used in the present study may, thus, reduce NH4+ concentrations, while potentially reducing total organic carbon and phytotoxic compounds [48].
Concentrations of most micronutrients in the bioponic nutrient solution (Figure 4) were similar to the targeted reference solution (Table 2). The relatively high concentrations of Zn and Fe have been described before in other studies on bioponic solutions [10,21]. If taken up by the plant, the abundant availability of Zn and Fe could help combat hidden hunger caused by micronutrient deficiencies [49]. The sodium load of 20.2 ± 0.6 mg L−1 in the bioponic solution should not have affected plant growth significantly. Breś et al. (2022) [50] did not observe a significant reduction in lettuce yield when exposed to a Na concentration of 229.9 mg L−1, supplied as NaCl.
In the spiked bioponic solution, concentrations of N, P, and K corresponded to the reference values (Table 2). However, none of the other macro- and micronutrients met the range of the referenced mineral nutrient solutions, except for Mo. Whereas for micronutrients, different mineral nutrient solutions can also show variances in concentrations—the Hoagland solution used in the present study matched the micronutrient range of the reference table for Cu only—all the macronutrients of the used Hoagland solution were within the range of the reference table. The high Ca concentration in the spiked bioponic solution could possibly negatively impact plant growth, since Ca can have antagonistic effects on the uptake of other nutrients, for instance, P, Mg, Fe, Zn, and Mn [51]. However, it is doubtful whether the Ca concentration was high enough for such antagonistic effects.
The elevated EC in the bioponic solution (Figure 6c) is in line with the findings of William and Nelson (2016) [52], who showed that the EC in bioponic solutions tends to be higher than in conventional nutrient solutions. They attributed the higher EC in bioponic solutions to the presence of non-essential salts, including Na and Cl and organic acids [52]. Thus, EC is not fully suitable as an appropriate indicator for nutrients in bioponic solutions.
Another phenomenon observed was the pH dynamics in the bioponic and spiked bioponic nutrient solutions. The nutrient solution was renewed twice a week, and although the pH was set to 6 using acetic acid when the solution was renewed, the pH observed in the exchanged nutrient solution was around 8 or higher (Figure 7). This high pH is far from optimal for hydroponic cultivation and efficient nutrient uptake. Among several potential factors for this behavior, a probable cause could lie in the buffering capacity of the nutrient solution, induced by the bone derived P solution. Bones consist mainly of hydroxyapatite, which contains calcium phosphate and carbonates, among other molecules [53]. The strong buffering capacity of the bioponic nutrient solutions could be a result of the interactions between the calcium, phosphate and carbonate ions with water and other ions in the solutions. In an attempt to deploy bone meal from chickens to treat acid mine drainage, Payus et al. [54] observed a rapid increase in pH and postulate that an adsorption mechanism may have taken place, along with the precipitation of metal hydroxide, which caused the pH to increase. In the hydroponic experiment conducted, repeated applications of strong acids, such as hydrochloric acid (HCl) or nitric acid (HNO3), may have been able to control the pH value more effectively. However, due to the high buffer capacity previously mentioned, this could have led to a significant increase in the Cl or N concentration, potentially distorting the results.

4.3. Plant Growth

The lettuce plants grown in bioponic and spiked bioponic solutions showed poor growth apparent in the significantly lower harvested head mass compared to the head mass of the plants grown in the Hoagland solution (Figure 5). The yield of lettuce grown in bioponic solution was only one fifth (21%) of the lettuce yield when grown in the Hoagland solution. This was lower than most other published results for yields of bioponically grown lettuce, relative to mineral nutrient solution grown lettuce as reported by Gartman et al. [22], Williams and Nelsons [52], Liedl [10], and Atkins and Nichols [55], who obtained 72%, 63%, 56%, and 23%, respectively.
The observed loss in leaf turgor immediately following the application of the bioponic solutions may have been caused by the change to the bioponic solution with a higher EC [56]. While the plants did recover from this initial shock, the 25-day experimental period may have been insufficient to fully equalize the effect.
A potentially contributing factor to the low yields in our study was the high NH4+ concentration and the unfavorable NH4+:NO3 ratio. However, Liedl et al. [10] achieved 56% of the yield of lettuce grown in mineral nutrient solution with a bioponic solution containing 43.6 mg L−1 NH4+-N and no NO3, and Williams and Nelson’s [48] bioponic solution contained less than 5 mg L−1 NO3-N and more than 40 mg L−1 NH4+-N [52]. These studies show that even with unfavorable NH4+:NO3 ratios, higher relative yields can be achieved.
Neither Williams and Nelson [52], Liedl et al. [10], nor other studies [22,55] described a high microbial load leading to a strongly developed biofilm on the roots, potentially reducing their oxygen supply and hosting pathogens, like Pythium spp., which can cause root rot [57]. This may have additionally reduced plant growth and could be an explanation for the equally reduced plant growth in the spiked bioponic solution, despite a good NH4+:NO3 ratio. Increasing the nutrient concentration in the bioponic solution in order to increase yield, as proposed by Gartman et al. (2023) [22], can, therefore, not be applied to the present study. A more promising approach could be diluting the solution or reducing the number of microorganisms by suitable measures.
The lettuce variety “Hawking”, grown in the Hoagland solution, achieved a head yield of 173.1 ± 7.5 g, which is about 67% of the yield reported by Gartman et al. (2023) [22] for “Hawking” in a nutrient film technique system, but 1.25 times the yield reported by Liedl et al. [10] for the varieties “Rex” and “Vegas”.
Nutrient uptake was not the main cause for the suppressed plant growth, as tissue nutrient concentrations were in the reported range for lettuce leaves before harvest [58], albeit somewhat lower in bioponically grown plants than in plants grown in the Hoagland solution. While the exact reasons for the inhibited growth could not be studied in every detail due to a lack of additional assessments such as phytopathological analyses, it is clear that nutrient solution properties were unfavorable. Thus, the low head yields from plants grown in bioponic solutions probably resulted from a multitude of aspects, such as high EC, high pH combined with low dissolved oxygen concentration in the nutrient solution, root damage possibly caused by pathogens such as Pythium spp., and maybe even a high NH4+ concentration in the bioponic solution. Whether the root rot caused the microflora settlement on the roots or vice versa remains unclear.
Considering the variety of potential causes for the reduced plant growth in the bioponic solution, the hydroponic experiment should be considered as preliminary. However, the results of the experiment can serve as a basis for systematically overcoming the challenges associated with the production and application of bioponic stock solutions.

5. Conclusions

In the present study, we attempted to produce bioponic nutrient solutions with stock solutions from specifically non-food, non-feed organic residues.
We were able to produce bioponic stock solutions with adequate nutrient concentrations on a technically non-challenging level from blood meal, bone meal, and potato peel. However, the physio-chemical properties of the final bioponic solutions did not meet the requirements for hydroponic plant production.
Nonetheless, the three nutrient reactors achieved good mineralization rates, and mixing the three stock solutions resulted in a relatively well-balanced nutrient solution. Thus, the approach shows potential for using non-food, non-feed organic residues as nutrient sources for bioponic nutrient solutions. The applicability of such an approach for drylands dominated by pastoralism has yet to be studied, as we have shown that probably more sophisticated reactor concepts, including temperature control, continuous in situ monitoring, and the improved mixing and automated dosing embedded in a continuous process in contrast to the batch process used in this work could lead to results that justify the extensive effort required to set up, maintain, and monitor the processes of bioponic nutrient solution production. The much more advanced technological level needed to provide reliable production conditions will probably be an obstacle to implementation.
Our findings provide three starting points for producing bioponic solutions that are more suitable for plant growth: (1) a wider NO3:NH4+ ratio should be achieved, (2) the decomposition of organic substances should be more complete and the microbial load of the bioponic solution should be greatly reduced, (3) strict pH control is essential for high nutrient availability and efficient nutrient uptake to the plant.
Finally, field testing of the applicability of the approach in the target environment should be performed, with a wider range of crops going beyond the simple model of lettuce production.

Supplementary Materials

The following supporting information can be downloaded at: https://www.mdpi.com/article/10.3390/agriculture14060928/s1, Table S1: Nutrient concentrations of produced bioponic solution and Hoagland control solution.

Author Contributions

Conceptualization, M.B. and J.G.; methodology, L.S.K. and S.H.; formal analysis, S.H.; investigation, S.H., M.B., L.S.K. and J.G.; resources S.H. and F.A.; data curation, S.H.; writing—original draft preparation, S.H. and M.B.; writing—review and editing, L.S.K., J.G. and F.A.; visualization, S.H.; supervision, M.B., L.S.K., J.G. and F.A.; project administration, M.B.; funding acquisition, M.B. and J.G. All authors have read and agreed to the published version of the manuscript.

Funding

This research received funding through the Crowdfunding Campaign “GreenUpSahara”, the Fraunhofer Zukunftsstiftung and by the HypoWave+ project funded by the German Federal Ministry of Education and Research (funding code: 02WV1562D).

Institutional Review Board Statement

Not applicable.

Data Availability Statement

Data obtained in this study will be made available by the corresponding author upon reasonable request.

Conflicts of Interest

The authors declare no conflicts of interest.

References

  1. Tchakerian, V.P. Hydrology, Floods and Droughts|Deserts and Desertification. In Encyclopedia of Atmospheric Sciences; Elsevier: Amsterdam, The Netherlands, 2015; pp. 185–192. ISBN 9780123822253. [Google Scholar]
  2. Hjort, A. Traditional Land Use in Marginal Drylands. Ecol. Bull. 1976, 24, 43–53. [Google Scholar]
  3. Safari, J.G.; Kirwa, M.K.; Mandara, C.G. Food insecurity in pastoral communities of Ngorongoro conservation area, Tanzania. Agric. Food Secur. 2022, 11, 36. [Google Scholar] [CrossRef]
  4. Gebre, A.; Reddy, P.S.; Mulugeta, A.; Sedik, Y.; Kahssay, M. Prevalence of Malnutrition and Associated Factors among Under-Five Children in Pastoral Communities of Afar Regional State, Northeast Ethiopia: A Community-Based Cross-Sectional Study. J. Nutr. Metab. 2019, 2019, 9187609. [Google Scholar] [CrossRef] [PubMed]
  5. van Ginkel, M.; Sayer, J.; Sinclair, F.; Aw-Hassan, A.; Bossio, D.; Craufurd, P.; El Mourid, M.; Haddad, N.; Hoisington, D.; Johnson, N.; et al. An integrated agro-ecosystem and livelihood systems approach for the poor and vulnerable in dry areas. Food Secur. 2013, 5, 751–767. [Google Scholar] [CrossRef]
  6. Lee, C.; Schaaf, T. The Future of Drylands: International Scientific Conference on Desertification and Drylands Research, Tunis, Tunisia, 19–21 June 2006; Springer: Berlin/Heidelberg, Germany; UNESCO: Dordrecht, The Netherlands; Paris, France, 2008; ISBN 9781402069697. [Google Scholar]
  7. World Food Programme. WFP Innovation Accelerator-Report 2021; WFP: Rome, Italy, 2021. [Google Scholar]
  8. Kechasov, D.; Verheul, M.J.; Paponov, M.; Panosyan, A.; Paponov, I.A. Organic Waste-Based Fertilizer in Hydroponics Increases Tomato Fruit Size but Reduces Fruit Quality. Front. Plant Sci. 2021, 12, 680030. [Google Scholar] [CrossRef]
  9. Krishnasamy, K.; Nair, J.; Bäuml, B. Hydroponic system for the treatment of anaerobic liquid. Water Sci. Technol. 2012, 65, 1164–1171. [Google Scholar] [CrossRef] [PubMed]
  10. Liedl, B.E.; Cummins, M.; Young, A.; Williams, M.L. Hydroponic Lettuce Production Using Liquid Effluent from Poultry Waste Bioremediation as a Nutrient Source. Acta Hortic. 2004, 659, 721–728. [Google Scholar] [CrossRef]
  11. Szekely, I.; Zeaiter, Z.; Jijakli, M.H. Development of a Simple Bioponic Method Using Manure and Offering Comparable Lettuce Yield than Hydroponics. Water 2023, 15, 2335. [Google Scholar] [CrossRef]
  12. Bergstrand, K.-J.; Asp, H.; Hultberg, M. Utilizing Anaerobic Digestates as Nutrient Solutions in Hydroponic Production Systems. Sustainability 2020, 12, 10076. [Google Scholar] [CrossRef]
  13. Garland, J.L.; Mackowiak, C.L.; Strayer, R.F.; Finger, B.W. Integration of waste processing and biomass production systems as part of the KSC breadboard project. Adv. Space Res. 1997, 20, 1821–1826. [Google Scholar] [CrossRef]
  14. Phibunwatthanawong, T.; Riddech, N. Liquid organic fertilizer production for growing vegetables under hydroponic condition. Int. J. Recycl. Org. Waste Agric. 2019, 8, 369–380. [Google Scholar] [CrossRef]
  15. Mowa, E. Organic manure for vegetable production under hydroponic conditions in arid Namibia. Int. Sci. Technol. J. Namib. 2015, 5, 3–12. [Google Scholar]
  16. Shinohara, M.; Aoyama, C.; Fujiwara, K.; Watanabe, A.; Ohmori, H.; Uehara, Y.; Takano, M. Microbial mineralization of organic nitrogen into nitrate to allow the use of organic fertilizer in hydroponics. Soil Sci. Plant Nutr. 2011, 57, 190–203. [Google Scholar] [CrossRef]
  17. Wongkiew, S.; Koottatep, T.; Polprasert, C.; Prombutara, P.; Jinsart, W.; Khanal, S.K. Bioponic system for nitrogen and phosphorus recovery from chicken manure: Evaluation of manure loading and microbial communities. Waste Manag. 2021, 125, 67–76. [Google Scholar] [CrossRef] [PubMed]
  18. Wang, L.K.; Shammas, N.K.; Hung, Y.-T. Biosolids Treatment Processes; Humana Press: Totowa, NJ, USA, 2007; ISBN 9781588293961. [Google Scholar]
  19. Mupambwa, H.A.; Namwoonde, A.S.; Liswaniso, G.M.; Hausiku, M.K.; Ravindran, B. Biogas digestates are not an effective nutrient solution for hydroponic tomato (Lycopersicon esculentum L.) production under a deep water culture system. Heliyon 2019, 5, e02736. [Google Scholar] [CrossRef] [PubMed]
  20. Goddek, S.; Joyce, A.; Kotzen, B.; Burnell, G.M. Aquaponics Food Production Systems; Springer International Publishing: Cham, Switzerland, 2019; ISBN 978-3-030-15942-9. [Google Scholar]
  21. Pelayo Lind, O.; Hultberg, M.; Bergstrand, K.-J.; Larsson-Jönsson, H.; Caspersen, S.; Asp, H. Biogas Digestate in Vegetable Hydroponic Production: pH Dynamics and pH Management by Controlled Nitrification. Waste Biomass Valorization 2020, 12, 123–133. [Google Scholar] [CrossRef]
  22. Gartmann, F.; Hügly, J.; Krähenbühl, N.; Brinkmann, N.; Schmautz, Z.; Smits, T.H.M.; Junge, R. Bioponics—An Organic Closed-Loop Soilless Cultivation System: Yields and Characteristics Compared to Hydroponics and Soil Cultivation. Agronomy 2023, 13, 1436. [Google Scholar] [CrossRef]
  23. Kjeldahl, J. Neue Methode zur Bestimmung des Stickstoffs in organischen Körpern. Z. Anal. Chem. 1883, 22, 366–382. [Google Scholar] [CrossRef]
  24. Wu, S.; Feng, X.; Wittmeier, A. Microwave Digestion of Plant and Grain Reference Materials in Nitric Acid or a Mixture of Nitric Acid and Hydrogen Peroxide for the Determination of Multi-elements by Inductively Coupled Plasma Mass Spectrometry. J. Anal. At. Spectrom. 1997, 12, 797–806. [Google Scholar] [CrossRef]
  25. Matsushita, N.; Matoh, I. Characterization of Na+ exclusion mechanisms of salt-tolerant reed plants in comparison with salt-sensitive rice plants. Physiol. Plant. 1991, 83, 170–176. [Google Scholar] [CrossRef]
  26. Abfallwirtschaftsbetrieb Esslingen, Deutschland, Kompostwerk Kirchheim u.T. GmbH. RAL-Gütesicherung Kompost Anlage Kirchheim, Jahreszeugnis 2022. Available online: https://www.awb-es.de/medias/Jahreserzeugnis-G%C3%BCtekompost-2022_71846719ed57a63d2a427515e0a91087.pdf (accessed on 8 April 2024).
  27. Ødegaard, H.; Rusten, B.; Westrum, T. A new moving bed biofilm reactor-applications and results. Water Sci. Technol. 1994, 29, 157–165. [Google Scholar] [CrossRef]
  28. Epple, M.; Enax, J. Moderne Zahnpflege aus chemischer Sicht. Chem. Nserer Zeit 2018, 52, 218–228. [Google Scholar] [CrossRef]
  29. Schaad, P.; Poumier, F.; Voegel, J.C.; Gramain, P. Analysis of calcium hydroxyapatite dissolution in non-stoichiometric solutions. Physicochem. Eng. Asp. 1997, 121, 217–228. [Google Scholar] [CrossRef]
  30. Taiz, L.; Zeiger, E. Plant Physiology, 4th ed.; Sinauer Associates, Inc.: Sunderland, UK, 2006. [Google Scholar]
  31. Resh, H.M. Hydroponic Food Production: A Definitive Guidebook for the Advanced Home Gardener and the Commercial Hydroponic Grower, 7th ed.; CRC Press: Boca Raton, FL, USA, 2013; ISBN 9781439878699. [Google Scholar]
  32. Savvas, D.; Passam, H.C.; Olympios, C.; Nasi, E.; Moustaka, E.; Mantzos, N.; Barouchas, P. Effects of Ammonium Nitrogen on Lettuce Grown on Pumice in a Closed Hydroponic System. HortScience 2006, 41, 1667–1673. [Google Scholar] [CrossRef]
  33. Manyi-Loh, C.E.; Mamphweli, S.N.; Meyer, E.L.; Makaka, G.; Simon, M.; Okoh, A.I. An Overview of the Control of Bacterial Pathogens in Cattle Manure. Int. J. Environ. Res. Public Health 2016, 13, 843. [Google Scholar] [CrossRef] [PubMed]
  34. Narihiro, T.; Sekiguchi, Y. Microbial communities in anaerobic digestion processes for waste and wastewater treatment: A microbiological update. Curr. Opin. Biotechnol. 2007, 18, 273–278. [Google Scholar] [CrossRef] [PubMed]
  35. Lazicki, P.; Geisseler, D.; Lloyd, M. Nitrogen mineralization from organic amendments is variable but predictable. J. Environ. Qual. 2020, 49, 483–495. [Google Scholar] [CrossRef]
  36. Calderón, F.J.; McCarty, G.W.; Reeves, J.B. Analysis of manure and soil nitrogen mineralization during incubation. Biol. Fertil. Soils 2005, 41, 328–336. [Google Scholar] [CrossRef]
  37. Gale, E.S.; Sullivan, D.M.; Cogger, C.G.; Bary, A.I.; Hemphill, D.D.; Myhre, E.A. Estimating plant-available nitrogen release from manures, composts, and specialty products. J. Environ. Qual. 2006, 35, 2321–2332. [Google Scholar] [CrossRef]
  38. Roberts, H.; Palmeiro, B.S. Toxicology of aquarium fish. Vet. Clin. N. Am. Exot. Anim. Pract. 2008, 11, 359–374. [Google Scholar] [CrossRef]
  39. Sardans, J.; Peñuelas, J. Potassium: A neglected nutrient in global change. Glob. Ecol. Biogeogr. 2015, 24, 261–275. [Google Scholar] [CrossRef]
  40. Ako, P.A.E.; Adebanjo, A.S.; Fadipe, A.L.; Ndamitso, M.M. Extractability of Potassium from Some Organic Manures in Aqueous Medium and the Effect of pH, Time and Concentration. J. Appl. Sci. Environ. Manag. 2003, 7, 51–56. [Google Scholar] [CrossRef]
  41. Stefanakis, A.; Akratos, C.S.; Tsihrintzis, V.A. Vertical Flow Constructed Wetlands: Eco-Engineering Systems for Wastewater and Sludge Treatment, 1st ed.; Elsevier: Amsterdam, The Netherlands; Boston, MA, USA, 2014; ISBN 9780124046122. [Google Scholar]
  42. Britto, D.T.; Kronzucker, H.J. NH4+ toxicity in higher plants: A critical review. J. Plant Physiol. 2002, 159, 567–584. [Google Scholar] [CrossRef]
  43. Barker, A.V. Ammonium accumulation and ethylene evolution by tomato infected with root-knot nematode and grown under different regimes of plant nutrition. Commun. Soil Sci. Plant Anal. 1999, 30, 175–182. [Google Scholar] [CrossRef]
  44. Barker, A.V. Foliar ammonium accumulation as an index of stress in plants. Commun. Soil Sci. Plant Anal. 1999, 30, 167–174. [Google Scholar] [CrossRef]
  45. van Beusichem, M.L.; Kirkby, E.A.; Baas, R. Influence of Nitrate and Ammonium Nutrition on the Uptake, Assimilation, and Distribution of Nutrients in Ricinus communis. Plant Physiol. 1988, 86, 914–921. [Google Scholar] [CrossRef]
  46. Claussen, W.; Lenz, F. Effect of ammonium or nitrate nutrition on net photosynthesis, growth, and activity of the enzymes nitrate reductase and glutamine synthetase in blueberry, raspberry and strawberry. Plant Soil 1999, 208, 95–102. [Google Scholar] [CrossRef]
  47. Skopelitis, D.S.; Paranychianakis, N.V.; Paschalidis, K.A.; Pliakonis, E.D.; Delis, I.D.; Yakoumakis, D.I.; Kouvarakis, A.; Papadakis, A.K.; Stephanou, E.G.; Roubelakis-Angelakis, K.A. Abiotic stress generates ROS that signal expression of anionic glutamate dehydrogenases to form glutamate for proline synthesis in tobacco and grapevine. Plant Cell 2006, 18, 2767–2781. [Google Scholar] [CrossRef] [PubMed]
  48. Mackowiak, C.L.; Garland, J.L.; Strayer, R.F.; Finger, B.W.; Wheeler, R.M. Comparison of aerobically treated and untreated crop residue as a source odf recycled nutrients in a recirculating hydroponic system. Adv. Space Res. 1996, 18, 281–287. [Google Scholar] [CrossRef]
  49. Biesalski, H.K. Hidden Hunger; Springer: Berlin/Heidelberg, Germany, 2013; ISBN 978-3-642-33949-3. [Google Scholar]
  50. Breś, W.; Kleiber, T.; Markiewicz, B.; Mieloszyk, E.; Mieloch, M. The Effect of NaCl Stress on the Response of Lettuce (Lactuca sativa L.). Agronomy 2022, 12, 244. [Google Scholar] [CrossRef]
  51. Gunes, A.; Alpaslan, M.; Inal, A. Critical nutrient concentrations and antagonistic and synergistic relationships among the nutrients of NFT-grown young tomato plants. J. Plant Nutr. 1998, 21, 2035–2047. [Google Scholar] [CrossRef]
  52. Williams, K.A.; Nelson, J.S. Challenges of using organic fertilizers in hydroponic production systems. Acta Hortic. 2016, 365–370. [Google Scholar] [CrossRef]
  53. Liu, Q.; Huang, S.; Matinlinna, J.P.; Chen, Z.; Pan, H. Insight into biological apatite: Physiochemical properties and preparation approaches. BioMed Res. Int. 2013, 2013, 929748. [Google Scholar] [CrossRef] [PubMed]
  54. Payus, C.; David, O.; Yan, M.P. Bone Meal As Alterantive Treatment For Acidic And Metal Contaminated Acid Mine Drainage Water Effluent: Lab Scale. Am. J. Environ. Sci. 2014, 10, 61–73. [Google Scholar] [CrossRef]
  55. Atkin, K.; Nichols, M.A. Organic Hydroponics. Acta Hortic. 2004, 648, 121–127. [Google Scholar] [CrossRef]
  56. Lam, V.P.; Kim, S.J.; Park, J.S. Optimizing the Electrical Conductivity of a Nutrient Solution for Plant Growth and Bioactive Compounds of Agastache rugosa in a Plant Factory. Agronomy 2020, 10, 76. [Google Scholar] [CrossRef]
  57. Sutton, J.C.; Sopher, C.R.; Owen-Going, T.N.; Liu, W.; Grodzinski, B.; Hall, J.C.; Benchimol, R.L. Etiology and epidemiology of Pythium root rot in hydroponic crops: Current knowledge and perspectives. Summa Phytopathol. 2006, 32, 307–321. [Google Scholar] [CrossRef]
  58. Hartz, T.K.; Johnstone, P.R.; Williams, E.; Smith, R.F. Establishing Lettuce Leaf Nutrient Optimum Ranges Through DRIS Analysis. HortScience 2007, 42, 143–146. [Google Scholar] [CrossRef]
Figure 1. NH4+-N concentration in the anaerobic blood meal digestate in the first (left) and second run (right). Values are mean values of three pseudoreplications. Error bars are standard deviations (not shown if smaller than the symbol).
Agriculture 14 00928 g001
Figure 2. NH4+-N, NO2-N and NO3-N concentrations in the moving bed biofilm reactor, fed with bloodmeal digestate. Values are mean values of three pseudoreplications. Error bars are standard deviations (not shown if smaller than the symbol).
Agriculture 14 00928 g002
Figure 3. PO43−-P concentration in the P stock solution produced by anaerobic digestion of bone meal with linear regression line of PO43−-P versus day of experiment (R2 = 0.968, p < 0.001) (left). K+ concentration in the K stock solution, produced by anaerobic digestion of potato peel (right). Values are mean values of three pseudoreplications. Error bars are standard deviations (not shown if smaller than the symbol).
Agriculture 14 00928 g003
Figure 4. Nutrient concentrations of the bioponic and spiked bioponic solutions, based on analysis of produced stock solutions and determined mixing ratios. Error bars are standard deviations (not shown if smaller than the symbol). Concentration of Hoagland solution according to the formulation used.
Agriculture 14 00928 g004
Figure 5. Mean fresh plant mass (n = 4) development, consisting of shoots and roots, of the lettuce plants (left) and mean lettuce head fresh mass (n = 4) harvested after 25 days (right) grown in different nutrient solutions. Error bars are standard deviations. Significant differences between treatments for the heads by the ANOVA (F (2,9) = 183; p < 0.001) are indicated by different letters.
Agriculture 14 00928 g005
Figure 6. Nutrient concentrations supplied on the respective day by the fresh bioponic (a) and spiked bioponic solution (b) and the electrical conductivity (EC) (c). Values are mean values (n = 4), error bars are standard deviations (not shown if smaller than the symbol).
Agriculture 14 00928 g006
Figure 7. pH of the exchanged nutrient solutions after three to four days in the deep water culture containers. Initial pH was six in each solution. Values are mean values (n = 4), error bars are standard deviations (not shown if smaller than the symbol).
Agriculture 14 00928 g007
Figure 8. Lettuce plant grown for 25 days in Hoagland (left), bioponic (center) or spiked bioponic nutrient solution (right).
Agriculture 14 00928 g008
Table 1. Selected organic residues and their N, P, and K content in percentage of dry mass (DM) and their DM in percentage of fresh mass (FM).
Organic ResidueNPKDM
[% DM][% FM]
Blood meal15.5 ± 0.00.2 ± 0.00.6 ± 0.192.1 ± 0.2
Bone meal7.0 ± 1.320.1 ± 0.30.0 ± 0.095.2 ± 0.1
Potato peel//2.4 ± 0.013.2 ± 0.2
Table 2. Nutrient concentrations of well-established hydroponic solutions, suitable for vegetative growth (Adapted from [31]).
MacronutrientsMicronutrients
References NH4+-NNO3-NPO43−-PKCaMgSBFeZnCuMnMo
mg L−1mg L−1
Jones and Shive (1921) [31] 3920465102292172227/0.80////
Hoagland and Arnon (1938) [32] 141963123416048640.500.600.050.020.500.01
Withrow (1948) [33]A287063390200966070.502.000.050.020.30/
B2814063390200964470.501.000.050.020.30/
C142246339012096640.501.000.050.020.30/
Schwarz (1968) [34]A15196312341604864//////
B2012671901805596//////
C33933720913122300.461.700.090.040.800.03
D331353720914622300.461.700.090.040.800.03
E331773720914622300.461.700.090.040.800.03
Range 14–3970–22431–7190–390120–29222–17230–6070.46–0.500.60–2.000.05–0.090.02–0.040.30–0.800.01–0.03
Means 2615650246174681660.481.310.070.030.540.03
Table 3. Nutrient concentrations of digested blood meal (BM), the bioponic P and K stock solutions, all three produced by anaerobic digestion, and of the bioponic NO3 stock solution, produced using a moving bed biofilm reactor. Values are mean values ± standard deviation of three pseudoreplications.
NutrientBM DigestateNO3 SolutionP SolutionK Solution
[mg L−1]
NH4+-N1155.9 ± 3.330.3 ± 0.4105.9 ± 1.497.4 ± 2.2
NO3-N0.9 ± 0.168.9 ± 1.30.3 ± 0.10.3 ± 0.1
PO43−-P2.5 ± 0.00.0 ± 0.0166.0 ± 2.98.6 ± 0.2
K86.4 ± 0.047.9 ± 0.036.0 ± 3.12520.0 ± 20.4
Ca180.5 ± 0.577.2 ± 0.2429.5 ± 0.527.3 ± 1.9
Mg81.1 ± 0.111.9 ± 0.215.4 ± 0.0130.5 ± 5.5
S7.4 ± 0.33.9 ± 0.23.7 ± 0.082.8 ± 4.7
B0.50 ± 0.00.41 ± 0.00.48 ± 0.01.29 ± 0.2
Fe4.94 ± 0.20.52 ± 0.04.05 ± 0.062.80 ± 2.7
Zn0.90 ± 0.00.79 ± 0.00.87 ± 0.02.10 ± 0.1
Cu0.00 ± 0.00.12 ± 0.00.01 ± 0.00.01 ± 0.0
Mn0.30 ± 0.00.78 ± 0.00.24 ± 0.01.56 ± 0.0
Mo0.01 ± 0.00.01 ± 0.00.00 ± 0.00.10 ± 0.0
Na25.30 ± 1.221.70 ± 0.519.70 ± 0.911.00 ± 2.8
Table 4. Analysis of the bioponic stock solutions after the end of the hydroponic experiment. Values are mean values ± standard deviation of three pseudoreplications. Δ represents percentual changes in the nutrient concentrations of the bioponic stock solutions from the start of storage (Table 3) to the end of the hydroponic experiment (35 days).
NutrientsNO3-SolutionP-SolutionK-Solution
mg L−1Δmg L−1Δmg L−1Δ
NH4+-N2.7 ± 0.0−91.1%75.8 ± 1.1−28.4%101.5 ± 2.74.2%
NO3-N7.4 ± 0.1−89.3%0.2 ± 0.0−33.3%0.3 ± 0.00.0%
PO43−-P0.1 ± 0.00.0%193.6 ± 2.516.6%6.4 ± 0.1−25.6%
K37.6 ± 0.1−21.5%39.8 ± 1.710.6%2507.8 ± 27.8−0.5%
Table 5. Nutrient concentration in shoot dry matter of lettuce grown for 25 days in either Hoagland, bioponic, or spiked bioponic solution. Values are mean values ± standard deviation of four replicates. Significant differences between treatments are indicated by different letters (p ≤ 0.05).
ElementHoaglandBioponicSpiked Bioponic
[g kg−1]
C400.2 ± 4.3b420.2 ± 2.6a409.8 ± 4.4ab
N49.5 ± 1.2a33.9 ± 5.0b40.4 ± 7.6ab
P8.3 ± 0.7a4.9 ± 0.7ab4.4 ± 0.5b
K49.8 ± 4.1a44.4 ± 2.2a55.0 ± 10.5a
Ca13.2 ± 1.4a8.5 ± 1.4a12.6 ± 1.5a
Mg2.9 ± 0.1a1.7 ± 0.1b1.8 ± 0.3ab
S2.7 ± 0.1a1.8 ± 0.4a1.8 ± 0.2a
[mg kg−1]
B27.8 ± 3.0a22.1 ± 2.8a28.1 ± 4.9a
Fe80.3 ± 9.6a83.2 ± 34.6ab57.3 ± 5.6b
Zn33.6 ± 5.7a22.9 ± 4.7ab18.4 ± 0.8b
Cu4.5 ± 0.6a5.7 ± 1.8a4.2 ± 0.8a
Mn21.2 ± 1.0a22.7 ± 6.5a16.8 ± 4.9a
Mo10.9 ± 1.7a7.6 ± 0.4ab7.4 ± 1.1b
Disclaimer/Publisher’s Note: The statements, opinions and data contained in all publications are solely those of the individual author(s) and contributor(s) and not of MDPI and/or the editor(s). MDPI and/or the editor(s) disclaim responsibility for any injury to people or property resulting from any ideas, methods, instructions or products referred to in the content.

