Article

Public Willingness to Pay for Farmland Eco-Compensation and Allocation to Farmers: An Empirical Study from Northeast China

1
Department of Management Science and Engineering, Northeast Agricultural University, Harbin 150030, China
2
Faculty of Economic and Management, Mudanjiang Normal University, Mudanjiang 157011, China
3
Zhujiang College, South China Agricultural University, Guangzhou 510900, China
*
Author to whom correspondence should be addressed.
Agriculture 2024, 14(7), 1166; https://doi.org/10.3390/agriculture14071166
Submission received: 13 May 2024 / Revised: 30 June 2024 / Accepted: 16 July 2024 / Published: 17 July 2024
(This article belongs to the Special Issue Agricultural Strategies for Food and Environmental Security)

Abstract

:
Farmland eco-compensation, as a typical payment for ecosystem services scheme, aims to address trade-offs between environmental and developmental objectives. As indispensable eco-compensation supporters, the public’s willingness to pay (WTP) for farmland eco-compensation and the allocation to farmers directly affect ecological safety and sustainable development for farmland. Therefore, this study links the public’s WTP for the farmland eco-compensation to the financial subsidies received by farmers and presents a theoretical framework and research approach that connects stakeholders, applying improved choice experiments for empirical study in the black soil region of northeastern China. The results showed that the public has a positive WTP for the farmland eco-compensation program that improves the area, soil thickness, and organic content expeditiously. The public’s WTP allocation for eco-compensation varies considerably, with the share allocated to farmers in their WTP averaging 46.96%, showing a benchmark for compensation standards. The results revealed the influential relationship between the socioeconomic characteristics of the public with WTP allocation and the preferences for farmland eco-compensation, such as the positive correlation between age with WTP allocation and females’ greater preference for eco-compensation. These findings can provide new perspectives and approaches to exploring sustainable pathways for farmland eco-compensation.

1. Introduction

Most of the Earth’s soil resources are in general or infertile states, with Asia having the highest anthropogenic soil degradation [1]. Farmland, as an important soil resource, is directly related to human survival and development [2]. As a large agricultural and populous country, China has nearly 1.35 million square kilometers of farmland, which is significant for the world’s food security and ecology [3]. However, with China’s reform and opening up, the consequences of economic development and urban expansion have been the loss and degradation of farmland, which has decreased by approximately 14.67 million hectares from 1978 to date [4,5]. About 19.4% of farmland in China is contaminated with cadmium, nickel, and arsenic, and increased input of trace elements into the soil has attracted global attention [1]. Continued farmland degradation may trigger major crises at the economic, social, and environmental levels [6], and conservation measures are urgently needed.
Among the various tools for farmland conservation, the contribution of economic incentive policy tools has been proven to be higher than that of command-and-control tools [7]. Payment for ecosystem services (PES), a tool that provides economic incentives to service providers to ensure the sustainable supply of ecosystem services (ESs) by increasing the number of non-market goods and services provided by ecosystems [8], has been widely applied to natural resource management projects such as farmland [9], forests [10], grassland [11], and watersheds [12]. Farmland eco-compensation, a typical PES scheme that promotes the conservation and restoration of farmland ecosystems by internalizing externalities [13], has been implemented in about a quarter of China’s provinces [14]. These compensation programs are government-led due to the complexity of natural resource management, and the cost of eco-compensation is borne by the public and then distributed to farmers to incentivize them for farmland conservation [15,16].
Nevertheless, farmland eco-compensation has the following important issues affecting its effectiveness and sustainability. At the micro level, the public benefits from farmland ESs other than agricultural products under low-cost conditions, yet farmers improve some ESs such as regulating services and cultural services in protecting farmland without corresponding compensation [17]. At the government level, many eco-compensation programs are subject to problems such as rough management and corruption in implementing the programs due to the government’s top-down administrative system [15,17]. The above problems not only create conflicts between the public and farmers but also lead to unfair and ineffective compensation funding allocation, thus hindering the compensation policy regulation for sustainable management. The core idea of eco-compensation is that ES beneficiaries pay compensation to local land managers and incentivize land conservation micro-entities to maintain and improve ESs [18]. As indispensable eco-compensation supporters, the public’s willingness to pay (WTP) for farmland eco-compensation and the allocation to farmers directly affect the ecological safety and sustainable development of farmland.
The current research focuses on the willingness to pay and preferences of the public or farmers for farmland eco-compensation in terms of improving farmland attributes, eco-compensation methods, climate mitigation, and fallow policies. Jin et al. assessed the public’s willingness to pay and preferences for land facilities, land fertility, and landscape improvements in an empirical study in Wenling City, China [19]. Yang et al. analyzed the preferences of Wuhan, China, citizens for farmland eco-compensation methods in terms of monetary, in-kind, technology, and policy [7]. Zandersen et al. measured the potential and economic benefits for Danish farmers to reduce tillage to mitigate climate impacts [20]. Johnston and Bergstrom assessed public preferences for farmland use priority, farmland location priority, land quality priority, and total acres of easements purchased in a case study of agricultural conservation easements from Georgia [21]. Yu et al. studied fallow compensation policy alternatives for farmers in Chaling County, China, where compensation alternatives included recultivation insurance, priority right of participation, and period of free agricultural inputs [22]. Travisi and Nijkamp assessed the public’s willingness to pay for reduced pesticide use on farmland in an empirical study in northern Italy [23]. Chen et al. estimated public preferences for policy instruments and agricultural land types in Tianjin, China [24]. The above studies have dissected and made progress in optimizing farmland eco-compensation policy, which helps to explore sustainable pathways for eco-compensation.
Although an increasing number of scholars have conducted research from the perspective of the public [3,21] or farmers [20,22] based on environmental quality standards and policy objectives, the limited amount of theoretical and empirical research related to structurally linking them in the face of sustainable policymaking severely constrains the potential of compensation mechanisms. At the micro-scale, the public and farmers as stakeholders are on the demand and supply side of ESs, respectively [17]. In terms of demand, the public depends closely on various farmland ESs and conserves them through eco-compensation, and public support is the foundation of eco-compensation programs [25]. From the supply perspective, farmers’ farming behaviors are closely related to the supply of farmland ESs [14], and financial subsidies can incentivize and guide them to conserve farmland [26]. Due to the lack of communication and negotiation interfaces between demand and supply [27], it is difficult to motivate farmers to increase their incentives to conserve farmland according to the public’s needs and preferences [28]. Accordingly, linking the public’s willingness to pay for farmland eco-compensation to the financial subsidies received by farmers can contribute to effectively utilizing compensation funds as well as increase public support and participation in farmland eco-compensation.
Since farmland eco-compensation is difficult to evaluate in economic terms [29], it is often valued using the choice experiment (CE) method [3,22,30]. The CE method can quantify the impact of multiple attributes of items on individual choices and reveal respondents’ preferences and valuations for those attributes [24,30]. Unlike previous studies that only consider the public or farmers, the innovation of this study is to find an interface between public and farmer communication, considering both sides and proposing a theoretical framework and analytical approach that connects them. This practice can provide new perspectives and approaches for utilizing compensation funds efficiently and exploring sustainable pathways for farmland eco-compensation. The contribution of this paper is in two main aspects. In theory, the study proposes a theoretical framework for linking the public and farmers to promote positive interactions among coupled ecosystems, under which an analytical approach to connecting stakeholders is explored. This study identifies and quantifies the payment allocation to farmers by the public using a combination of the random parameter logit model and the weighting method. In practice, this study provides a benchmark for compensation standards by linking the public’s willingness to pay and the compensation funds obtained by the farmers, which helps to improve the use efficiency of compensation funds as well as provide policy-relevant insights for optimizing compensation mechanisms, such as compensation standards, compensation conditions, and compensation methods.
The main purpose of this study is to explore the public’s willingness to pay for farmland eco-compensation and the allocation to farmers in order to facilitate compensation policy regulation for sustainable management. In this study, we chose to conduct an empirical study in Heilongjiang Province, which is the largest agricultural province in China, with the highest percentage of farmland in China, and is more representative. We implemented a CE survey to collect information on the public’s payment allocation to farmers in farmland eco-compensation by extending the traditional CE questionnaire. A combination of random parameter logit modeling with the weighting method was used to identify and quantify the share allocated to farmers from the public’s WTP. The research results provide a benchmark for compensation standards and offer empirical evidence on the differentiated target populations, compensation methods, and compensation conditions for farmland eco-compensation. The approach adopted in this study can be applied to other fields and wider research contexts to provide methodological support for value assessment. The rest of the paper is structured as follows: Section 2 constructs a theoretical framework for connecting stakeholders; Section 3 describes the survey area, choice experiment, and model specification; Section 4 presents the research results obtained; Section 5 centers the discussions around the results and ends with conclusions.

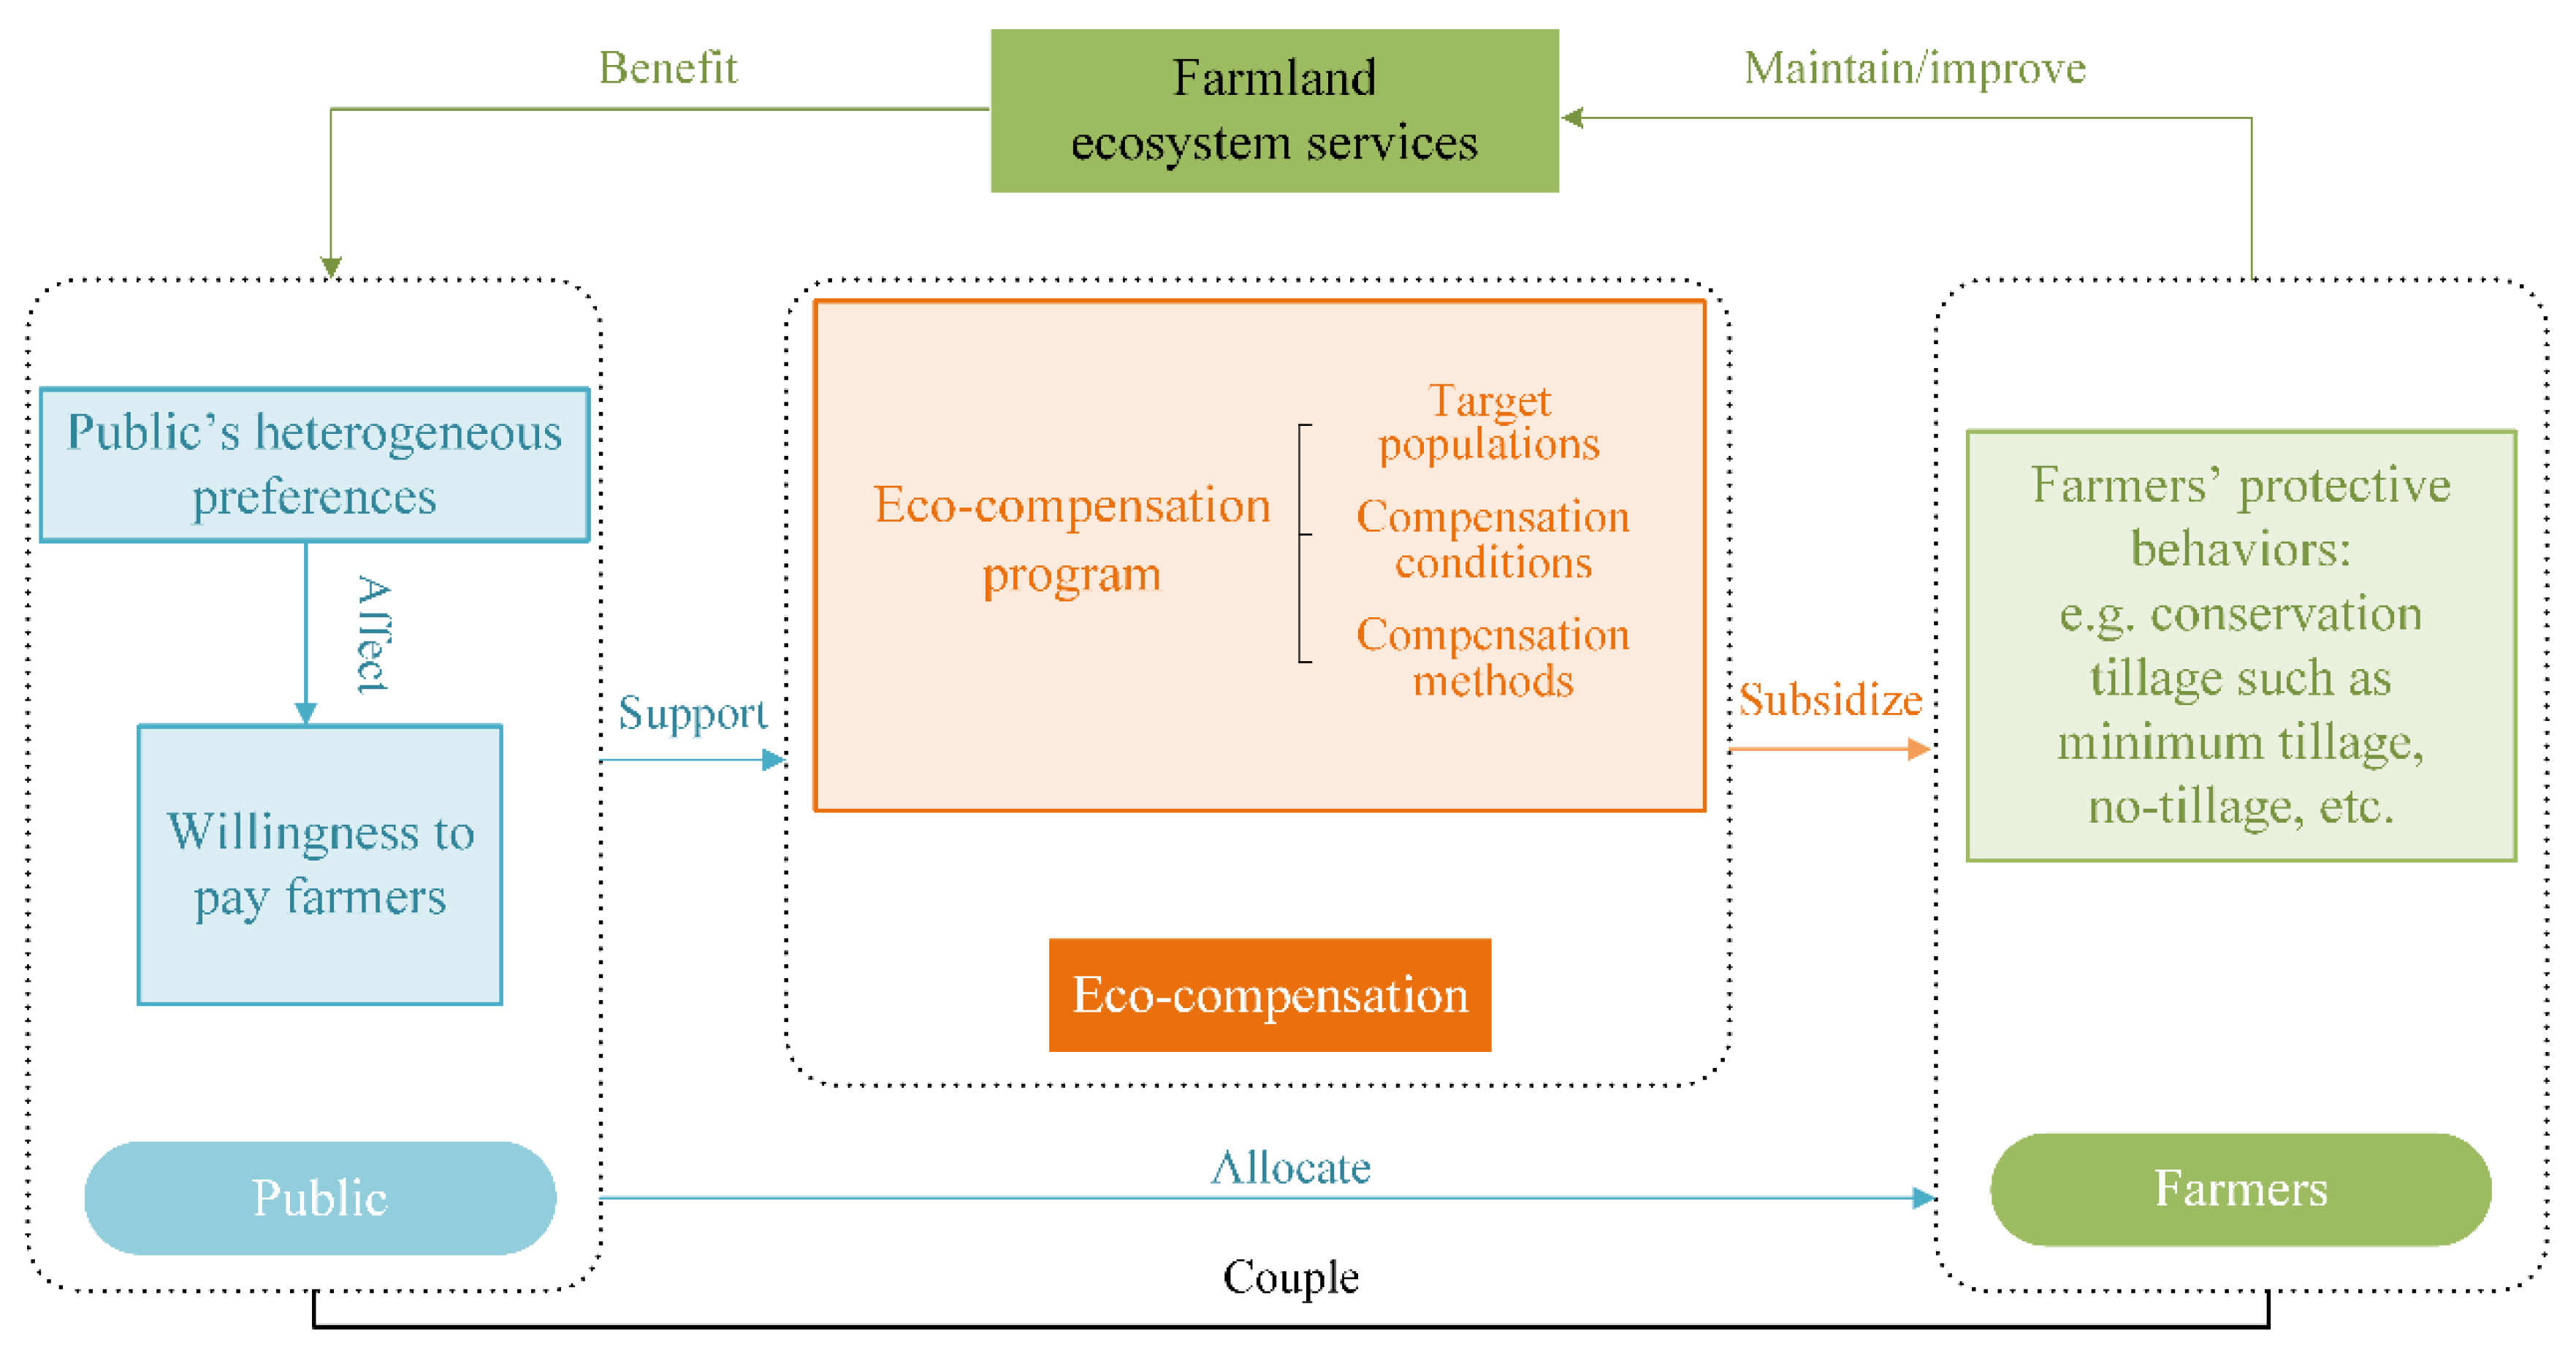
2. Theoretical Framework

To seek effective pathways for farmland eco-compensation and clarify the relationship between stakeholders, we constructed a theoretical framework by linking the public’s willingness to pay for farmland eco-compensation, eco-compensation organized by the government, and financial subsidies received by farmers (see Figure 1). The framework consists of four components: farmland ESs, eco-compensation, the public, and farmers. The linkages among them constitute the pathways through which the components interact with each other (arrows in Figure 1).
As a coupled human–nature ecosystem [31], the farmland ecosystem not only produces agricultural products on which people depend but also provides society with other ESs, such as water harvesting, climate regulation, and natural landscapes [32]. Farmland ESs are modified by public preferences and demand-induced land management while being conserved and utilized by farmers. From the public’s perspective, fundamental to their willingness to pay for protecting farmland is the maintenance or improvement of farmland ESs properties, including access to food supply and ecological enhancement. ESs are natural utilities provided by the ecosystems and ecological processes on which humans depend, and the public’s preferences for farmland eco-compensation indicate how much they demand these utilities. Due to the public’s heterogeneous preferences, they differ in their payment allocation for eco-compensation. From the farmers’ perspective, their different farming behaviors will affect farmland ESs to varying degrees [26], and non-conservation farming behaviors will lead to excessive depletion of the natural capital stock of farmland, which in turn will affect social welfare. Therefore, it is crucial to understand how much of the public’s WTP is allocated to farmers in farmland eco-compensation, which can help implement eco-compensation programs that meet social needs as well as promote the fair and effective allocation of ecological and economic benefits.
Farmland eco-compensation programs are very complex in their implementation, and existing studies mainly focus on issues such as eco-compensation standards, target population determination, and the choice of compensation methods. Liu et al. estimated eco-compensation standards by surveying farmers’ willingness to accept in an empirical study of the Hani Rice Terraces System from China [33]. Travisi and Nijkamp investigated the public’s willingness to pay for reduced pesticide use on farmland in northern Italy to determine compensation standards [23]. Jin et al. identified the target population for farmland eco-compensation by investigating public preferences for eco-compensation in Wenling City, China [19]. Yang et al. investigated the preferences of citizens and farmers for different farmland eco-compensation methods in Wuhan, China, and explored the socioeconomic characteristics that influence preferences [7]. Although the above studies have contributed to optimizing farmland eco-compensation policies, the theoretical framework developed in this study helps to integrate the above issues. Specifically, farmland eco-compensation in China is essentially cost-sharing by the public, whose willingness to pay for farmland eco-compensation is relatively low due to the misperception that farmland is valued much less than other land uses [3], thus necessitating the identification of target populations for eco-compensation. Eco-compensation is usually conditional on activities (agricultural practices, etc.) or results (organic content, etc.), with results-based eco-compensation proving more attractive due to its observability [34]. Currently, farmland eco-compensation in China is conditional on activities, which limits farmers’ incentives to maintain and improve farmland ESs. For eco-compensation methods, in addition to monetary compensation, eco-compensation also includes in-kind (e.g., land use rights), technical (e.g., skills training), and policy (e.g., labor priority) aspects [35,36], and the public’s preferences for such multiple compensation methods and the allocation of funds supporting eco-compensation need to be further explored. Compensation policy regulation for sustainable management should utilize external incentives based on the funds paid by the public to enhance the motivation of farmers to focus on maintaining or improving ESs, in order to achieve positive interactions in the coupled ecosystems.
Effective operation of the compensation mechanism should pay attention to public preferences and needs, and it is important to identify and quantify the public’s share of WTP allocated to farmers in eco-compensation. This issue can be addressed by an econometric approach that relates the public’s WTP allocation to the financial subsidies received by farmers. By establishing an economic linkage between the two sides, the theoretical framework contributes to effectively utilizing compensation funds and optimizing eco-compensation mechanisms.

3. Materials and Methods
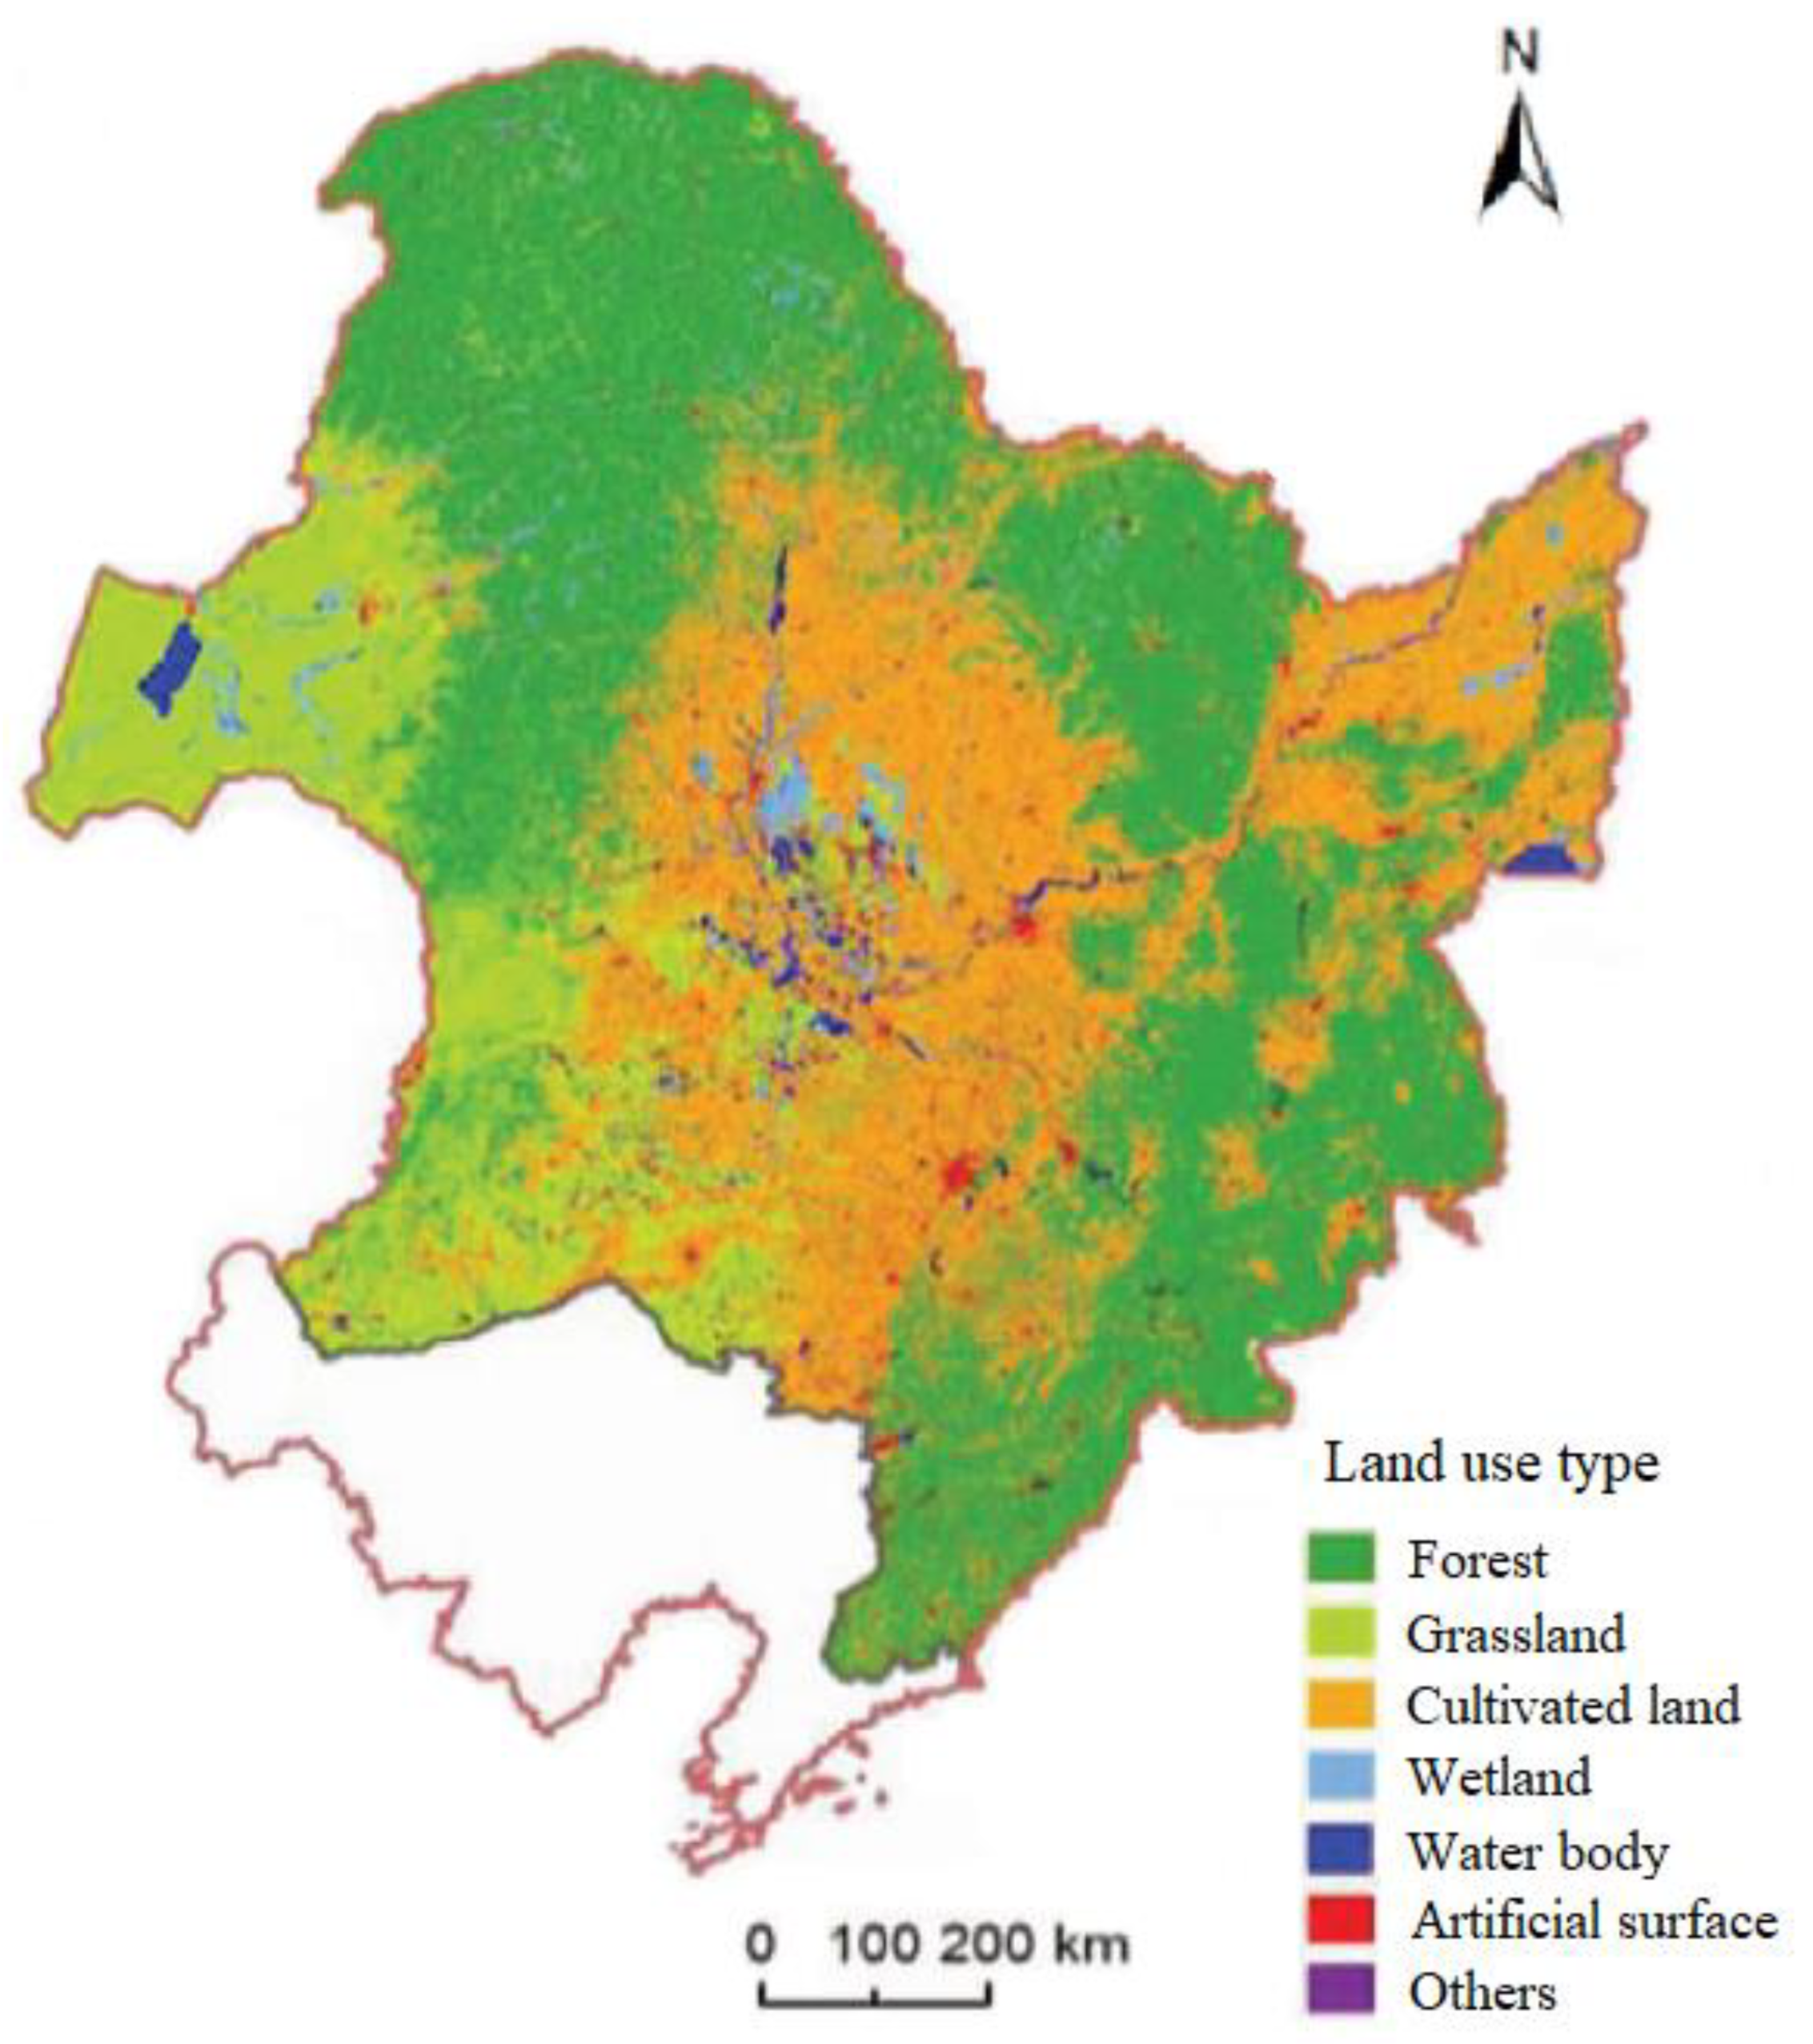
3.1. Survey Area

As a large agricultural and populous country, China’s farmland protection has always received considerable attention [14]. The survey area was chosen as Heilongjiang Province (43°26′–53°33′ N; 121°11′–135°05′ E), which has the highest percentage of farmland in China and is a major agricultural province [4]. Heilongjiang Province is the northernmost and easternmost provincial administrative region in China (see Figure 2), with a cold-temperate and temperate continental monsoon climate, and the main food crops are corn, rice, and soybeans [37]. The province has a total area of 473,000 square kilometers, with 12 prefectural-level cities and one district under its jurisdiction, and a resident population of 31,850,100 people [4].
Of the approximately 17.19 million hectares of farmland in Heilongjiang province, the area of black soils is about 10.4 million hectares, accounting for about 60.49% [37]. It is thus representative to choose black soils as the research object of farmland eco-compensation. Black soils refer to soil with a black or dark humus topsoil layer, which is high-quality land with good properties, high fertility, and suitable for farming [37]. Like other farmlands, black soils are also at risk of severe degradation, such as area, organic matter and nutrient elements, soil structure, and water storage capacity, all of which degrade to varying degrees [38]. These issues of farmland degradation not only affect food security but also put enormous pressure on agroecosystem services.

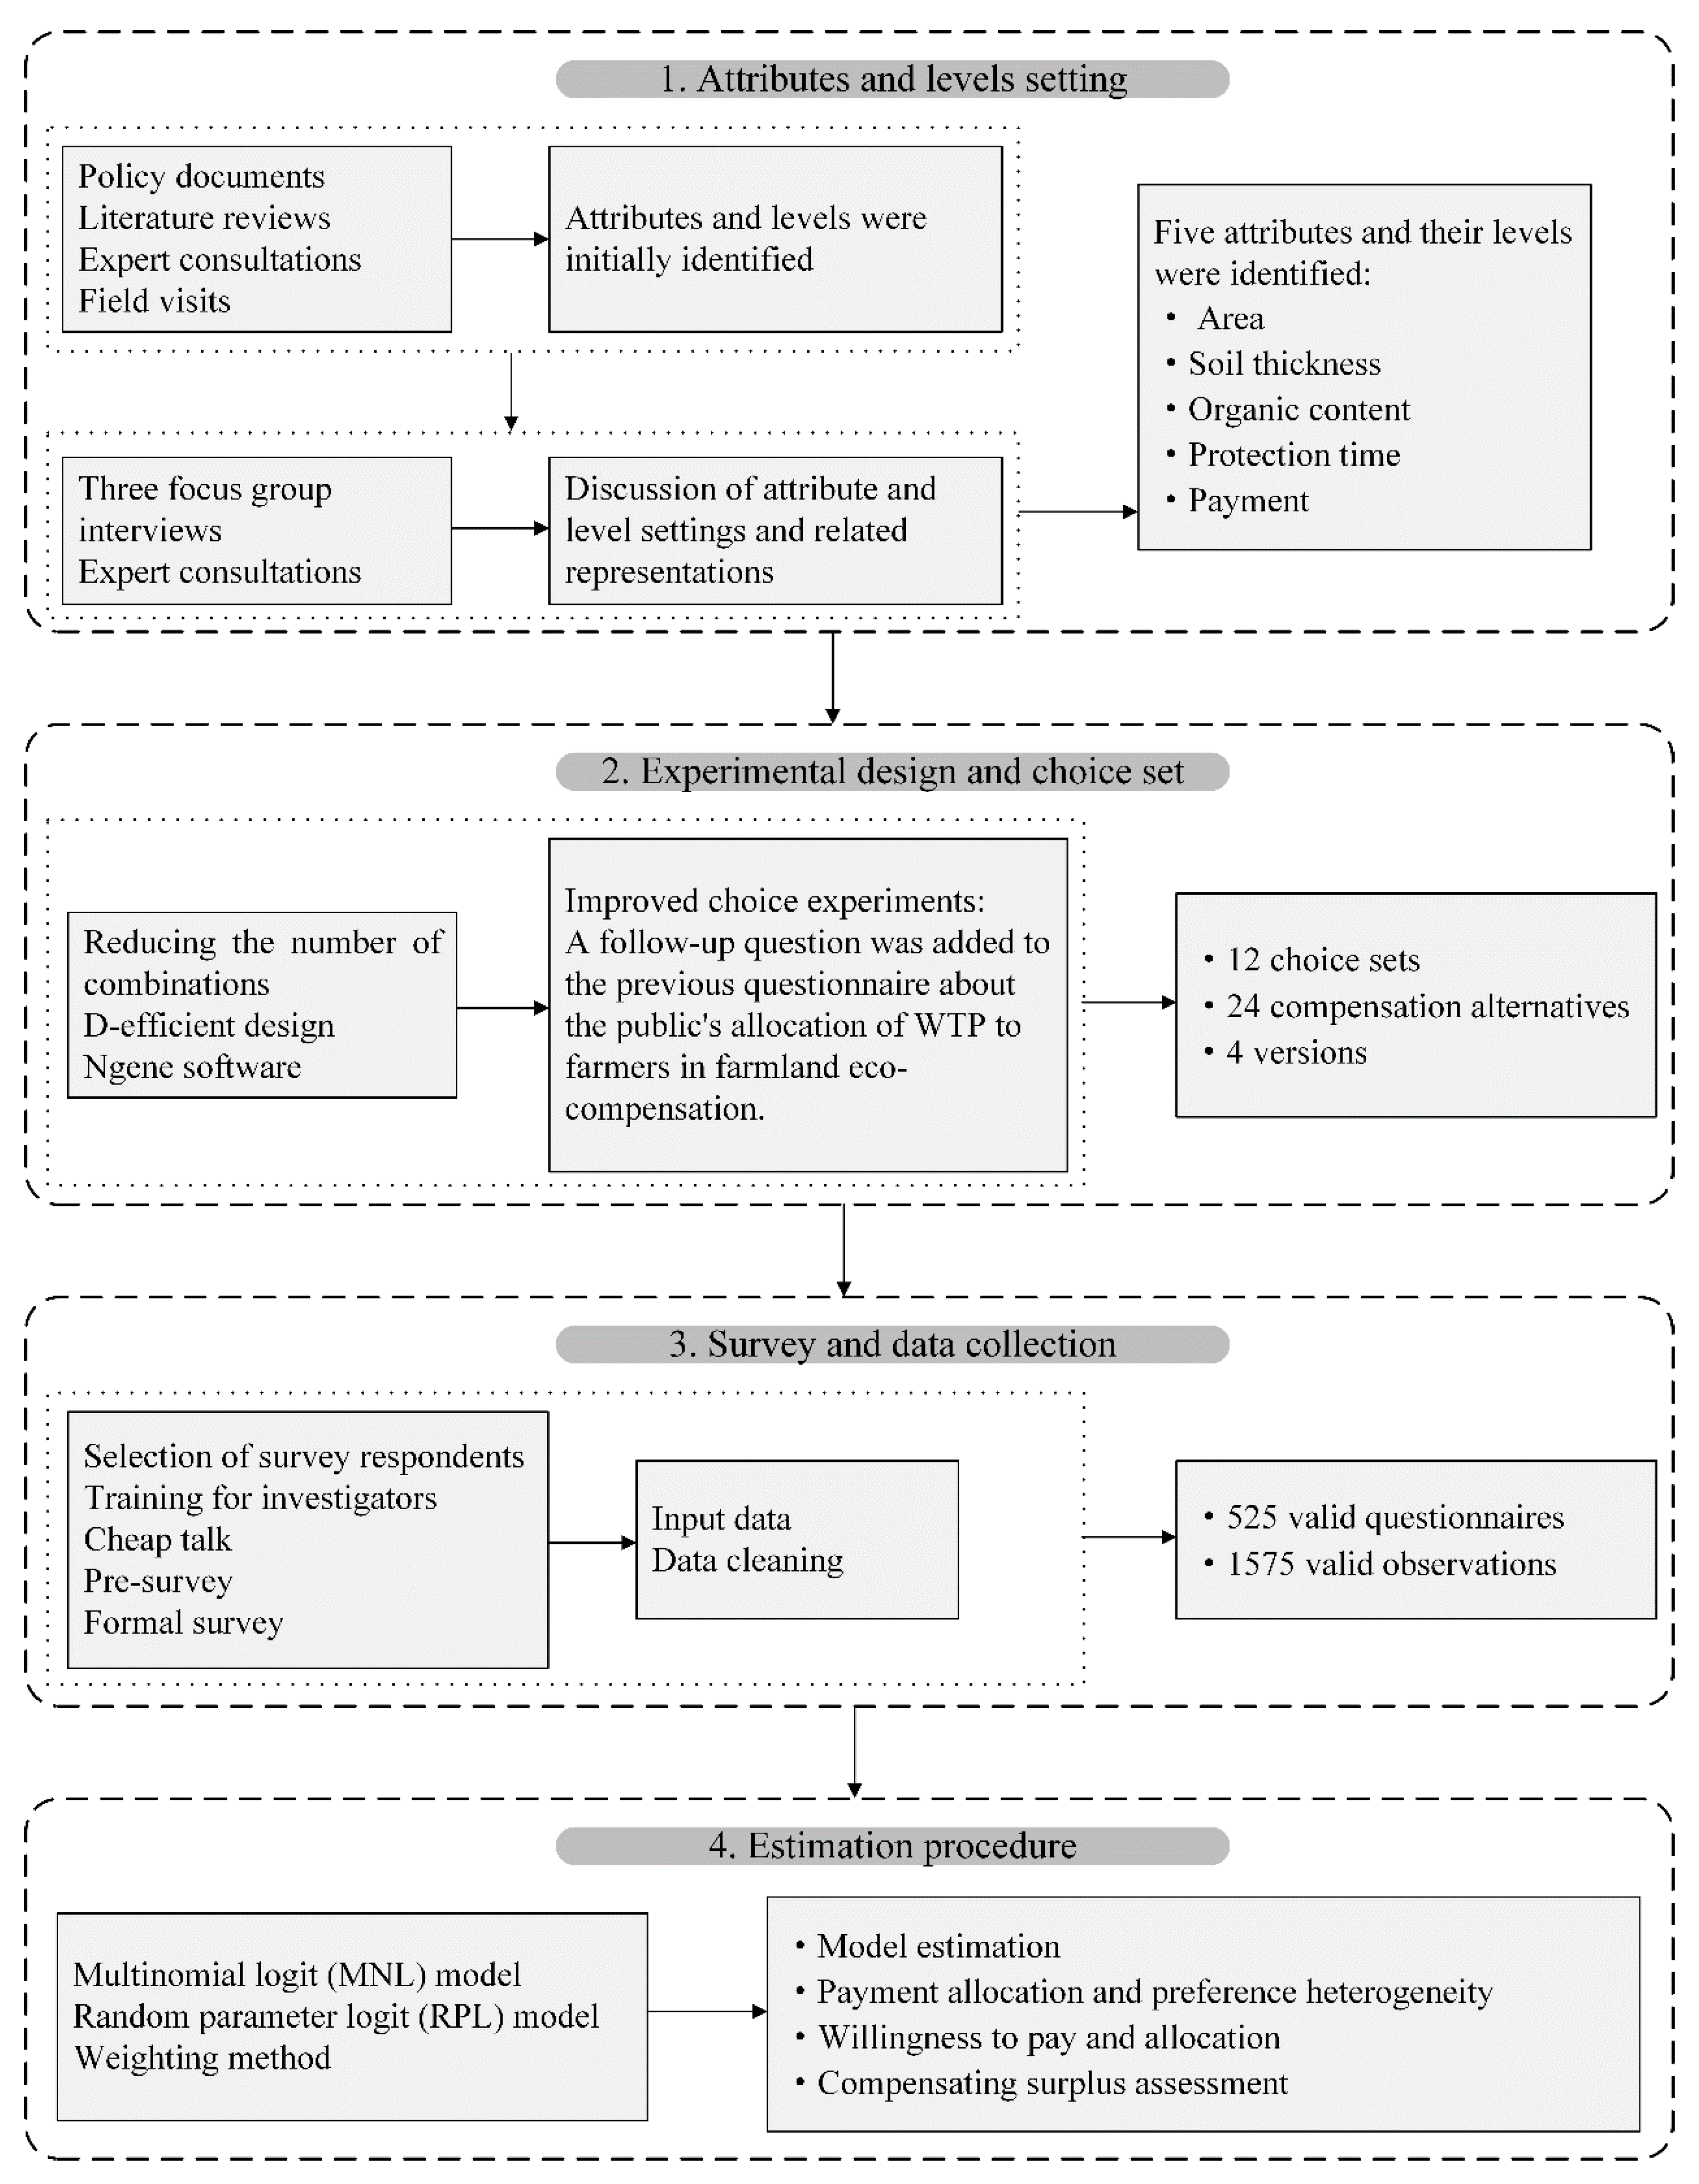
3.2. Choice Experiment

The stated preference (SP) method is an effective means of estimating the use value associated with changes outside the range of current market or observed conditions [39]. Common SP methods include the contingent valuation method (CVM) and choice experiment. These methods are all measures that use responses to survey questions to estimate economic value, with the CVM being used by asking respondents if they would vote for a change proposed at a specific cost, and the CE method being used by asking respondents to indicate their preference and willingness to pay in two or more attribute options [39]. Since policy measures for farmland protection have multiple attributes, the CE method is usually applied. The CE method constructs a model based on respondents’ choice preferences for different attributes of items through a hypothetical market, and it assumes that individuals follow a choice mechanism maximizing utility [40]. The eco-compensation amount from the public for farmland protection can be derived by assessing their willingness to pay for items not traded on the market.
Based on the fact that previous research on eco-compensation was initiated by CE according to the questionnaire application [19,22,36,41], this study carried out the research design by improving the CE questionnaire. To visualize the structure of the research design, as shown in Figure 3, CE is implemented through four main phases: (1) attributes and levels setting; (2) experimental design and choice set; (3) survey and data collection; and (4) the estimation procedure. The following is an extension of these phases.

3.2.1. Attributes and Levels Setting

The attributes and levels of CE were initially determined based on the explicit objectives of black soils protection in two programmatic policy documents in China [42,43], combined with literature reviews [19,24,32,44], expert consultations, and field visits. From March to May 2022, we organized three focus group interviews with 10 participants per focus group (two researchers, three farmers, and five local residents per group), averaging about 90 min in length, and focusing on discussions around the attributes and levels setting and the rationality of the relevant representations. Meanwhile, five land experts from research institutes, universities, and the government were consulted in detail. Based on the above research process, five attributes were identified, including four management attributes: area, soil thickness, organic content, protection time, and one price attribute: payment. Baselines and changes in attribute levels are presented in an accurate, measurable, and interpretable manner, avoiding qualitative terms [45]. Table 1 shows the attributes and their levels, which are expressed as follows:
Area: The area of black soils is the farmland area normally used for crop cultivation in the black soil region. The area is a fundamental attribute of black soils that provides agroecosystem services such as food production, carbon sequestration, and agricultural landscapes. Like some previous studies [20,21,32,46], this study used the area as an important attribute of farmland eco-compensation. Soil erosion in the black soils of Northeastern China covers about 10.33 million hectares, accounting for 54.68% of the area of black soils, and soil erosion mainly originates from sloping farmland of 3–15 degrees [37]. The levels determined after focus group interviews and expert consultation were 0, 5‰, and 10‰ net increases in the area.
Soil thickness: The thickness of the black soil layer is one of the essential indicators for evaluating the fertility of black soils and can be used as a measure of soil age [47]. The thinning of the black soil thickness after reclamation originates from water and wind erosion [48], and dynamic monitoring results show that the soil thickness in some zones has decreased from 60–80 cm in the 1950s to 20–40 cm at present [37]. The current average soil thickness is about 30 cm and is being stripped and lost at an average annual rate of 0.1–0.5 cm [37]. The levels for determining the soil thickness were 0, 5%, and 10% net increase.
Organic content: It refers to the amount of various plant and animal residues in a unit volume of black soils, together with microorganisms and the organic matter synthesized by their decomposition. In the past 60 years, the organic content of black soils has decreased by 1/3, and in some zones, by 50% [37]. Current organic content averages about 30 g/kg and is declining by 0.6–1.4 g/kg per decade [37]. The Chinese government plans to increase the organic content by more than 10% on average by the end of 2025 [43]. The levels of organic content were determined as a net increase of 0, 10%, and 20%.
Protection time: Implementing eco-compensation programs takes time to see results, and the effectiveness of the programs directly depends on the public resources and eco-compensation funds invested [49]. The inclusion of temporal features in the information describing the baseline and changes is to facilitate respondents’ understanding of the valuation scenario and its realism [50]. At the policy level, temporal considerations can also systematically explain farmland eco-compensation that integrates social, economic, and ecological factors [51]. The Chinese government has set a protection completion plan of 13 years [42], and focus group interviews and expert consultation suggested that the protection time levels of 10, 13, and 16 years.
Payment: The price attribute represents an annual surtax to support eco-compensation programs, with compensation funds used primarily for the conservation and sustainable management of black soils. The choice of payment instrument should be as familiar, credible, and binding to respondents as possible, and taxes were chosen as a payment instrument to incentivize compatibility and prevent free-riding [39]. Eco-compensation is usually set to pay a fixed fee [34], and this study chose to use periodic payments. The level of payment was set at RMB 0, 200, 400, 600, 800, and 1000 by combining literature reviews [3,19,32,46,52], questionnaire pre-survey, and focus group interviews.

3.2.2. Experimental Design and Choice Set

CE is conducted by asking respondents relevant questions containing mainly choice sets and a follow-up question on payment allocation. Each alternative in the choice set consists of the five attributes in Table 1. The attributes and their levels in the choice set constitute 405 (34 × 5) different compensation alternatives, which requires statistical design theory to reduce the number of combinations in the choice set and thus ease the respondents’ choice burden. The statistical and response efficiency of the experimental design determines the overall accuracy of model estimation [53], and D-efficient designs are proven to perform better in terms of design efficiency and error [54]. This study used a D-efficient design via Ngene 1.2 to generate 12 choice sets (including 24 compensation alternatives) in four versions. Each version is assigned three choice sets, and each choice set includes two compensation alternatives and one status quo alternative. Respondents are confronted with three choice sets and are required to choose their top preference among the three alternatives in each choice set.
Table 2 shows an example of a choice set. Unlike previous CE studies, this study included a follow-up question below each version to consider the public’s payment allocation to farmers in farmland eco-compensation. The follow-up question extends the traditional choice experiment questionnaire to help collect information on the public’s payment allocation to farmers in farmland eco-compensation, providing data support for following calculations.

3.2.3. Survey and Data Collection

The respondents selected for this study were residents of Heilongjiang Province aged 18 years and above. The survey was conducted in two phases, from June to September 2022. The pre-survey was conducted in Harbin, Heilongjiang Province (containing 115 respondents), with face-to-face interviews, and the formal survey was distributed according to the percentage of population distribution in each city in Heilongjiang Province. A random stratified sampling method based on quotas derived from data from the 7th population census of Heilongjiang Province in 2020 [55] was used for sample selection. A total of 577 respondents were interviewed in the formal survey. After removing 52 invalid questionnaires such as those that were incomplete, 525 valid questionnaires were obtained, providing 1575 (525 × 3) valid observations for this study, and the sample size meets the requirements according to the literature reference [56]. Before the survey, we trained the surveyors, who introduced the respondents to the objectives of CE, as well as each attribute and its level, to help the respondents complete the questionnaire successfully. Cheap talk was introduced to mitigate hypothesis bias in CE [57].
The questionnaire is divided into three parts. The first part explains the basics of black soils in the form of visual information, including attributes such as area, soil thickness, and organic content, so that the respondents can make the following choices more objectively. The second part is a choice experiment that includes three choice sets and a follow-up question on the public’s payment allocation to farmers in farmland eco-compensation. Finally, the socioeconomic characteristics of the respondents, such as gender and age, are collected. The Supplementary Materials document the details of the survey questionnaire.

3.2.4. Estimation Procedure

According to random utility theory [58] and consumer theory [59], the utility U n t i of farmland eco-compensation obtained by respondent n from alternative i in the choice set t is not entirely observable, and can be decomposed into an observable component V n t i and an unobservable component ε n t i , with the utility function expressed as:
U n t i = V n t i + ε n t i
where ε n t i follows type I extreme value distribution of independently and identically distributed (IID) or relaxes to a normal distribution. Respondent n chooses alternative i from the choice set t instead of other alternatives (i.e., alternative j ), which can be expressed as:
U n i t > U n j t , j i t
Equation (1) can be estimated using the multinomial logit (MNL) model, which contains the restrictive assumption of independence of irrelevant alternatives (IIA), i.e., the ratio of choice probabilities is independent of whether any other alternative appears in the choice set. This model generally assumes that respondents’ preferences are homogeneous, and the probability that respondent n chooses alternative i from a specific choice set t containing alternative j is expressed by maximum likelihood estimation as:
P n t i = P U n t i > U n t j , j i T = P V n t i V n t j > ϵ n t j ϵ n t i , j i T = e λ V n t i j = 1 J e λ V n t j
where λ is the scale parameter, usually normalized to 1. The indirect utility function of the MNL model is shown as:
V n t i = A S C + k = 1 k β k X i k + h = 1 h α h Z n h × A S C
where ASC stands for the alternative-specific constant describing the effect of the mean of the unobserved effect residuals in the observable component V n t i of the alternative on this alternative. β k is the estimated parameter of attribute k , X i k is the corresponding level of attribute k in the alternative i , Z n h is the socioeconomic characteristics h of respondent n , and α h represents the correlation coefficient of interaction between Z n h and ASC.
The MNL as a basic logit model has some limitations, including that it exhibits restrictive substitution patterns and cannot represent random taste variations [60]. The random parameter logit (RPL) model can overcome the above limitations. Its choice probability is a mixture of logit, where the density function is a mixed distribution, and the attribute coefficients contained in the alternative in the RPL have both mean and standard deviation [61]. In the RPL model, the probability that respondent n chooses alternative i in the choice set t is:
P n t i = e λ V n t i j = 1 J e λ V n t j f ( β | Ω ) d β
where β is the parameter-specific vector of respondent n , Ω is the parameter describing the distribution density of the individual-specific parameter β , and f ( β | Ω ) is the probability density function of β | Ω .
The difference between the RPL and MNL models is that the former assumes that at least some of the parameters are random, they obey a certain probability distribution, and these random parameters are assumed to be continuous over the sampled population. The indirect utility function of the RPL model is expressed as:
V n t i = A S C + k = 1 k β n k X i k + h = 1 h α h Z n h × A S C
The setting of β n k is more flexible and represents the marginal utility of respondent n for attribute k :
β n k = β k ¯ + φ k S n k
where β k ¯ represents the mean of the marginal utility distribution of the sampling population, φ k represents the deviation of the marginal utility of sample respondents from the mean, and S n k represents the random sampling of the respondent n and attribute k .
An important output of the choice model is the marginal substitution rate between two specific attributes [62], one of which is usually measured in monetary terms. It allows researchers to look more deeply into the analysis of social preferences after estimating the model coefficients and is also the marginal willingness to pay (MWTP) for improving the management attribute k in this study:
M W T P k = Δ x k Δ x p = V n t i x k V n t i x p = β k β p
where β k and β p are the marginal utilities of the management attribute k and the price attribute p , respectively. The random parameter distribution in the RPL model is essentially an arbitrary approximation of the true behavioral characteristics, and the more flexible triangular distribution used in this study can ensure the correct sign of the MWTP and eliminate the long tails of the partial distribution [61]. Considering that the price attribute coefficient as a denominator may lead to the overvaluation of MWTP, it is usually estimated as a non-random parameter [63].
Considering the follow-up question of the choice set (shown at the bottom of Table 2), this study applies a weighting method to calibrate the average MWTP for management attribute k . Respondent n is assigned a weight ω n , and ω n is the share of payment from respondent n that is allocated to farmers. The corresponding MWTP for attribute k is expressed as follows:
M W T P k ¯ = n = 1 N ( ω n × M W T P n k ) N
From the above equation, it can be deduced that the average MWTP allocated to farmers per household is:
M W T P n ¯ = n = 1 N k = 1 K ( ω n × M W T P n k ) N = k = 1 K M W T P k ¯
The compensation surplus (CS) can be used to obtain the welfare change from the status quo of farmland to different compensation scenarios, calculated as:
C S = 1 β p ln t e V o ln t e V 1 = k = 1 K ( M W T P k ¯ × γ k )
where V 0 denotes the initial state (status quo) utility, and V 1 represents the utility obtained by the respondents in a particular compensation scenario. γ represents the vector of the corresponding levels of attribute k .

4. Results

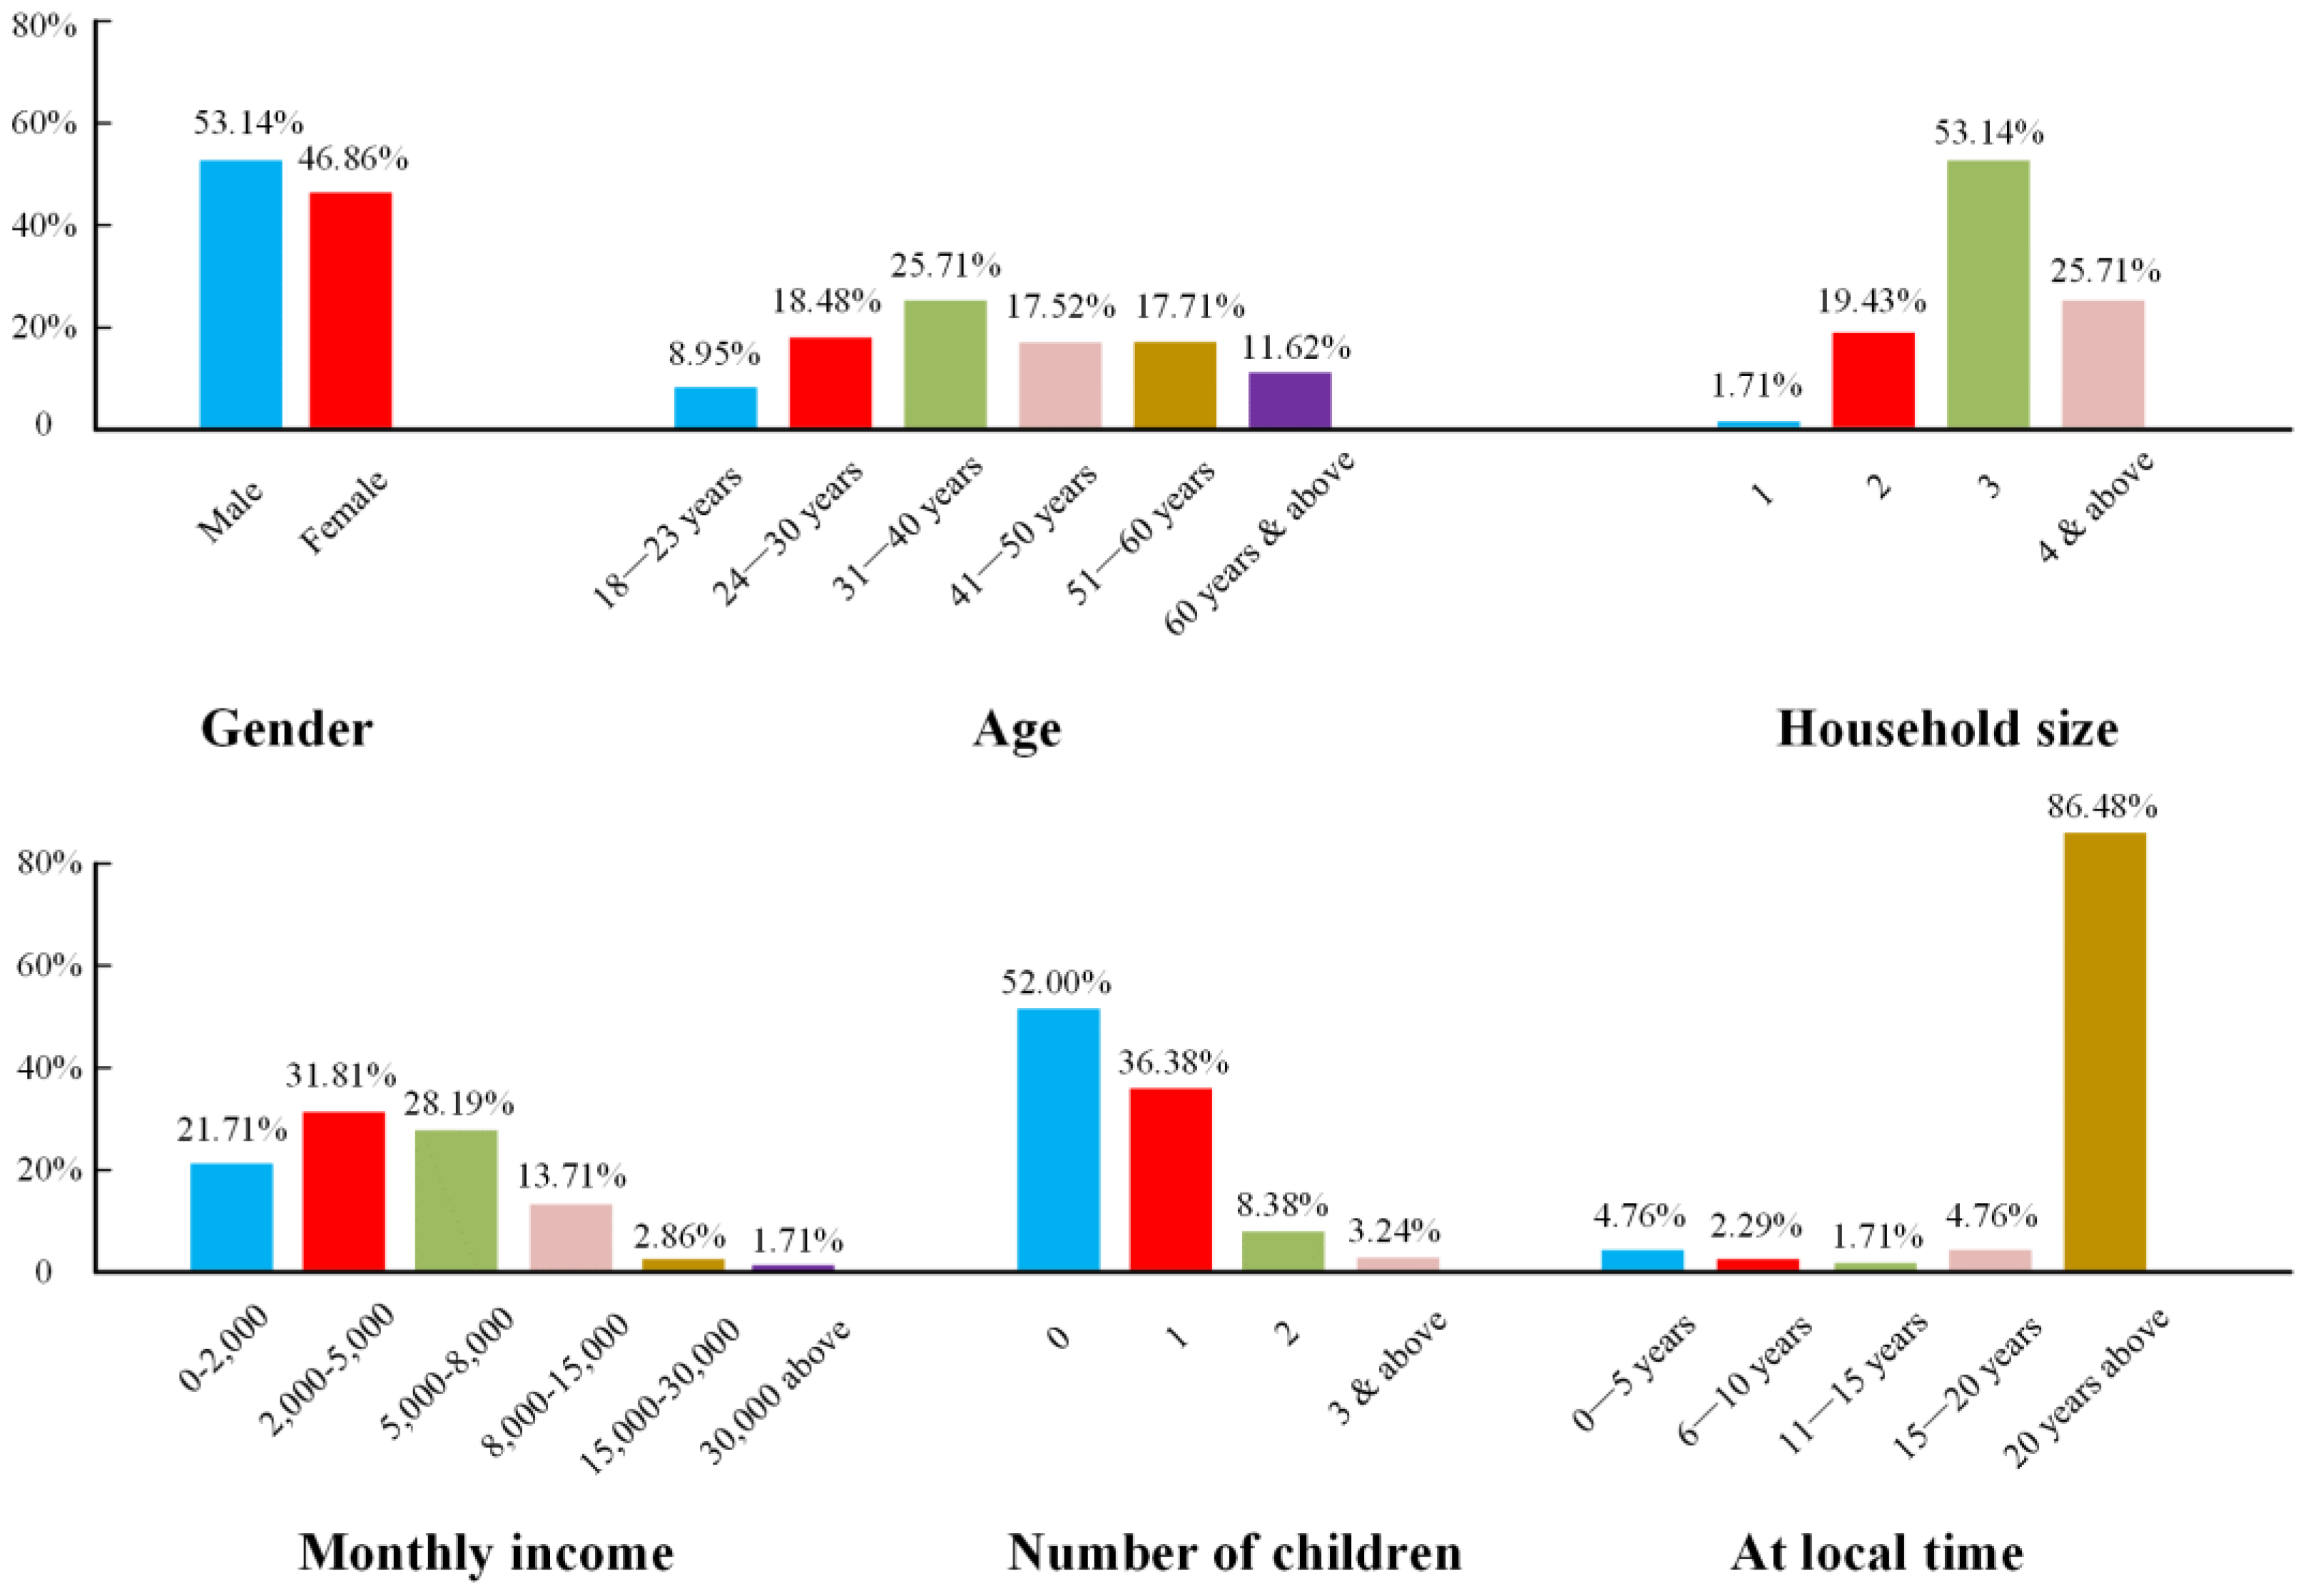
4.1. Descriptive Statistics

Based on the previous literature [19,57], this study selects gender, age, household size, monthly income, number of children in the family, and time spent living in Northeast China as socioeconomic characteristics of the public. Figure 4 shows the descriptive statistics of the respondents’ socioeconomic characteristics. Out of the total sample of 525 respondents, 53.14% are male, and 46.86% are female. They have a wide age distribution, with the largest group being between 31 and 40 years old, accounting for 25.71%, and 11.62% being over 60 years of age. On the family side, 53.14% of the respondents have a household size of three, and 48% of families have children under 14 years old. The number of people with a monthly income of RMB 2000 to RMB 8000 is 60%, and the proportion of people living in Northeast China for 20 years or more is 86.48%. Overall, the sample is basically consistent with the main data of the 7th population census of Heilongjiang Province [55].

4.2. Model Estimation

The results of the MNL model estimation are shown in Table 3(a). Although the coefficients of the attributes and partial interaction variables are significant, this study uses the Hausman test [64] to confirm that the IIA hypothesis is rejected (χ2 = 11.07 at 95% confidence level). Comparing the goodness-of-fit of the models in Table 3(a),(b), we learn that the log-likelihood (LL), Akaike information criterion (AIC), and pseudo-R2 all indicate that the RPL model is statistically superior to the MNL model.
Table 3 shows the positive public response to black soils eco-compensation. Consistent with expectations, all five attributes passed the significance test, and the signs of the coefficients were the same as expected a priori. Respondents support implementing eco-compensation programs to improve the status quo. The public creates positive preferences for a net increase in area, soil thickness, and organic content, but an aversion to extending the protection time and paying more fees. The standard deviations of the random coefficients are all significant at the 5% level, indicating the presence of heterogeneous preferences around the means of the four management attributes. A significantly negative ASC indicates that respondents receive negative utility in the status quo alternative, which validates respondents’ desire to improve the current condition of black soils. The interaction of ASC with respondents’ socioeconomic characteristics indicates that respondents who are females, have more children in the family, or have lived there longer have positive preferences for farmland eco-compensation programs compared to the status quo.

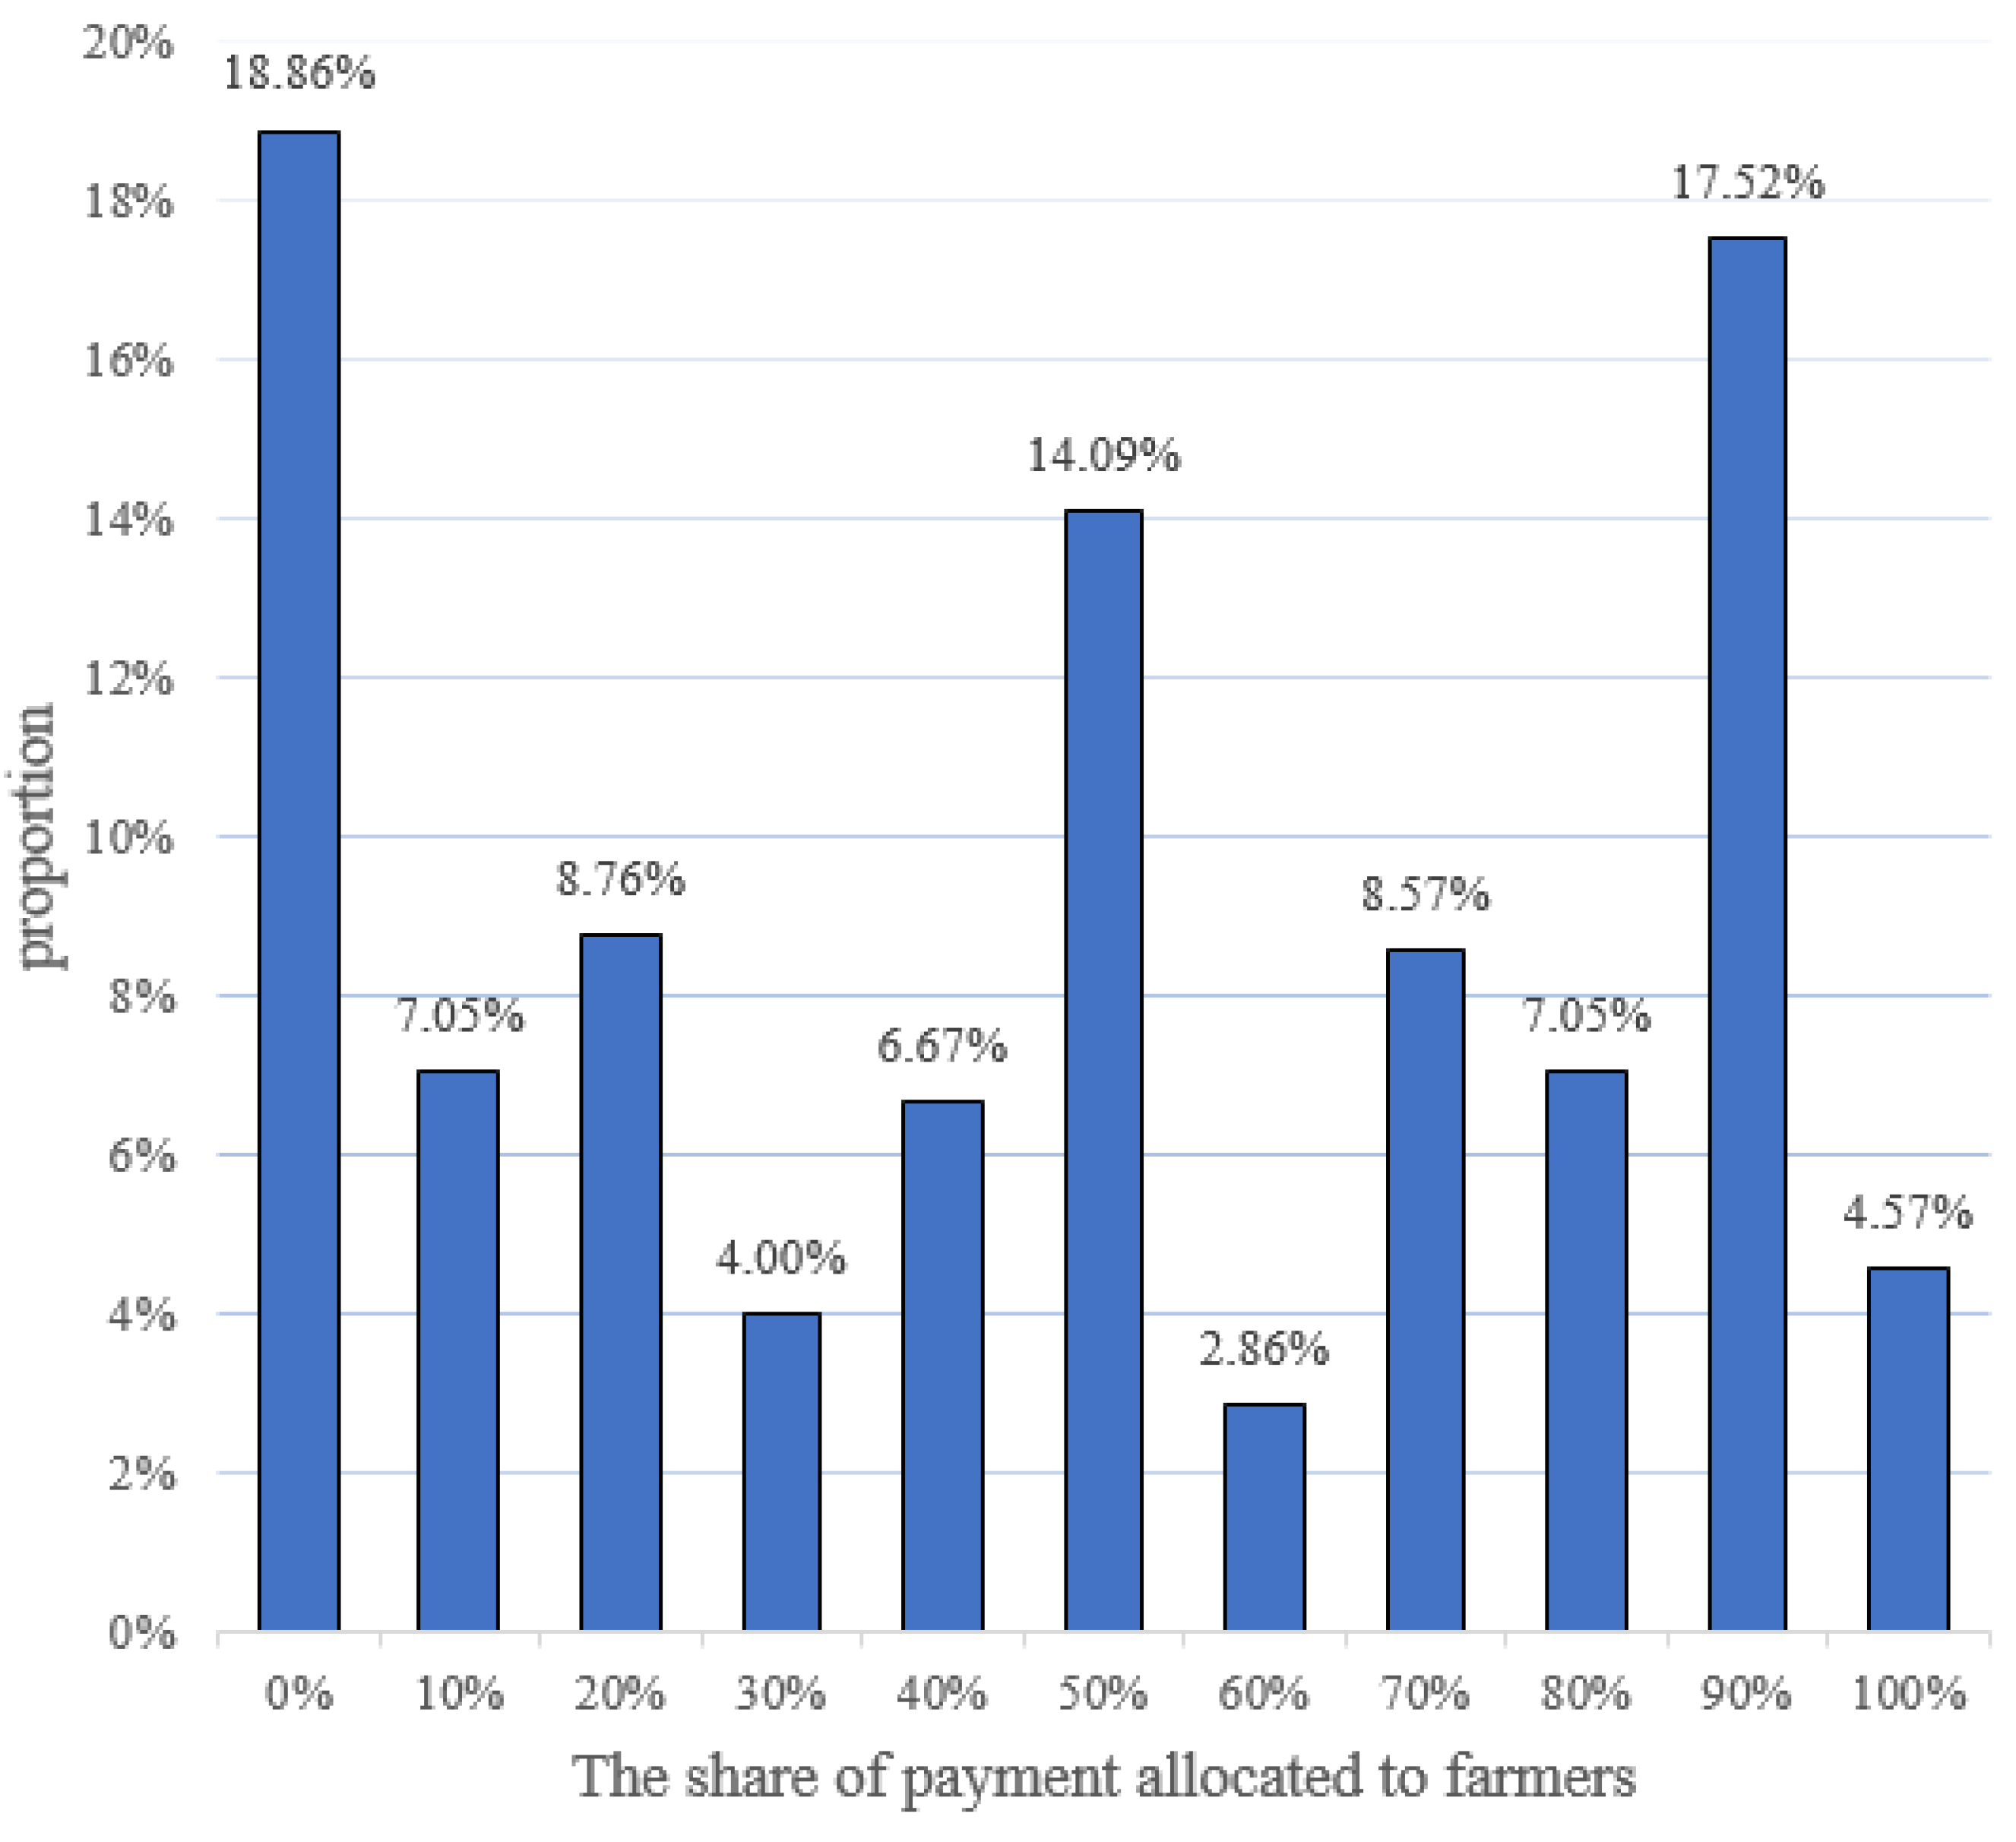
4.3. Payment Allocation and Preference Heterogeneity

Figure 5 shows information on respondents’ payment allocation to farmers in farmland eco-compensation. The share of payment allocated to farmers by the public ranges from 0 to 100%, and 18.86% of the respondents are not willing to allocate any percentage of payment to the farmers. The percentage of respondents who are willing to allocate farmers’ expenses to protect black soils is 81.14%, of which 4.57% are willing to pay the entire payment to farmers, and 7.05% are willing to pay 10% of the payment to farmers to enhance their enthusiasm to protect black soils. There is preference heterogeneity in the share of payment allocated to farmers by different respondents in eco-compensation programs.
Table 4 explains the reasons for this preference heterogeneity. The regression analysis of respondents’ socioeconomic characteristics and the share of payment allocated to farmers reveals that the share of payment allocated to farmers is positively correlated with respondents’ age, household size, and time spent living locally and shows negative correlations with the number of children in the family and income, all significant at the 1% level. The results show that people who are older, have larger families, and living there longer tend to compensate farmers monetarily to increase their motivation to improve farmland. Those with large numbers of children in their families and high incomes do not prefer monetary compensation for farmers and may prefer other compensation methods.

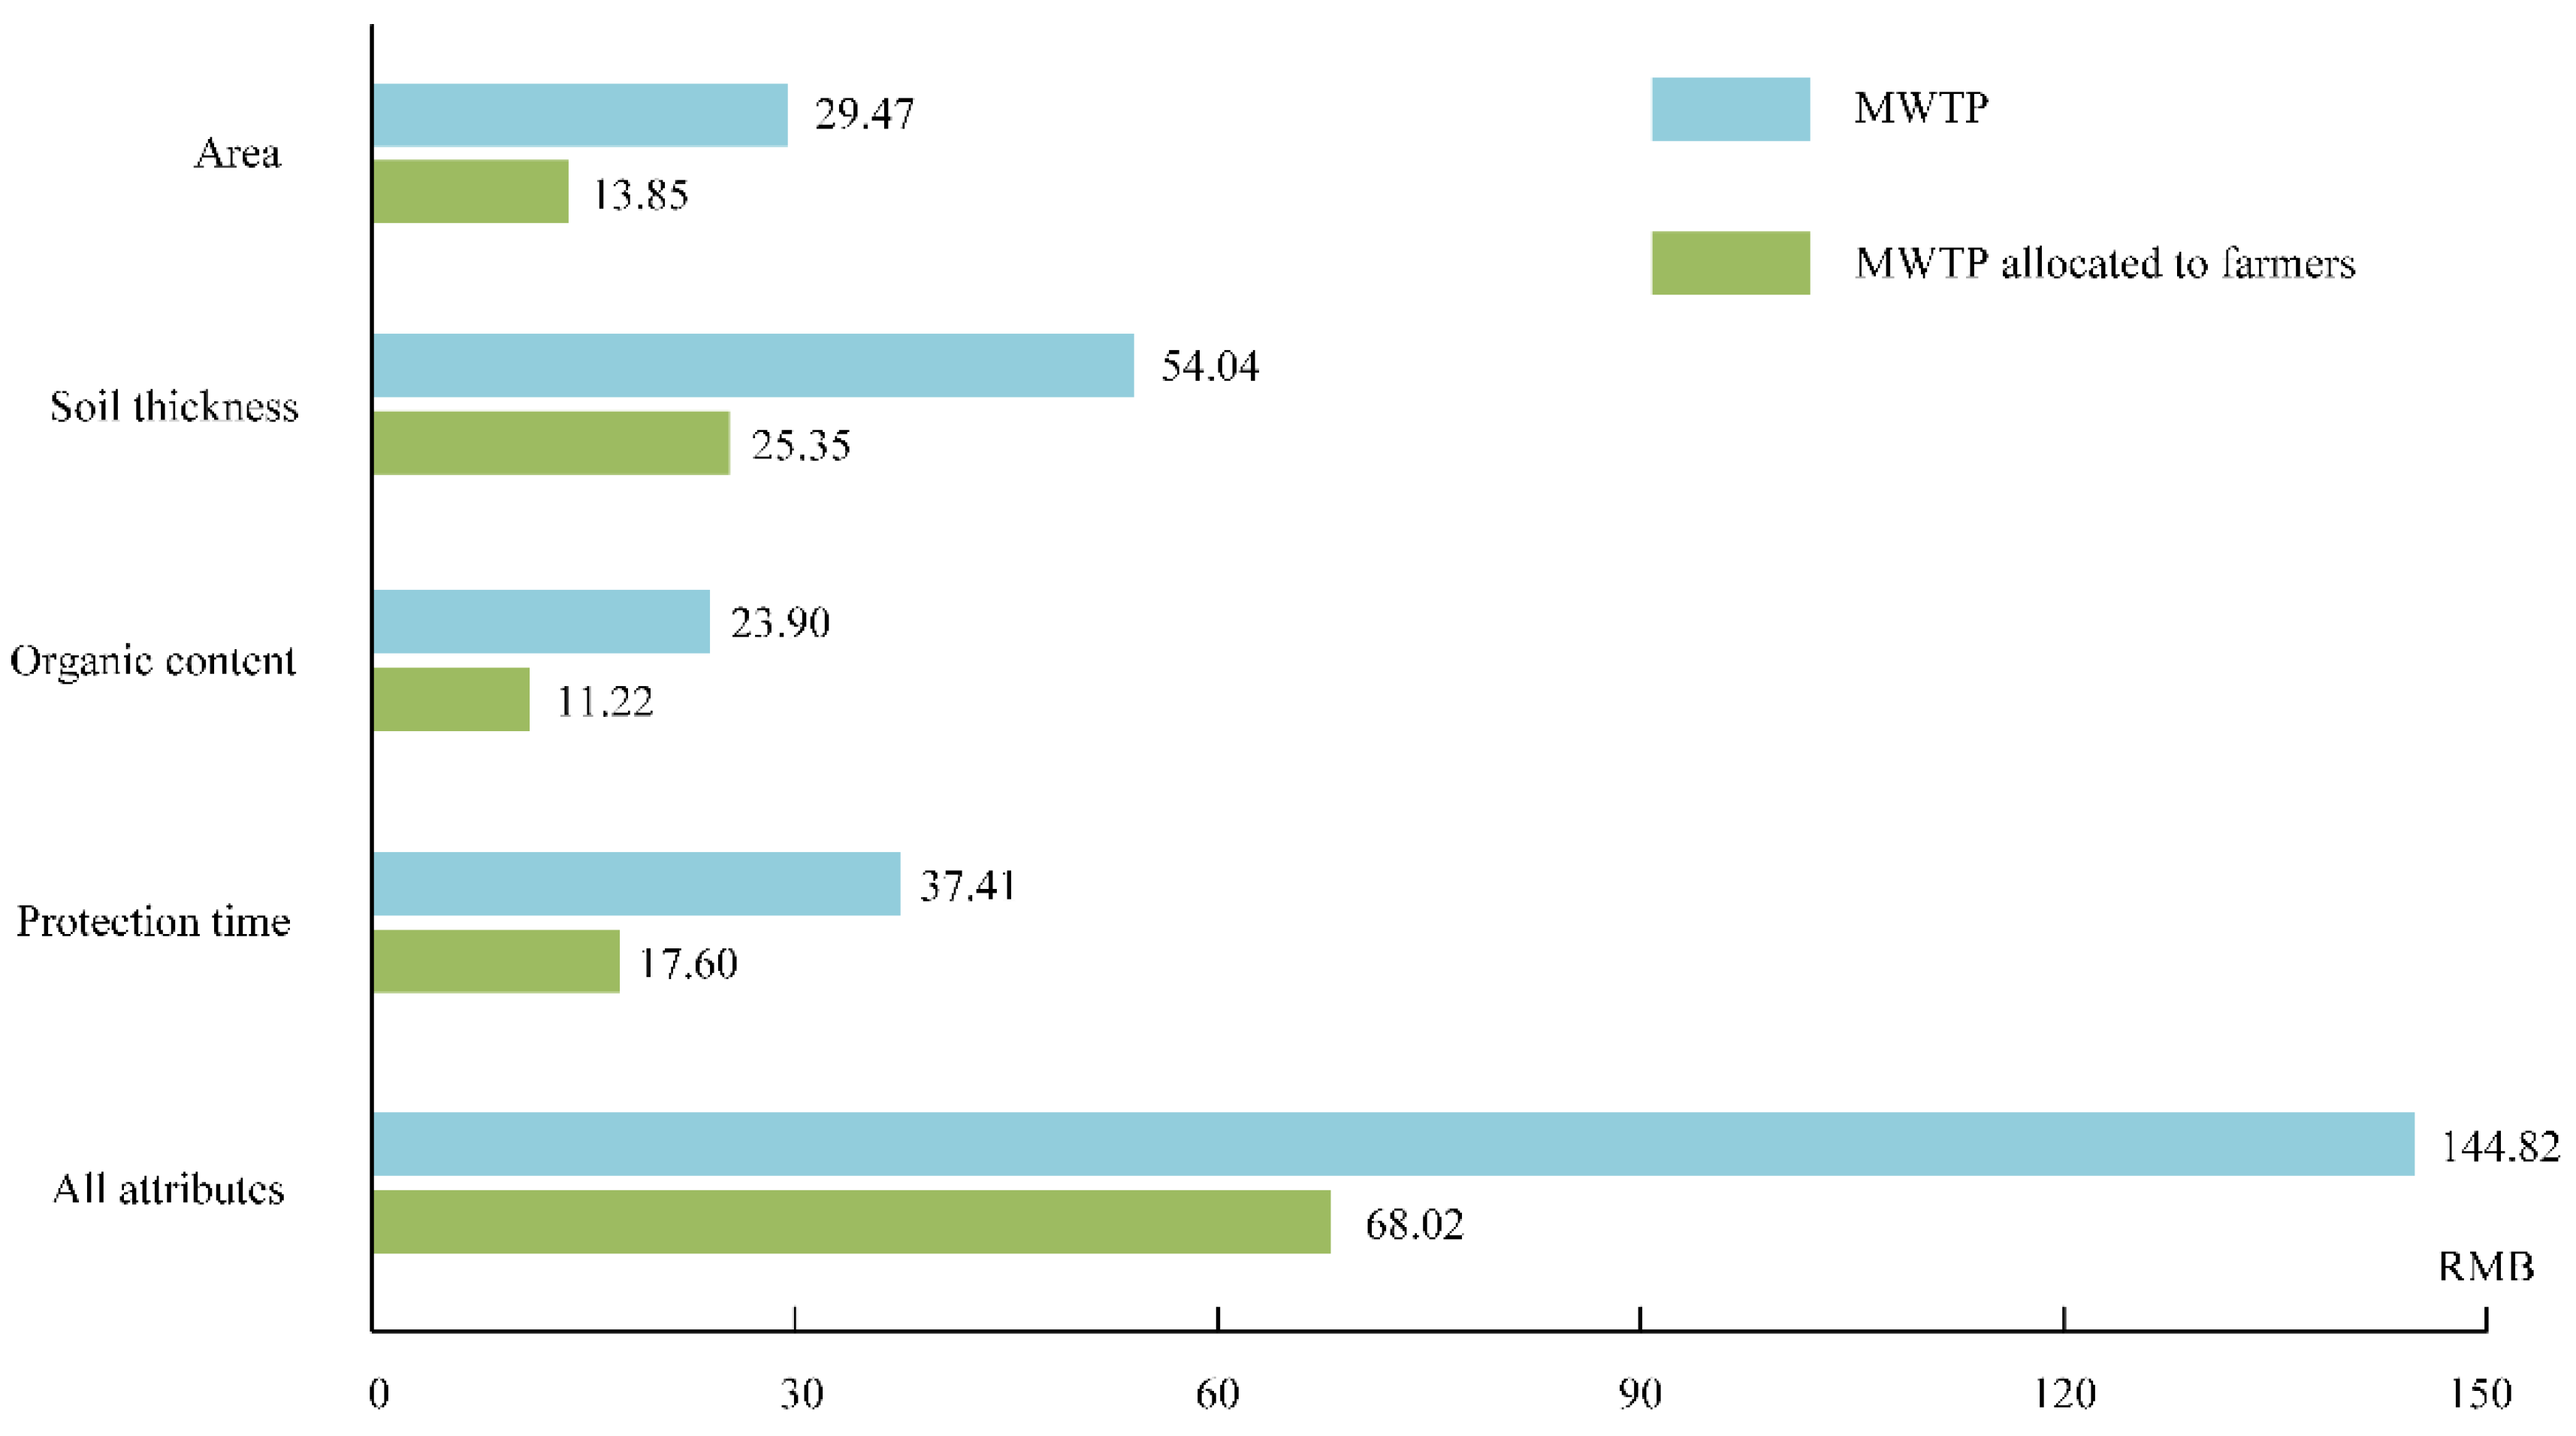
4.4. Willingness to Pay and Allocation

When RPL is used to derive WTP in this study, the estimation of WTP from the individual level is more accurate than the estimation of average WTP from all populations, taking into account taste heterogeneity at the individual level [56]. Since the estimates depend on the observed individual choice and attribute levels, we applied the conditional parameter estimation procedure and the Krinsky and Robb process to calculate WTP in the RPL model [41]. As shown in Figure 6, each household is willing to pay RMB 29.47 per year for a net increase of 1‰ in area. Similarly, a net increase of 1% in soil thickness and organic content implies a WTP of RMB 54.04 and RMB 23.90 per household per year. In addition, each household is also willing to pay RMB 37.41 per year to shorten the marginal protection time.
In conjunction with the respondents’ share of the payment allocated to farmers, the weighting method is applied to the four management attributes using Equation (9) to calculate the MWTP allocated to farmers. As shown in Figure 6, each household is willing to pay farmers RMB 13.85 per year for a net increase of 1‰ in area, RMB 25.35 and RMB 11.22 per year for a net increase of 1% in soil thickness and organic content, respectively, and RMB 17.60 to shorten the marginal protection time. Overall, each household is willing to pay RMB 144.82 per year for each of the four management attributes to be raised by one marginal unit, of which RMB 68.02 is allocated to farmers. It can be seen that the public supports farmland eco-compensation and is willing to allocate the corresponding share of WTP to encourage farmers to protect farmland.

4.5. Compensation Surplus Assessment

Eco-compensation mechanisms can visualize the welfare benefits that the economic and ecological functions of farmland bring to society, and Liu et al. proposed to protect farmland in terms of quantity, quality, and ecology [38]. This study presents two hypothetical compensation scenarios:
Scenario 1: All attributes will be improved to a medium level, i.e., it will take 13 years to achieve the protection goals of a net increase of 5‰ in area, 5% in soil thickness, and 10% in organic content.
Scenario 2: All attributes will be improved to optimal levels, i.e., it will take 10 years to achieve the protection goals of a net increase of 10‰ in area, 10% in soil thickness, and 20% in organic content.
Table 5 presents the estimated results of the compensation surplus and the amount allocated to farmers for the two scenarios. In scenario 1, the public pays RMB 147.35 for a net 5‰ increase in area, RMB 270.20 and RMB 239.00 for a net increase in soil thickness and organic content of 5% and 10%, respectively, and RMB 112.23 for a reduction in the three-year timeframe for completing protection. The compensation surplus for scenario 1 is RMB 768.78, representing the payment amount that respondents support from the status quo to the corresponding proposed scenario. Similarly, the compensation surplus for scenario 2 is RMB 1537.56. Of the eco-compensation amount paid by the public, RMB 69.25 is allocated to farmers for a net increase of 5‰ in area, RMB 126.75 and RMB 112.20 for a net increase of 5% and 10% in soil thickness and organic content, respectively, and RMB 52.80 for a shortened three-year timeframe for completing protection. As shown in Table 5, the amount allocated to farmers for the medium compensation scenario is RMB 361.05, and the best compensation scenario is RMB 722.10. The share of compensation amount allocated to farmers by the public is 46.96%, which shows a benchmark for compensation standards.
Further economic viability analysis can help optimize economic incentives. The compensation surplus and the amount allocated to farmers were estimated from the total number of family households in Heilongjiang Province (13,024,687 households in total [65]), where the total compensation surplus for scenario 1 is RMB 10,013.19 million, and the amount allocated to farmers is RMB 4702.56 million. Scenario 2 showed the highest compensation surplus and the amount allocated to farmers, which were RMB 20,026.24 million and RMB 9405.13 million, respectively.

5. Discussions

5.1. WTP and Allocation

WTP is a product that can reflect public preferences for farmland eco-compensation [66]. WTP allocation should endeavor to seek linkages between the public and farmers to ensure compensation policy regulation for sustainable management [67,68]. This study links the public’s willingness to pay for farmland eco-compensation to the financial subsidies received by farmers and determines the public’s WTP allocation to farmers and its influencing factors, which is one of our main research contributions.
The results show that most of the public (81.14%) is willing to allocate costs to farmers for protecting farmland, and the public’s share of WTP allocation to farmers in eco-compensation is nearly half (46.96%). Although previous studies have demonstrated a positive willingness to pay for improving farmland attributes such as area and soil fertility [20,32,44,46,52], this study differs from previous studies by identifying and quantifying the share allocated to farmers from the public’s WTP, which provides a quantitative reference for compensation standards and contributes to effectively utilizing compensation funds. Currently, many eco-compensation programs are subject to information bias, rough management, and corruption in the implementation of the programs due to the government’s top-down administrative system [15,17]. In such cases, compensation funds are not fairly and effectively allocated, which affects compensation policy regulation for sustainable management. The research results can provide a benchmark for the compensation amount allocated to farmers by the public, which can help to reduce power interference and corruption at all levels of government, increasing farmers’ motivation to protect farmland and public support for farmland eco-compensation.
Since the funds invested in black soil conservation are not yet public enough, we can only analyze them based on the available data. The Chinese government has already taken action to improve the area of black soils, spending a total of RMB 33,791.90 million (average annual RMB 225.28 million) in 15 years, controlling the area of soil erosion of 9473.37 km2 and 1969 erosion gullies [69]. By comparing the amount already invested in black soil conservation with the data evaluated in this study, it was found that the marginal payment of local residents for the area of black soils alone amounted to RMB 383.84 million, which is, on average, 70.40% per year more than the amount already invested in black soil conservation. It is clear that the public’s willingness to pay for the area of black soils is much higher than the current investment in conservation, which means that conservation policies can be supported enough to set higher conservation goals.
Economic valuation is person-centered [70], and WTP allocation varies across respondents, which is related to their different preferences for compensation methods. In addition to monetary compensation, eco-compensation methods also include technical (e.g., skills training), in-kind (e.g., land use rights), and policy (e.g., labor priority) aspects [35,36]. The results in Section 4.3 provide empirical evidence of the relationship between the public’s heterogeneous preferences and the choice of compensation methods. Specifically, those who are older, have larger families, and have lived longer in protected areas prefer monetary compensation to farmers, and are willing to allocate higher amounts to farmers. They are more concerned about food security and believe that the amount they pay will enhance the effectiveness of farmers in protecting farmland. The higher the number of children and the higher the income, the more respondents prefer technical, in-kind, or policy compensation for farmers. Since the long-term mechanism of eco-compensation is more beneficial to children, families with children hope to improve the eco-compensation effect sustainably. As with the findings of Yang et al. [7], this study also verified that people with higher incomes preferred the in-kind compensation method. The above findings provide a potential reference for matching differentiated payment groups with multiple compensation methods for eco-compensation.
Equally important, farmland eco-compensation programs are led by governments through non-market means, often internalizing externalities in the form of subsidies [71]. In the survey area, for example, the subsidy standard currently used is conditional on activities (e.g., agricultural practices), i.e., the farmer labor subsidy is set at a rate ranging from RMB 300–900 per hectare according to straw cover on black soils [72]. This compensation condition limits farmers’ incentives to improve farmland, as it tends to cause farmers to focus on increasing straw cover to obtain the subsidy, neglecting the resultant improvement of important attributes such as area, soil thickness, and organic content, which leads to excessive depletion of farmland’s natural capital stock. Engel confirmed that eco-compensation conditioned on results (organic content, etc.) is more attractive due to the observability of such compensation conditions [34]. The public’s allocation of WTP to farmers for improving each attribute of farmland eco-compensation in research results provides quantitative data for result-based conditional eco-compensation, such as the soil thickness or organic content reaching a certain indicator to give the corresponding financial subsidies.

5.2. Public Preferences

Governments cannot independently accomplish farmland eco-compensation, and the huge compensation costs are borne by the public [73], so public support is key to policy success [25]. Governments should listen fully to the public and focus on public preferences for farmland eco-compensation, as these preferences can be translated into the funds needed to support policies [74].
In terms of public preferences for farmland eco-compensation, there is a more positive preference for farmland eco-compensation programs among females, those with more children, and those who have lived longer in protected areas. The positive significant coefficients of respondents’ gender in the model estimation results indicate that females have a greater preference for farmland eco-compensation compared to males. This result, like the study by Xu et al. [75], suggests that females are more sensitive to adverse environmental impacts and are more willing to take action than males. The significant positive for the number of children indicates that people with more children are more supportive of eco-compensation because they are concerned about the long-term value of farmland for their children’s future. The coefficient of the time spent living in protected areas is significantly positive at the 1% level, indicating that those who have lived longer in protected areas prefer farmland eco-compensation. This finding coincides with the results of Marshall et al., showing a positive correlation between the length of time people spend living around a natural resource and the degree of dependence on that natural resource [76]. Further, the core idea of eco-compensation is that protection costs should be compensated by beneficiaries outside the protected area to avoid hindering local development [77]. Welfare improvements brought by farmland protection can benefit the inhabitants living in other areas, and people outside protected areas need to value farmland eco-compensation. These findings helped to determine the potential target populations for farmland eco-compensation as males, those with fewer children in the family, and those who spend less time living in protected areas.
In terms of public preferences for farmland eco-compensation attributes, they support farmland eco-compensation programs that improve area, soil thickness, and organic content as quickly as possible. Taking the survey area as an example, soil erosion in the black soil region of northeastern China mainly originates from 3–15 degree sloping farmland, which accounts for 46.39% of the total area of soil erosion in the black soil region [37], of which there are 291,700 erosion ditches [69]. Water and wind erosion are the main causes of the thinning of the black soil layer after reclamation. Plant residues in the soil are rapidly decomposed by microorganisms, and the conditions for organic matter accumulation are destroyed [48]. In this case, the results show that the public’s MWTP for improved attributes, from high to low, is RMB 54.04 for the soil thickness, RMB 37.41 for the protection time, RMB 29.47 for the area, and RMB 23.90 for the organic content. These findings help governments to determine the costs and priorities of farmland eco-compensation programs.

5.3. Methodological Implications and Policy Recommendations

In summary, eco-compensation programs supported by the public provide financial subsidies to farmers whose farming behavior affects ESs levels through economic mechanisms in order to meet public needs. Therefore, microsubjects play a crucial role in farmland eco-compensation programs. The contribution of this study is to explore an approach for linking the public’s willingness to pay for farmland eco-compensation to the financial subsidies received by farmers in order to determine the public’s WTP and the allocation to farmers. Unlike previous studies that only consider the public or farmers, this paper finds an interface between the public and farmers’ communication, considering both sides simultaneously, and collects information on the public’s payment allocation to farmers in farmland eco-compensation by extending the traditional CE questionnaire, and uses a combination of random parameter logit modeling with the weighting method to identify and quantify the share allocated to farmers from the public’s WTP. By linking the public’s WTP allocation to the financial subsidies received by farmers, the research results provide a benchmark for compensation standards. The approach adopted in this paper provides a new way of thinking about the allocation of WTP, which can be applied to other fields and wider research contexts, and provides methodological references for value assessment.
This paper provides reference value that can be applied to the formulation of farmland eco-compensation policies in similar regions, provides new perspectives for subsequent research on farmland eco-compensation, and provides empirical evidence for optimizing farmland eco-compensation policies. The details are as follows: (1) the public’s share of WTP allocation to farmers in eco-compensation is 46.96%, which can provide a benchmark for compensation standards. (2) The public’s MWTP for improved attributes, from high to low, is RMB 54.04 for the soil thickness, RMB 37.41 for the protection time, RMB 29.47 for the area, and RMB 23.90 for the organic content, which helps governments determine the costs and priorities of farmland eco-compensation programs. (3) Those who are older, have larger families, and have lived longer in protected areas prefer monetary compensation to farmers, and they are willing to allocate higher amounts to farmers. The higher the number of children and the higher the income, the more respondents prefer technical, in-kind, or policy compensation for farmers. (4) There is a more positive preference for farmland eco-compensation programs among females, those with more children, and those who have lived longer in protected areas, which helped to determine the potential target populations for farmland eco-compensation as males, those with fewer children in the family, and those who spend less time living in protected areas. (5) The public’s allocation of WTP to farmers for improving each attribute of farmland eco-compensation in research results provides quantitative data for result-based conditional eco-compensation, such as the soil thickness or organic content reaching a certain indicator to give the corresponding financial subsidies. The above empirical evidence provides policy recommendations for farmland eco-compensation policies that can be applied to a broader context, including other regions of China and developing countries with similar backgrounds.

6. Conclusions

Farmland eco-compensation ensures a sustainable provision of agroecosystem services, bringing multifunctional benefits to the public while allowing farmers to be compensated for protecting farmland. Although increasingly more scholars have conducted studies from the public or farmer perspective based on environmental quality standards and policy objectives, they have neglected the linkages between the two, which severely limits the potential of compensation mechanisms. This paper investigated the public’s willingness to pay for farmland eco-compensation and the allocation to farmers using a choice experiment method in an empirical study in the black soil region of northeastern China, providing new approaches and insights for seeking effective pathways for farmland eco-compensation.
The theoretical framework constructed in this study connects stakeholders to promote positive interactions among coupled ecosystems. Within this framework, this study collected information on the public’s payment allocation to farmers in farmland eco-compensation by extending the traditional choice experiment questionnaire, which in turn explored an approach for linking the public’s willingness to pay for farmland eco-compensation to the financial subsidies received by farmers. The results showed that the public has a positive willingness to pay for the farmland eco-compensation program that improves the area, soil thickness, and organic content as soon as possible. The allocation of the public’s willingness to pay for farmland eco-compensation varied considerably, with the share of the payment allocated to farmers being positively correlated with the respondent’s age, household size, and time spent living in protected areas, and showing a negative correlation with the number of children and income. The share of the public’s willingness to pay allocated to farmers averaged 46.96%. The results revealed a more positive preference for farmland eco-compensation programs among females, those with more children, and those who lived longer in protected areas. These findings provide quantitative information on compensation standards and new empirical evidence on differentiated target populations, compensation methods, and compensation conditions for farmland eco-compensation, which can contribute to effectively utilizing compensation funds and exploring sustainable pathways for farmland eco-compensation.
Farmland eco-compensation is a complex project involving many issues. Although the theoretical framework developed in this paper integrates the farmland ESs, eco-compensation, public, and farmers, a public-only questionnaire cannot completely address these issues. In future studies, we consider that comparing the WTP allocated to farmers in the results of this study with farmers’ willingness to accept may provide interesting insights into compensation standards. Further, it may be meaningful to integrate the empirical evidence from this study with the spatial objectives of eco-compensation, which is the focus of our next work.

Supplementary Materials

The following supporting information can be downloaded at: https://www.mdpi.com/article/10.3390/agriculture14071166/s1, Supplementary S1. Questionnaire structure and statements.

Author Contributions

Conceptualization, B.L.; methodology, B.L.; software, B.L.; validation, B.L.; formal analysis, B.L.; investigation, B.L., Y.L. and Y.W.; data curation, C.A.; writing—original draft, B.L.; writing—review and editing, B.L., L.X. and C.A.; visualization, B.L.; supervision, L.X. and C.A.; funding acquisition, C.A.; All authors have read and agreed to the published version of the manuscript.

Funding

This work was supported by the National Natural Science Foundation of China (No.71874026) and the Education Department of Heilongjiang Province (1451MSYYB013).

Institutional Review Board Statement

Not applicable.

Data Availability Statement

The datasets used and/or analyzed during the current study are available from the corresponding author upon reasonable request.

Conflicts of Interest

The authors declare that they do not have any commercial or associative interests that represent a conflict of interest in connection with the work submitted.

References

  1. Food and Agriculture Organization of the United Nations (FAO); Intergovernmental Technical Panel on Soils (ITPS). Status of the World’s Soil Resources-Technical Summary; Food and Agriculture Organization of the United Nations and Intergovernmental Technical Panel on Soils: Rome, Italy, 2015. [Google Scholar]
  2. Cheng, L.; Jiang, P.; Chen, W.; Li, M.; Wang, L.; Gong, Y.; Pian, Y.; Xia, N.; Duan, Y.; Huang, Q. Farmland protection policies and rapid urbanization in China: A case study for Changzhou City. Land Use Policy 2015, 48, 552–566. [Google Scholar]
  3. Jin, J.; He, R.; Wang, W.; Gong, H. Valuing cultivated land protection: A contingent valuation and choice experiment study in China. Land Use Policy 2018, 74, 214–219. [Google Scholar] [CrossRef]
  4. National Bureau of Statistics of China (NBS). China Statistical Yearbook; China Statistics Press: Beijing, China, 2022. [Google Scholar]
  5. Zhang, W.; Wang, W.; Li, X.; Ye, F. Economic development and farmland protection: An assessment of rewarded land conversion quotas trading in Zhejiang, China. Land Use Policy 2014, 38, 467–476. [Google Scholar] [CrossRef]
  6. Assessment, M.E. Ecosystems and Human Well-Being: Biodiversity Synthesis; World Resources Institute: Washington, DC, USA, 2005. [Google Scholar]
  7. Yang, X.; Zhou, X.; Cao, S.; Zhang, A. Preferences in Farmland Eco-Compensation Methods: A Case Study of Wuhan, China. Land 2021, 10, 1159. [Google Scholar] [CrossRef]
  8. Wunder, S. Revisiting the concept of payments for environmental services. Ecol. Econ. 2015, 117, 234–243. [Google Scholar] [CrossRef]
  9. Wang, L.; Zheng, W.; Tang, L.; Zhang, S.; Liu, Y.; Ke, X. Spatial optimization of urban land and cropland based on land production capacity to balance cropland protection and ecological conservation. J. Environ. Manag. 2021, 285, 112054. [Google Scholar] [CrossRef] [PubMed]
  10. Sheng, J.; Wang, H. Community-based incentive coordination in payments for ecosystem services: China’s Wolong Nature Reserve. J. Environ. Plann. Man 2023, 1–25. [Google Scholar] [CrossRef]
  11. Liu, M.; Wu, W.; Li, H. The Influence of Grassland Ecological Compensation Policy on Grassland Quality: Evidence from the Perspective of Grassland Ecosystem Vulnerability. Agriculture 2023, 13, 1841. [Google Scholar] [CrossRef]
  12. Lu, Y.; Kong, F.; Huang, L.; Xiong, K.; Xu, C.; Wang, B. Evaluation of the Implementation Effect of the Ecological Compensation Policy in the Poyang Lake River Basin Based on Difference-in-Difference Method. Sustainability 2021, 13, 8667. [Google Scholar] [CrossRef]
  13. Yue, D.; Sarkar, A.; Cui, Y.; Qian, L.; Minjuan, Z.; Das, J.C. Ecological compensation of grain trade within urban, rural areas and provinces in China: A prospect of a carbon transfer mechanism. Environ. Dev. Sustain. 2021, 23, 16688–16712. [Google Scholar] [CrossRef]
  14. Song, M.; Jin, G.; Yan, W. Which pro-environmental farming behaviors should be priorities for funding? An approach based on matching ecosystem services (ESs) demand and supply. J. Environ. Manag. 2021, 297, 113368. [Google Scholar] [CrossRef] [PubMed]
  15. Shang, W.; Gong, Y.; Wang, Z.; Stewardson, M.J. Eco-compensation in China: Theory, practices and suggestions for the future. J. Environ. Manag. 2018, 210, 162–170. [Google Scholar] [CrossRef] [PubMed]
  16. Wang, P.; Wolf, S.A. A targeted approach to payments for ecosystem services. Glob. Ecol. Conserv. 2019, 17, e00577. [Google Scholar] [CrossRef]
  17. Song, B.; Zhang, Y.; Zhang, L.; Zhang, F. A top-down framework for cross-regional payments for ecosystem services. J. Clean. Prod. 2018, 182, 238–245. [Google Scholar] [CrossRef]
  18. Wunder, S. The Efficiency of Payments for Environmental Services in Tropical Conservation. Conserv. Biol. 2006, 21, 48–58. [Google Scholar] [CrossRef] [PubMed]
  19. Jin, J.; Jiang, C.; Truong, D.T.; Li, L. Public preferences for cultivated land protection in Wenling City, China: A choice experiment study. Land Use Policy 2013, 30, 337–343. [Google Scholar]
  20. Zandersen, M.; Jørgensen, S.L.; Nainggolan, D.; Gyldenkærne, S.; Winding, A.; Greve, M.H.; Termansen, M. Potential and economic efficiency of using reduced tillage to mitigate climate effects in Danish agriculture. Ecol. Econ. 2016, 123, 14–22. [Google Scholar] [CrossRef]
  21. Johnston, R.J.; Bergstrom, J.C. Valuing Farmland Protection: Do Empirical Results and Policy Guidance Depend on the Econometric Fine Print? Appl. Econo. Perspect. Policy 2011, 33, 639–660. [Google Scholar] [CrossRef]
  22. Yu, Z.; Tan, Y.; Wu, C.; Mao, M.; Zhang, X. Alternatives or status quo? Improving fallow compensation policy in heavy metal polluted regions in Chaling County, China. J. Clean. Prod. 2019, 210, 287–297. [Google Scholar] [CrossRef]
  23. Travisi, C.M.; Nijkamp, P. Valuing environmental and health risk in agriculture: A choice experiment approach to pesticides in Italy. Ecol. Econ. 2008, 67, 598–607. [Google Scholar] [CrossRef]
  24. Chen, Z.; Zhang, A.; Zhou, K.; Huang, L. Can payment tools substitute for regulatory ones? Estimating the policy preference for agricultural land preservation, Tianjin, China. Land Use Policy 2021, 100, 104860. [Google Scholar] [CrossRef]
  25. Fischer, A.; Young, J.C. Understanding mental constructs of biodiversity: Implications for biodiversity management and conservation. Biol. Conserv. 2007, 136, 271–282. [Google Scholar] [CrossRef]
  26. McShane, T.O.; Hirsch, P.D.; Trung, T.C.; Songorwa, A.N.; Kinzig, A.; Monteferri, B.; Mutekanga, D.; Thang, H.V.; Dammert, J.L.; Pulgar-Vidal, M.; et al. Hard choices: Making trade-offs between biodiversity conservation and human well-being. Biol. Conserv. 2011, 144, 966–972. [Google Scholar] [CrossRef]
  27. Tienhaara, A.; Haltia, E.; Pouta, E.; Arovuori, K.; Grammatikopoulou, I.; Miettinen, A.; Koikkalainen, K.; Ahtiainen, H.; Artell, J. Demand and supply of agricultural ES: Towards benefit-based policy. Eur. Rev. Agric. Econ. 2020, 47, 1223–1249. [Google Scholar] [CrossRef]
  28. Yu, H.; Xie, W.; Yang, L.; Du, A.; Almeida, C.M.V.B.; Wang, Y. From payments for ecosystem services to eco-compensation: Conceptual change or paradigm shift? Sci. Total Environ. 2020, 700, 134627. [Google Scholar] [CrossRef] [PubMed]
  29. Quan, T.; Zhang, H.; Li, J.; Lu, B. Horizontal ecological compensation mechanism and green low-carbon development in river basins: Evidence from Xin’an River basin. Environ. Sci. Pollut. Res. 2023, 30, 88463–88480. [Google Scholar] [CrossRef]
  30. Amaris, G.; Dawson, R.; Gironás, J.; Hess, S.; de Dios Ortúzar, J. Understanding the preferences for different types of urban greywater uses and the impact of qualitative attributes. Water Res. 2020, 184, 116007. [Google Scholar] [CrossRef] [PubMed]
  31. Cao, Y.; Cao, Y.; Li, G.; Tian, Y.; Xiaoqian, F.; Li, Y.; Tan, Y. Linking ecosystem services trade-offs, bundles and hotspot identification with cropland management in the coastal Hangzhou Bay area of China. Land Use Policy 2020, 97, 104689. [Google Scholar] [CrossRef]
  32. Yang, X.; Zhang, A.; Zhang, F. Farmers’ Heterogeneous Willingness to Pay for Farmland Non-Market Goods and Services on the Basis of a Mixed Logit Model—A Case Study of Wuhan, China. Int. J. Environ. Res. Public Health 2019, 16, 3876. [Google Scholar] [CrossRef]
  33. Liu, M.; Liu, W.; Yang, L.; Jiao, W.; He, S.; Min, Q. A dynamic eco-compensation standard for Hani Rice Terraces System in southwest China. Ecosyst Serv. 2019, 36, 100897. [Google Scholar] [CrossRef]
  34. Engel, S. The Devil in the Detail: A Practical Guide on Designing Payments for Environmental Services. Int. Rev. Environ. Reso. 2016, 9, 131–177. [Google Scholar] [CrossRef]
  35. Yan, J.; Li, H.; Hua, X.; Peng, K.; Zhang, Y. Determinants of Engagement in Off-Farm Employment in the Sanjiangyuan Region of the Tibetan Plateau. Mt. Res. Dev. 2017, 37, 464–473. [Google Scholar] [CrossRef]
  36. Bennett, M.T.; Gong, Y.; Scarpa, R. Hungry Birds and Angry Farmers: Using Choice Experiments to Assess “Eco-compensation” for Coastal Wetlands Protection in China. Ecol. Econ. 2018, 154, 71–87. [Google Scholar] [CrossRef]
  37. Chinese Academy of Sciences (CAS). Northeast Black Soils White Paper (2020); Chinese Academy of Sciences (CAS): Beijing, China, 2021. [Google Scholar]
  38. Liu, H.; Li, S.; Wu, M.; Sun, F.; Wang, Q.; Dong, X. Current Situation and Perspectives of Black Soil Protection from the Integrated Angle of Quantity, Quality, and Ecology in Northeast China. Chin. J. Soil Sci. 2021, 52, 544–552. [Google Scholar]
  39. Johnston, R.J.; Boyle, K.J.; Adamowicz, W.V.; Bennett, J.; Brouwer, R.; Cameron, T.A.; Hanemann, W.M.; Hanley, N.; Ryan, M.; Scarpa, R.; et al. Contemporary Guidance for Stated Preference Studies. J. Assoc. Environ. Resour. Econ. 2017, 4, 319–405. [Google Scholar] [CrossRef]
  40. Train, K.E. Discrete Choice Methods with Simulation; Cambridge University Press: New York, NY, USA, 2012. [Google Scholar]
  41. Arata, L.; Diluiso, F.; Guastella, G.; Pareglio, S.; Sckokai, P. Willingness to pay for alternative features of land-use policies: The case of the lake Garda region. Land Use Policy 2021, 100, 104942. [Google Scholar] [CrossRef]
  42. Ministry of Agriculture and Rural Affairs of the People’s Republic of China (MARA). Outline of Northeast Black Soils Protection Plan (2017–2030); Ministry of Agriculture and Rural Affairs of the People’s Republic of China (MARA): Beijing, China, 2017.
  43. Ministry of Agriculture and Rural Affairs of the People’s Republic of China (MARA). Implementation Plan of the National Black Soils Protection Project (2021–2025); Ministry of Agriculture and Rural Affairs of the People’s Republic of China (MARA): Beijing, China, 2021.
  44. Johnston, R.J.; Duke, J.M. Willingness to Pay for Agricultural Land Preservation and Policy Process Attributes: Does the Method Matter? Am. J. Agric. Econ. 2007, 89, 1098–1115. [Google Scholar] [CrossRef]
  45. Schultz, E.T.; Johnston, R.J.; Segerson, K.; Besedin, E.Y. Integrating Ecology and Economics for Restoration: Using Ecological Indicators in Valuation of Ecosystem Services. Restor. Ecol. 2012, 20, 304–310. [Google Scholar] [CrossRef]
  46. Yuan, Y.; Boyle, K.J.; You, W. Sample Selection, Individual Heterogeneity, and Regional Heterogeneity in Valuing Farmland Conservation Easements. Land Econ. 2015, 91, 627–649. [Google Scholar] [CrossRef]
  47. Fedotova, A.A. The Origins of the Russian Chernozem Soil (Black Earth): Franz Joseph Ruprecht’s ’Geo-Botanical Researches into the Chernozem’ of 1866. Environ. Hist. 2010, 16, 271–293. [Google Scholar] [CrossRef]
  48. Han, X.; Zou, W. Research Perspectives and Footprint of Utilization and Protection of Black Soil in Northeast China. Acta Pedol. Sin. 2021, 58, 1341–1358. [Google Scholar]
  49. Zhang, X.; Jiao, J. Formation and Evolution of Black Soil. J. Jilin. Univ. 2020, 50, 553–568. [Google Scholar]
  50. Meyer, A. Intertemporal Valuation of River Restoration. Environ. Resour. Econ. 2012, 54, 41–61. [Google Scholar] [CrossRef]
  51. Zhang, J.; He, C.; Chen, L.; Cao, S. Improving food security in China by taking advantage of marginal and degraded lands. J. Clean. Prod. 2018, 171, 1020–1030. [Google Scholar] [CrossRef]
  52. Yang, X.; Burton, M.; Cai, Y.; Zhang, A. Exploring Heterogeneous Preference for Farmland Non-market Values in Wuhan, Central China. Sustainability 2016, 8, 12. [Google Scholar] [CrossRef]
  53. Johnson, F.R.; Lancsar, E.; Marshall, D.; Kilambi, V.; Mühlbacher, A.; Regier, D.A.; Bresnahan, B.W.; Kanninen, B.; Bridges, J.F.P. Constructing Experimental Designs for Discrete-Choice Experiments: Report of the ISPOR Conjoint Analysis Experimental Design Good Research Practices Task Force. Value Health 2013, 16, 3–13. [Google Scholar] [CrossRef] [PubMed]
  54. Brantegem, K.V.; Strouwen, A.; Goos, P. D- and I-optimal design of multi-factor industrial experiments with ordinal outcomes. Chemom. Intell. Lab. Syst. 2021, 221, 104463. [Google Scholar] [CrossRef]
  55. China Internet Network Information Center (CNNIC). The 50th Statistical Report on Internet Development in China; China Internet Network Information Center (CNNIC): Beijing, China, 2022.
  56. Hensher, D.A.; Rose, J.M.; Greene, W.H. Applied Choice Analysis, 2nd ed.; Cambridge University Press: Cambridge, UK, 2015. [Google Scholar]
  57. Alcon, F.; Marín-Miñano, C.; Zabala, J.A.; de-Miguel, M.-D.; Martínez-Paz, J.M. Valuing diversification benefits through intercropping in Mediterranean agroecosystems: A choice experiment approach. Ecol. Econ. 2020, 171, 106593. [Google Scholar] [CrossRef]
  58. McFadden, D. Conditional logit analysis of qualitative choice behavior. In Frontiers in Econometrics; Zarembka, P., Ed.; Academic Press: New York, NY, USA, 1974; pp. 105–142. [Google Scholar]
  59. Lancaster, K.J. A New Approach to Consumer Theory. J. Polit. Econ. 1966, 74, 132–157. [Google Scholar] [CrossRef]
  60. Hoyos, D. The state of the art of environmental valuation with discrete choice experiments. Ecol. Econ. 2010, 69, 1595–1603. [Google Scholar] [CrossRef]
  61. Hensher, D.A.; Greene, W.H. The Mixed Logit model: The state of practice. Transportation 2003, 30, 133–176. [Google Scholar] [CrossRef]
  62. Louviere, J.J.; Hensher, D.A.; Swait, J.D. Stated Choice Methods: Analysis and Applications; Cambridge University Press: Cambridge, UK, 2010. [Google Scholar]
  63. Janssen, M.; Hamm, U. Product labelling in the market for organic food: Consumer preferences and willingness-to-pay for different organic certification logos. Food Qual. Prefer. 2012, 25, 9–22. [Google Scholar] [CrossRef]
  64. Hausman, J.; McFadden, D. Specification tests for the multinomial Logit model. Econometrica 1984, 52, 1219–1240. [Google Scholar] [CrossRef]
  65. Heilongjiang Provincial Bureau of Statistics (HPBS). Major Data Bulletin of the 7th National Population Census of Heilongjiang Province in 2020; Heilongjiang Provincial Bureau of Statistics (HPBS): Harbin, China, 2021.
  66. Hoyos, D.; Mariel, P.; Hess, S. Incorporating environmental attitudes in discrete choice models: An exploration of the utility of the awareness of consequences scale. Sci. Total Environ. 2015, 505, 1100–1111. [Google Scholar] [CrossRef]
  67. Chen, J.; Jiang, B.; Bai, Y.; Xu, X.; Alatalo, J.M. Quantifying ecosystem services supply and demand shortfalls and mismatches for management optimisation. Sci. Total Environ. 2019, 650, 1426–1439. [Google Scholar] [CrossRef] [PubMed]
  68. Deng, X.; Gibson, J. Improving eco-efficiency for the sustainable agricultural production: A case study in Shandong, China. Technol. Forecast. Soc. 2019, 144, 394–400. [Google Scholar] [CrossRef]
  69. Wen, L.; Wang, J.; Ren, M.; Fan, J.; Bai, J.; Shang, J. Effectiveness of comprehensive soil erosion control in black soil region of Northeast China. Soil. Water. Conser. 2021, 6, 4–7. [Google Scholar]
  70. Mendelsohn, R.; Olmstead, S. The Economic Valuation of Environmental Amenities and Disamenities: Methods and Applications. Annu. Rev. Env. Resour. 2009, 34, 325–347. [Google Scholar] [CrossRef]
  71. Gómez-Baggethun, E.; Muradian, R. In markets we trust? Setting the boundaries of Market-Based Instruments in ecosystem services governance. Ecol. Econ. 2015, 117, 217–224. [Google Scholar] [CrossRef]
  72. Department of Agriculture and Rural Affairs of Heilongjiang Province (DARAHP); Department of Finance of Heilongjiang Province (DFHP). Implementation Plan for Conservation Tillage of Black Soils in Heilongjiang Province in 2022; Department of Agriculture and Rural Affairs of Heilongjiang Province (DARAHP): Harbin, China, 2022.
  73. Ren, Y.; Lu, L.; Zhang, H.; Chen, H.; Zhu, D. Residents’ willingness to pay for ecosystem services and its influencing factors: A study of the Xin’an River basin. J. Clean. Prod. 2020, 268, 122301. [Google Scholar] [CrossRef]
  74. Bernués, A.; Tello-García, E.; Rodríguez-Ortega, T.; Ripoll-Bosch, R.; Casasús, I. Agricultural practices, ecosystem services and sustainability in High Nature Value farmland: Unraveling the perceptions of farmers and nonfarmers. Land Use Policy 2016, 59, 130–142. [Google Scholar] [CrossRef]
  75. Xu, L.; Ao, C.; Mao, B.; Cheng, Y.; Sun, B.; Wang, J.; Liu, B.; Ma, J. Which is more Important, Ecological Conservation or Recreational Service? Evidence from a Choice Experiment in Wetland Nature Reserve Management. Wetlands 2020, 40, 2381–2396. [Google Scholar] [CrossRef]
  76. Marshall, N.A.; Curnock, M.I.; Goldberg, J.; Gooch, M.; Marshall, P.A.; Pert, P.L.; Tobin, R.C. The Dependency of People on the Great Barrier Reef, Australia. Coast. Manag. 2017, 45, 505–518. [Google Scholar] [CrossRef]
  77. Yang, H.; Yang, W.; Zhang, J.; Connor, T.; Liu, J. Revealing pathways from payments for ecosystem services to socioeconomic outcomes. Sci. Adv. 2018, 4, eaao6652. [Google Scholar] [CrossRef] [PubMed]
Figure 1. Theoretical framework.
Agriculture 14 01166 g001
Figure 2. Distribution map of different land use types of black soils in Northeast China in 2020. Source: Northeast Black Soils White Paper (2020) [37].
Agriculture 14 01166 g002
Figure 3. Application step diagram.
Agriculture 14 01166 g003
Figure 4. Descriptive statistics of respondents.
Agriculture 14 01166 g004
Figure 5. Public payment allocation to farmers.
Agriculture 14 01166 g005
Figure 6. Estimates for MWTP.
Agriculture 14 01166 g006
Table 1. Attributes and levels used in a choice experiment.
AttributesDescriptionsLevels
Area The area of black soils refers to the farmland area normally used for cultivating crops in the black soil region.0 #
Net increase 5%
Net increase 10%
Soil thickness The thickness of the black soils layer is one of the important indicators to evaluate soil fertility.0 #
Net increase 5%
Net increase 10%
Organic contentThe organic matter content refers to the amount of various plant and animal residues in a unit volume of black soils, together with microorganisms and the organic matter synthesized by their decomposition.0 #
Net increase 10%
Net increase 20%
Protection timeThe number of years required to achieve the goal of black soils eco-compensation.16 years #
13 years
10 years
PaymentAnnual tax willingness to pay for farmland eco-compensation programs.RMB 0 #
RMB 200
RMB 400
RMB 600
RMB 800
RMB 1000
Note: # represents the status quo level of each attribute.
Table 2. An example of a choice set.
AttributesCompensation Alternative 1Compensation Alternative 2Alternative 3
AreaNet increase 5‰Net increase 5‰Without any
protection
Soil thicknessNet increase 10%0
Organic content0Net increase 10%
Protection time13 years16 years
Payment (year/household)RMB 400RMB 800RMB 0
Which of the alternatives do you prefer?
In your payment, what share would you allocate to farmers to increase their motivation to protect black soils?0%□    10%□   20%□    30%□     40%□      50%□    
60%□   70%□   80%□    90%□     100%□
Table 3. Parameter estimation of MNL and RPL model.
Variable(a) MNL Model(b) RPL Model
CoefficientStandard
Error
ZCoefficientStandard
Error
Z
Random parameters in utility functions
Area0.0306 *** 0.00823.72 0.0325 *** 0.0087 3.76
Soil thickness0.0441 *** 0.01044.24 0.0495 *** 0.0113 4.38
Organic content0.0222 *** 0.00474.70 0.0236 *** 0.0049 4.79
Protection time−0.0332 **0.0155 −2.14 −0.0364 ** 0.0160−2.28
Non-random parameters in utility functions
Payment−0.0010 *** 0.0001 −6.96 −0.0010 *** 0.0002−7.09
ASC−5.4421 *** 0.9642 −5.64 −5.4479 *** 0.9754−5.59
ASC_gender1.2593 *** 0.31973.94 1.2581 *** 0.3214 3.91
ASC_age0.0872 0.0943 0.92 0.0844 0.0951 0.89
ASC_household−0.1131 0.1906−0.59 −0.1105 0.1922 −0.57
ASC_income0.0133 0.1078 0.12 0.0152 0.1087 0.14
ASC_children0.3656 *0.19691.86 0.3615 *0.1980 1.83
ASC_year0.4400 *** 0.10644.13 0.4447 *** 0.1075 4.14
Standard deviation of parameter distributions
Ts_area 0.0325 *** 0.0087 3.76
Ts_soil thickness 0.0495 *** 0.0113 4.38
Ts_organic content 0.0236 *** 0.0049 4.79
Ts_protection time 0.0364 ** 0.0160 2.28
Modeling statistics
Log likelihood−1231.10−1229.21
AIC2508.22504.4
Rho-square0.07120.2896
Note: ***, **, * show significance at 1%, 5%, and 10% levels.
Table 4. Regression between payment share allocated to farmers and socioeconomic characteristics.
GenderAgeHouseholdChildrenYearIncome
Payment share allocated to farmersPearson correlation−0.0060.048 **0.111 **−0.038 **0.051 **−0.066 **
Significance0.6740.0010.0000.0080.0010.000
Note: ** show significance at 1%.
Table 5. Compensation surplus and amount allocated to farmers.
ScenarioAttributesCompensation AmountCompensation Surplus (RMB/Household/Year)Compensation Amount Allocated to FarmersCompensation Surplus Allocated to Farmers (RMB/Household/Year)
Scenario 1Area147.35768.7869.25361.05
Soil thickness270.20126.75
Organic content239.00112.20
Protection time112.2352.80
Scenario 2Area294.701537.56138.50722.10
Soil thickness540.40253.50
Organic content478.00224.40
Protection time224.46105.60
Disclaimer/Publisher’s Note: The statements, opinions and data contained in all publications are solely those of the individual author(s) and contributor(s) and not of MDPI and/or the editor(s). MDPI and/or the editor(s) disclaim responsibility for any injury to people or property resulting from any ideas, methods, instructions or products referred to in the content.

