Article

Green Development of Chinese Agriculture from the Perspective of Bidirectional Correlation

1
School of Economics and Management, Northwest A&F University, Xianyang 712100, China
2
School of Language and Culture, Northwest A&F University, Xianyang 712100, China
*
Author to whom correspondence should be addressed.
Agriculture 2024, 14(9), 1628; https://doi.org/10.3390/agriculture14091628
Submission received: 7 August 2024 / Revised: 8 September 2024 / Accepted: 15 September 2024 / Published: 17 September 2024
(This article belongs to the Section Agricultural Economics, Policies and Rural Management)

Abstract

:
China’s agricultural green development exhibits spatial imbalances. To promote the coordinated green development of agriculture across various regions, this paper explores the evolution of spatial association networks and driving factors of agricultural green development from a bidirectional correlation perspective, using social network analysis and spatial econometric methods. This research indicates that China’s agricultural green efficiency has steadily improved, with a complex multi-threaded network structure. Although the spatial interaction and spillover effects of the overall network structure have increased, they remain relatively weak. The individual network structure shows significant regional imbalances. The spatial association network of agricultural green efficiency forms four major blocks, with sparse connections within the blocks but close connections between blocks, demonstrating strong spillover effects. Regarding the driving factors, the proportion of the primary industry, labor level, and R&D investment have significant spatial impacts, while the spatial impacts of human capital level, degree of openness, economic development level, and new quality productivity level are not significant. Therefore, we believe that it is necessary to establish the concept of coordinated green development in agriculture, fully leverage regional associations and spillover effects, and formulate differentiated policies to improve agricultural green efficiency.

1. Introduction

Since the advent of industrial civilization, while the capitalist mode of production has promoted prosperity in urban commerce and industry, it has also laid hidden dangers for the sustainable development of agriculture [1]. In terms of productivity, the material cycle between humans and nature has been disrupted. The excessive use of chemical fertilizers and pesticides, along with the ineffective recycling of livestock manure from large-scale farming, has led to significant agricultural non-point source pollution, such as air and water pollution, and a loss of biodiversity. Many developing countries, lacking the necessary funds and technology, have suffered severely from global climate change. Since the 1980s, the issue of sustainable development has gained widespread attention from human society. In the 1987 report by the World Commission on Environment and Development, “Our Common Future”, sustainable development was defined as “development that meets the needs of the present without compromising the ability of future generations to meet their own needs”. In 2015, the United Nations proposed 17 Sustainable Development Goals (SDGs) [2]. Based on the international community’s discussions on sustainable development, the scope of sustainable agricultural goals includes three dimensions: production growth, prosperous livelihoods, and ecological well-being. Advancing green agricultural development is a reflection of implementing the concept of sustainable development in the agricultural sector. Green development represents the inheritance and promotion of a Marxist ecological development view in the context of a new era and is the direction and pathway for China to achieve ecological civilization.
Green agricultural development is an essential requirement for advancing supply-side agricultural reforms and achieving high-quality agricultural development [3]. With only 9% of the world’s arable land and 6% of its freshwater resources, China has managed to feed nearly one-fifth of the global population, achieving remarkable accomplishments [4]. China’s overall agricultural production capacity has significantly improved, and the supply structure of agricultural products has been continuously optimized. Grain production increased from 113.18 million tons in 1949 to 686.53 million tons in 2022, and per capita grain availability rose from 208.95 kg in 1949 to 486.30 kg in 2022. Meat production grew rapidly from 12.05 million tons in 1980 to 92.27 million tons in 2022, poultry egg production increased from 2.81 million tons in 1982 to 34.56 million tons in 2022, and milk production expanded from 1.14 million tons in 1980 to 39.32 million tons in 2022 [5]. Today, China has achieved absolute security in its staple grain supply and basic self-sufficiency in cereals, with ample supplies of major agricultural products such as meat, eggs, milk, fruits, vegetables, tea, and aquatic products. This marks a shift from a state of supply shortage and limited variety to sufficient supply and diversified offerings. It is important to note that despite a decrease in the agricultural labor force, limited natural resource supply, and increasing consumer demand for agricultural products, China’s agriculture can still ensure abundant production and supply, which is largely due to the substantial input of agricultural resources.
The 2024 No. 1 Central Document of China highlights the country’s commitment to further accelerating green agricultural development and improving the agricultural ecological environment [6]. However, it is important to note that the relationships between green agricultural development across different regions in China are becoming increasingly complex. Particularly at the provincial administrative level, the boundary effects of green agricultural development are prominent, revealing certain drawbacks of unilateral management measures. The realization of joint prevention and control efforts is hindered by numerous obstacles and barriers, leading to the prevalence of “NIMBYism” (Not In My Backyard) [7,8], which restricts green agricultural spatial spillover effects. Therefore, it is necessary to explore new paths for cross-regional collaboration, shared development, and the harmonious integration of green agriculture with economic and social development.
This paper explores the development of green agriculture in China from a spatial perspective, focusing on the following issues: What is the spatial association network structure and evolution trend in China’s agricultural green efficiency? What are the positions and roles of each province within the network? Are there spatial spillover blocks within the network? What are the driving factors affecting green agricultural development? Addressing these issues will help provinces and cities enhance their overall awareness, place their development within the broader context of integrated green agricultural development in China, and thereby identify their positions accurately to overcome the constraints of resources, the environment, and the economy in agricultural development.

2. Literature Review

In the early 20th century, the production-oriented agricultural practices of developed countries led to the overuse of pesticides and fertilizers. It was not until the publication of Carson’s Silent Spring in 1962 that concepts such as ecological agriculture, sustainable agriculture, green agriculture, and organic agriculture were introduced [9,10]. Green agricultural development represents a profound transformation in agricultural production methods. Traditional agriculture focused on maximizing output by investing in labor, machinery, fertilizers, pesticides, and other resources to enhance production efficiency. However, this production model, reliant on chemical inputs, caused significant environmental damage, exacerbating issues like agricultural non-point source pollution and carbon emissions. Therefore, agricultural development must shift its production model to simultaneously protect the ecological environment and increase output, aiming to improve agricultural green efficiency [11]. A review of the existing literature reveals that the current research on green agricultural development can be categorized into several areas. (1) Efficiency measurement: Methods for measuring efficiency include the entropy weight method [12], principal component analysis [13], and the weighted composite index [14]. Evaluation methods based on input–output perspectives are widely used due to their advantages in depicting factor allocation levels. The traditional DEA model, based on radial distance functions, requires proportional changes in the inputs and outputs to improve the decision-making unit efficiency, making it less suitable for actual production requirements. Consequently, the existing research often uses DEA models with a non-radial distance function to measure agricultural green efficiency, primarily employing one-stage or multi-stage SBM models and the Malmquist index [15,16]. (2) Spatiotemporal differentiation characteristics: The current research mainly uses methods such as the Moran index [17], spatial exploratory data analysis [18], standard deviation ellipse analysis [19], kernel density estimation [20], and the Theil index [21] to study the spatiotemporal dynamics or differentiation of efficiency. (3) Influencing factors: The research typically selects indicators from aspects such as economic development level, transportation infrastructure level, technological progress, industrial structure, education level, and geographical factors [22,23,24]. These are combined with econometric models for quantitative analysis of the factors affecting efficiency.
Through the literature review, we found that while there is substantial research on green agricultural development both domestically and internationally, the following limitations still exist: First, the existing studies overlook the spatial heterogeneity, resource coupling, and developmental interconnectedness of green agricultural development across provinces in China. They lack an exploration of large-scale regional agricultural green co-development and bidirectional linkages. Second, most of the existing research is based on “attribute data,” which only reflect the current state of green agricultural efficiency but cannot capture the spatial correlations between provinces during green agricultural development. This makes it difficult to reveal the interaction mechanisms between provinces and fails to identify the specific “positions” and “roles” of each region within the correlation network. Finally, in the context of deepening integration, green agricultural development will have spatial spillover effects on geographically adjacent regions. Ignoring these spatial spillovers not only misrepresents the actual situation but also hinders the coordinated development of regional agriculture.
The contributions of this paper are mainly reflected in the following aspects: First, by using social network analysis to construct a directed network of agricultural green efficiency, we measure and analyze the network positions of provinces from a holistic perspective. This approach not only overcomes the limitations of traditional agricultural green data, which tend to be coarse, but also scientifically reveals the influence relationships between provinces in green agriculture. Additionally, it helps to identify the distribution patterns of provincial positions within the agricultural green network from a broader perspective. Second, the use of the SBM-GML model effectively eliminates the influence of environmental factors and random disturbances, allowing for a more accurate measurement of agricultural green efficiency. Third, from a spatial spillover perspective, the spatial Durbin model is employed to systematically analyze the factors affecting agricultural green efficiency, providing policy references to promote deeper regional integration.
Based on this, this paper will explore the structural characteristics and influencing factors of the spatial association network of green agricultural development from a bidirectional association perspective. First, it calculates the green agricultural efficiency of each province in China from 2000 to 2022 using the SBM-GML model. Next, it analyzes the structural characteristics of the spatial association network of China’s green agricultural efficiency using a modified gravity model and social network analysis methods to reveal the overall characteristics of the spatial network and the roles of different regions within it. Finally, the spatial influencing factors of green agricultural efficiency are incorporated, and a spatial Durbin model is established to empirically test the effects of various influencing factors on green agricultural efficiency.

3. Methodology and Data Source

3.1. The SBM-GML Model

The traditional DEA model has certain limitations: on the one hand, it cannot compare multiple decision-making units that are all on the efficiency frontier at the same time; on the other hand, the radial DEA model measures inefficiency by only considering the proportional reduction (increase) in all the inputs (outputs). However, in reality, the gap between the current state of inefficient decision-making units and the strongly efficient target values includes both proportional and slack improvements. In measuring agricultural green efficiency, although the SBM directional distance function and the GML index, which account for slack issues, effectively compensate for the shortcomings of previous methods, the SBM directional distance function fails to adequately address the inconsistency of the production units at different production frontiers, affecting the comparability of the results across periods [25]. Similarly, the GML index alone cannot overcome the evaluation bias caused by radial and angular issues.
In contrast, the GML index based on the SBM directional distance function can first effectively address both radial and angular issues. Secondly, it provides global comparability across production frontiers. Thirdly, it considers the extent of the expansion in desired agricultural outputs and the reduction in undesired outputs, aligning with the original intent of green agricultural development. Lastly, it overcomes the problem of multiple DMUs being evaluated as efficient and the proportional change in inputs (or outputs), thereby providing a more accurate measurement of agricultural green efficiency.
This paper first uses the SBM model, which accounts for undesirable outputs, to measure all the decision-making units. Based on this, we then select the super-efficiency SBM model, also considering undesirable outputs, to measure the effective decision-making units with an efficiency value of 1. Furthermore, to overcome the limitation of direct cross-period comparisons of agricultural green efficiency, this paper adopts the method proposed by Pastor [26] to construct a global GML index for measurement and further decomposes agricultural green efficiency. The steps are as follows:
First, it is necessary to construct the global benchmark production possibility set PG. If agricultural production requires N types of input factors x, M types of desired outputs y, and O types of undesirable outputs b, the production possibility set PG is given by Equation (1).
P G ( x ) = { { ( y t , b t ) : i = 1 I λ i t x i , n t x n t , n = 1 , 2 , , N ; i = 1 I λ i t x i , m t y n t , m = 1 , 2 , , M ; i = 1 I λ i t b i , O t = b O , o = 1 , 2 , , O ; λ i t 0 ; i = 1 , 2 , , I ; }
Second, the directional distance function D G T is calculated, as shown in Equation (2).
D G T = ( x , y , t ) = max { β | ( y + β y , b β b P G ( x ) }
β represents the maximum degree of expansion or contraction.
Third, the GML index is calculated, as presented in Equation (3).
G M L t , t + 1 ( x t , y t , b t , x t + 1 , y t + 1 , b t + 1 ) = ( 1 + D G T ( x t , y t , b t ) ) / ( 1 + D G T ( x t + 1 , y t + 1 , b t + 1 ) )
By measuring the agricultural green efficiency of each province from 2000 to 2022, an initial understanding of China’s agricultural green development can be gained. This paper uses ArcGIS software 10.7 to create spatial distribution maps of agricultural green efficiency across China’s provinces. The natural break classification method was applied to categorize the data into three levels, and visual maps were produced for the years 2000–2001, 2007–2008, 2014–2015, and 2021–2022.

3.2. The Modified Gravity Model

The existing literature on constructing spatial association matrices primarily uses two methods: the Var Granger causality analysis method and the gravity model [27]. The Var Granger causality analysis method may encounter issues where a region’s efficiency values consistently equal 1, resulting in a near-singular matrix that prevents the establishment of a normal binary matrix [28]. The gravity model, derived from the law of universal gravitation in physics, follows the principle of distance decay and has strong applicability [29]. However, the traditional gravity model has certain limitations. First, it does not consider the direction of the attraction between regions, as the contribution of two regions to agricultural green linkages is different. Second, it uses a single indicator, only considering agricultural development, which does not align with the intrinsic requirements of high-quality development. Drawing on the existing research for correction [30,31], due to the asymmetry of the gravity matrix, we introduce a modulation parameter K into Equation (4), representing the heterogeneity of the agricultural green efficiency gravity between provinces.
Therefore, this paper modifies the traditional gravity model to construct the spatial association network of China’s agricultural green efficiency. The basic form of the model is
T ij = K i j E i · E j [ d i j / ( G i G j ) ] 2 , K i j = E i E i + E j
In the formula, Tij represents the spatial correlation distance between province i and province j; Ei and Ej denote the agricultural green efficiency of province i and province j; Kij represents the ratio of the sum of the agricultural green efficiencies j, indicating the direction of the spatial association of agricultural green efficiency between province i and province j; dij represents the geographical distance between province i and province j; and Gi and Gj denote the per capita GDP of province i and province j.
Based on the formula, a spatial association gravity matrix for agricultural green efficiency is calculated for each province (31 × 31). Further, the average value of each row in the matrix is used as the threshold. When the elements of a row are greater than or equal to this threshold, they are denoted as 1, indicating the existence of a spatial association between the corresponding provinces; otherwise, they are denoted as 0, indicating no spatial association between the provinces [32]. This constructs a directed asymmetric binary adjacency matrix to characterize the spatial association network of agricultural green efficiency. In this matrix, the elements of each row reflect the outgoing relationship of agricultural green efficiency from province i to province j, while the elements of each column represent the incoming relationship of agricultural green efficiency from province i to province j.

3.3. Social Network Analysis

As an interdisciplinary research method, social network analysis is widely applied in various fields, such as sociology and economics. Its foundation and core lie in establishing “relationships”, primarily using graphs, theory, and mathematical models to describe the positions (nodes) and connections (edges) between social actors and to study the impact of social relationships within the network on these actors [33]. This paper uses social network analysis to deeply investigate the spatial association network characteristics of China’s agricultural green efficiency from three aspects: the overall network characteristics, individual network characteristics, and block modeling.
The overall network characteristics mainly include network density, correlation degree, network hierarchy, and network efficiency. Network density is used to characterize the tightness of the spatial association network structure, correlation degree is used to characterize the stability and vulnerability of the network structure, network hierarchy is used to characterize the asymmetrical reachability among provinces in the network, and network efficiency is used to characterize the number of spatial spillover channels for the agricultural green efficiency of each province [34,35].
Individual network characteristics are mainly assessed through degree centrality, closeness centrality, and betweenness centrality [36]. Degree centrality primarily measures the extent to which each province holds a central position in the overall network. Closeness centrality mainly measures the proximity of each province to other provinces. Betweenness centrality primarily measures the extent to which each province controls the association relationships between other provinces.
Block modeling is used to analyze the internal structure of the spatial association network by utilizing the strength of connections in agricultural green efficiency among provinces. This approach explores the substructures within the overall structure and examines the positions and roles of provinces within the network from the perspective of blocks [37]. Based on the existing research, the roles of blocks in the spatial association network of agricultural green efficiency are classified into four categories [38]. (1) Net beneficiary block: Members within this block receive significantly more relationships from other blocks than they send out. (2) Broker block: This block has more connections with external members than with internal members. (3) Bidirectional spillover block: This block both receives spillovers from and sends out connections to external blocks. (4) Net spillover block: This block sends out significantly more spillovers to other blocks than it receives from them.

3.4. Spatial Econometrics

The current research mostly uses non-spatial models to identify influencing factors, but since provinces are spatial entities, ignoring the spatial effects between variables may lead to biased estimation results [39]. Considering that the Moran’s index test provides significant evidence of spatial correlation, this paper uses the spatial Durbin model to identify the key factors influencing agricultural green efficiency across provinces. The formula is as follows:
A G E i t = η 0 + ρ W A G E i t + η 1 c o n t r o l s + φ W c o n t r o l s + λ t + θ i + μ i t
The variables in the model are defined as follows: W*AGEit is the spatial lag term for agricultural green efficiency, indicating the impact of agricultural green development in adjacent regions on the agricultural green development of the current region; W*controls is the spatial lag term for the control variables, indicating the impact of control variables in adjacent regions on the agricultural green development of the current region. Referring to relevant literature [23,24,40,41], this paper selects seven variables as influencing factors for agricultural green efficiency: the proportion of the primary industry (PI), human capital level (HC), labor force quantity (LF), degree of openness (OD), level of research and development (RD), economic development level (ED), and new quality productivity level (NQ). W is the spatial weight matrix, and this paper uses the adjacency matrix.

3.5. Data Source and Explanation

Given the availability and continuity of the data, this study selects the years 2000 to 2022 as the research period and conducts research on green agricultural development based on 31 provinces, municipalities, and autonomous regions (excluding Hong Kong, Macau, and Taiwan).
In the measurement of agricultural green efficiency, the input factors include the number of employees in the primary industry, the total power of agricultural machinery, crop sown area, total agricultural water usage, the amount of fertilizer applied, pesticide usage, and agricultural film. The expected output is the total output value of agriculture, forestry, animal husbandry, and fishery, while the undesired output is agricultural carbon emissions (calculated using the IPCC-published carbon emission coefficients for fertilizers, pesticides, agricultural films, diesel, plowing, and agricultural irrigation). The data are sourced from the China Rural Statistical Yearbook (https://data.cnki.net/, accessed on 20 July 2024).
In the analysis of factors influencing agricultural green efficiency, indicators such as the proportion of the primary industry (PI), human capital level (HC), labor force quantity (LF), degree of openness (OD), level of research and development (RD), economic development level (ED), and new quality productivity level (NQ) are sourced from the China Statistical Yearbook. (https://www.stats.gov.cn/, accessed on 17 July 2022).

4. Results

4.1. Analysis of Agricultural Green Efficiency in China

This paper uses the 31 provinces in China as the decision-making units and employs MATLAB software 2020 to calculate the annual agricultural green efficiency. To further understand the changes in regional differences, ArcGIS software10.7 was used to draw spatial distribution trend maps of China’s agricultural green efficiency for the periods 2000–2001, 2007–2008, 2014–2015, and 2021–2022 (Figure 1). Overall, from 2000 to 2022, China’s agricultural green efficiency has steadily improved, with high-efficiency areas gradually shifting from the eastern to the central and western regions, where the western regions exhibit a significant latecomer advantage. Regionally, the agricultural green efficiency of each province has also gradually increased. This indicates that with the introduction of China’s agricultural green policies and the increase in financial investment, significant progress has been made in China’s agricultural green development. For instance, the promotion of efficient water-saving irrigation technologies, the use of smart agricultural equipment, and the adoption of advanced pest control techniques have all contributed to the sustainable development of agricultural production and an improvement in resource use efficiency.
At the same time, it is important to note that there are significant regional disparities in the green efficiency of China’s agriculture across different years, with pronounced imbalances in development. The average agricultural green efficiency by region follows the pattern east > northeast > central > west, while the average annual growth rates are ranked as west > central > east > northeast. The reasons for these differences include the east’s abundant natural resources and geographic advantages, as well as its socioeconomic development, which has given it a clear lead in agricultural development compared to the national average. The west, with poorer natural conditions and a later start in socioeconomic development, lags behind in agricultural development. However, thanks to policies such as the Western Development Strategy, the region has shown strong catch-up momentum in recent years. For example, Guizhou province’s average annual growth rate is 1.14%, ranking among the highest in the country, with all provinces except Inner Mongolia, Xizang, and Ningxia exceeding an annual growth rate of 1%. The central region, despite having some advantages in natural endowments and economic development, lags behind the east and northeast in its average agricultural green efficiency due to the booming east and the emphasis on developing the northeast. For instance, Shaanxi province’s average annual growth rate is only 0.38%. In the northeast, despite its rich agricultural resources and high output in farming, forestry, animal husbandry, and fisheries, the region faces challenges such as low product added value and weak industrial synergy. In addition, the growing gap between the north and south has led to significant outmigration of labor from the northeast, which has somewhat constrained green development.

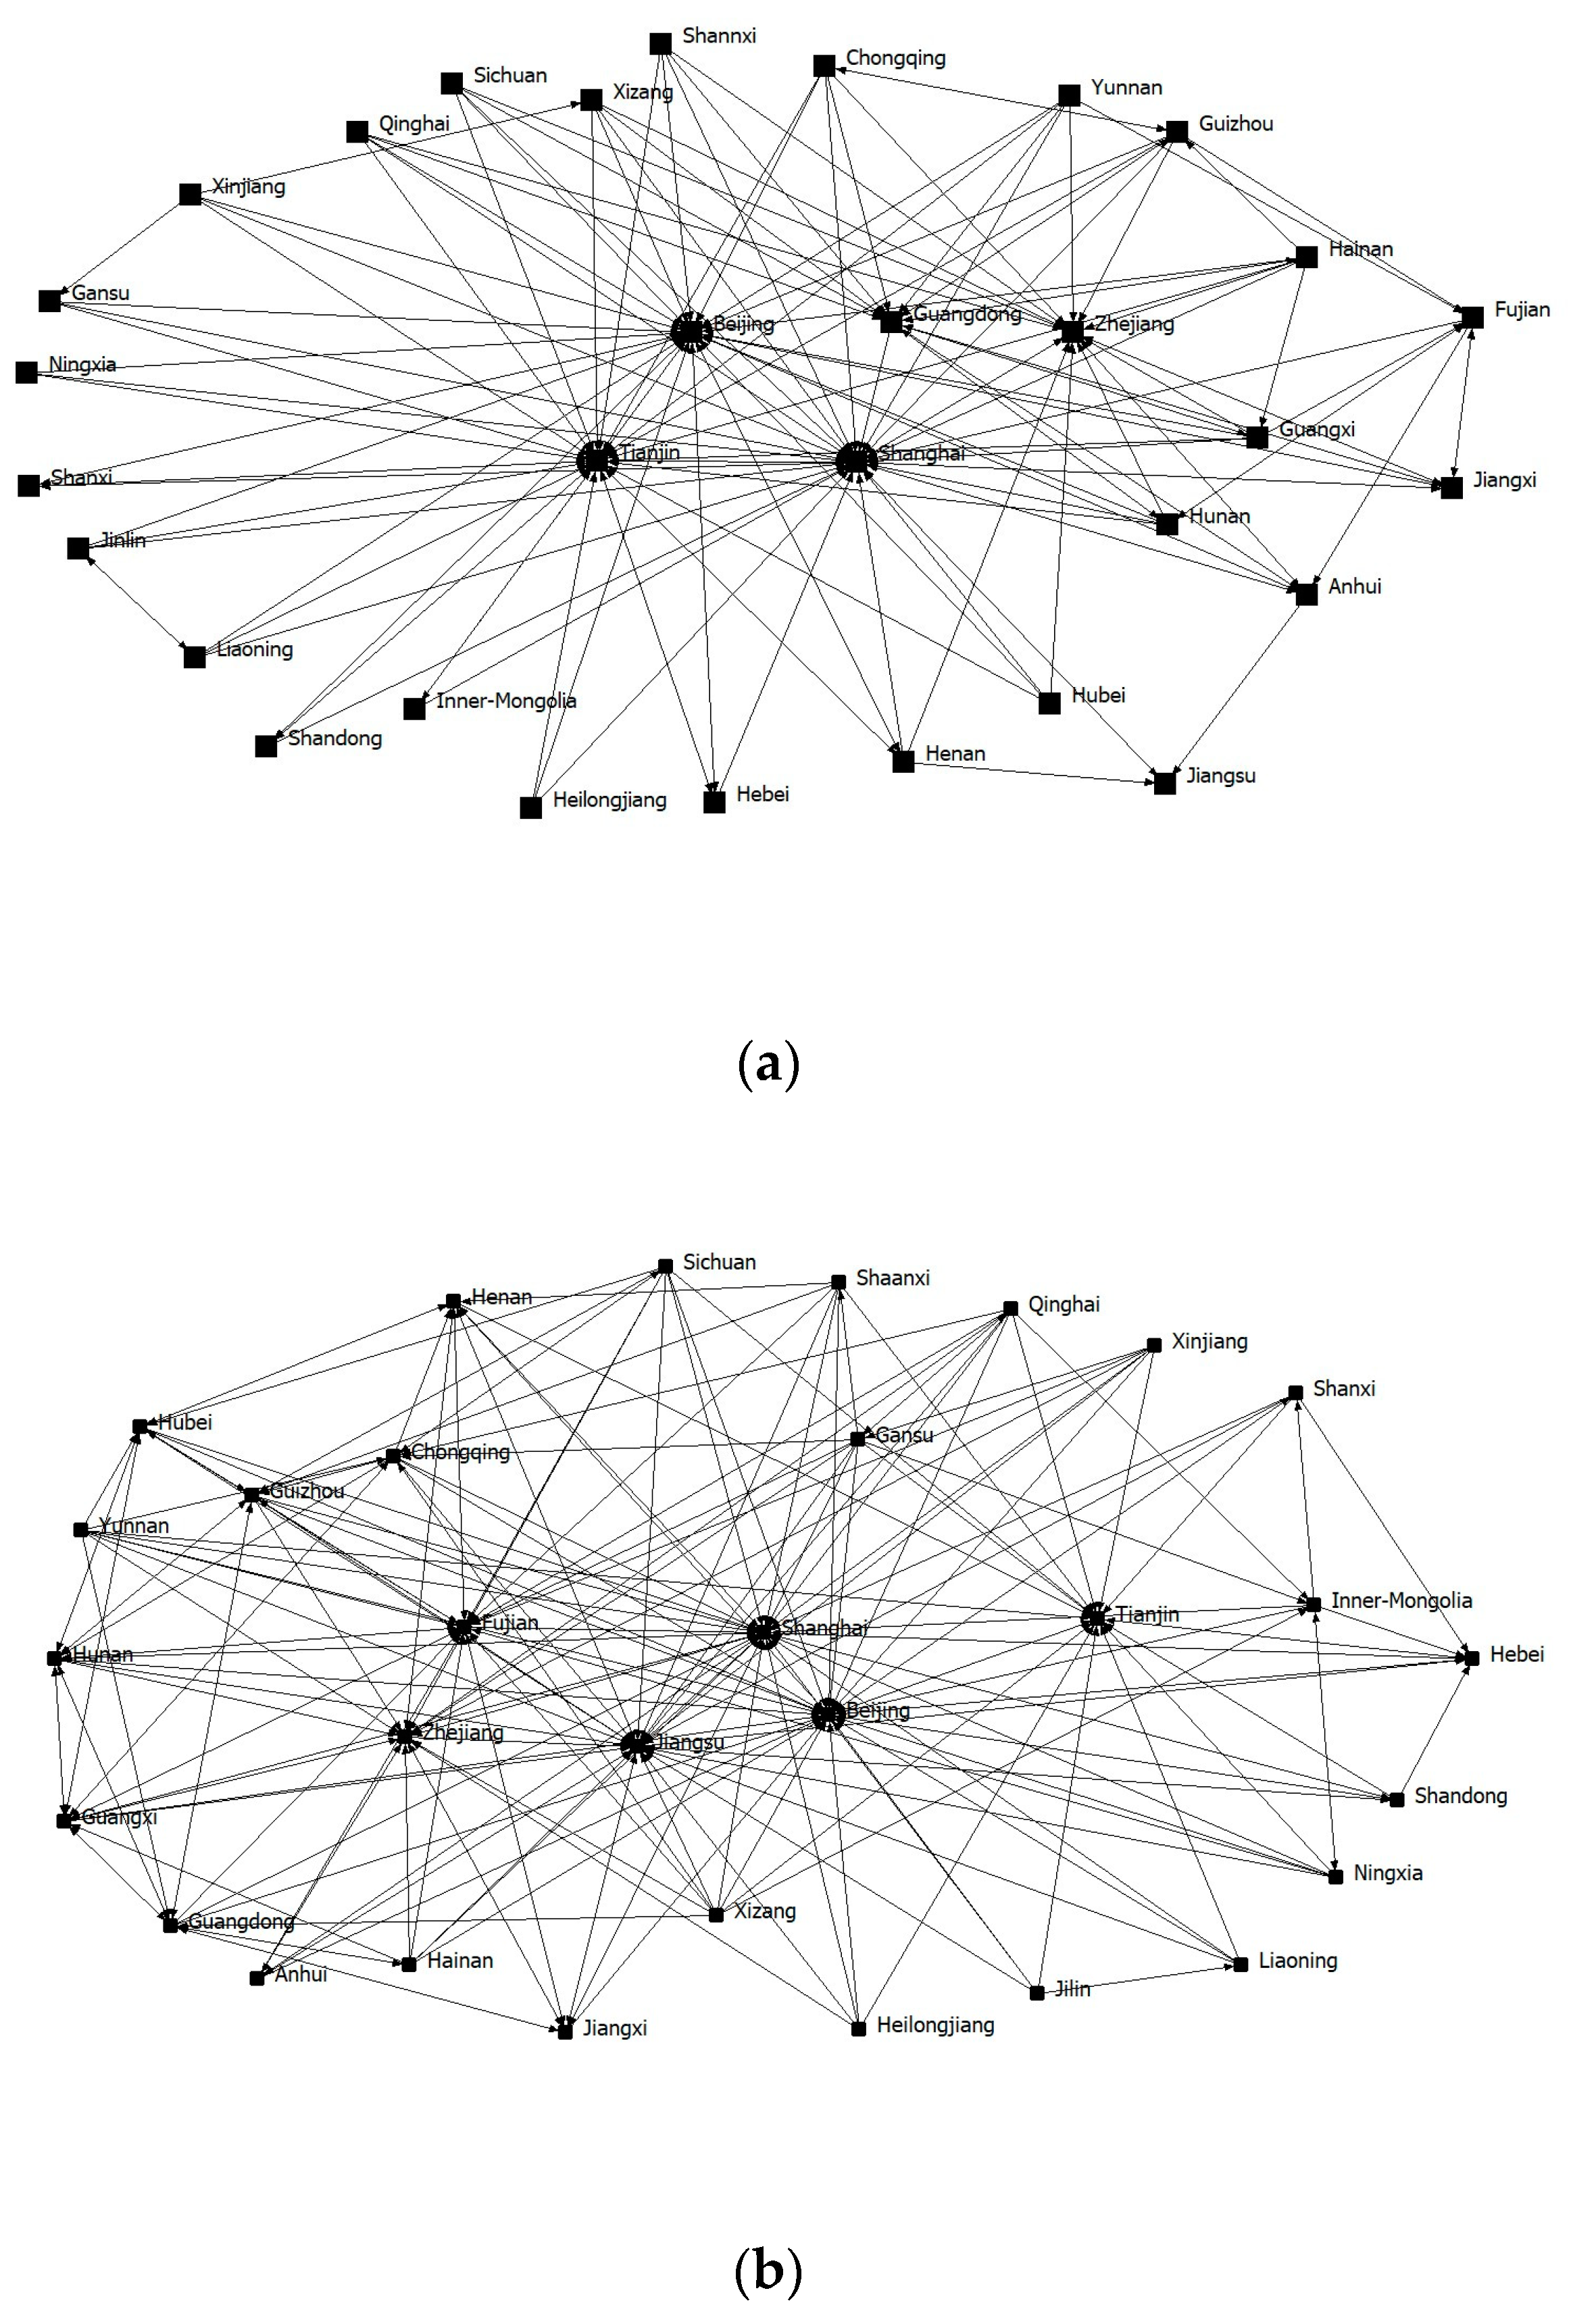
4.2. Characterization of the Spatial Correlation Network Structure

This paper uses a gravity model to identify the transmission relationships of agricultural green efficiency among provinces and then constructs a spatial correlation matrix. To illustrate the structural form of the spatial correlation network of China’s agricultural green efficiency, Ucinet 6 software’s Netdraw tool was used to conduct a visual analysis of the agricultural green efficiency correlation network for 31 provinces in China in 2000 and 2022 (Figure 2). As shown in the figure, China’s agricultural green efficiency in 2000 and 2022 presents a complex multi-threaded network structure, with no province existing independently. The maximum possible number of relationships among the 31 provinces is 930, with the actual total number of spatial correlations being 142 in 2000 and 204 in 2022. This indicates that although the spatial interaction and spillover effects of China’s agricultural green efficiency have increased, they remain relatively weak, and the speed of resource factor circulation among provinces still needs to be strengthened. In 2000, the network was mainly centered around eastern provinces and cities such as Beijing, Guangdong, Tianjin, and Shanghai. By 2022, new centers had emerged, including eastern provinces and cities such as Zhejiang, Jiangsu, and Fujian. Additionally, central and western provinces such as Guizhou, Chongqing, Hunan, and Gansu also show the potential to develop into network centers. The overall pattern is gradually evolving towards a structure with the eastern regions as the core and the central and western regions as the periphery.

4.3. Characteristics of the Overall Network Structure

This paper uses Ucinet 6 software to measure the correlation degree, network density, network hierarchy, and network efficiency of China’s agricultural green efficiency (Figure 3).
Firstly, the correlation degree is 1, indicating that there are no provinces disconnected from the spatial correlation network of China’s agricultural green efficiency, and the accessibility between network nodes is relatively good, with spatial interaction and spillover effects being widespread.
Secondly, the network density shows a steady upward trend, rising from 0.1478 in 2000 to 0.2123 in 2022. This reflects that the spatial correlation network of agricultural green efficiency is becoming increasingly dense and large, not confined to the spillover effects of neighboring provinces’ agricultural green efficiency but breaking through traditional geographical constraints to generate various spatial correlations among non-adjacent provinces.
Thirdly, the network hierarchy decreased from 0.5721 in 2000 to 0.5493 in 2022, indicating that the hierarchical structure of the network is gradually diminishing. With an improvement in agricultural green efficiency, the trend in regional cooperation is becoming more significant, and cross-regional collaboration models are gradually emerging.
Fourthly, the network efficiency declined from 0.8023 in 2000 to 0.6920 in 2022, indicating an increase in the number of internal connections within the spatial network. This suggests that the channels for internal network connections are becoming increasingly diverse, and the network stability has been enhanced.
Finally, analysis of the overall network characteristic indicators reveals that there are significant spatial correlations and spillover paths within the network of China’s agricultural green efficiency. The phenomenon of coordinated development is evident, and a relatively stable agricultural green spatial correlation network has been formed. However, the network hierarchy remains high, and the network structure is relatively loose. Enhancing the network density and reducing the network hierarchy are key challenges in achieving sustainable agricultural development in China.

4.4. Characteristics of the Individual Network Structure

This paper analyzes the spatial network centrality characteristics of China’s agricultural green efficiency at two times, 2000 and 2022. The calculation results are shown in Table 1.
(1)
Degree centrality: From 2000 to 2022, the agricultural green efficiency of provinces and cities in China showed a significant upward trend, with notable regional imbalance characteristics. Beijing, Tianjin, Shanghai, Jiangsu, Zhejiang, Guizhou, and Gansu have absolute advantages, occupying a dominant position in the spatial network. From the average value, an upward trend from 2000 to 2022 is evident, indicating that an increasing number of provinces are participating in the network collaboration of agricultural green efficiency. The in-degree and out-degree of the network reflect the spillover and benefit relationships for each province and city, both of which have seen an increase in their average values. This indicates that the agricultural green efficiency of provinces and cities has significant and continuously strengthening spillover effects.
(2)
Closeness centrality: From 2000 to 2022, the efficiency of the agricultural green network flow has continuously improved, and the channels of inter-regional connections have become increasingly diverse. Beijing, Tianjin, Shanghai, Jiangsu, Zhejiang, Fujian, and Chongqing rank high in closeness centrality, indicating that these provinces and cities have shorter path distances to other nodes in the network and play the role of “central actors”. This is mainly because these provinces and cities have a good agricultural development foundation, with a well-established system in infrastructure, industrial structure, and talent training, and play an important role in technology transfer and diffusion. Additionally, their advantageous geographical conditions make them important intermediaries, thereby driving regional agricultural green development.
(3)
Betweenness centrality: Provinces and cities ranking high in betweenness centrality include Beijing, Shanghai, Jiangsu, Fujian, Jiangxi, Shandong, Henan, Guangdong, Guangxi, and Guizhou. This indicates that these regions play a key “bridge” role in the spatial correlation network of China’s agricultural green efficiency. As important nodes in the network, they have a strong influence on the formation of connections between other provinces and cities. If these nodes encounter problems, the connections in the network may break, leading to the formation of “structural holes”. For provinces with consistently low betweenness centrality, such as the three northeastern provinces, Yunnan, Gansu, and Qinghai, it is necessary to strengthen their connections and communication with other regions to avoid marginalization in the agricultural green network.

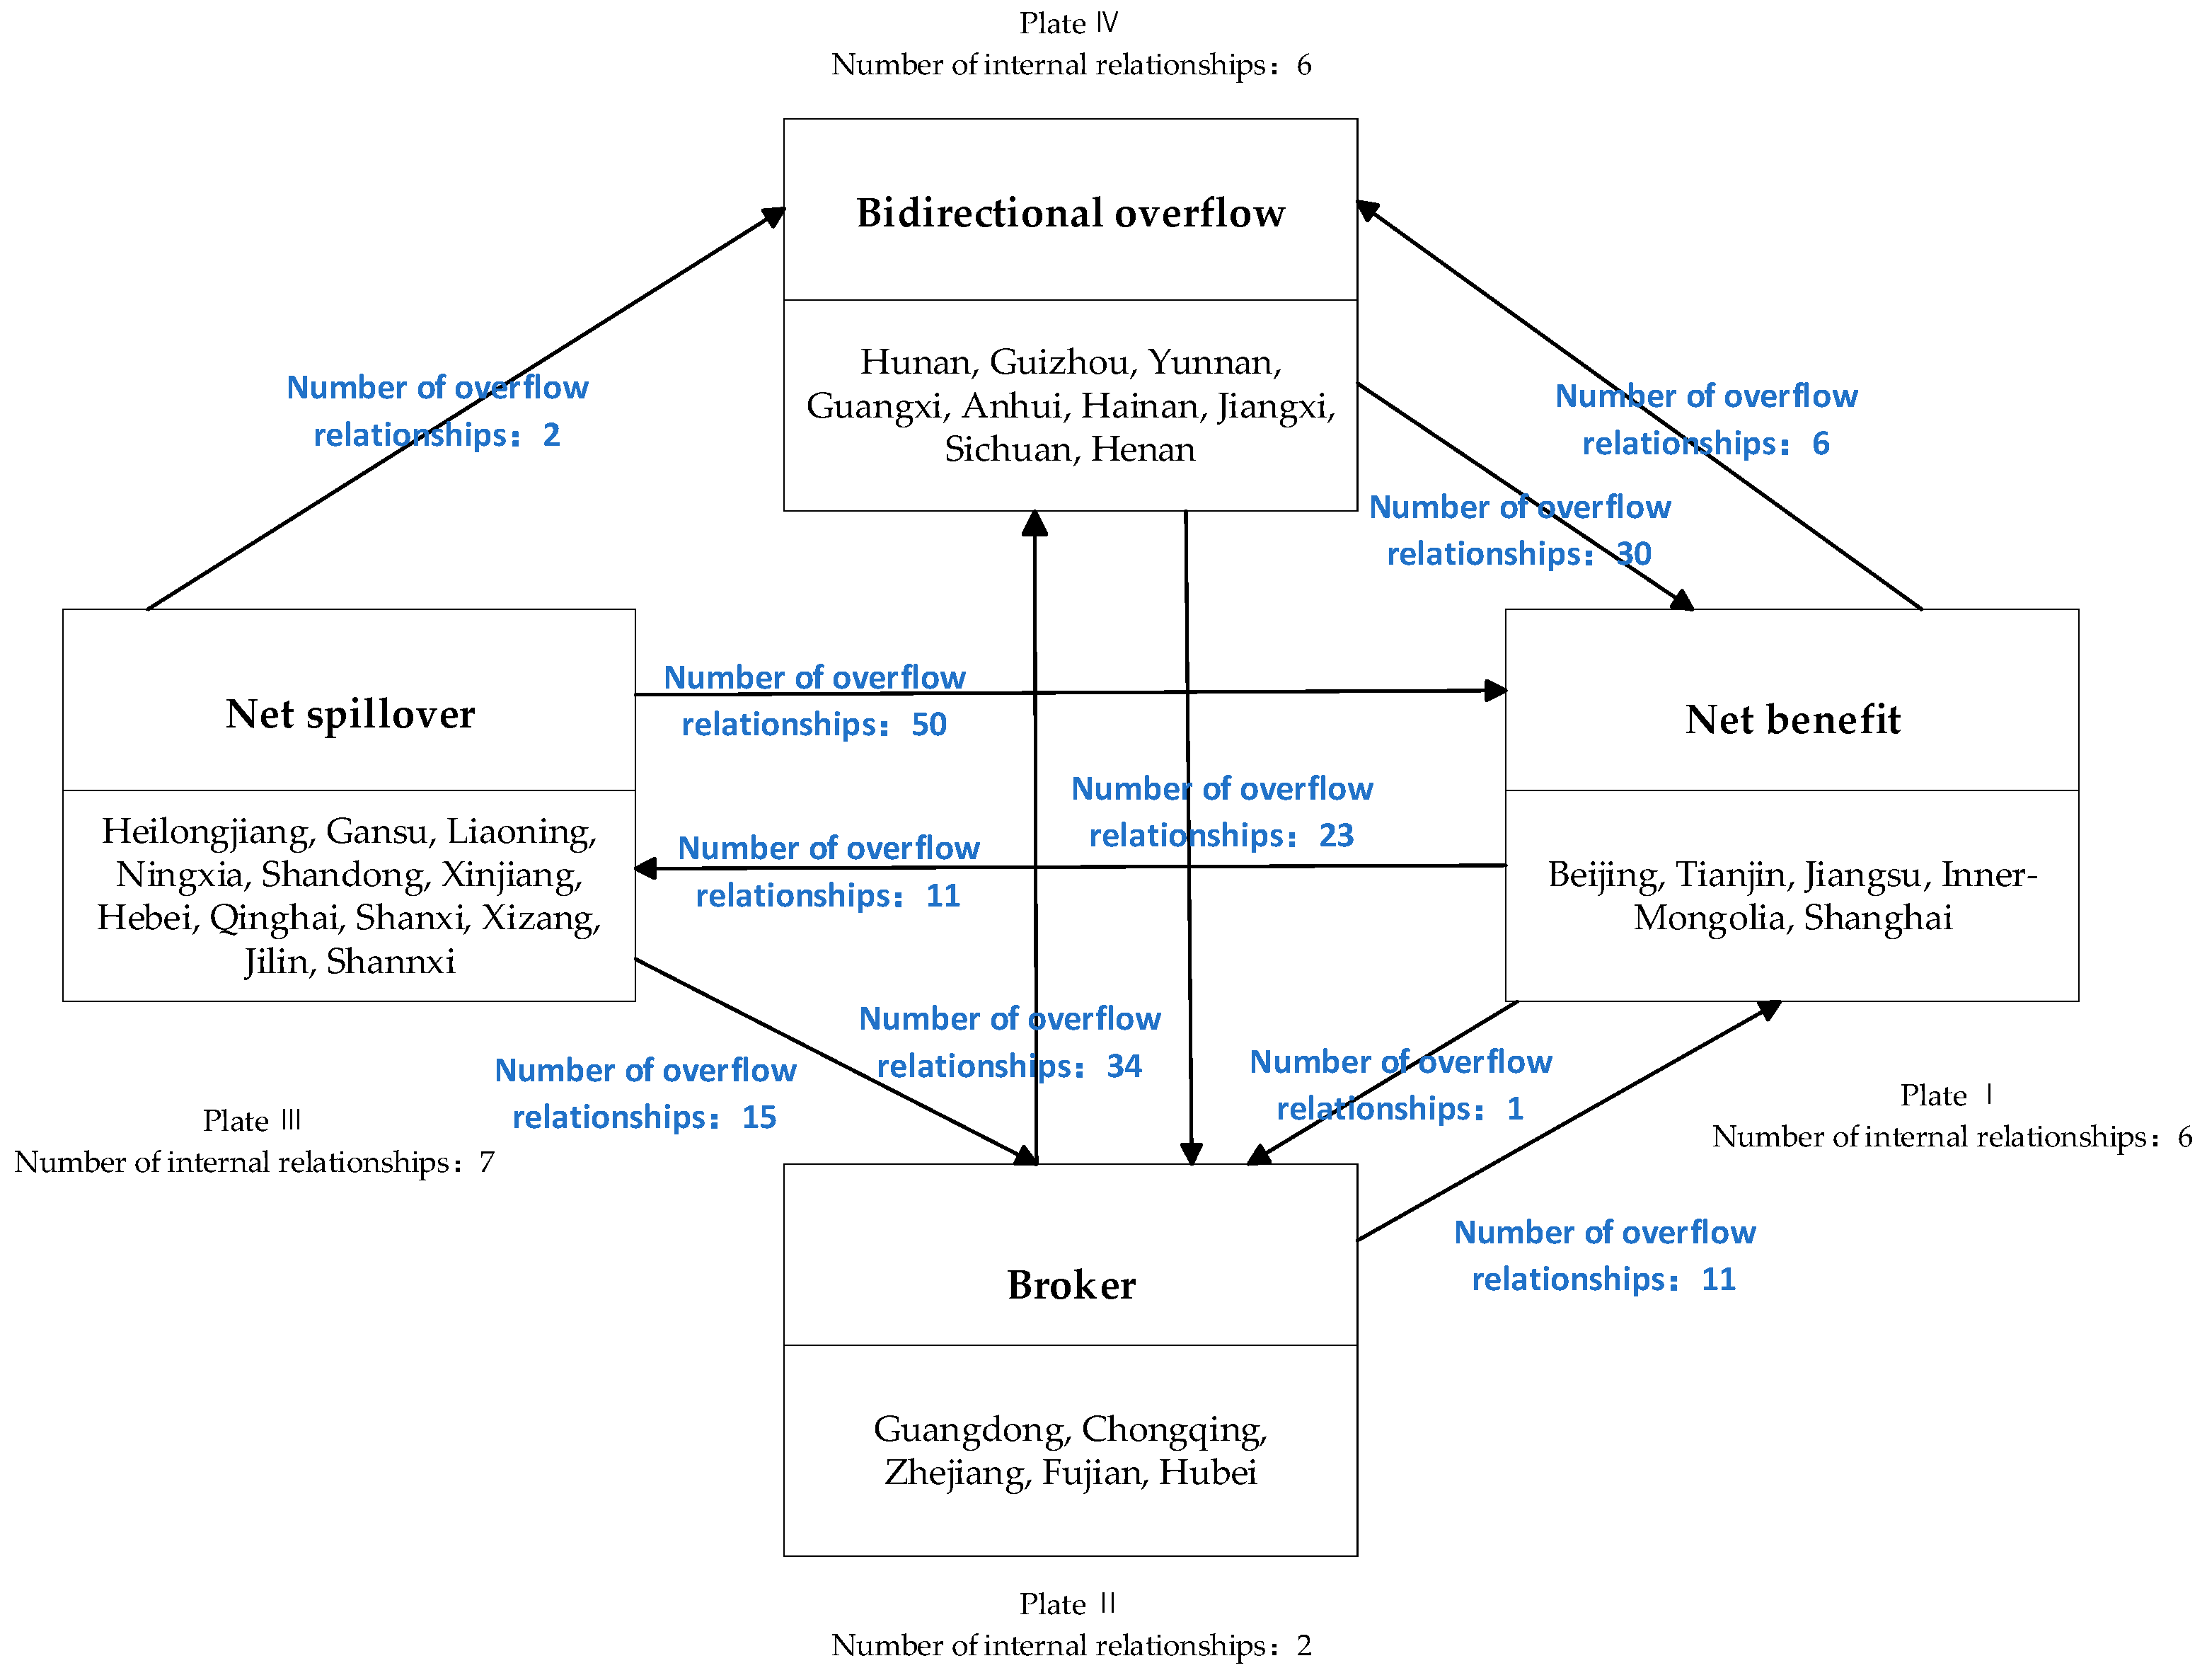
4.5. Block Model Analysis

To further explain the spatial clustering characteristics of agricultural green efficiency in various provinces and cities in China, this paper uses the CONCOR module in Ucinet 6 software. Setting the maximum splitting depth to 2 and the concentration to 0.2, the provinces of China are divided into four blocks [35]. The results show that Block I has five members: Beijing, Tianjin, Jiangsu, Inner Mongolia, and Shanghai. This block has a significantly higher number of incoming relationships than outgoing relationships, and the expected proportion of internal relationships is much lower than the actual proportion of internal relationships, indicating the characteristics of a “net beneficiary” block. Block II includes Guangdong, Chongqing, Zhejiang, Fujian, and Hubei, with a similar number of incoming and outgoing relationships and fewer internal relationships, indicating the characteristics of a “broker” block. Block III includes Heilongjiang, Gansu, Liaoning, Ningxia, Shandong, Xinjiang, Hebei, Qinghai, Shanxi, Xizang, Jilin, and Shaanxi, with a significantly higher number of outgoing relationships than incoming relationships, indicating the characteristics of a “net spillover” block. Block IV includes Hunan, Guizhou, Yunnan, Guangxi, Anhui, Hainan, Jiangxi, Sichuan, and Henan, characterized by both receiving external block connections and spilling over to other blocks, indicating the characteristics of a “two-way spillover” block (Table 2).
To examine the relationships between blocks and the roles each block plays in the correlation network, this paper calculated the spillover effects of each block. The results show that there are 21 internal relationships within the blocks and 183 relationships between the blocks. This indicates that there are significant spatial correlations and spillover effects between the blocks within the network of China’s agricultural green efficiency, with the spatial spillover effects primarily being inter-regional.
To examine the relationships and spillover paths of agricultural green efficiency between the blocks, this paper further calculates the network density matrix between the blocks. Using the network density value of 0.2123 for 2022 as the baseline, if the density between blocks is greater than this value, it is assigned a value of 1; otherwise, it is assigned a value of 0. This converts the density matrix into an image matrix [42].
To further explore the spillover relationships between blocks, this paper visualizes the inter-block connections within the network (see Figure 4) based on the density matrix and the image matrix of efficiency in China’s green agricultural development.
From Table 3 and Figure 4, it can be seen that Block I, compared to the other blocks, exhibits a less significant spillover effect and plays the role of a “net beneficiary” in the network. This is because provinces and cities such as Beijing, Tianjin, Jiangsu, Inner Mongolia, and Shanghai within this block occupy a core position in China’s green agricultural development, allowing them to efficiently receive spillover effects from other blocks. Block II not only influences the green agricultural efficiency of Block I through spillover effects but also receives spillover effects from Blocks III and IV, with relatively low internal relations, playing the role of a “broker” This is due to the favorable resource conditions, high technological levels, and convenient transportation locations for green agricultural production in the provinces and cities within this block, such as Guangdong, Chongqing, Zhejiang, Fujian, and Hubei. Their agricultural production, besides meeting the local demand, can also distribute factors to other regions, forming a collaborative and interactive development between regions. Block III generates spillover effects on Blocks I and II but does not receive any spillover effects itself, acting as a “net spillover” in the network. Provinces and cities in this block, such as Heilongjiang, Gansu, and Liaoning, benefit from their economic radiation, where economic growth drives green development. The push towards industrial upgrading and functional modernization gradually makes them the “engine” of the green agricultural efficiency network. Block IV both receives spillover effects from Block II and generates spillover effects on Blocks I and II. With a relatively high proportion of internal relations, it plays a “bidirectional spillover” role in the network. The main members of this block include provinces such as Hunan, Guizhou, and Yunnan, which have a radiating effect in the green agricultural efficiency network. For example, Henan radiates to the Yellow River Basin region, and Guizhou radiates to the southwestern region of China. The bidirectional spillover provinces act as “guides” in China’s green agricultural network, closely associated with other provinces and exhibiting significant bidirectional spillover effects.

5. The Spatial Driving Factors of Agricultural Green Efficiency

This article first conducts a spatial autocorrelation test and calculates the global Moran’s I index for China’s agricultural green efficiency. The results show that in most years, the test passed the 1% significance level, and the index was positive. This indicates significant positive spatial spillover effects between provinces, demonstrating that using a spatial econometric model for this study is appropriate [43].
After conducting the spatial correlation test, it is necessary to select an appropriate spatial econometric model. First, the LM test is used to determine whether spatial lag and spatial error terms are present. The results indicate that all tests, except for the Robust LM (lag), are significant at the 1% level. According to the criteria given by Anselin [44], the econometric model should include both spatial lag (an SLM) and spatial error terms (a SEM). Based on this, choosing the spatial Durbin model (SDM) is more appropriate for the actual situation.
Next, the LR test and Wald’s test are used to evaluate whether the SDM model can be simplified into an SLM model or a SEM model. The p-values of both the LR test and the Wald’s test results are significant at the 1% level, indicating that the SDM model does not degrade into either the SLM model or the SEM model. This further confirms that selecting the SDM model is the appropriate decision.
Finally, the Hausman test is used to determine whether the model is a random effects model or a fixed effects model. The test results reject the null hypothesis at the 1% level, indicating that the fixed effects model is chosen. Therefore, this paper ultimately selects the spatial Durbin model with two fixed effects for the empirical analysis (Table 4). This model includes both endogenous and exogenous spatially lagged variables, making it a suitable framework for capturing different types of spatial spillover effects. Given the robustness of spatial econometric models, the estimation results of the spatial lag model and the spatial error model are also presented.
Based on the results of the spatial lag model, the spatial error model, and the spatial Durbin model regression using the form of the adjacency space weight matrix, as shown in Table 5, this paper focuses on the analysis based on the fixed effects of the spatial Durbin model. The rho value in the table measures the spatial spillover effect, and the rho value is positive and passes the significance test at the 1% level. This indicates that there are significant spatial spillover effects in the green agricultural development among Chinese provinces and cities. This suggests that the green agricultural development in a region will be positively influenced by the neighboring regions. Under the condition of free movement of labor factors, elements such as the technology and talents required for green agricultural development in a region will spill over to neighboring regions, thereby affecting the green agricultural development in those regions [45].
In terms of the explanatory variables, we have the following: (1) Proportion of the primary industry (PI): The direct effect is negative and insignificant, while the spatial effect is negative and significant. The reason is that a higher proportion of agriculture in neighboring provinces increases the proportion of resources, labor, human capital, and technological factors invested, which to some extent restricts the green transformation and development of agriculture in the province. (2) Level of human resources (HC): The direct effect is significantly positive, while the spatial effect is negative and insignificant. This is because rural human capital is a practical need to achieve high-quality agricultural development. Farmers with higher education levels possess sustainable development thinking, can acquire advanced knowledge, and adopt new technologies, thus accelerating the green transformation of agriculture in the region. (3) Level of labor force (LF): The direct effect is negative and insignificant, while the spatial effect is negative and significant. When the number of agricultural workers is higher, the nearby labor resources available for green agricultural development are more abundant, which may lead to quicker achievement of green agricultural development. However, an excessive labor population in neighboring provinces may cause overuse of agricultural resources, thereby hindering the green development of agriculture in the region [46]. (4) R&D investment (RD): The direct effect is positive and insignificant, while the spatial effect is positive and significant. This indicates that an increase in R&D investment can efficiently disseminate advanced agricultural production information. The higher the R&D investment in neighboring provinces, the higher the degree of agricultural information acquisition in the region, which is conducive to the green transformation of agriculture. (5) Level of economic development (ED): The direct effect is significantly negative, while the spatial effect is negative and insignificant. In economically developed areas, agricultural resources are relatively scarce, which to some extent constrains agricultural development. (6) Level of new quality productivity (NQ): The direct effect is significantly negative, while the spatial effect is negative and insignificant. Currently, the development of new productivity in China is in its initial stages and has not yet formed scale effects in agriculture, especially due to the significant differences in infrastructure between regions. Concentrated resource investment may have a certain negative impact on green agricultural development [47].
It is worth noting that although the coefficient for the degree of openness (OD) is positive, it did not pass the significance test, indicating that the level of openness has not played a significant positive role in green agricultural development. The possible reason for this is that international trade in agricultural products more directly promotes the adjustment and optimization of agricultural production structures, enhances comprehensive agricultural production capacity, and improves the international competitiveness of agricultural products but has not yet had an impact on green agricultural development.

6. Conclusions

6.1. Findings

Based on data from Chinese provinces from 2000 to 2022, this paper calculates China’s agricultural green efficiency using the SBM-GML model and analyzes its spatial and temporal variation characteristics. A modified gravity model is used to construct the spatial network of agricultural green efficiency across provinces, and social network analysis is employed to examine the structural characteristics of the spatial network. Further, spatial econometric methods are used to analyze the driving factors for agricultural green efficiency. This study finds the following:
(1) China’s agricultural green efficiency has steadily improved, with the high-efficiency regions gradually shifting from the eastern to the central and western regions, where the western region exhibits a significant latecomer advantage. (2) From the perspective of spatial network structure characteristics, between 2000 and 2022, China’s agricultural green efficiency presented a complex multi-threaded network structure. While spatial interaction and spillover effects have increased, they remain relatively weak, and the speed of the flow of resource elements between provinces still needs to be strengthened. The overall pattern is gradually developing into a structure with the eastern region as the core and the central and western regions as the periphery. (3) In terms of the overall network characteristics, there are significant spatial associations and spillover paths in the network of China’s agricultural green efficiency, with a noticeable phenomenon of coordinated development. A relatively stable spatial association network for agricultural green efficiency has formed, but the network’s hierarchy is high, and its structure is relatively loose. (4) Regarding individual network structure characteristics, China’s agricultural green efficiency shows significant regional imbalance. Provinces such as Beijing, Shanghai, and Jiangsu rank high in degree centrality, closeness centrality, and betweenness centrality, playing the roles of “leaders” and “intermediaries” in the agricultural green efficiency network. (5) From the block model analysis, the spatial association network of China’s agricultural green efficiency forms four major blocks. The associations within blocks are sparse, while inter-block connections are relatively close, exhibiting strong spillover effects. The roles of each block in the network are heterogeneous: the eastern developed regions exhibit a significant “siphon effect” and benefit considerably, forming the main beneficiary block; most of the provinces in the central and western regions show significant spillover effects, forming the main spillover block; the southeastern coastal regions play an obvious intermediary role, forming the broker block; and the southwestern provinces play a “guiding” role in the agricultural green network, forming the bidirectional spillover block. (6) The spatial econometric analysis shows that the spatial influence effects of the proportion of the primary industry and labor force levels are significantly negative, while the spatial influence of R&D investment is significantly positive. The spatial effects of human capital level, degree of openness, economic development level, and new quality productivity level are not significant.

6.2. Recommendations

Based on the above research conclusions, this article proposes the following policy recommendations:
(1)
Local governments should adopt the concept of coordinated agricultural green development. They need to fully utilize the roles of both “government” and “market” in promoting spatial associations in agricultural development, develop multi-level and systematic regional agricultural green development plans, break down administrative barriers, and encourage the establishment of cross-regional agricultural green coordination mechanisms. The eastern regions, which are at the core of the network, should continue to leverage their advantages, especially their radiation and driving effects, to reduce gaps in agricultural capital utilization, technology adoption, and field management among provinces, thereby effectively reducing the network’s hierarchy. Meanwhile, the central and western regions, positioned at the network’s periphery, should adapt to local conditions, improve agricultural infrastructure, establish cooperation channels with developed eastern provinces, and cultivate endogenous drivers for agricultural green development.
(2)
The regional associations and spillover effects of agricultural green development should be fully utilized. On the one hand, a cross-regional agricultural green development spatial network should be established to allow agricultural elements to flow freely within the network. On the other hand, the roles of different regions within the spatial network should be clarified, with each region leveraging its strengths. The developed eastern regions should continue to exert a siphoning effect, actively accommodating the transfer of agricultural green industries. The central and western regions should further enhance the efficiency of resource allocation in agricultural green development and increase their spillover effects. The southeastern coastal regions should actively play an intermediary role, establishing platforms for environmental project cooperation, the training of green talents, and the trade of ecological products to foster positive interactions between regions. The southwestern regions should continue to strengthen their linkage role, enhancing support for provinces with low agricultural green efficiency within net spillover blocks.
(3)
Policies for improving agricultural green efficiency should be tailored to local differences. First, market mechanism reforms should be deepened to invigorate market players, enhance agricultural green technology R&D capabilities, and accelerate the integration and penetration of technology into agriculture. Second, it is essential to ensure a rational labor structure for agricultural green production, further reform the administrative system to remove restrictions and barriers to labor mobility, protect the rights of agricultural migrant populations, and implement administrative incentives to encourage bidirectional labor mobility between urban and rural areas. Finally, an “attributes–relationships”-driven development approach should be fostered, shifting from “neighbor as a burden” to “neighbor as a partner”. This involves understanding the structure of the regional agricultural green spatial association network, expanding the agricultural development industry chain, actively participating in joint prevention and control, and strategically allocating regional agricultural resources.

6.3. Implications

(1)
Theoretical implications: The green development of agriculture is a hot topic in China’s current “three rural issues” (agriculture, rural areas, and farmers), and it is also an important part of China’s sustainable development strategy. Based on a relational perspective, this paper uses “relational data” to explore the spatial correlation in China’s agricultural green efficiency and accurately identify the roles and positions of different regions within the spatial correlation network. In addition, considering the influence of spatial spillover effects, this study uses a scientific spatial econometric model to measure and analyze the factors affecting agricultural green efficiency based on spatial correlation tests. This has significant theoretical implications for exploring incentive policies, clarifying promotion mechanisms and action pathways, and enriching and enhancing connotations for China’s agricultural green development.
(2)
Practical implications: China’s rapid economic growth has come at a significant environmental and resource cost. Conducting academic research on green agriculture in line with the current context is of great practical significance for alleviating the constraints on China’s agricultural resources and environment. Moreover, although green agricultural development cannot be completely separated from the general characteristics of conventional agriculture in many aspects, its unique development requires mechanisms such as technological innovation, financial compensation, and credit guarantees to play a promoting role. Therefore, academic research on green agricultural development can provide new ideas for cultivating new drivers of growth in agriculture.

6.4. Research Shortcomings and Future Perspectives

This paper analyzes the evolution characteristics and influencing factors of the spatial correlation network structure of China’s agricultural green efficiency from the perspective of complex networks, providing a new viewpoint for research on green development in the field of geography. However, there are still some limitations of this study. First, due to space constraints, this paper only analyzes the measurement results of China’s agricultural green efficiency. In the future, this study could be refined by exploring the dynamic correlations and spillover effects of agricultural green efficiency at different spatial scales. Second, the discussion of the driving factors behind the spatial correlation network of China’s agricultural green efficiency in this paper only analyzes their effects and causes, and further research is needed to deepen the understanding of the mechanisms and internal logic of these factors. Third, the spatial clustering patterns of agricultural green efficiency and the transmission mechanisms between regions remain unclear. In future research, cohesive subgroup analysis could be used to identify small group clustering types and reveal the interaction patterns between different spatial network blocks. Finally, this study shows that the spatial correlation network of agricultural green efficiency has a rather hierarchical structure, which requires further optimization. Exploring the optimization model for future network structures based on the evolution trajectory of the spatial correlation networks and the factors influencing spatial heterogeneity is also an important direction for further research.

Author Contributions

Conceptualization, J.Y.; methodology, Y.S.; software, J.Y.; validation, Y.S.; formal analysis, J.Y.; investigation, J.Y.; resources, J.Y.; data curation, Y.S.; writing—original draft preparation, J.Y.; writing—review and editing, J.Y. and Y.S.; visualization, J.Y.; supervision, F.W.; project administration, F.W.; funding acquisition, F.W. All authors have read and agreed to the published version of the manuscript.

Funding

This research was funded by the General Project of Shaanxi Province Soft Science Research Plan, grant number 2024ZC-YBXM-195, and the Basic Research Business Fund for Humanities and Social Sciences Project at Northwest A&F University, grant number 2452024328, and the APC was funded by the General Project of Shaanxi Province Soft Science Research Plan, grant number 2024ZC-YBXM-195.

Institutional Review Board Statement

Not applicable.

Data Availability Statement

This paper analyzes publicly available datasets. These data can be found here: https://data.cnki.net/ (accessed on 20 July 2024). https://www.stats.gov.cn/ (accessed on 17 July 2022).

Conflicts of Interest

The authors declare no conflicts of interest.

References

  1. Manioudis, M.; Meramveliotakis, G. Broad Strokes towards a Grand Theory in the Analysis of Sustainable Development: A Return to the Classical Political Economy. New Polit. Econ. 2022, 27, 866–878. [Google Scholar] [CrossRef]
  2. Klarin, T. The Concept of Sustainable Development: From Its Beginning to the Contemporary Issues. Zagreb Int. Rev. Econ. Bus. 2018, 21, 67–94. [Google Scholar] [CrossRef]
  3. Huang, T.; Xiong, B. Space Comparison of Agricultural Green Growth in Agricultural Modernization: Scale and Quality. Agriculture 2022, 12, 1067. [Google Scholar] [CrossRef]
  4. Song, H.; Jiang, F. Connotative Characteristics, Key Tasks and Key Initiatives of an Agricultural Power. Issues Agric. Econ. 2023, 44, 18–29. [Google Scholar] [CrossRef]
  5. Jin, S.; Zhang, Z.; Hu, Y.; Du, Z. Historical Logic, Theoretical Interpretation, and Practical Exploration of China’s Agricultural Green Transformation. Issues Agric. Econ. 2024, 45, 4–19. [Google Scholar] [CrossRef]
  6. Zhang, Y.; Yuan, J.; Huang, H. Historical Evolution, Theoretical Logic and Advancing Path of Agricultural Power with Chinese Characteristics. Issues Agric. Econ. 2023, 44, 4–16. [Google Scholar] [CrossRef]
  7. Michaud, K.; Carlisle, J.E.; Smith, E.R.A.N. Nimbyism vs. Environmentalism in Attitudes toward Energy Development. Environ. Polit. 2008, 17, 20–39. [Google Scholar] [CrossRef]
  8. Huang, X.; Yang, D.L. NIMBYism, Waste Incineration, and Environmental Governance in China. China Inf. 2020, 34, 342–360. [Google Scholar] [CrossRef]
  9. Safley, M. How Traditional Agriculture Is Approaching Sustainability. Biomass Bioenergy 1998, 14, 329–332. [Google Scholar] [CrossRef]
  10. Hawkins, T. Rereading Silent Spring. Environ. Health Perspect. 1994, 102, 536–537. [Google Scholar] [CrossRef]
  11. Zhang, Q.; Qu, Y.; Zhan, L. Great Transition and New Pattern: Agriculture and Rural Area Green Development and Its Coordinated Relationship with Economic Growth in China. J. Environ. Manag. 2023, 344, 118563. [Google Scholar] [CrossRef] [PubMed]
  12. Zhang, K.; Tian, Y. Research on the Spatio-Temporal Coupling Relationship between Agricultural Green Development Efficiency and Food Security System in China. Heliyon 2024, 10, e31893. [Google Scholar] [CrossRef]
  13. Dabkiene, V.; Balezentis, T.; Streimikiene, D. Development of Agri-Environmental Footprint Indicator Using the FADN Data: Tracking Development of Sustainable Agricultural Development in Eastern Europe. Sustain. Prod. Consump. 2021, 27, 2121–2133. [Google Scholar] [CrossRef]
  14. Xin, L.; An, X. Construction and Empirical Analysis of Agricultural High-quality Construction and Empirical Analysis of Agricultural High-quality Development Evaluation System in China. Econ. Rev. J. 2019, 35, 109–118. [Google Scholar] [CrossRef]
  15. Li, G.; Tang, D.; Boamah, V.; Pan, Z. Evaluation and Influencing Factors of Agricultural Green Efficiency in Jianghuai Ecological Economic Zone. Sustainability 2022, 14, 30. [Google Scholar] [CrossRef]
  16. Liu, Y.; Lu, C.; Chen, X. Dynamic Analysis of Agricultural Green Development Efficiency in China: Spatiotemporal Evolution and Influencing Factors. J. Arid Land 2023, 15, 127–144. [Google Scholar] [CrossRef]
  17. Bao, H.; Liu, X.; Xu, X.; Shan, L.; Ma, Y.; Qu, X.; He, X. Spatial-Temporal Evolution and Convergence Analysis of Agricultural Green Total Factor Productivity-Evidence from the Yangtze River Delta Region of China. PLoS ONE 2023, 18, e0271642. [Google Scholar] [CrossRef]
  18. Lu, W.; Guo, X.; Liu, W.; Du, R.; Chi, S.; Zhou, B. Spatial-Temporal Dynamic Evolution and Influencing Factors of Green Efficiency of Agricultural Water Use in the Yellow River Basin, China. Water 2023, 15, 143. [Google Scholar] [CrossRef]
  19. Duman, Z.; Mao, X.; Cai, B.; Zhang, Q.; Chen, Y.; Gao, Y.; Guo, Z. Exploring the Spatiotemporal Pattern Evolution of Carbon Emissions and Air Pollution in Chinese Cities. J. Environ. Manag. 2023, 345, 118870. [Google Scholar] [CrossRef]
  20. Lin, Q.; Bai, S.; Qi, R. Cultivated Land Green Use Efficiency and Its Influencing Factors: A Case Study of 39 Cities in the Yangtze River Basin of China. Sustainability 2024, 16, 29. [Google Scholar] [CrossRef]
  21. Wang, R.; Feng, Y. Research on China’s Agricultural Carbon Emission Efficiency Evaluation and Regional Differentiation Based on DEA and Theil Models. Int. J. Environ. Sci. Technol. 2021, 18, 1453–1464. [Google Scholar] [CrossRef]
  22. Chen, Y.; Fu, W.; Wang, J. Evaluation and Influencing Factors of China’s Agricultural Productivity from the Perspective of Environmental Constraints. Sustainability 2022, 14, 2807. [Google Scholar] [CrossRef]
  23. Lei, S.; Yang, X.; Qin, J. Does Agricultural Factor Misallocation Hinder Agricultural Green Production Efficiency? Evidence from China. Sci. Total Environ. 2023, 891, 164466. [Google Scholar] [CrossRef]
  24. He, W.; Li, E.; Cui, Z. Evaluation and Influence Factor of Green Efficiency of China’s Agricultural Innovation from the Perspective of Technical Transformation. Chin. Geogr. Sci. 2021, 31, 313–328. [Google Scholar] [CrossRef]
  25. Tone, K. A Slacks-Based Measure of Efficiency in Data Envelopment Analysis. Eur. J. Oper. Res. 2001, 130, 498–509. [Google Scholar] [CrossRef]
  26. Pastor, J.T.; Lovell, C.A.K. A Global Malmquist Productivity Index. Econ. Lett. 2005, 88, 266–271. [Google Scholar] [CrossRef]
  27. Zhang, M.; Weng, A. Spatial correlation network and its formation mechanism of urban water utilization efficiency in the Yangtze River Economic Belt. Acta Geogr. Sin. 2022, 77, 2353–2373. [Google Scholar]
  28. Zhi, Y.; Zhang, F.; Wang, H.; Qin, T.; Tong, J.; Wang, T.; Wang, Z.; Kang, J.; Fang, Z. Agricultural Water Use Efficiency: Is There Any Spatial Correlation between Different Regions? Land 2022, 11, 77. [Google Scholar] [CrossRef]
  29. Qu, J.; Han, J.; Liu, L.; Xu, L.; Li, H.; Fan, Y. Inter-Provincial Correlations of Agricultural GHG Emissions in China Based on Social Network Analysis Methods. China Agric. Econ. Rev. 2021, 13, 167–184. [Google Scholar] [CrossRef]
  30. Li, M.; Xiao, H.; Pan, Z. Spatial Correlation Network Structure of Carbon Productivity from the Livestock Sector in China and Its Driving Factors: A Perspective of Social Network Analysis. Glob. Nest. J. 2024, 26, 06125. [Google Scholar]
  31. Gao, Y.; Gao, M. Spatial Correlation Network of Municipal Solid Waste Carbon Emissions and Its Influencing Factors in China. Environ. Impact Assess. Rev. 2024, 106, 107490. [Google Scholar] [CrossRef]
  32. Gu, Y.; Qi, C.; He, Y.; Liu, F.; Luo, B. Spatial Correlation Network Structure of and Factors Influencing Technological Progress in Citrus-Producing Regions in China. Agriculture 2023, 13, 2118. [Google Scholar] [CrossRef]
  33. Yang, C.; Liu, S. Spatial Correlation Analysis of Low-Carbon Innovation: A Case Study of Manufacturing Patents in China. J. Clean. Prod. 2020, 273, 122893. [Google Scholar] [CrossRef]
  34. Yang, J.; Luo, P. Study on the Spatial Correlation Network Structure of Agricultural Carbon Emission Efficiency in China. Electron. Res. Arch. 2023, 31, 7256–7283. [Google Scholar] [CrossRef]
  35. Li, Z.; Yu, K.; Zhong, J.; Yang, J.; Zhang, D.; Zhu, J. Spatial Correlation Network Characteristics and Influencing Factors of Water Environmental Efficiency in Three Major Urban Agglomerations in the Yangtze River Basin, China. Sustain. Cities Soc. 2024, 104, 105311. [Google Scholar] [CrossRef]
  36. Li, B.; Li, J.; Liu, C.; Yao, X.; Dong, J.; Xia, M. Provincial Inclusive Green Growth Efficiency in China: Spatial Correlation Network Investigation and Its Influence Factors. Land 2023, 12, 692. [Google Scholar] [CrossRef]
  37. Qian, X.; Wang, Y.; Zhang, G. The Spatial Correlation Network of Capital Flows in China: Evidence from China’s High-Value Payment System. China Econ. Rev. 2018, 50, 175–186. [Google Scholar] [CrossRef]
  38. Wang, F.; Wu, L.; Zhang, F. Network Structure and Influencing Factors of Agricultural Science and Technology Innovation Spatial Correlation Network-A Study Based on Data from 30 Provinces in China. Symmetry 2020, 12, 1773. [Google Scholar] [CrossRef]
  39. Wang, Z.; Wang, X.; Liang, L. Green Economic Efficiency in the Yangtze River Delta: Spatiotemporal Evolution and Influencing Factors. Ecosyst. Health Sustain. 2019, 5, 20–35. [Google Scholar] [CrossRef]
  40. Hamid, S.; Wang, Q.; Wang, K. The Spatiotemporal Dynamic Evolution and Influencing Factors of Agricultural Green Total Factor Productivity in Southeast Asia (ASEAN-6). Environ. Dev. Sustain. 2023, 25, 1–25. [Google Scholar] [CrossRef]
  41. Xu, R.; Gao, J. Evolutionary Trends, Regional Differences and Influencing Factors of the Green Efficiency of Agricultural Water Use in China Based on WF-GTWR Model. Int. J. Environ. Res. Public Health 2023, 20, 1946. [Google Scholar] [CrossRef] [PubMed]
  42. Zhu, Y.; Hou, H.; Zhang, M.; Hou, S. Analysis of Spatial Correlation Characteristics and Key Factors of Regional Environmental Governance Efficiency in China. Environ. Dev. Sustain. 2023, 25, 1–28. [Google Scholar] [CrossRef]
  43. Song, Y.; Sun, X.; Xia, P.; Cui, Z.; Zhao, X. Research on the Spatiotemporal Evolution and Influencing Factors of Green Economic Efficiency in the Yangtze River Economic Belt. Environ. Sci. Pollut. Res. 2022, 29, 68257–68268. [Google Scholar] [CrossRef] [PubMed]
  44. Anselin, L. Spatial Econometrics: Methods and Models; Kluwer Academic Publishers: Hague, The Netherlands, 1988. [Google Scholar]
  45. Yu, Y.; Chi, Z.; Yu, Y.; Zhao, J.; Peng, L. Boosting Agricultural Green Development: Does Socialized Service Matter? PLoS ONE 2024, 19, e0306055. [Google Scholar] [CrossRef]
  46. Yao, P.; Li, H. Can Agricultural Water Rights Trade Promote Agricultural Green Development? Chin. Rural Econ. 2023, 39, 17–40. [Google Scholar] [CrossRef]
  47. Jiang, C. The Agricultural New Quality Productive Forces: Connotations, Development Priorities, Constraints and Policy Recommendations for the Development. J. Nanjing Agric. Univ. Soc. Sci. Ed. 2024, 24, 1–17. [Google Scholar] [CrossRef]
Figure 1. The distribution of the agricultural green efficiency by province in 2000–2001, 2007–2008, 2014–2015, and 2021–2022.
Agriculture 14 01628 g001
Figure 2. Spatial correlation network of China’s agriculture green efficiency in 2000 and 2022. (a) 2000. (b) 2022.
Agriculture 14 01628 g002
Figure 3. Structural characteristics of the overall network of China’s agricultural green efficiency from 2000 to 2022.
Agriculture 14 01628 g003
Figure 4. The interactive relationship between the four plates of the spatial correlation network of China’s agricultural green efficiency. (The blue font represents the number of spillover relationships between blocks).
Agriculture 14 01628 g004
Table 1. Analysis of individual network centrality of Chinese agricultural green efficiency in 2000 and 2022.
Areas20002022
DoDiCRDCRPCRBDoDiCRDCRPCRB
Beijing62583.33385.71410.25942686.66788.2359.201
Tianjin72380.00083.3336.57521653.33368.1820.322
Hebei3210.00052.6320.1672723.33356.6040.197
Shanxi3210.00052.6320.1675220.00055.5562.653
Inner Mongolia3210.00052.6320.15426.66757.6920.782
Liaoning4113.33353.5710.0004116.66754.5450.000
Jilin4113.33353.5710.0005016.66754.5450.000
Heilongjiang3010.00052.6320.0005016.66754.5450.000
Shanghai42996.66796.77419.77372793.33393.75010.873
Jiangsu1310.00052.6320.00062483.33385.7148.413
Zhejiang31550.00066.6672.43751553.33368.1821.597
Anhui4420.00055.5561.6835416.66754.5451.954
Fujian4523.33356.6041.46671760.00071.4299.702
Jiangxi5416.66754.54515.8506520.00055.5566.718
Shandong3210.00052.6320.1675316.66754.5452.755
Henan5216.66754.5450.6607730.00058.8245.583
Hubei4013.33353.5710.0008633.33360.0001.920
Hunan6220.00055.5561.0419633.33360.0000.893
Guangdong71143.33363.83015.7958733.33360.0005.423
Guangxi6223.33356.6040.3429633.33360.0003.529
Hainan7123.33356.6040.1797123.33356.6040.038
Chongqing6120.00055.5560.0008740.00062.5004.374
Sichuan5016.66754.5450.0009130.00058.8240.129
Guizhou7326.66757.6923.7909736.66761.2244.046
Yunnan6020.00055.5560.0009030.00058.8240.000
Shaanxi5016.66754.5450.0007126.66757.6920.095
Gansu3113.33353.5710.00010236.66761.2240.805
Qinghai5016.66754.5450.0009130.00058.8240.000
Ningxia3010.00052.6320.0006120.00055.5560.757
Xizang5120.00055.5560.7479030.00058.8240.000
Xinjiang5016.66754.5450.0007023.33356.6040.000
Note: Do, Di, CRD, CRP, and CRB represent out-degree, in-degree, degree, closeness, and betweenness centrality, respectively.
Table 2. Analysis of spillover effects of spatially correlated plates.
PlateMatrix of Receiving
Relationships
Number of
Spillover
Relationships Outside the Plate
Number of
Receiving
Relationships Outside the Plate
Proportion of
Expected Internal Relationships
Proportion of Actual Internal RelationshipsType of Plate Role
IIIΙΙΙΙV
I61116189113.33%25.00%Net benefit
II112023345013.33%5.56%Broker
ΙΙΙ501572671136.67%9.46%Net spillover
ΙV303406643126.67%8.57%Bidirectional overflow
Table 3. Density matrix and image matrix of Chinese agricultural green efficiency.
PlateDensity MatrixImage Matrix
IIIIIIIVIIIIIIIV
I0.3000.040.1830.1331000
II0.4400.10.0000.5111001
III0.8330.2500.0530.0191100
IV0.6670.7560.0000.0831100
Table 4. Spatial panel regression model test.
TestStatisticsTestStatistics
LM (error) test156.028 ***Moran’s I lag3.006 ***
Robust LM (error) test148.589 ***LR (sdm sar) test59.26 ***
LM (lag) test9.545 ***Wald’s (sdm sar) test61.49 ***
Robust LM (lag) test2.107LR (sdm sem) test62.00 ***
Hausman test100.02 ***Wald’s (sdm sem) test63.77 ***
Note: *** denote statistical significance at the 1% significance levels.
Table 5. Estimation results of the spatial econometrics model.
VariableSLMSEMSDM
Fixed EffectsRandom EffectsFixed EffectsRandom EffectsFixed EffectsRandom Effects
PI0.0005
(0.0010)
0.0018 **
(0.0009)
0.0006
(0.0010)
0.0021 **
(0.0009)
−0.0016
(0.0011)
0.0003
(0.0010)
HC3.0059 ***
(0.9470)
1.6828 **
(0.7815)
3.0642 ***
(0.9488)
1.9496 **
(0.8480)
4.1853 ***
(0.9394)
2.9027 ***
(0.8598)
LF−0.0612 ***
(0.0202)
−0.0166 *
(0.0097)
−0.0570 ***
(0.0209)
−0.0217 **
(0.0106)
−0.0256
(0.0202)
0.0211
(0.013)
OD0.0057
(0.0172)
0.0200
(0.0138)
0.0037
(0.0176)
0.0042
(0.0148)
0.0025
(0.0181)
0.0333 **
(0.0168)
RD0.0332 *
(0.0100)
0.0130
(0.0089)
0.0288 ***
(0.0106)
0.0089
(0.0094)
0.0144
(0.0097)
0.0103
(0.0095)
ED−0.0267 *
(0.0158)
−0.0513 ***
(0.0090)
−0.0278 *
(0.0164)
−0.0605 ***
(0.0111)
−0.0447 **
(0.0179)
−0.0322 *
(0.0170)
NQ−0.0246 **
(0.0114)
0.0376 ***
(0.0047)
−0.0237 **
(0.0114)
0.0510 ***
(0.0054)
−0.0244 **
(0.0118)
0.0009
(0.0099)
_cons 1.0919 ***
(0.1459)
1.4670 ***
(0.1503)
2.7824 ***
(0.2854)
ρ0.2068 ***
(0.0514)
0.3388 ***
(0.0446)
0.1092 **
(0.0542)
0.2296 ***
(0.0488)
lambda 0.1793 ***
(0.0554)
0.3000 ***
(0.0576)
W*PI −0.0102 ***
(0.0025)
−0.0057 ***
(0.0018)
W*HC −1.9504
(2.0169)
−4.0949 ***
(1.4524)
W*LF −0.1448 ***
(0.0423)
−0.1416 ***
(0.0224)
W*OD 0.0287
(0.0167)
0.0465 *
(0.0250)
W*RD 0.1259 ***
(0.0196)
0.0657 ***
(0.0172)
W*ED −0.0233
(0.0322)
−0.0671 ***
(0.0203)
W*NQ −0.0156
(0.0251)
0.0535 ***
(0.0108)
N713713713713713713
R20.31030.57670.29720.55560.24060.6352
Note: ***, **, and * denote statistical significance at the 1%, 5%, and 10% significance levels. The standard errors are given in the parentheses.
Disclaimer/Publisher’s Note: The statements, opinions and data contained in all publications are solely those of the individual author(s) and contributor(s) and not of MDPI and/or the editor(s). MDPI and/or the editor(s) disclaim responsibility for any injury to people or property resulting from any ideas, methods, instructions or products referred to in the content.

