1. Introduction
From 23 to 29 March 2021, the
Ever Given containership blocked the Suez Canal, as shown in
Figure 1. This blockage caused 369 ships to queue, and approximately 12% of global trade was delayed. Some vessels were rerouted to avoid the Suez Canal, which added approximately eight days to their total journeys and considerable additional fuel costs. The direct economic cost was over USD 10 billion, and the continuous cost is expected to exceed USD 100 billion [
1]. This disastrous event reminds the public of the closure of the Suez Canal after the 1967 Six-Day War. During the closure period of 1967–1975, ships sailing between Europe and Asia had to take the much longer route around the Cape of Good Hope. Research shows that this increase in sea distance had marked negative impacts on world trade [
2]. The
Ever Given incident highlights once more the necessity of developing an alternative sea route to the Suez Canal, which must have competitive voyage-related costs.
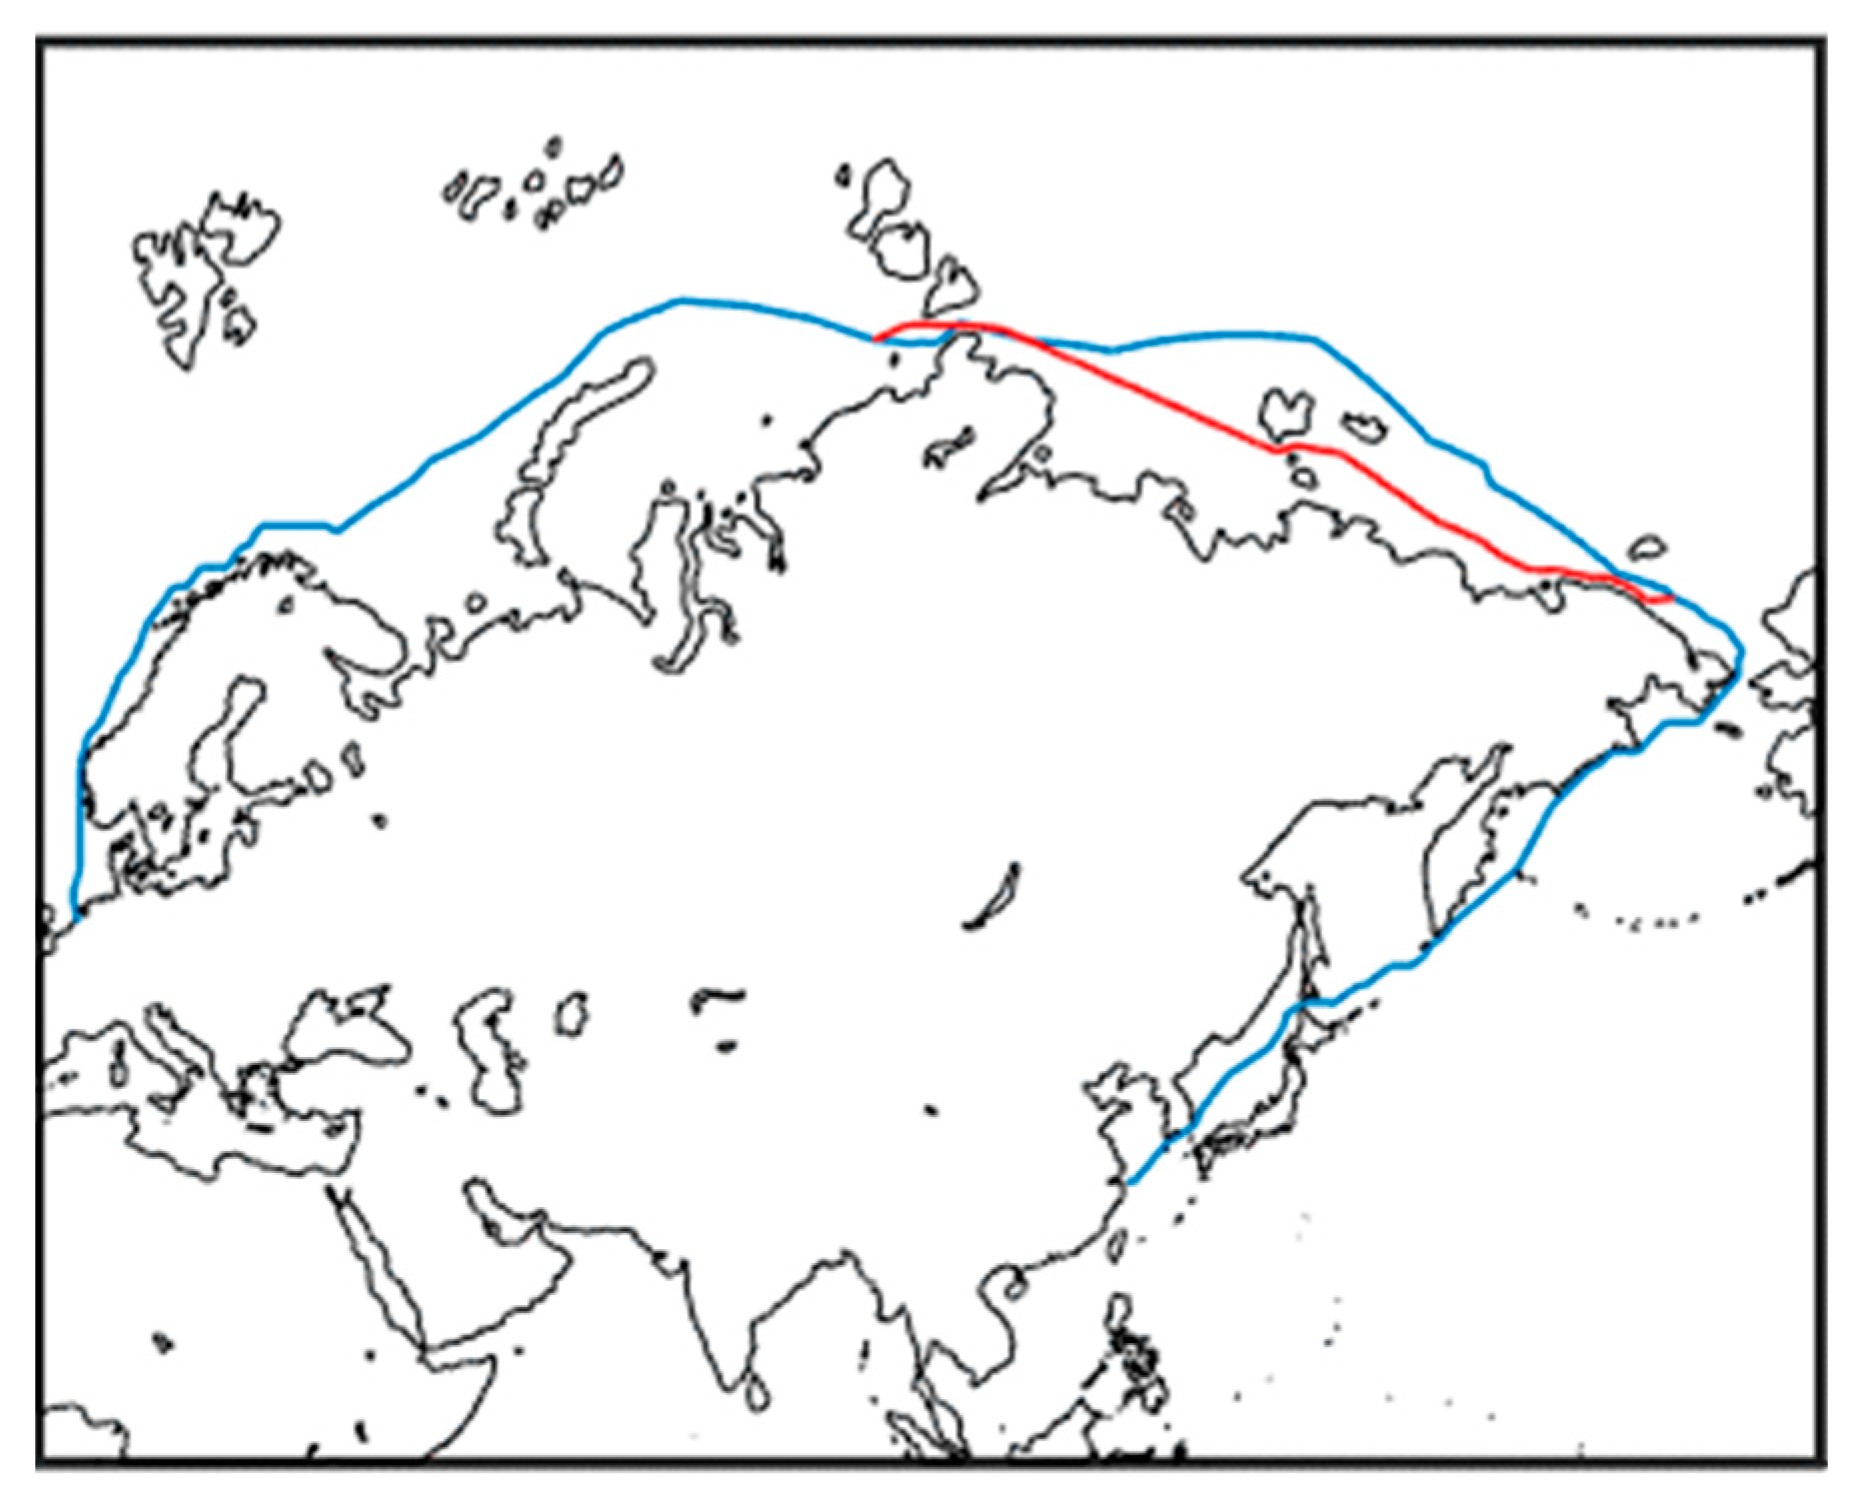
The Northern Sea Route (NSR) that passes through the Arctic Sea is now a promising candidate for such an alternative route [
3]. As a consequence of climate change, the NSR, which was previously covered by ice year-round, is already navigable for commercial vessels for over 100 days per year, and this number is still increasing [
4,
5]. The NSR has approximately 40% shorter lengths between major ports in Europe and Asia compared to the Suez Canal Route (SCR). However, the shorter distance by itself is not sufficiently attractive for ship owners. In 2019–2021, a total of 37, 64, and 85 transit voyages were conducted through the NSR, respectively [
6]. For the same years, approximately 18–20,000 ships passed through the SCR [
7], or an average of 50~55 passages per day. These passages can hardly be explained by the limited navigation season of the NSR, which is between four and five months [
4]. Instead, these passages are an indication that the majority of shipping companies are skeptical about the overall cost competitiveness of the NSR.
Many studies of the economic feasibility of the NSR compared to the SCR have been published in recent years. Some researchers have investigated the advantages and challenges of the NSR. Some studies have examined the cost competitiveness of the NSR relative to conventional shipping routes; see, e.g., Zhang et al. [
8], Liu and Kronbak [
9], and Xu et al. [
10]. Other researchers have investigated shipowners’ intentions through surveys to complement academic perspectives; see, e.g., Lasserre [
11], Lee and Kim [
12], and Lambert et al. [
13]. The majority of existing literature claims economic feasibility for the NSR, at least for bulk and specialized cargo vessels. This result is nevertheless contradictory to the fact that most shipping companies are currently still reluctant to send their vessels through the Arctic. There might also be environmental or political concerns behind shipowners’ route choices. However, it is more likely that shipping companies have not yet been convinced of the economic advantages of the Arctic alternative routes, despite the unambiguous conclusions of existing research.
Theocharis et al. [
14] conducted a systematic literature review of comparative studies regarding Arctic shipping. A total of 33 articles on this topic from 1980 to 2017 were reviewed, all published in respected international scientific journals. Most of these studies were based on analytical research methods and transport cost models. This review also shows that many of these studies relied on statistical data and empirical scenarios instead of real-life cases and collected data on Arctic transit. Such analytical methodologies are often associated with large assumptions based on historical observations and have not considered the dramatic change in Arctic ice conditions in recent years (e.g., from level ice to floe ice). The tools used in these studies generally used cost–benefit analysis, which is not sufficiently sophisticated to quantify uncertainties related to Arctic shipping. Shipowners need a better voyage planning tool based on advanced weather forecasting systems and high-fidelity numerical models to provide more trustworthy cost–benefit analyses to adequately consider Arctic route options.
The uncertainties associated with Arctic sailing are manifold. The first category of uncertainties comes from sea ice prediction. A few recent Arctic shipping studies emphasize future Arctic ice variation and navigation season forecasting [
3,
15]. However, this sort of strategic forecast barely benefits tactical ship operations in Arctic waters because the spatial distribution of Arctic ice differs markedly from year to year, resulting in large errors in seasonal forecasts [
16]. In addition, the primary NSR region coincides with the marginal ice zone, where wind and current may drive ice to move fast. Ice conditions along the summer NSR are, thus, particularly dynamic, which makes ice forecasting a challenging task. On this shorter time scale (1–7 days ahead), there are fewer available studies on the performance and comparison of existing operational sea ice forecast models [
17]. However, there are efforts to routinely monitor the forecast performance of some existing forecasts, such as in Melsom et al. [
18]. Based on the current research, the primary limitations of the existing forecasting systems concern the use of sea ice observations for forecast initialization, spatial resolution, the improvements to data assimilation schemes, and the widespread provision of ensembles and retrospective forecasts to calibrate forecasts and robustly assess their skill.
The other uncertainties related to summer Arctic ice rely on multiyear ice being encountered in NSR waters [
19]. Multiyear ice is much more difficult and might damage a ship’s hull and propeller. How to incorporate dynamic ice forecast data into decision-making tools and how to manage the risk of multiyear ice is another challenging task for NSR operations.
Ship speed when ice is encountered is another major source of uncertainties. The NSR transit time is determined by the vessel’s speed through the ice, which in turn affects the ship’s ETA. Fuel consumption in ice also depends on ship speed, in addition to encountered ice conditions and hull/engine features. The importance of ship speed in Arctic shipping has been considered by some authors, such as Faury and Cariou [
20] and Theocharis et al. [
21]. However, ship speeds in the literature are either based on statistical data or directly obtained from empirical formulae. Statistical data can hardly be applied to predict the speed of individual ships. Although ice-induced resistance has been included in the empirical formulae, considerable model uncertainties will occur when the formulae are applied to specific vessels. Additional uncertainties are introduced if nonrealistic ice conditions and other environmental factors are assumed, as presented by most of the case studies mentioned in the literature. Regarding fuel consumption, realistic ship performance based on engine system modeling is often neglected, making fuel consumption prediction even more unreliable.
To confirm whether the NSR is profitable, it is essential to quantify ice conditions, predict whether icebreaker assistance is required, and then estimate the costs of the different options. The final decision may vary depending on the season and type of vessel. To achieve this, a holistic system is applied to perform the following coherent required steps.
- (a)
A weather system to provide forecasting of sea states and ice conditions.
- (b)
An Arctic ship performance model accurately calculates ship resistance in different ice conditions and, thus, estimates a ship’s speed and fuel consumption in ice.
- (c)
A voyage planning tool that can identify potential routes with optimization on efficiency and safety, considering scenarios with and without icebreaker assistance, and then use (a) and (b) to provide the estimated voyage time and fuel consumption of all potential routes.
- (d)
A cost analysis procedure based on the abovementioned models to quantify the detailed costs associated with the voyage options.
Li et al. [
22] developed a voyage planning tool (VPT) for maritime operations in the Arctic seas to improve the safety and fuel efficiency of commercial vessels designed primarily for open-water operations. The Arctic VPT is based on high-fidelity models of ship performance in sea ice and metocean forecasts and uses numerical methods to plan routes and optimize the speed in both open and ice-infested seas [
23]. This tool aims to minimize the uncertainties associated with ice navigation and to provide shipowners and captains with a practical decision-support tool for taking Arctic routes. In this study, a holistic approach based on the Arctic VPT is developed to conduct detailed cost–benefit analyses for existing merchant ships to consider the NSR as an alternative to the conventional SCR. Case studies are investigated based on a ship in operation to quantify realistic expenses inclusive of all the major operational, fuel, and voyage costs of the specific voyages. The scope of this study is limited to the Arctic navigation season, or summer/autumn. The target vessels are cargo ships without icebreaking capacity (i.e., ships of lower ice classes up to 1A according to the Finnish–Swedish Ice Class Rule or without any ice strengthening at all). These types of ships are designed primarily for open-water operations and dominate the global cargo fleet. The goal of this study is to demonstrate in a reliable manner whether the NSR is a feasible alternative route to the Suez Canal.
The aim of this work is to apply high-fidelity and accuracy models to compare potential Arctic ship scenarios against contemporary ones. This is the first work that considers ice floe resistance to better evaluate ship total fuel consumption and is also coupled with a novel voyage optimization tool to make sure the predicted route is realistic. The results are expected to provide valuable information for stakeholders to inform the future development of Arctic shipping strategies.
The remainder of this paper is organized as follows.
Section 2 introduces the ice–ocean–weather forecast systems that provide inputs for ship performance simulations. In
Section 3, an integral voyage planning tool is presented that incorporates ship performance modeling and weather systems to provide various options for shipping routes through the NSR and the SCR.
Section 4 presents the case study vessel, the voyage setups, and the simulation results.
Section 5 analyses and discusses the overall cost of the NSR and SCR options, followed by the conclusions and discussions in the last section.
5. Cost Comparison between the NSR and SCR Voyages
In this study, we compare the costs of existing merchant ships traveling the trans-Arctic route with those of the conventional Suez Canal route. The following costs are included in the comparison:
The first three items are typically referred to as operational costs, while the remaining two are referred to as voyage costs. Another cost category (capital costs) is excluded in the total cost calculation because we focus on ships that are already in operation, for which the capital costs can be assumed unchanged for different voyage regions. If future new-build ships with new special designs for Arctic operations are considered, capital costs might differ from those of conventional designs, and the difference in comparison in capital costs thus must be considered. In addition, management costs that are a type of operational cost are also excluded in the comparison because we assume that switching to NSR routes hardly introduces additional administration compared to the SCR routes. Other costs, such as the fees for port calls, are neglected in this study because we assume that they are insignificant for both route options.
5.1. Operational Costs
Operational costs are calculated on an annual basis. The costs of repair and maintenance include those for dry docking, supply, lubricant, spare parts, and all expenses related to the repair of faulty parts. This cost section, as well as the insurance cost, is associated with the price of a newly built ship. For this study, we assume a new-build value of USD 30 million. However, due to the difficulty of obtaining real new-build prices, there may be a difference between the real and the calculated costs of repairs, maintenance, and insurance. However, what we are interested in and comparing in this study are the relative costs between the route options, and therefore, the absolute operational costs are less critical for existing vessels.
According to Otsuka et al. [
45], the annual repair and maintenance costs for SCR routes are set as 1.095% of the new-build price. The harsh conditions in Arctic waters can cause ice–hull confrontation, propeller dysfunction, and negative impacts on engines, which all increase the maintenance and repair costs of a vessel. Thus, after consulting experts at China COSCO Shipping Corp., the corresponding repair and maintenance costs for the NSR option are assumed to be an additional 20%.
Table 6 shows the annual repair and maintenance costs with other operational costs that will be presented in the following paragraphs.
Three types of insurance are applicable during the voyage: Protection and Indemnity (P and I), Hull and Machinery (H and M), and Cargo Insurance. Each insurance component insures a different category of risk. P and I covers protection clauses against third-party liabilities, while H and M protects against damage to the ship itself, its machinery, and equipment. Additionally, cargo insurance solely covers the possible loss of the cargo carried by the ships [
46]. The regular H and M and P and I premiums are estimated as 1.4% and 1.7%, respectively, of the new-build price for the SCR routes and 50% additional for the NSR alternative [
34]. Conversely, risks of piracy and armed guards associated with the Suez Canal passage impose an additional premium on the SCR option. In this study, the additional premium is set at USD 100,000, based on interviews with relevant experts in the shipping industry. Detailed insurance costs are also listed in
Table 6.
The manning costs are primarily determined by the crew’s salary. In this study, the average monthly salary is considered to be USD 5650 per person for operations in ordinary waters and 10% additional in Arctic waters, which is adapted from the estimation of a similar vessel mentioned by Wan et al. [
47]. In addition, according to IMO [
48], maritime operations in Arctic waters need ice training for the crew as a requirement of the Standards for Training, Certification, and Watchkeeping for Seafarers (STCW). According to an accredited maritime training service [
49], the STCW training costs for one ship’s crew are estimated at USD 50,000. This cost is also included in the operational costs in
Table 6.
5.2. Fuel Costs
Fuel costs are the most significant cost component in the total voyage cost. The fuel costs for the representative voyages are calculated from the exact fuel consumption simulated using high-fidelity numerical models.
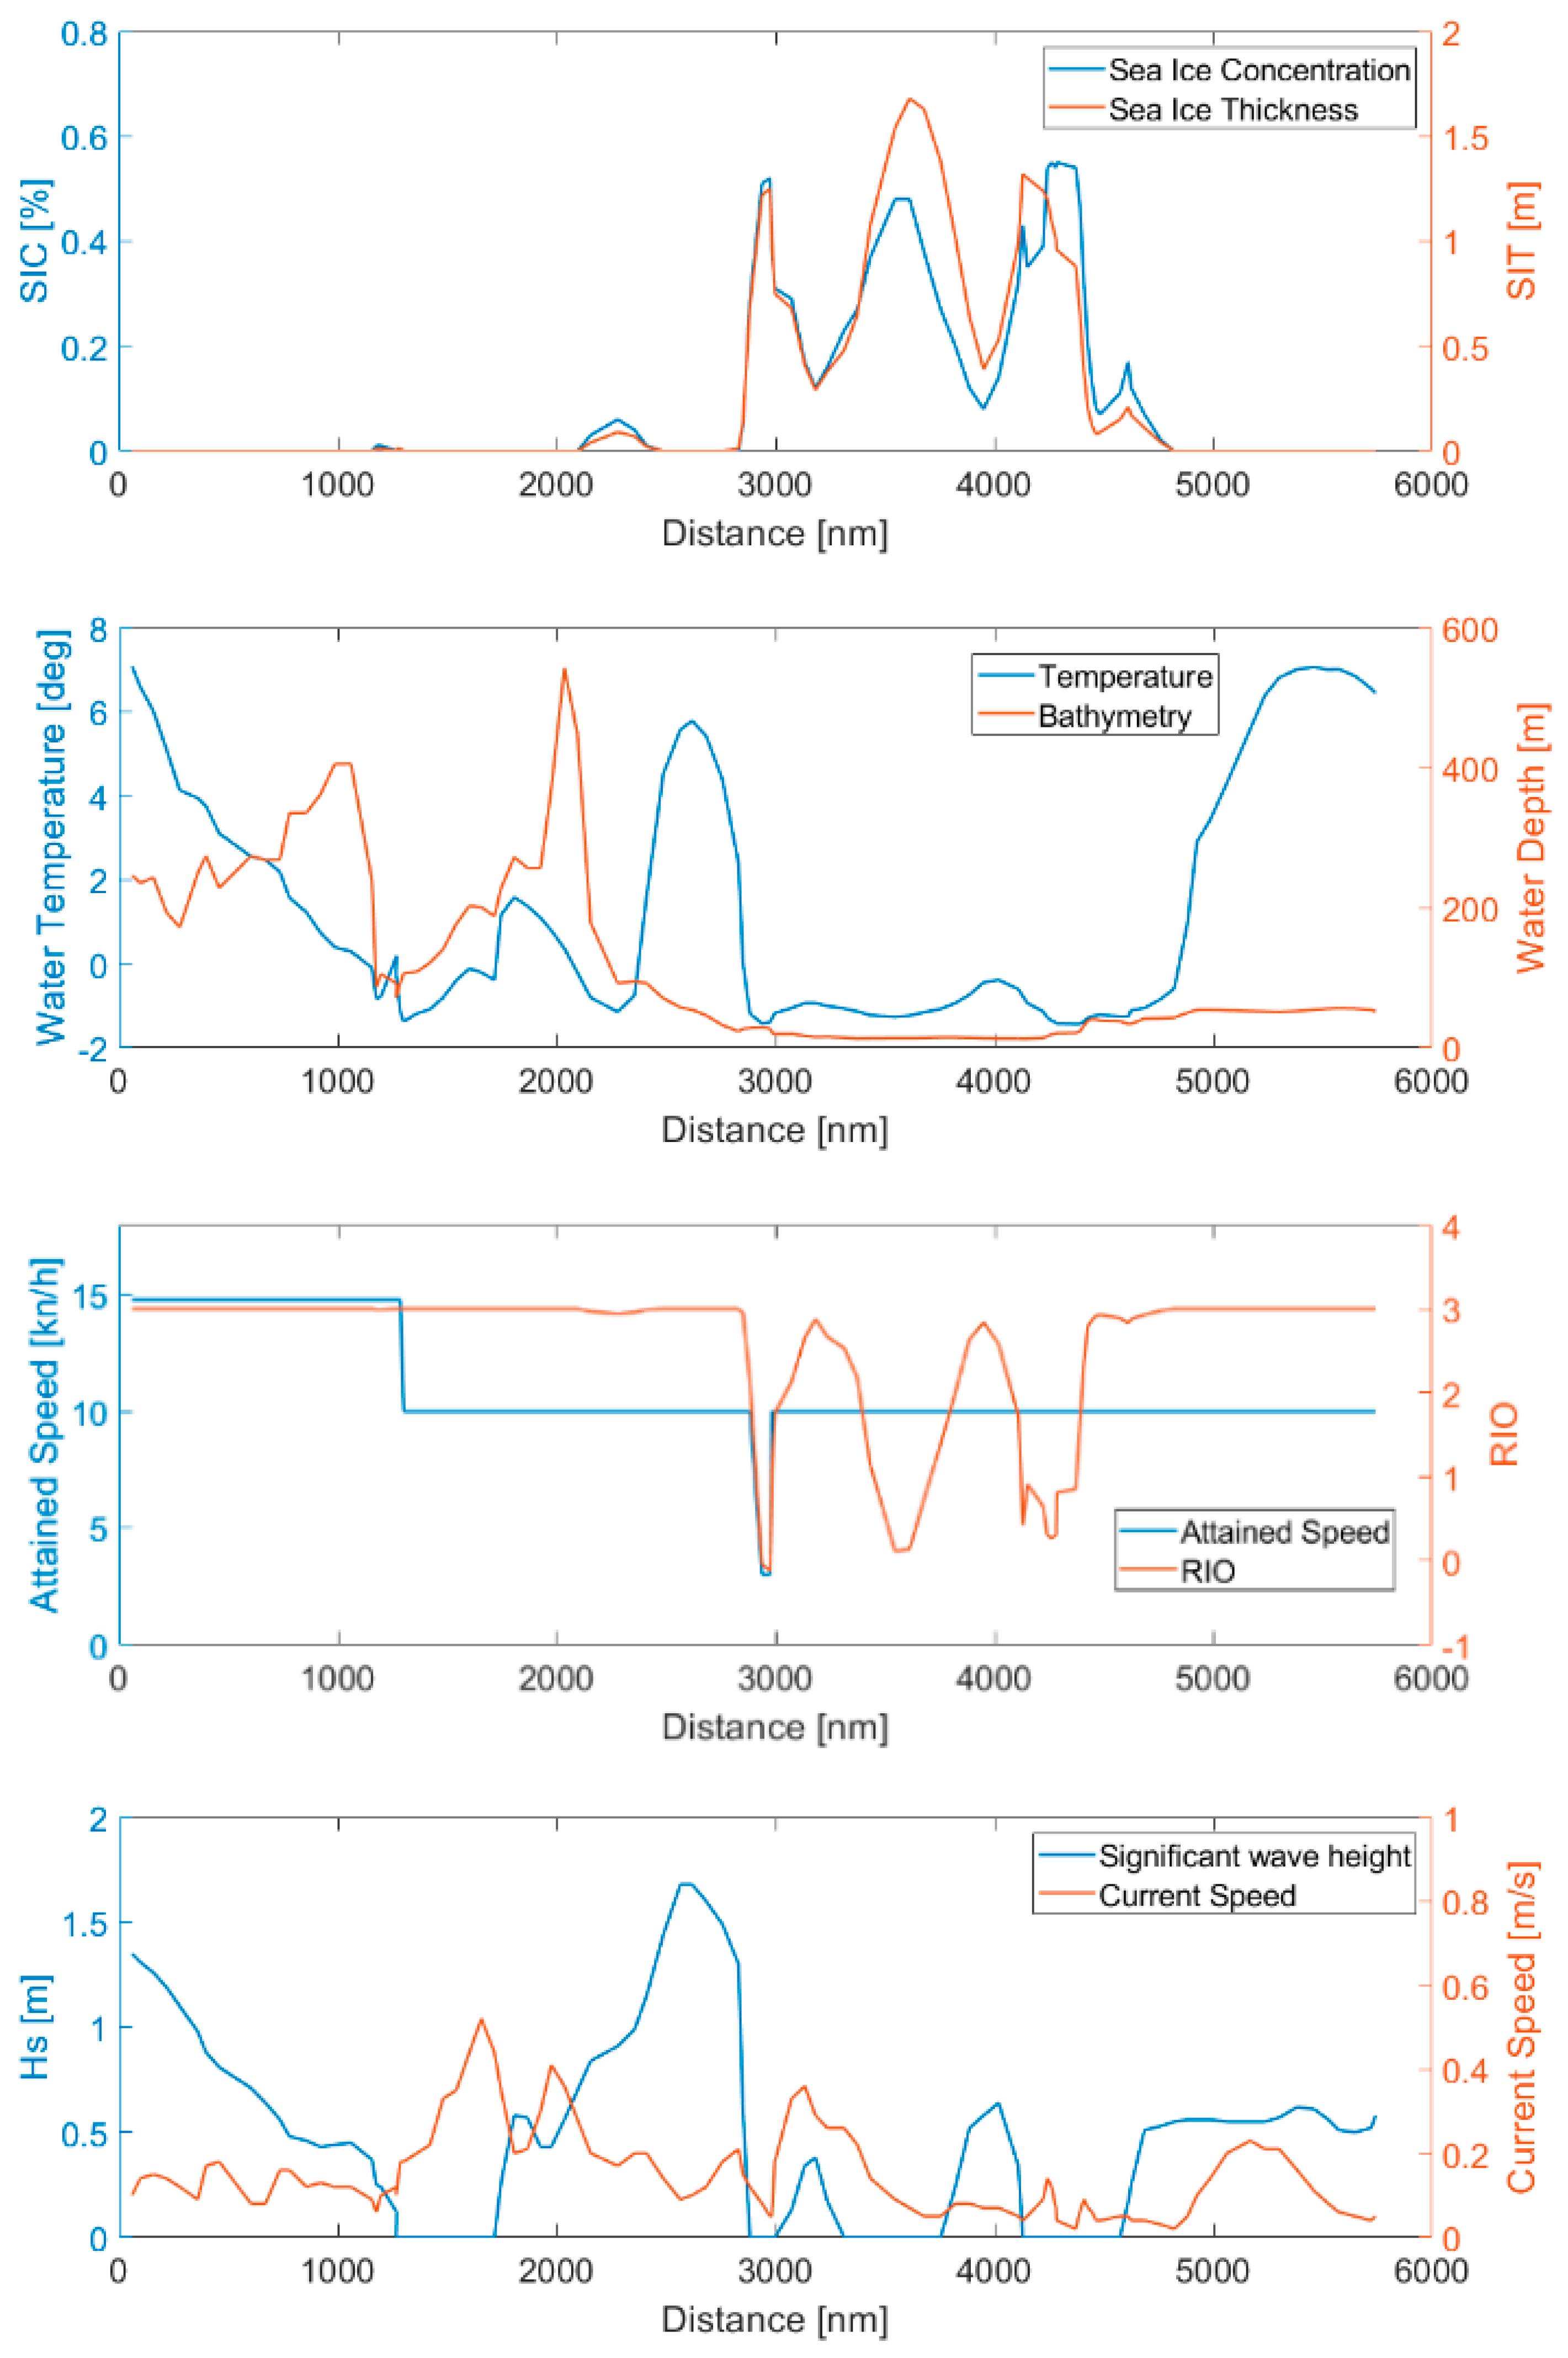
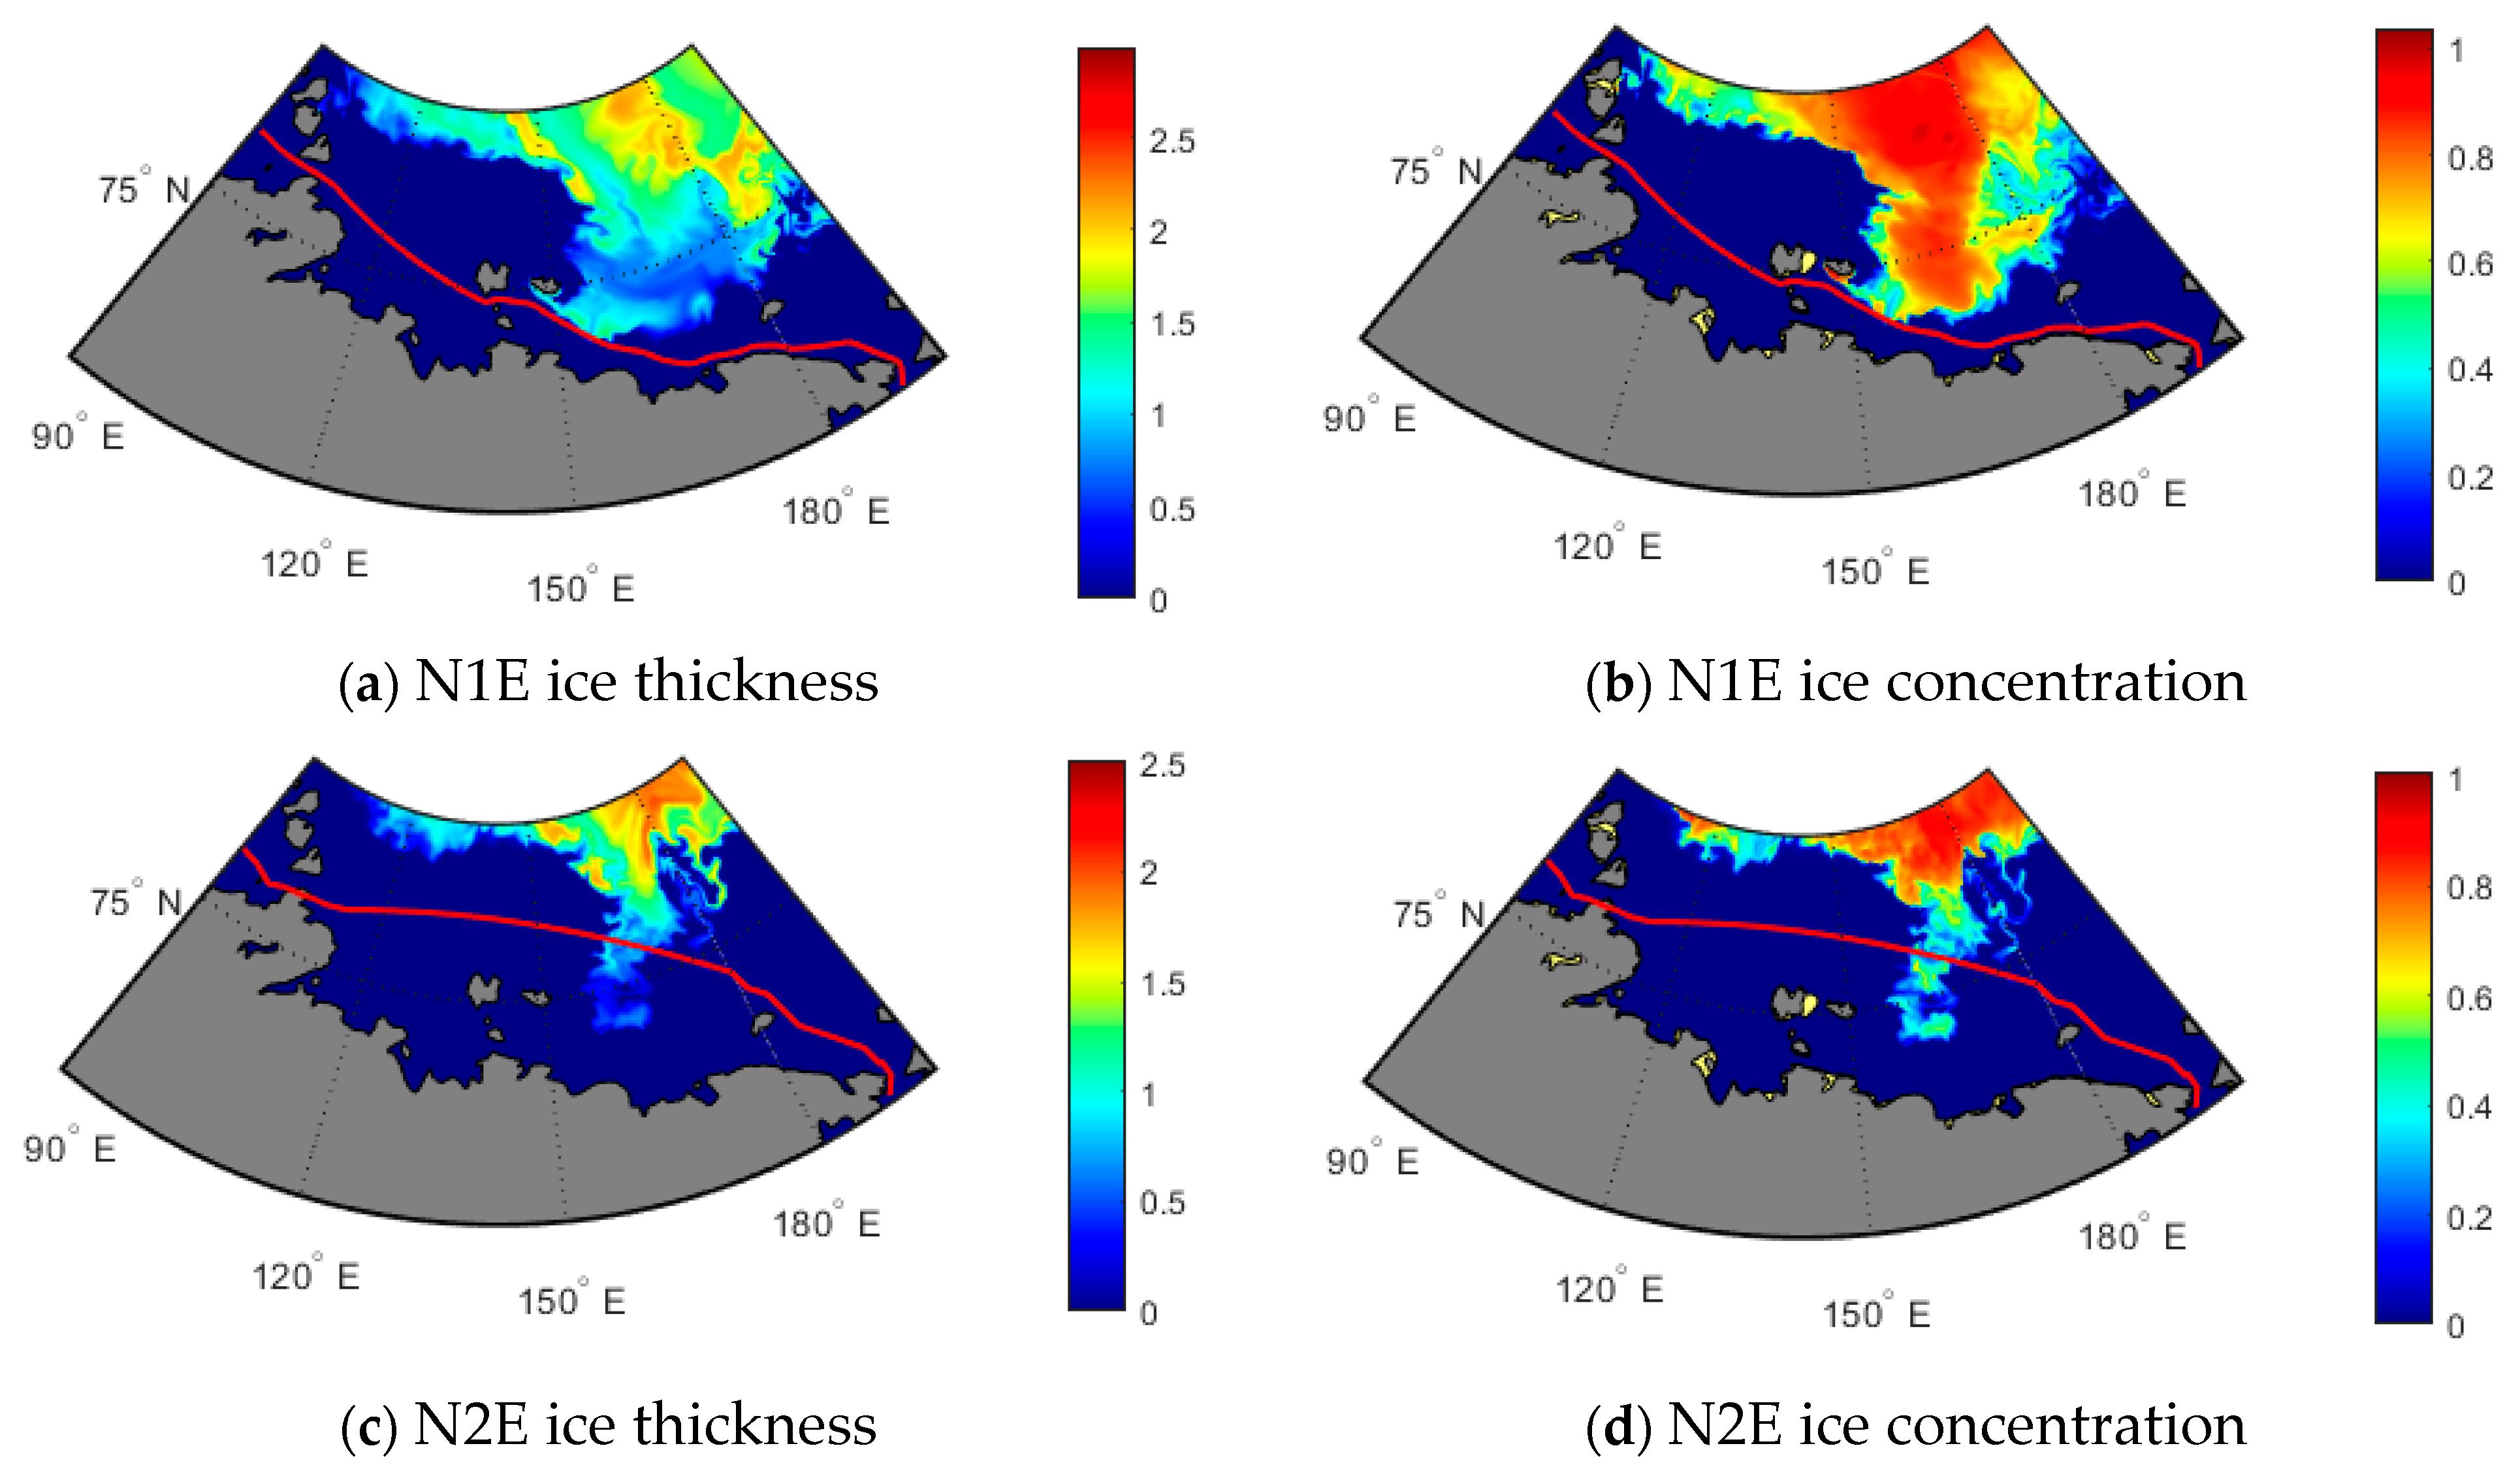
Table 4 shows the total fuel consumption for the NSR and SCR voyages, except for the NSR voyages in July. In
Table 4, the NSR voyages are all independent navigation, which implies that icebreaker assistance is excluded from the simulation. This scenario is realistic for the September trans-Arctic voyage because it is nearly ice-free along the NSR route. In July, in contrast, relatively heavy ice conditions might be encountered, and icebreaker escorts might be mandatory, depending on commercial ships’ ice classes. For the case study vessel, icebreaker assistance appears to be a wise option for July voyages because risks related to Arctic transit can be minimized. Icebreaker assistance also markedly reduces uncertainties in the timing of Arctic transit, leading to secured ETAs for the escorted commercial vessels, which is particularly important for container ships. In this study, we assume that all Arctic voyages in July are assisted by icebreakers and mark these voyages with asterisks, N1E* and N1W*. The fuel consumption of these assisted voyages is specifically calculated and differs from those in
Table 4. The fuel consumption of all voyages is listed in
Table 7.
To reach representative FCs for the specific periods, we average the eastbound and westbound voyages; this is a simplification that allows for better cost comparisons. With the exact FCs, the fuel costs are obtained by multiplying the oil price of USD 459/ton, the global average bunker price of IFO 380 in 2021 (
https://shipandbunker.com/prices/av) (accessed on 10 April 2021). The average voyage FCs and the fuel costs are presented in
Table 7 and
Table 8 with the FCs for the individual voyage. Heavy fuel oil (HFO) is used for both SCR and NSR voyages, which is about to change because the IMO recently approved in its Marine Environment Protection Committee (MEPC) a ban on the use of HFOs and their carriage by ships in Arctic waters after 1 July 2024. [
50]. This change implies that HFOs will be replaced by cleaner fuels and that the fuel costs for future Arctic transit are expected to increase.
5.3. Tariffs and Tolls
Two additional costs must be considered: the icebreaker tariff for the NSR and the canal toll for the SCR. Icebreaker tariffs, also termed “icebreaking fees”, refer to costs associated with icebreaker assistance provided by Atomflot, a Russian company and service base that maintains the world’s only fleet of nuclear-powered icebreakers. According to the Northern Sea Route Administration, only Russian-flagged icebreakers may escort vessels through the Northern Sea Route [
51]. Icebreaking assistance has not been mandatory since 2012 and is solely determined by prevailing sea ice and climatic conditions on the NSR, which implies that certain NSR transits, such as the September voyages of this study, are cost-free. The icebreaking fees depend on the following factors:
Ice class of the assisted ship;
Gross tonnage of the assisted ship;
The season of navigation, which is divided into two categories: summer/autumn and winter/spring;
The number of escorting zones.
There are a total of seven escorting zones along the NSR.
Table 8 lists the numbers, longitudinal limits, and regional descriptions of the escorting zones. In the summer/autumn season, ice conditions are generally mild in the majority of the escorting zones, except for the East Siberian Sea and regions near the Vilkitsky Strait. Because the case study vessel is ice-strengthened, it is anticipated that four escorting zones would be sufficient for severe ice conditions in the summer. For less severe ice conditions, a two-zone option would be more than sufficient. The icebreaker tariffs are estimated for the four-zone and two-zone options from the NSRA website [
52].
Table 9 shows the estimated tariffs per transit.
In contrast to the NSR icebreaking fees, which are payable only when icebreaker assistance is called, all accesses to the Sussex Canal are charged. The toll calculation is more complex than the icebreaker tariffs. According to the Suez Canal Authority [
53], the tolls depend on ship type, beam, and draught, whether the ship is laden or ballast, the special Suez Canal Net Tonnage (SCNT), and are determined by the specific drawing rights (SDR) rates. The tolls are also for the cargo carried. For example, vessels carrying heavy units, floating units, or boxes on deck will typically be charged more than those carrying goods in the cabins. In addition, the tolls might also differ for northbound or southbound passages. It is, thus, difficult to predict the exact toll for each voyage. In this study, an online calculator from Leth Agencies (
https://lethagencies.com/calculator-guidelines) (accessed on 10 April 2021) is used to calculate the canal tolls. It is assumed that the northbound passages are associated with the transportation of heavy/floating units from Asia to Europe, and therefore, a higher tariff applies, while the southbound ships carry “normal” goods from Europe to Asia. The SCNT values are assumed to be half of the vessel deadweights. An SDR of 1.4227 is in use for the currency of USD, which is adapted from the International Monetary Fund [
54]. The calculated Suez Canal tolls are listed in
Table 9 with the abovementioned icebreaker tariffs.
5.4. Total Costs
The total costs of the representative voyages are presented in
Table 10, which shows the sum of the costs related to operations and voyages mentioned in the previous subsections. The voyage times are averaged over the eastbound and westbound voyages and are then converted to days and rounded. The annual operational costs in
Table 6 are then scaled to thousand USD per day and times the days of each representative voyage, resulting in the operational costs per voyage. The fuel costs are the sums listed in
Table 7. The Suez Canal tolls are adapted from
Table 9, averaged from the northbound and southbound passages. The icebreaker tariffs for July Arctic transits are the average of the four-zone and two-zone tariffs listed in
Table 9 and are then converted from RUB to USD with a USD/RUB exchange rate of 73.9064 [
55]. The icebreaker tariffs in
Table 9 are exclusive to VAT. The additional Russian VAT is assumed to be 20% and is added to the total cost calculation shown in
Table 10.
Table 10 shows that the alternative NSR options save 17% in July and 33% in September compared to the traditional routes via the Suez Canal. The total voyage times of the NSR alternatives are shorter compared to the routes via the Suez Canal. Moreover, despite relatively low oil prices, fuel is the largest share and accounts for more than 40% of the total costs being considered. We, thus, conclude that the NSR alternative is economically more favorable than the Suez Canal option for the investigated vessel.


 ,
, 


