Article

Experimental Investigation of Wave Propagation and Overtopping over Seawalls on a Reef Flat

1
Ocean College, Zhejiang University, Zhoushan 316021, China
2
Hainan Institute, Zhejiang University, Sanya 572025, China
*
Author to whom correspondence should be addressed.
J. Mar. Sci. Eng. 2023, 11(4), 836; https://doi.org/10.3390/jmse11040836
Submission received: 10 March 2023 / Revised: 7 April 2023 / Accepted: 10 April 2023 / Published: 15 April 2023
(This article belongs to the Section Ocean Engineering)

Abstract

:
A series of physical model tests were performed to investigate the wave propagation, pressure, and wave overtopping processes for vertical and sloped seawalls on the reef flat. For both regular and irregular waves, the effects of incident wave height, wave period, relative distance, fore reef slope, and still-water depth on wave propagation, wave pressure distribution, and mean wave overtopping discharge were investigated. The peak pressure increased with the increase in incident wave height and decreased with the increase in relative distance and fore reef slope. The mean wave overtopping discharge over the vertical and sloped seawalls increased with the increase in incident wave height, wave period, and still-water depth, but it was significantly reduced with the increase in relative distance and fore reef slope. Modified empirical formulas are proposed for predicting the wave force and mean wave overtopping discharge over the vertical and sloped seawalls on the reef flat for both regular and irregular waves.

1. Introduction

Coastal defense structures such as seawalls have been constructed on the seaward surface of coral reef flats to minimize disaster losses [1]. Wave hydrodynamic is considered to be one of the important factors in determining the reef-top environment and the forces acting on the seawalls [2,3,4], especially for severe typhoon events. Due to the effect of coral reef topography, much of the incident wave energy is absorbed by the wave breaking along the reef and is further weakened while being propagated over the reef flat due to considerable bottom roughness [5,6]. The interactions between waves and reef flats have been a hot topic of research [7,8,9,10,11,12]. Since wave force and mean wave overtopping discharge are important factors to consider for the design, construction, and maintenance of seawalls on the reef flat [13], it is essential to investigate wave propagation, dynamic behavior, and hydrodynamic loads of seawalls on reef flat topography for a comprehensive understanding of hydrodynamics and hazard mitigation.
Numerous experimental and numerical investigations have been performed to investigate wave propagation and wave slamming on reef topography [5,14,15,16]. For instance, Nwogu and Demirbilek [5] pointed out that infragravity wave energy is at a minimum at the edge of a reef and increases as the wave is propagated over the reef flat. The importance of the infragravity wave has also been reported in the propagation of waves across reef flats, particularly in extreme events [12,17,18]. Yao et al. [10] performed laboratory experiments to examine the wave transformation and run up of tsunami-like solitary waves over various fringing reef profiles. The findings show that wave run up on the back reef slope is essentially indifferent to differences in both fore reef slope and reef crest width and is most susceptible to variations in reef flat width. Later, the authors [19] extended their results by using numerical modelling and simulating two realistic reefs with different reef configurations and roughness characteristics. From the aspect of numerical simulation, Fu et al. [20] looked into the wave-driven currents and statistical moments of irregular waves over a one-dimensional horizontal fringing reef. In the numerical study of Yu et al. [4], the wave-driven current was found to be stratified in the vertical direction, the velocity at the surface was roughly two to three times that of the average value, and the peak value of the pressure increased consistently with the increase in fore reef slopes, reef flat length, and relative distance.
When seawalls are constructed on reef flat topographies, the hydrodynamic behaviors across the coral reef become more complicated, accompanying with wave propagation and wave overtopping over the seawalls. The wave force and wave overtopping discharge have been calculated through a number of experimental and numerical studies. Many prediction methods for the mean wave overtopping discharge, wave force, and wave peak pressure have been derived for the seawall on a normal beach slope [21,22,23,24] and coral reef flat topology [14,25,26]. Robertson et al. [14] focused on the effect of turbulent bores on a vertical wall mounted on a fringing reef for the incident solitary waves, and a design formula was proposed for calculating the maximum wave impact force. In the further studies of Liu et al. [26] and Chen et al. [25], empirical formulas were proposed to predict the wave overtopping discharge and wave force of vertical seawalls on coral reefs under non-impulsive and monochromatic wave conditions, respectively. Liu et al. [16] experimentally investigated the wave transformation characteristics over reef topography and the response of the overtopping rate of a vertical seawall on the reef flat. The wave height, still-water level, wave period, reef fore slope, and reef flat width were found to play important roles in the wave transformation and overtopping on reef topography. Cao et al. [27] experimentally investigated the wave overtopping flow striking a human body on the crest of an impermeable sloped seawall; they developed predictors for the quick estimation of the maximum inline force due to overtopping flow. Fang et al. [13] performed a series of two-dimensional flume experiments to investigate the solitary wave impact on a vertical wall mounted on a reef flat, and a predictive equation was proposed for predicting the peak pressure along the vertical wall on the reef flat. AlYousif et al. [22] investigated the wave forces and moments acting on a vertical wall and a vertical wall attached to a horizontal plate subjected to regular and random wave fields. They found that the 95% non-exceedance values of the normalized horizontal wave forces and moments were less sensitive to changes in the wave height, while the normalized vertical wave force was highly sensitive to changes in the relative wave heights for random waves.
As was already mentioned, the majority of earlier studies concentrated on the interaction between waves and coral reef topography. To the best of our knowledge, there have not been many investigations into the wave propagation and overtopping over vertical and sloped seawalls on coral reefs. The effects of fore reef slope and the relative distance of a seawall on the wave propagation process, wave pressure distribution, and mean wave overtopping discharge for the seawalls on the reef flats under irregular wave conditions have not been well understood. It is uncertain if the existing empirical formula derived from the seawall with the normal beach slope is reliable in predicting wave force and mean wave overtopping discharge of vertical and sloped seawalls on the reef flat topography.
The present study addresses this issue and performs a series of physical model tests to investigate wave propagation and overtopping over vertical and sloped seawalls on the reef flat topography. The effects of incident wave parameters, still-water depth on the reef flat, fore reef slope and relative distance on the wave propagation, peak pressure distribution, and mean wave overtopping discharge are investigated for both regular and irregular waves. The paper is organized as follows. Section 2 presents the specifics of the experimental setup. Section 3 presents the findings for wave propagation, pressure, and overtopping over seawalls. Section 4 contains the discussion. Section 5 provides a summary of the conclusion.

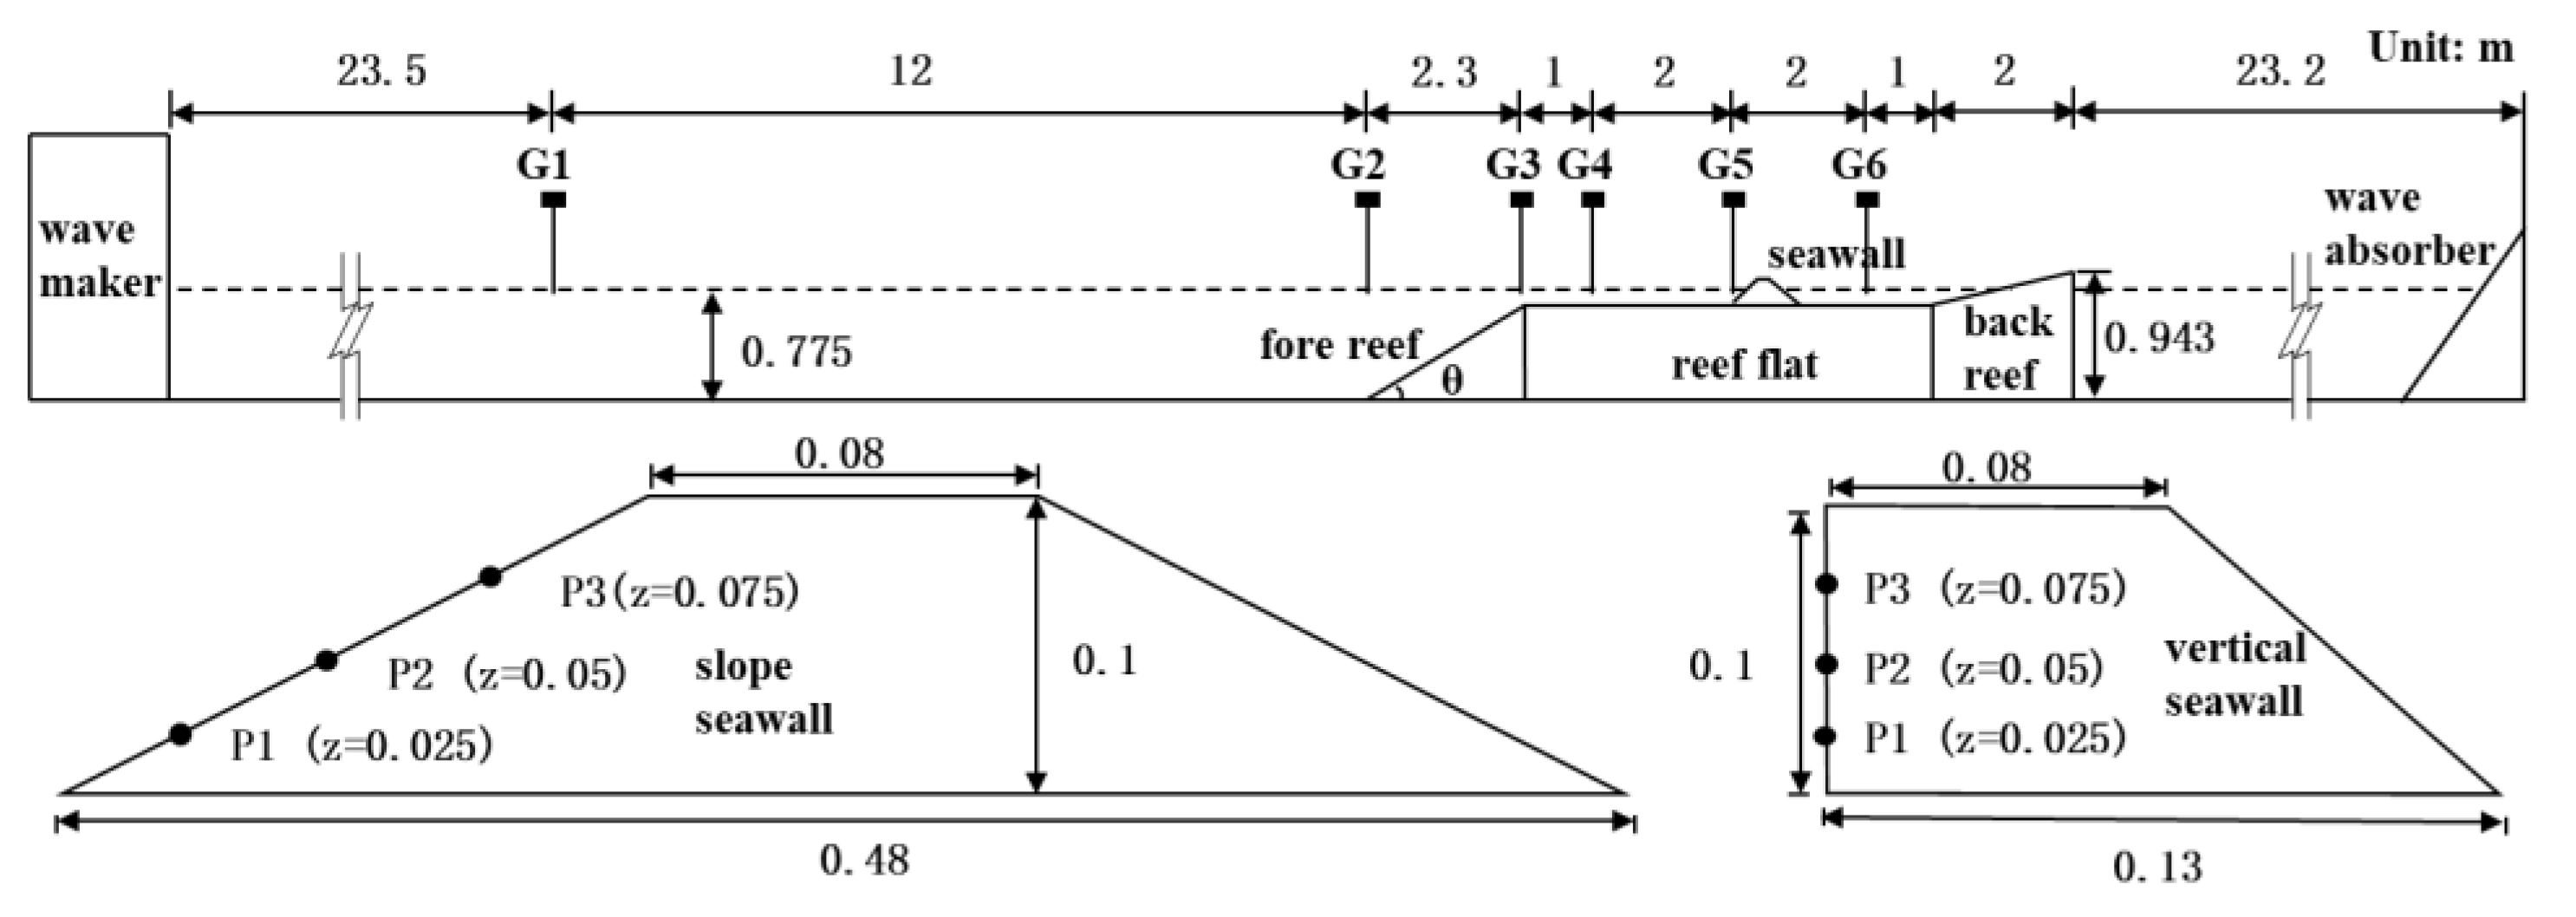
2. Experimental Set-Up

A number of physical model tests of wave propagation and overtopping over seawalls situated on the topography of the reef were carried out in a wave flume at Zhejiang University, China. The wave flume was 69 m long, 1.2 m wide, and 1.6 m deep. A piston-type wave maker was set up on one side of the wave flume to generate the regular and irregular waves. A full width plastic porous material beach was fitted at the other side of the wave flume to reduce the effect of reflected waves. More than 90% of the incident wave energy could have been absorbed by the plastic porous material beach. The waves were calibrated in the empty wave flume before the formal experiment. For regular waves, the wave maker stroke was adjusted to ensure that the wave height and period met the predetermined targets; for irregular waves, the wave maker calculator program came with the wave maker to execute secondary corrections to ensure that the generated irregular wave spectrum shape and peak value met the required predetermined targets. The incident wave height represents the wave height measured at G1 in the preliminary experiments. Froude’s law of similarity of 1:50 was adopted by considering the wave flume scale and prototype reef topography. A semi-section approach was used in the present experiment to reduce the influence of the blockage and reflected wave. Figure 1 depicts a schematic representation of the experimental setup.
The length of fore reef was 2.3 m for the slope ratio of 1:3, the length of the reef flat was 6 m, and the height of reef flat was 0.775 m. The length of the back reef slope was 2 m, and the height of the back reef slope was 0.943 m, which is 0.118 m higher than the still-water level. During the experiment, there was no wave overtopping at the back reef slope end. Idealized vertical and sloped seawall models that were composed of iron plates were installed on the reef flat topography; the surface roughness was not considered in the present experiment. The width and height of the idealized seawall model were 0.08 m and 0.1 m, respectively. The slope ratio of the sloped seawall was 1:2, corresponding to the slope angle of φ = 26.57°. The relative distance l between the seaward surface of the seawall and the reef flat edge was varied from 1 m to 5 m. Wave gauges (YWH200-D) with a sampling frequency of 50 Hz were installed at six locations (G1–G6) along the reef profile to obtain temporal free surface elevation. G1 was deployed in front of the coral reef. G2 and G3 were located on the fore reef slope, G4–G6 were located on the reef flat. The sampling durations were 180 s and 420 s for the regular and irregular waves, respectively. Three pressure sensors were used to measure the wave pressure along the seaward surface of the seawall. The wave propagation process on the seawall was captured by a video camera (EOS60D), which was located at one lateral side of the wave flume. The measured range of the pressure sensor was 0–20 kPa, and the accuracy was ±0.2%. The details for the arrangement of wave gauges and pressure sensors are presented in Figure 1. A 2.5 cm wide trench was mounted on the seawall crest, and a water tank was used to collect the wave overtopping volume. A water baffle was set in front of the water tank to block the water that did not flow through the trench. The mean wave overtopping discharge q was obtained by dividing the wave overtopping volume by using the trench width and duration of overtopping wave.
A total of 252 test cases of regular and irregular wave conditions was conducted to investigate the wave propagation and overtopping over the vertical and sloped seawalls on the reef flat. The details of test cases are shown in Table 1 and Table 2. Three fore reef slope ratios cotθ that varied from 1 to 5 were considered, corresponding to θ = 45°, 18.4° and 11.3°. Both wave period T0 and mean wave period T ¯ 0 for regular and irregular waves were varied from 1 s to 1.8 s, respectively. hr is the still-water depth on the reef flat; H0 is the incident mean wave height for the regular wave; Hs0 is the incident significant wave height for the irregular wave; l is the relative distance between the seaward surface of the seawall and the reef flat edge. The cases of No.1–6 were performed without seawalls. The JONSWAP spectrum was used for the irregular wave cases and was defined as follows:
S f = α H s 2 f p 4 f 5 γ β exp 1.25 f p f 4
α = 0.0624 0.230 + 0.0336 γ 0.185 1.9 + γ
β = exp f f p 2 2 σ 2 f p 2
σ = 0.07 f f p 0.09 f f p
where f is the wave frequency; σ = 1/f is the circle wave frequency; fp denotes the peak wave frequency; α is the scale–energy parameter; β is the peak shape parameter; γ is the peak enhancement factor.

3. Results

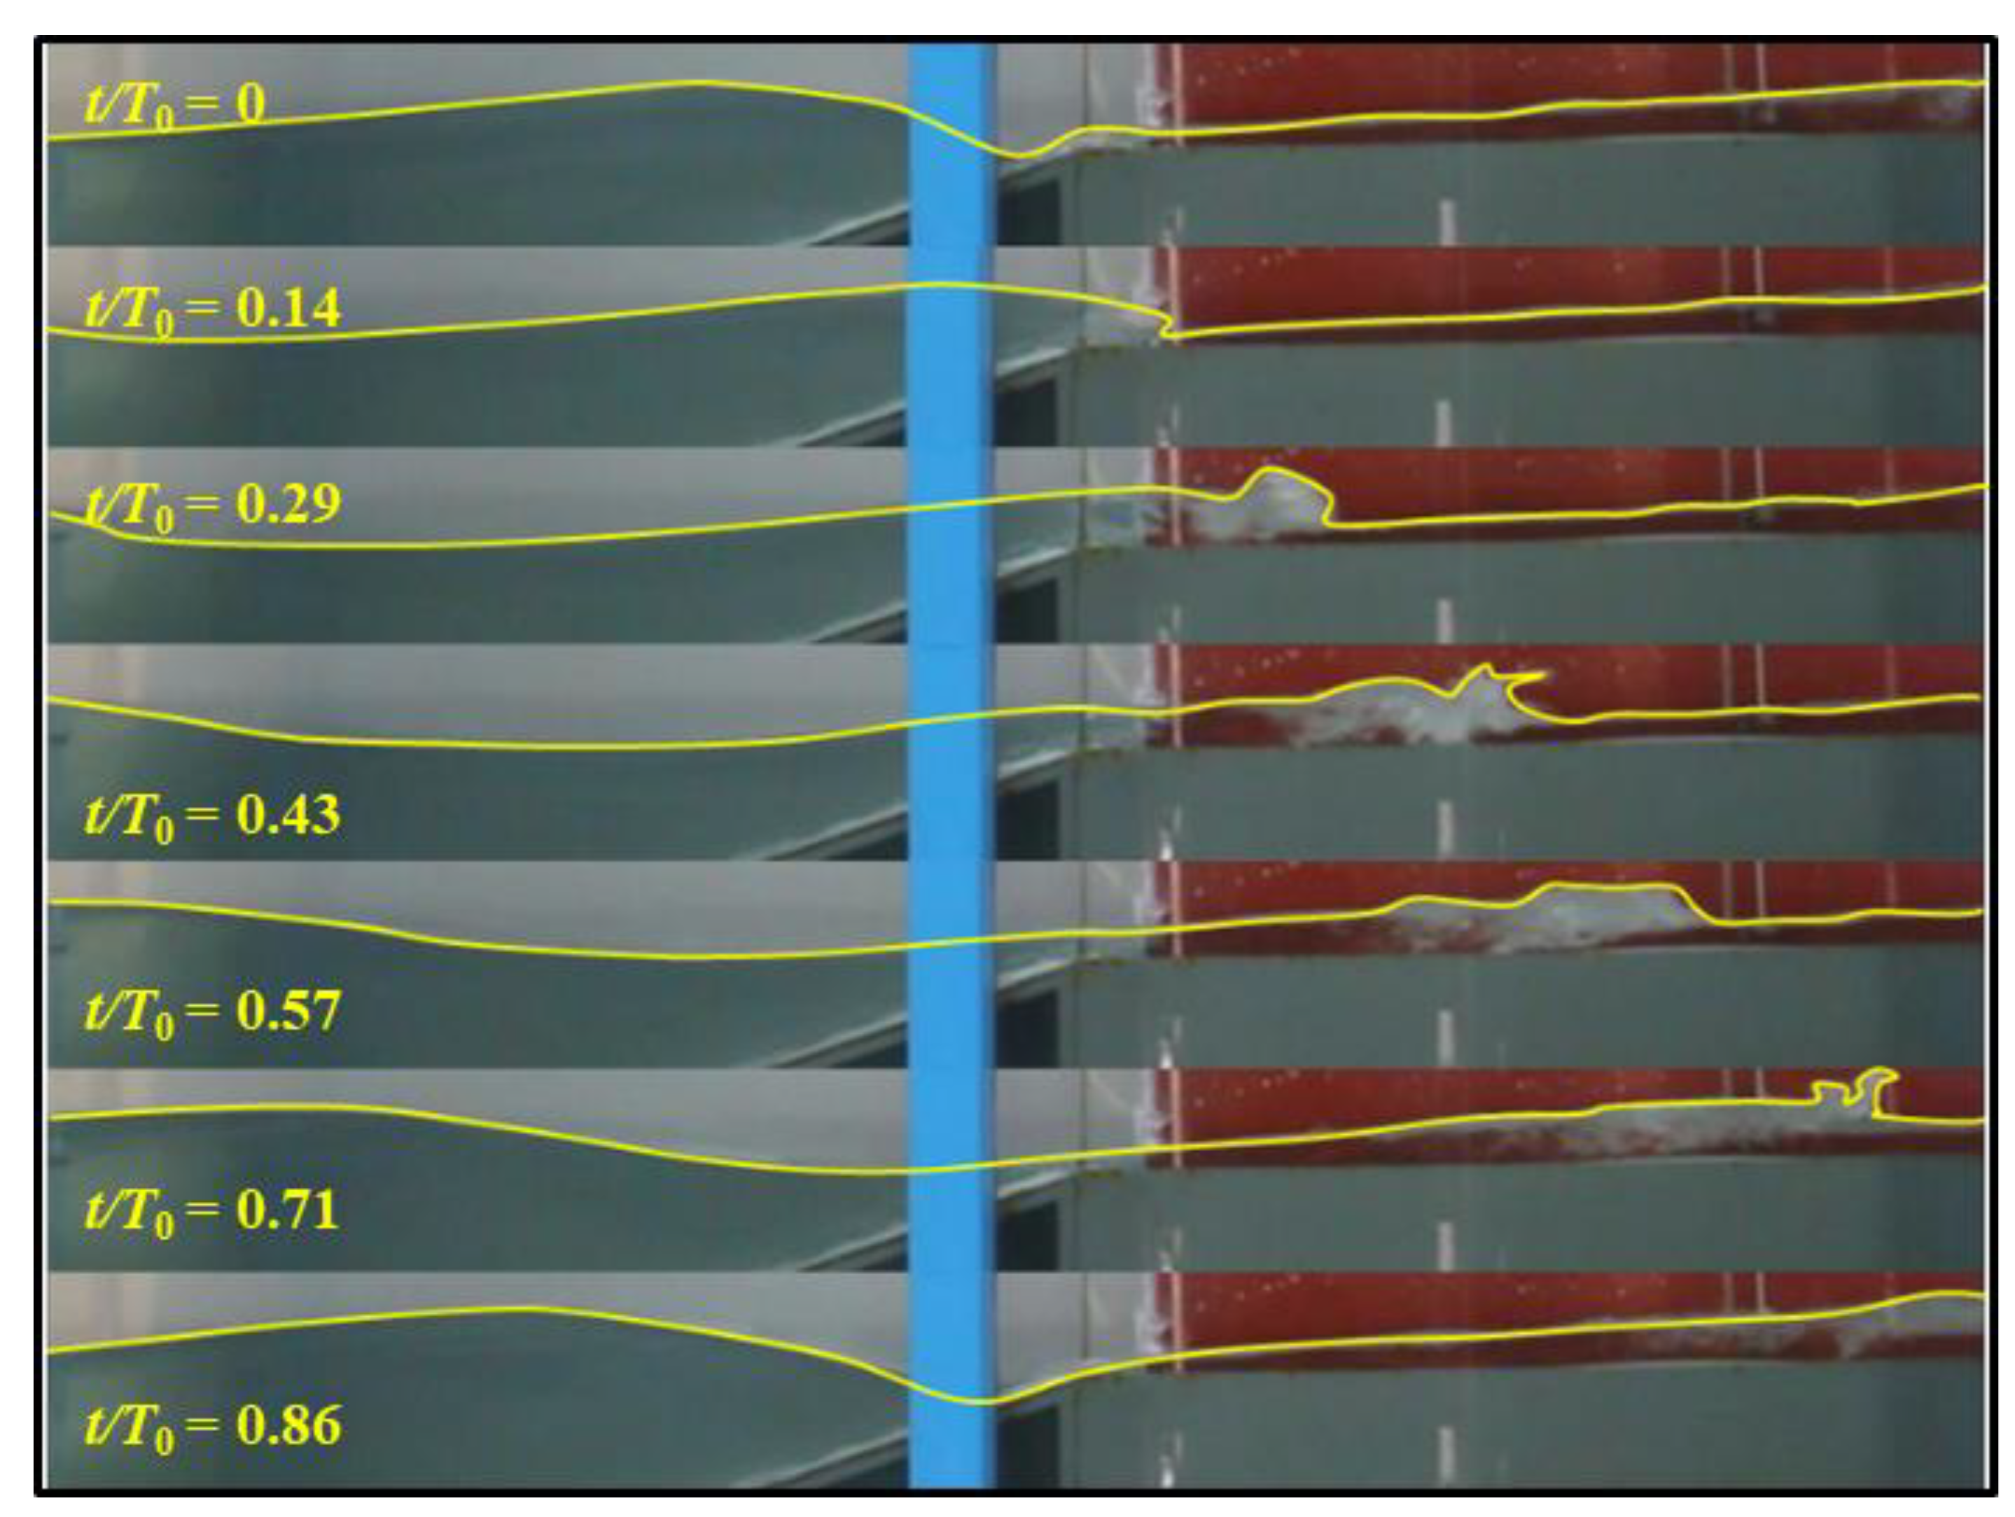
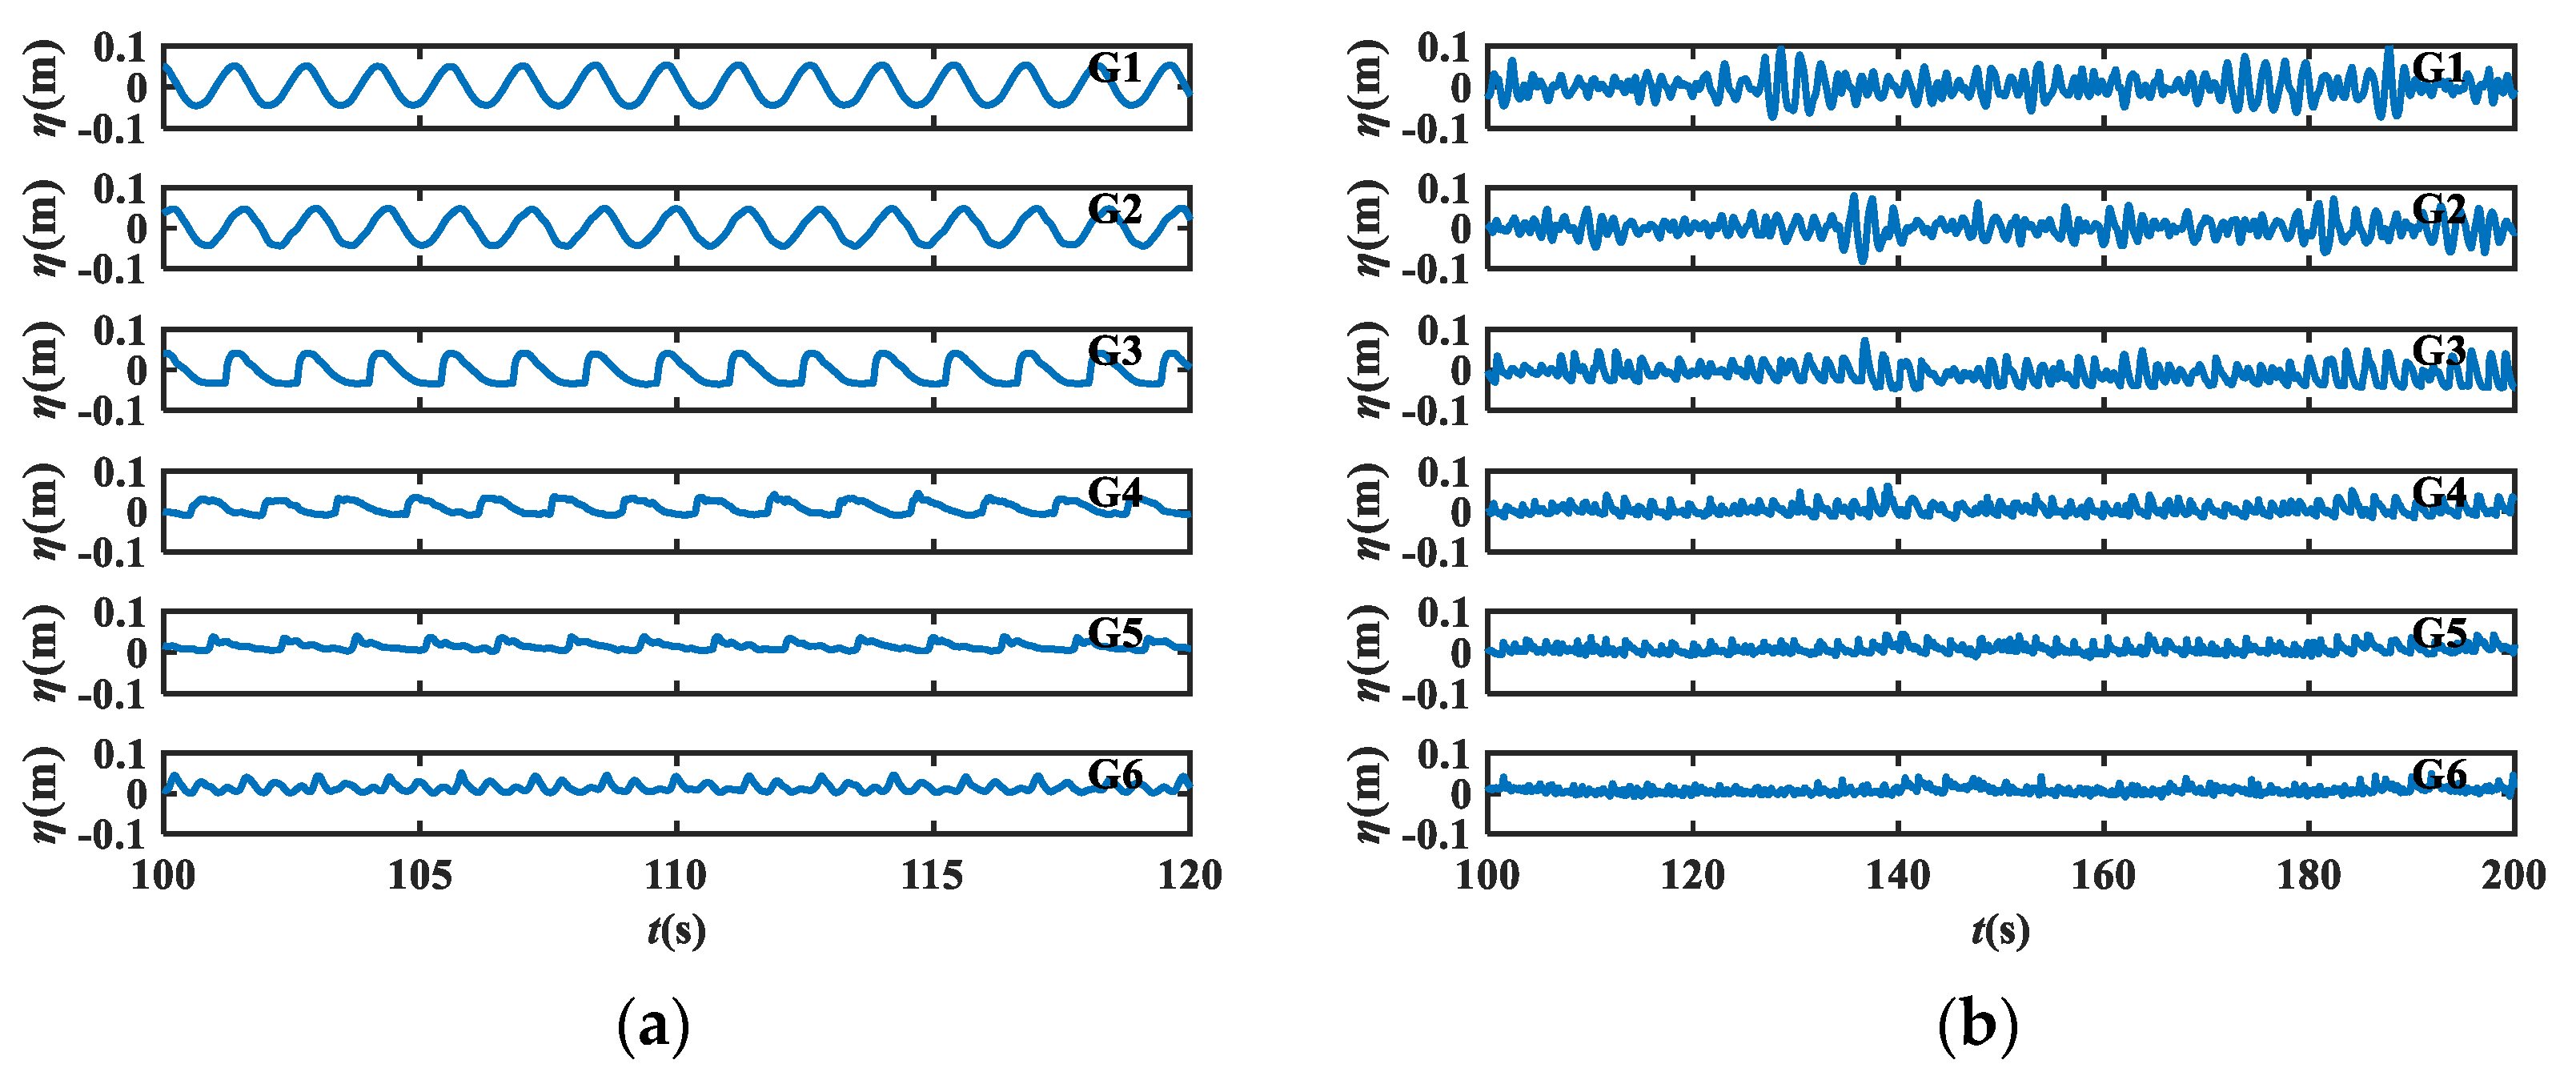
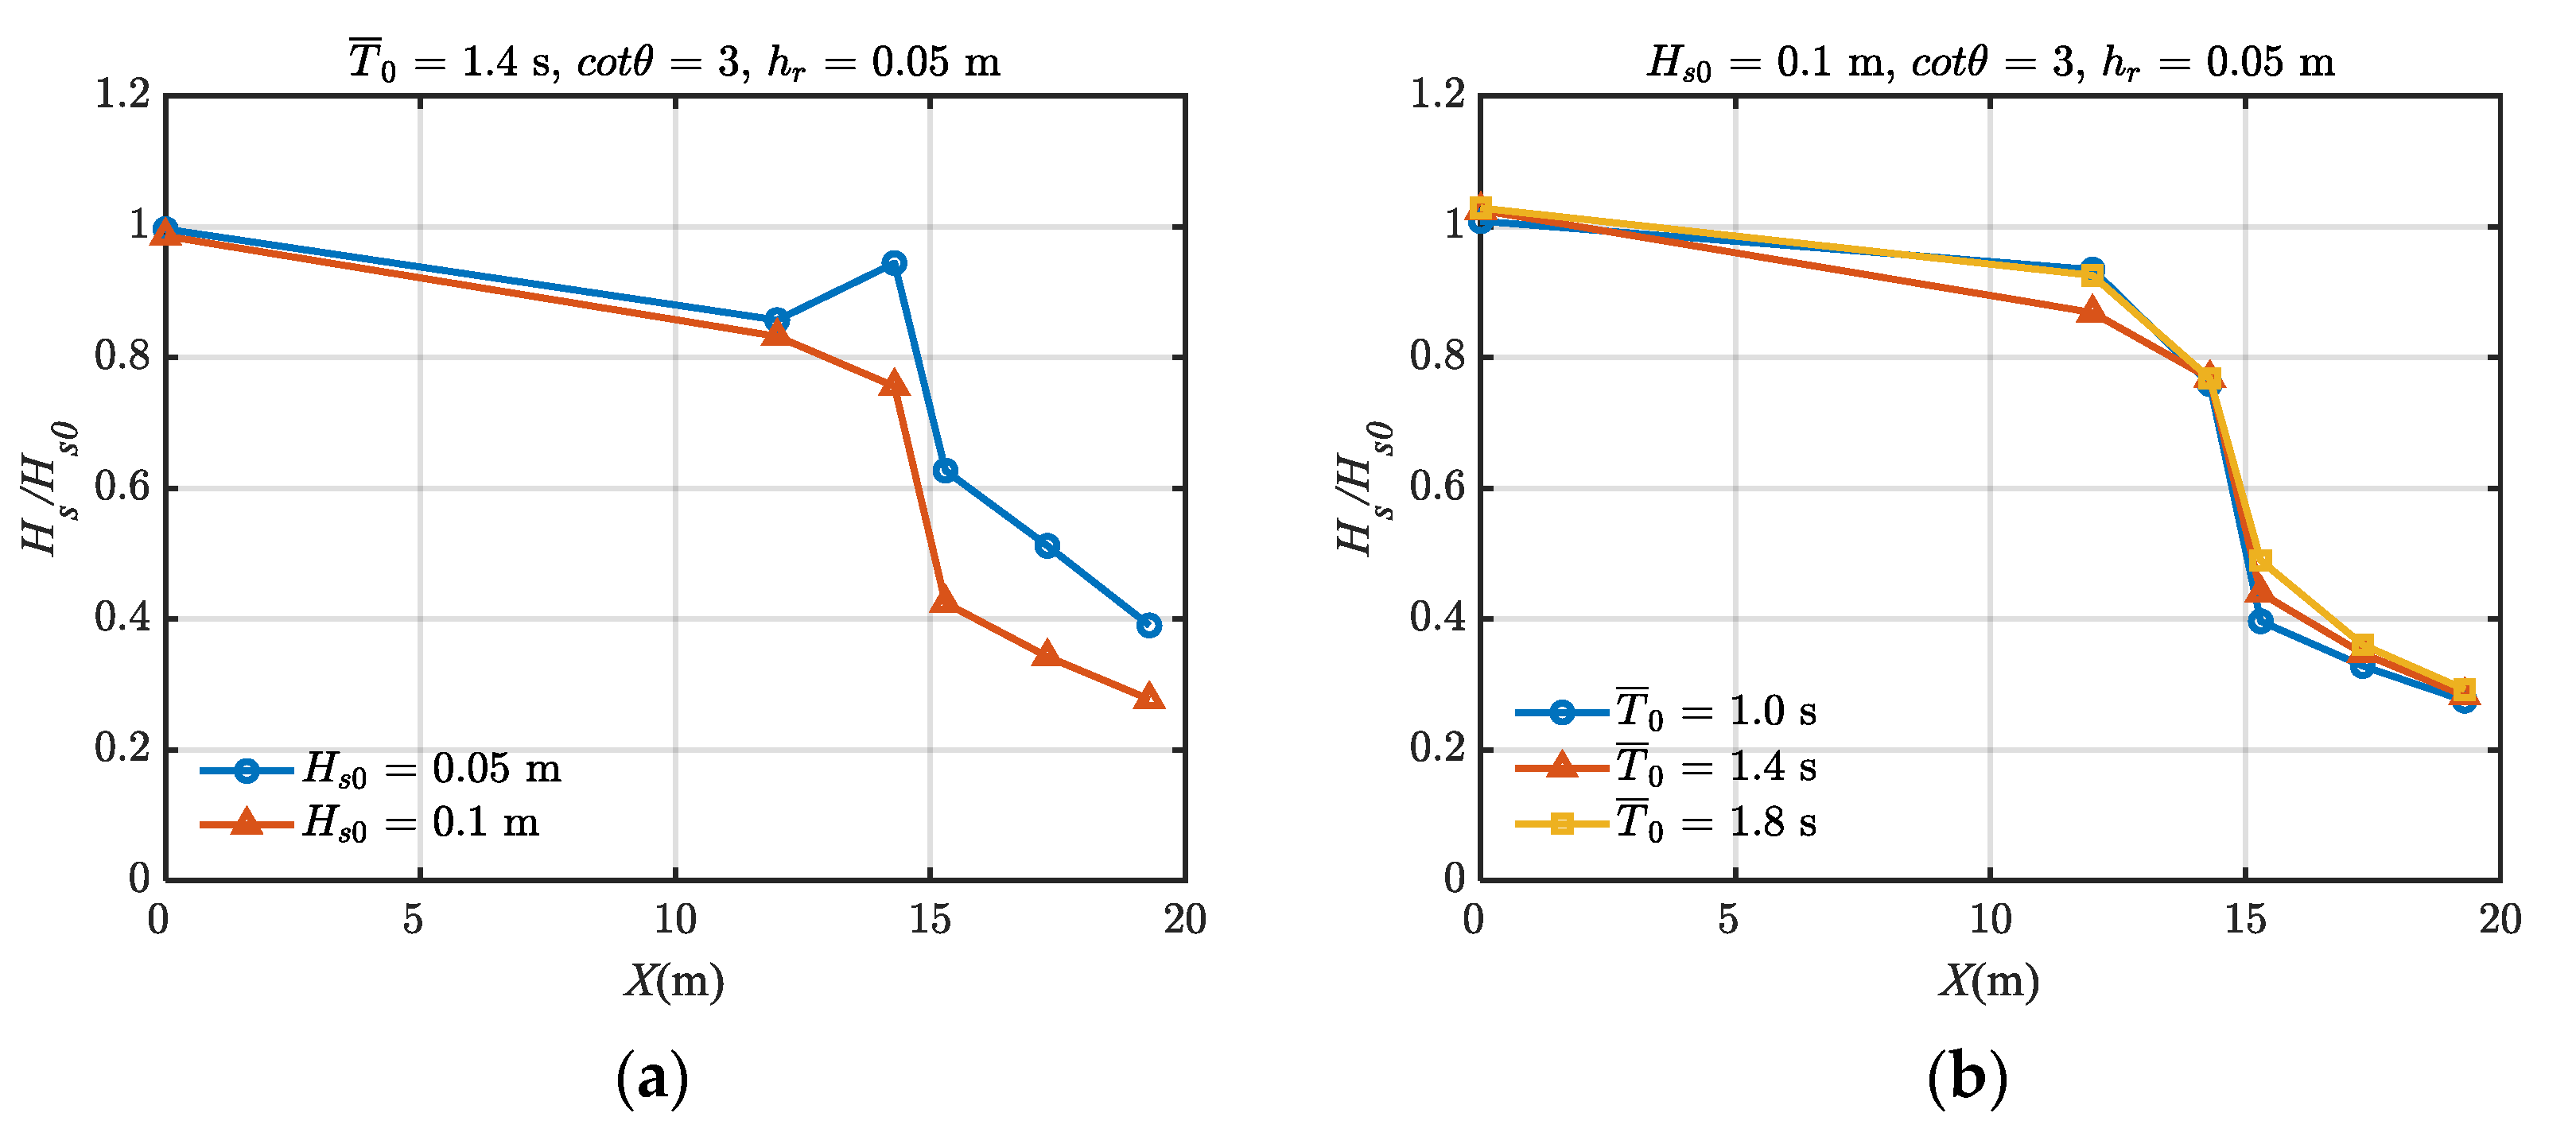
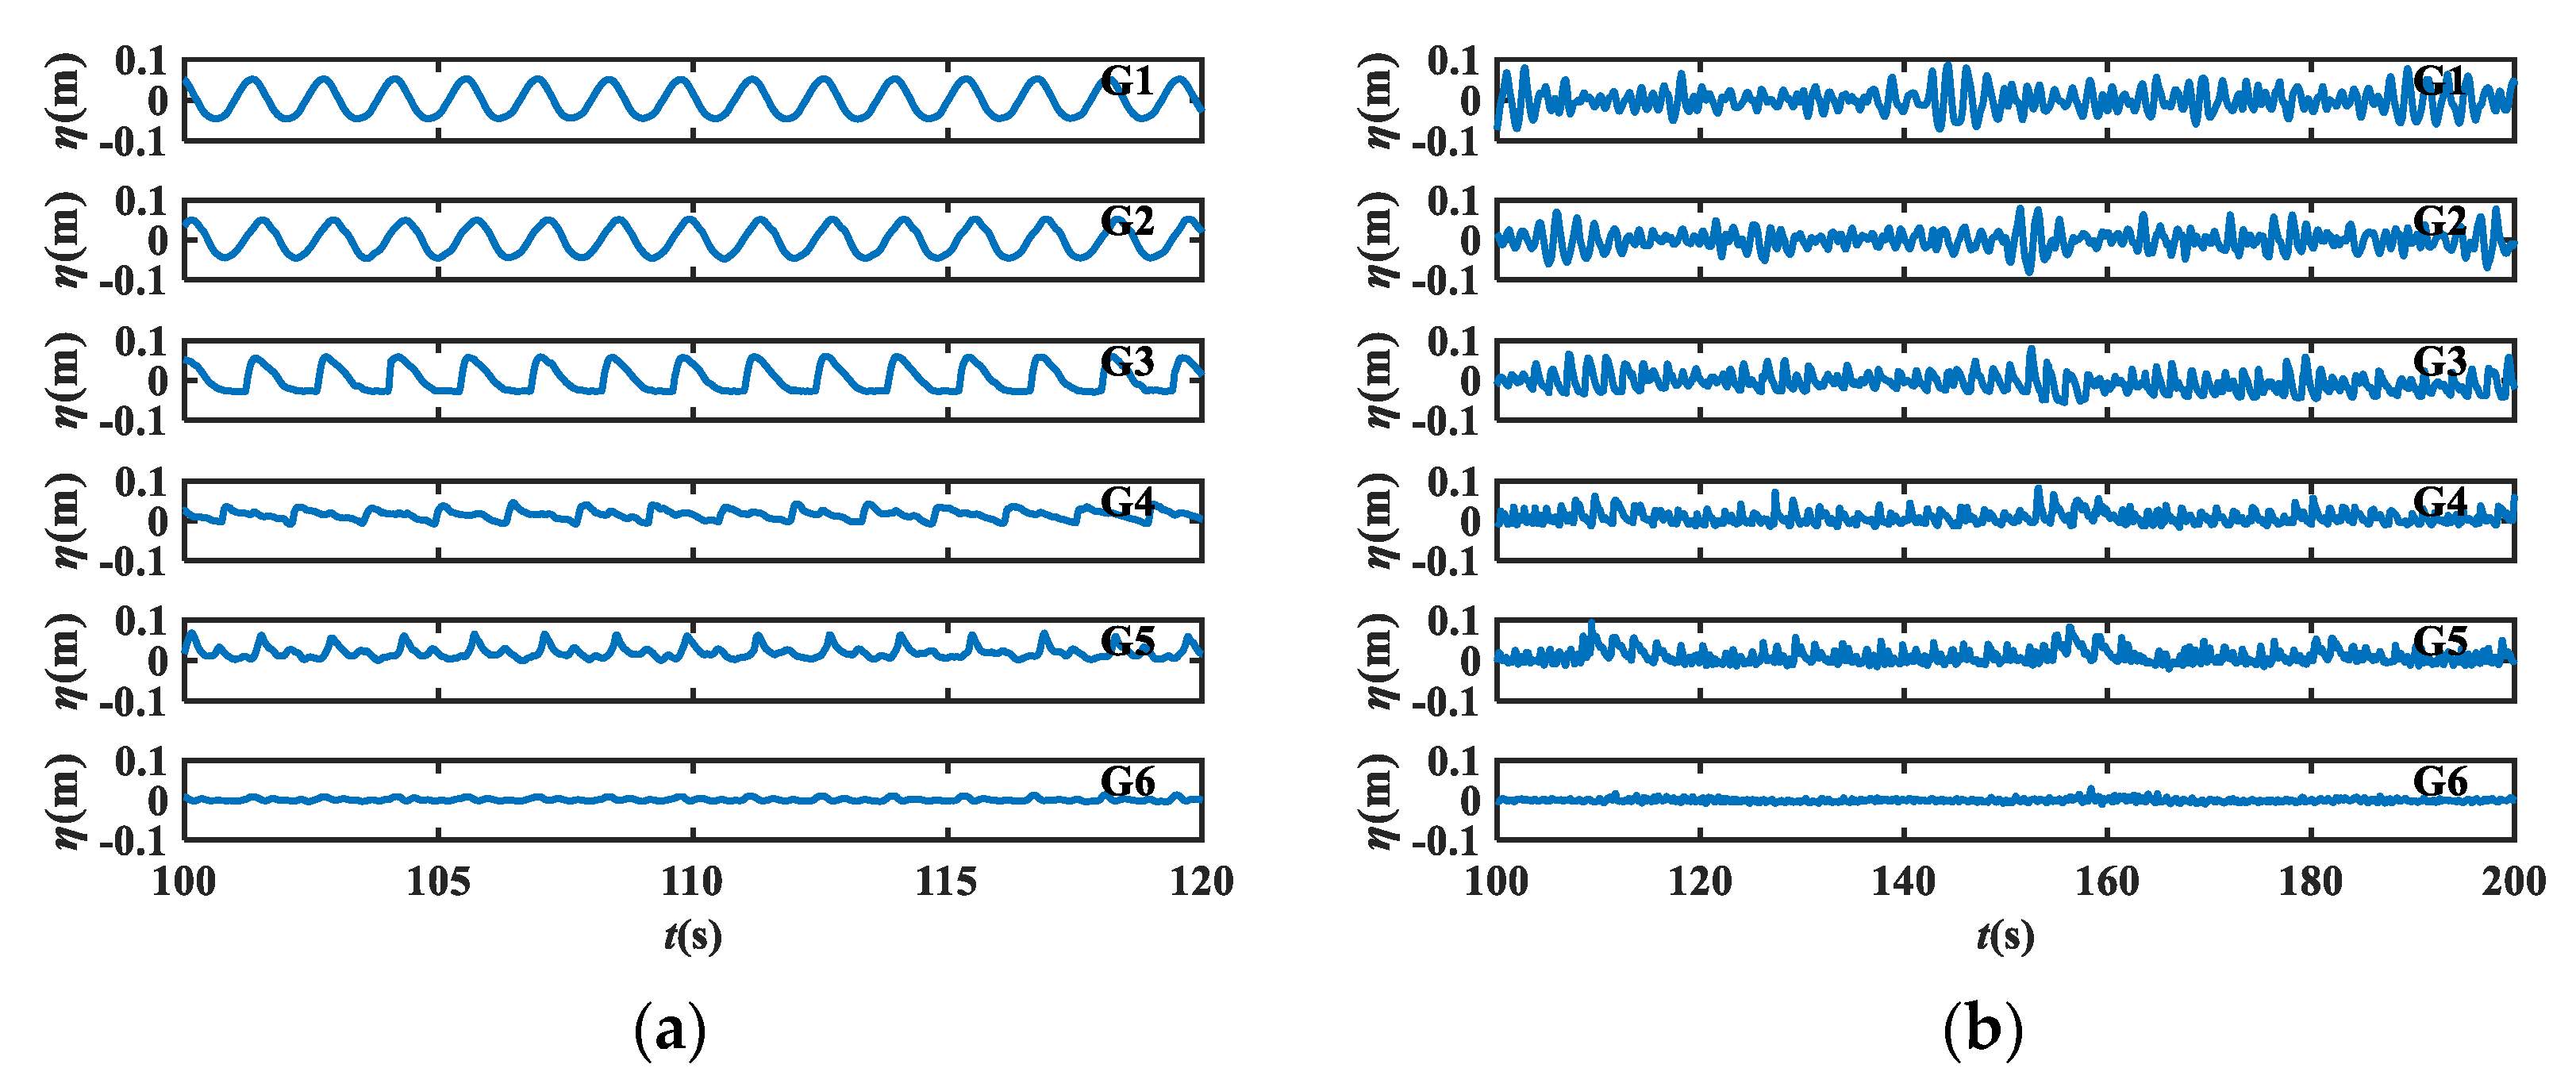
3.1. Wave Propagation Process

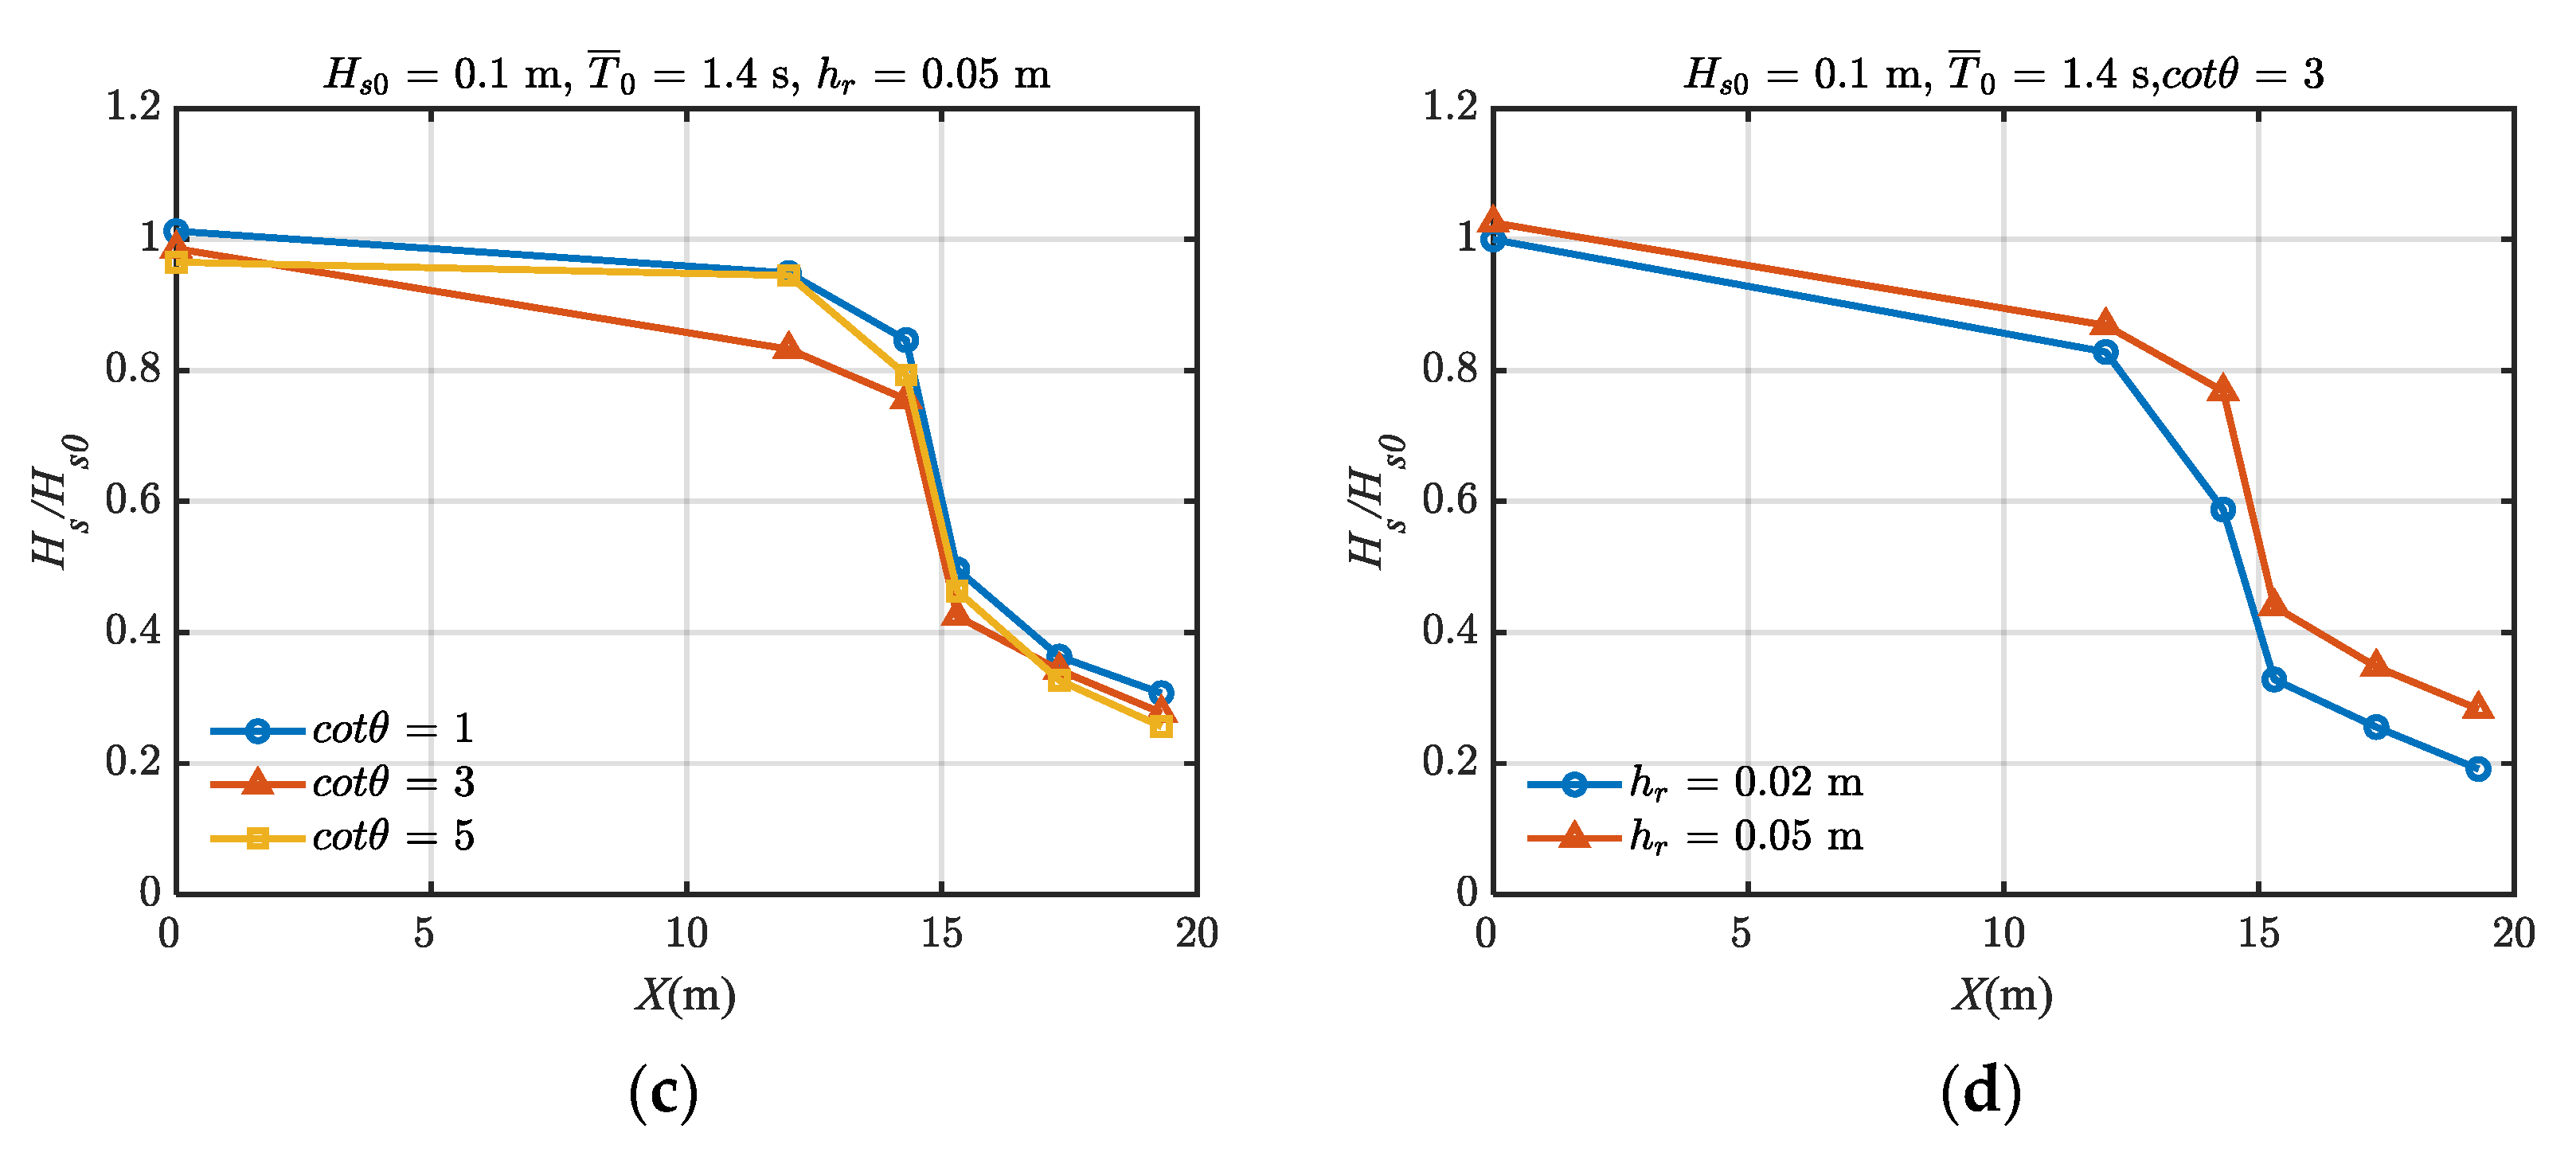
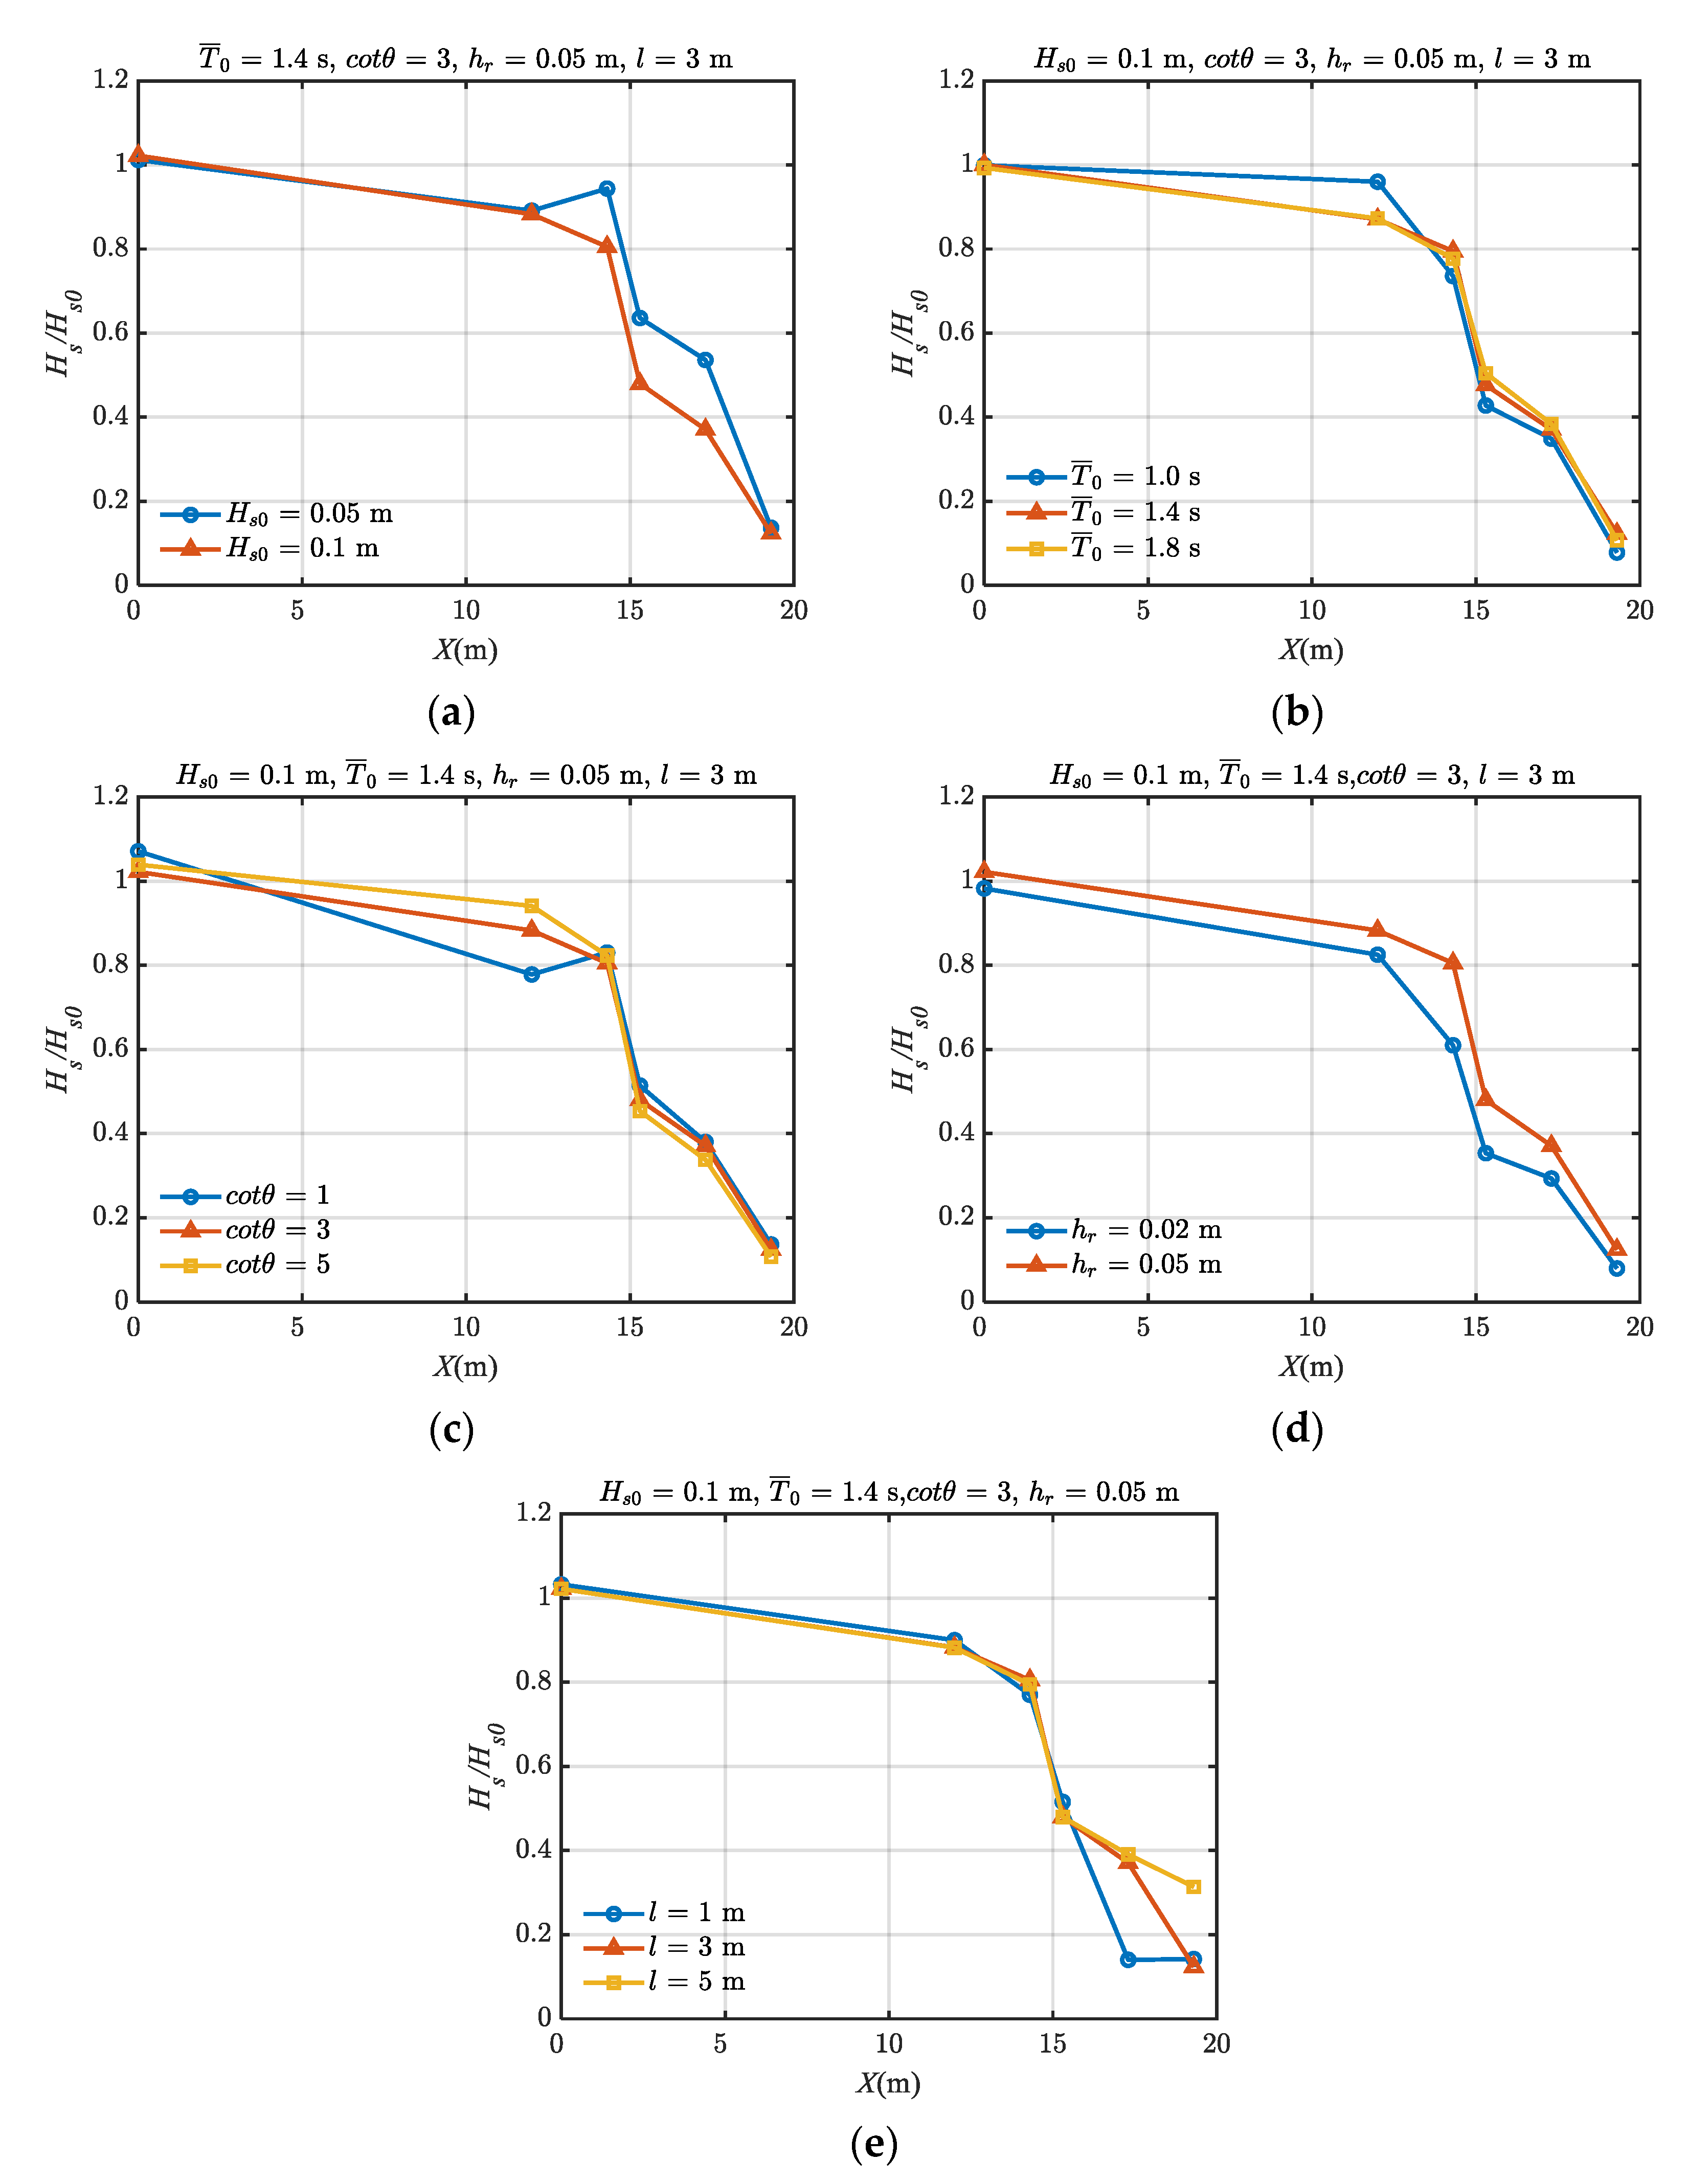
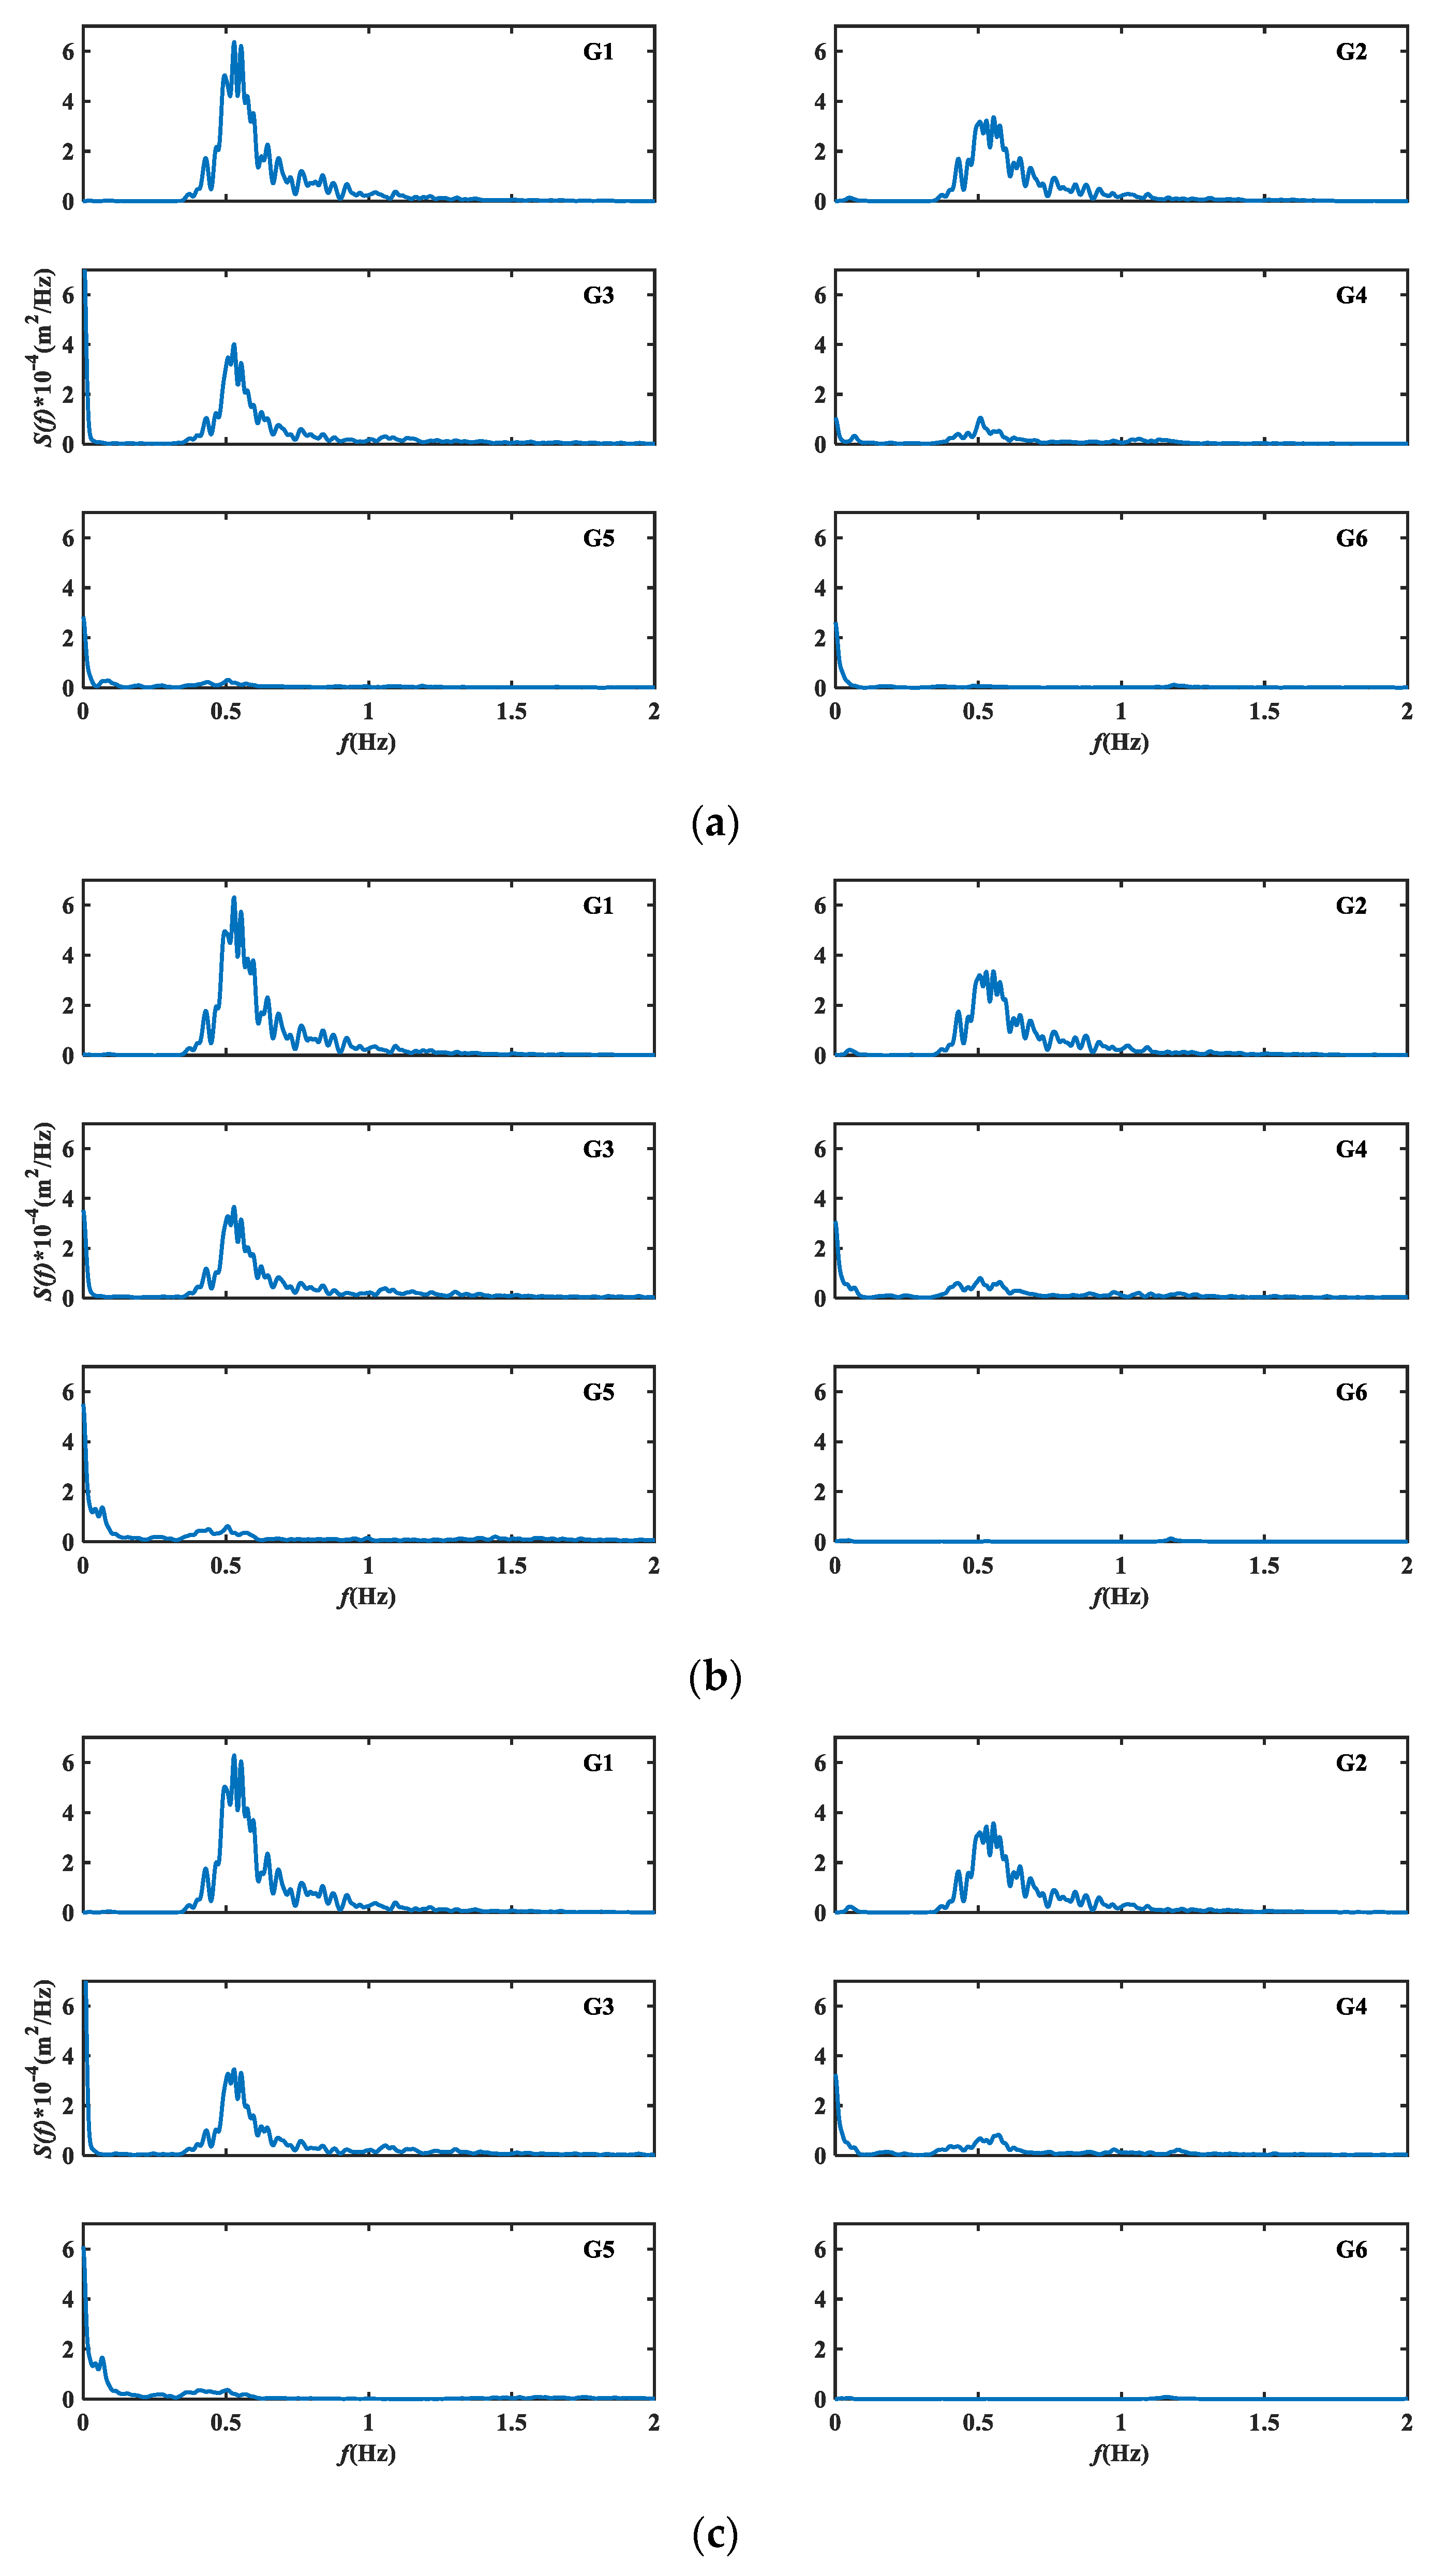
3.1.1. Wave Propagation for the Reef Topography

Figure 2 shows the regular wave propagation process on the reef flat at different time instants for the case of H0 = 0.1 m, T0 = 1.4 s, cotθ = 3, and hr = 0.05 m. At t/T0 = 0.14, the wave profile gradually becomes steep when the wave is propagated to the fore reef slope; the wave breaking phenomenon occurs at the fore reef edge G3. At t/T0 = 0.29, the wave is propagated over the fore reef slope, the air entrainment is observed in the reef crest, and the wave develops into a plunging breaker. At t/T0 = 0.43 to 0.86, the wave surf zone is observed on the reef flat; most of the wave energy is dissipated when the wave is propagated toward the nearshore. The time histories of free surface elevations along the wave propagation direction are presented in Figure 3. As can be seen, both regular and irregular waves develop an asymmetric wave profile, with a sharper wave crest and a flatter wave trough as they cross the reef. A similar phenomenon is observed in the literature [20,28,29]. The free surface elevation profiles are not stable due to air-bubble entrainment in the surf zone, and the wave heights are significantly reduced at G4-G6 on the reef flat. The wave height attenuation is attributed to the wave energy dissipation induced by wave breaking.
Figure 4 and Figure 5 show the variations in non-dimensional mean wave height H ¯ / H 0 and non-dimensional significant wave height H s / H s 0 with the wave propagation distance X on the reef topography at different incident wave heights, wave periods, still-water depth on the reef flat, and fore reef slope ratios for the regular and irregular waves, respectively. X is the relative distance to the first wave gauge. It can be seen that for the regular wave, the wave height changes slightly at the locations G1 (X = 0) and G2 (X = 12 m) in front of the fore reef edge. When the wave is propagated to the reef flat, a significant reduction in the wave height is observed at G3 (X = 14.3 m). With the increase in incident wave height, the decreasing rate of wave height increases, such that the wave height decreases to 18.1% of the incident wave height at X = 19.3 m for H0 = 0.15 m. For the case of H0 = 0.02 m, no wave-breaking phenomenon is observed when the wave is propagated over the reef flat; the normalized wave height increases to 1.15 at X = 15.3 m due to the wave shoaling effect. It is notable that the variation trends in wave heights with X are similar at different incident wave heights, wave periods, fore reef slope ratios, and still-water depths for both regular and irregular waves. The incident wave height is predominant in the variation in wave height along the wave propagation direction rather than the wave period, fore reef slope ratio, and still-water depth.

3.1.2. Wave Propagation for the Vertical Seawall

Figure 6 shows the regular wave propagation process for the vertical seawall on the reef flat for the case of H0 = 0.1 m, T0 = 1.4 s, cotθ = 3, l = 1 m, and hr = 0.05 m. Distinct from the case without seawall, the wave transformation characteristics become more complicated due to the presence of the vertical seawall. For the case of hr = 0.05 m, the wave propagation on the reef flat appears to be dominated by wave breaking. At 0 ≤ t/T0 ≤ 0.3, the wave surf zone on the reef flat is extended to the front of the vertical seawall. The ‘white’ breaking wave phenomenon is significant in the wave surface before the wave impacts the vertical seawall because the intense wave breaking on the reef flat entangles a substantial amount of air inside the wave. At 0.4 ≤ t/T0 ≤ 0.5, the wave impinges on the seaward surface of vertical wall, and a significant wave overtopping is observed over the crest of the vertical seawall. Due to the combined effects of the wave breaking and wave overtopping phenomenon, the wave energy is dissipated significantly, and the wave profile becomes flat at t/T0 = 0.6. Figure 7 shows the time histories of free surface elevations for the vertical seawall at different locations along the reef profile under regular and irregular wave conditions. Similar to the case without a seawall, the wave is propagated over the reef topography, and the wave profile becomes asymmetrical at G3 due to the wave shoaling effect. The wave height is significantly reduced by wave breaking at G4 and is further reduced at G6 in the rear of the vertical seawall.
The variations in non-dimensional mean/significant wave height with the propagation distance for the vertical seawall under regular and irregular waves are presented in Figure 8 and Figure 9, respectively. It can be seen that the variation trends in the wave heights at different variable parameters for both regular and irregular waves are generally the same, and the maximum wave height occurs at X = 12 m (G2) in front of the fore reef edge, except for the case of H0 = 0.02 m. The wave heights decrease with the increase in incident wave height H0 at the locations G4–G6. For the case of H0 = 0.02 m, the wave height increases dramatically at the location G4, which may be attributed to the wave shoaling effect and reflected wave caused by the vertical seawall. At the location G5, the wave height for the vertical seawall is larger than that without the seawall due to the reflected wave caused by the vertical seawall. Compared to the case without the seawall, the wave height is significantly reduced in the rear of the vertical seawall. At the relative distance l = 5 m, the gauges G6 are located in front of the vertical seawall, and the wave height at G6 is larger than those at l = 1 m and 3 m in the rear of the vertical seawall. It is notable that the variations in wave heights with the wave period and fore reef slope are not monotonous; the wave height for T0 = 1.4 s is larger than those for T0 = 1.0 s and 1.8 s, and it is larger at cotθ = 3 than those at cotθ = 1 and 5. With the increase in still-water depth hr, the wave height at each location increases for the vertical seawall. Distinct from the case of a regular wave, the wave height increases with the increase in cotθ at G2 for the irregular wave and becomes similar at G3–G6. Moreover, the mean wave period for the irregular wave has less pronounced effect on the variation in wave height than the regular wave.

3.1.3. Wave Propagation for the Sloped Seawall

Figure 10 shows the wave propagation and impinging process of the sloped seawall on the reef flat for the case of H0 = 0.1 m, T0 = 1.4 s, cotθ = 3, l = 1 m, and hr = 0.05 m. Similar to that of the vertical seawall, the wave is propagated over the reef flat, and the wave surf zone is extended to the front of the sloped seawall. The wave run-up and wave overtopping phenomena are observed along the seaward surface of the sloped seawall. The ‘white’ breaking wave is observed in front of the sloped seawall that is induced by the entrainment of air in the wave. At t/T0 = 0.2, the tip of the breaking wave firstly approaches on the middle of the seawall slope, and the wave run up subsequently occurs along the seaward surface of sloped seawall; the wave overtopping phenomenon is observed above the seawall crest. Figure 11 shows the time histories of free surface elevation at different locations for the sloped seawall for regular and irregular waves. For most of the cases, the wave height decreases along the reef topography due to energy dissipation induced by the wave breaking on the reef flat. The wave profiles become asymmetrical at G4 and G5; the reduction in wave height is attributed to the combined effect of the breaking wave and the reflected wave induced by the sloped seawall.
Figure 12 and Figure 13 show the variations in the non-dimensional mean/significant wave height with X for the sloped seawall on the reef flat at different incident wave heights, wave periods, still-water depth, fore reef slope ratios, and relative distances for regular and irregular waves, respectively. With the increase in the incident wave height H0, the wave heights decrease at each location. At hr = 0.05 m, for the case of the small incident wave height H0 = 0.02 m, no wave breaking occurs; the wave height becomes significantly large at the locations G3–G5. The maximum wave height at G3–G5 increases to 1.5 times that of the incident wave height for l = 3 m due to the wave shoaling effect. The variations in wave period do not change the wave height significantly. The increase in wave period leads to a reduction in the energy dissipation rate, resulting in a slightly larger wave height. The variation trends in wave heights with different variable parameters for an irregular wave are similar to those of a regular wave. However, the relative distance l has a minimal effect on the wave heights for an irregular wave compared to those of a regular wave.
Figure 14 shows the irregular wave spectra across the reef topography with and without the vertical and sloped seawalls. The frequency spectrum of irregular waves was obtained by using the Fast Fourier Transform (FFT) at different locations G1–G6 along the wave propagation direction. The power spectra generally behave similarly for the vertical and sloped seawalls. The wave energy is significantly reduced during the wave run up on the fore reef slope at G2 and is further weakened from G3 to G5 in the wave surf zone on the reef flat. The high frequency waves are gradually attenuated during wave propagation, while the infragravity waves with low frequency (0.028 Hz < f < 0.28 Hz in this experiment) gradually become dominant on the reef flat topography (G4–G5). Similar results were also observed by Nwogu and Demirbilek (2010), in that the infragravity wave energy increased as the wave was propagated over the reef flat. It is notable that the wave energy attenuation on the reef flat becomes slightly slow for those with seawalls compared to those without a seawall, specifically, a 58% and 68% reduction in the wave energy for vertical and sloped seawalls and 83% for those without a seawall at G5. The infragravity wave energy increases significantly at G5 in front of vertical and sloped seawalls, which are 2.1 and 2.3 times larger than that without a seawall, respectively. The wave energy becomes very small at G6 in the rear of the vertical and sloped seawalls due to the wave overtopping phenomenon.

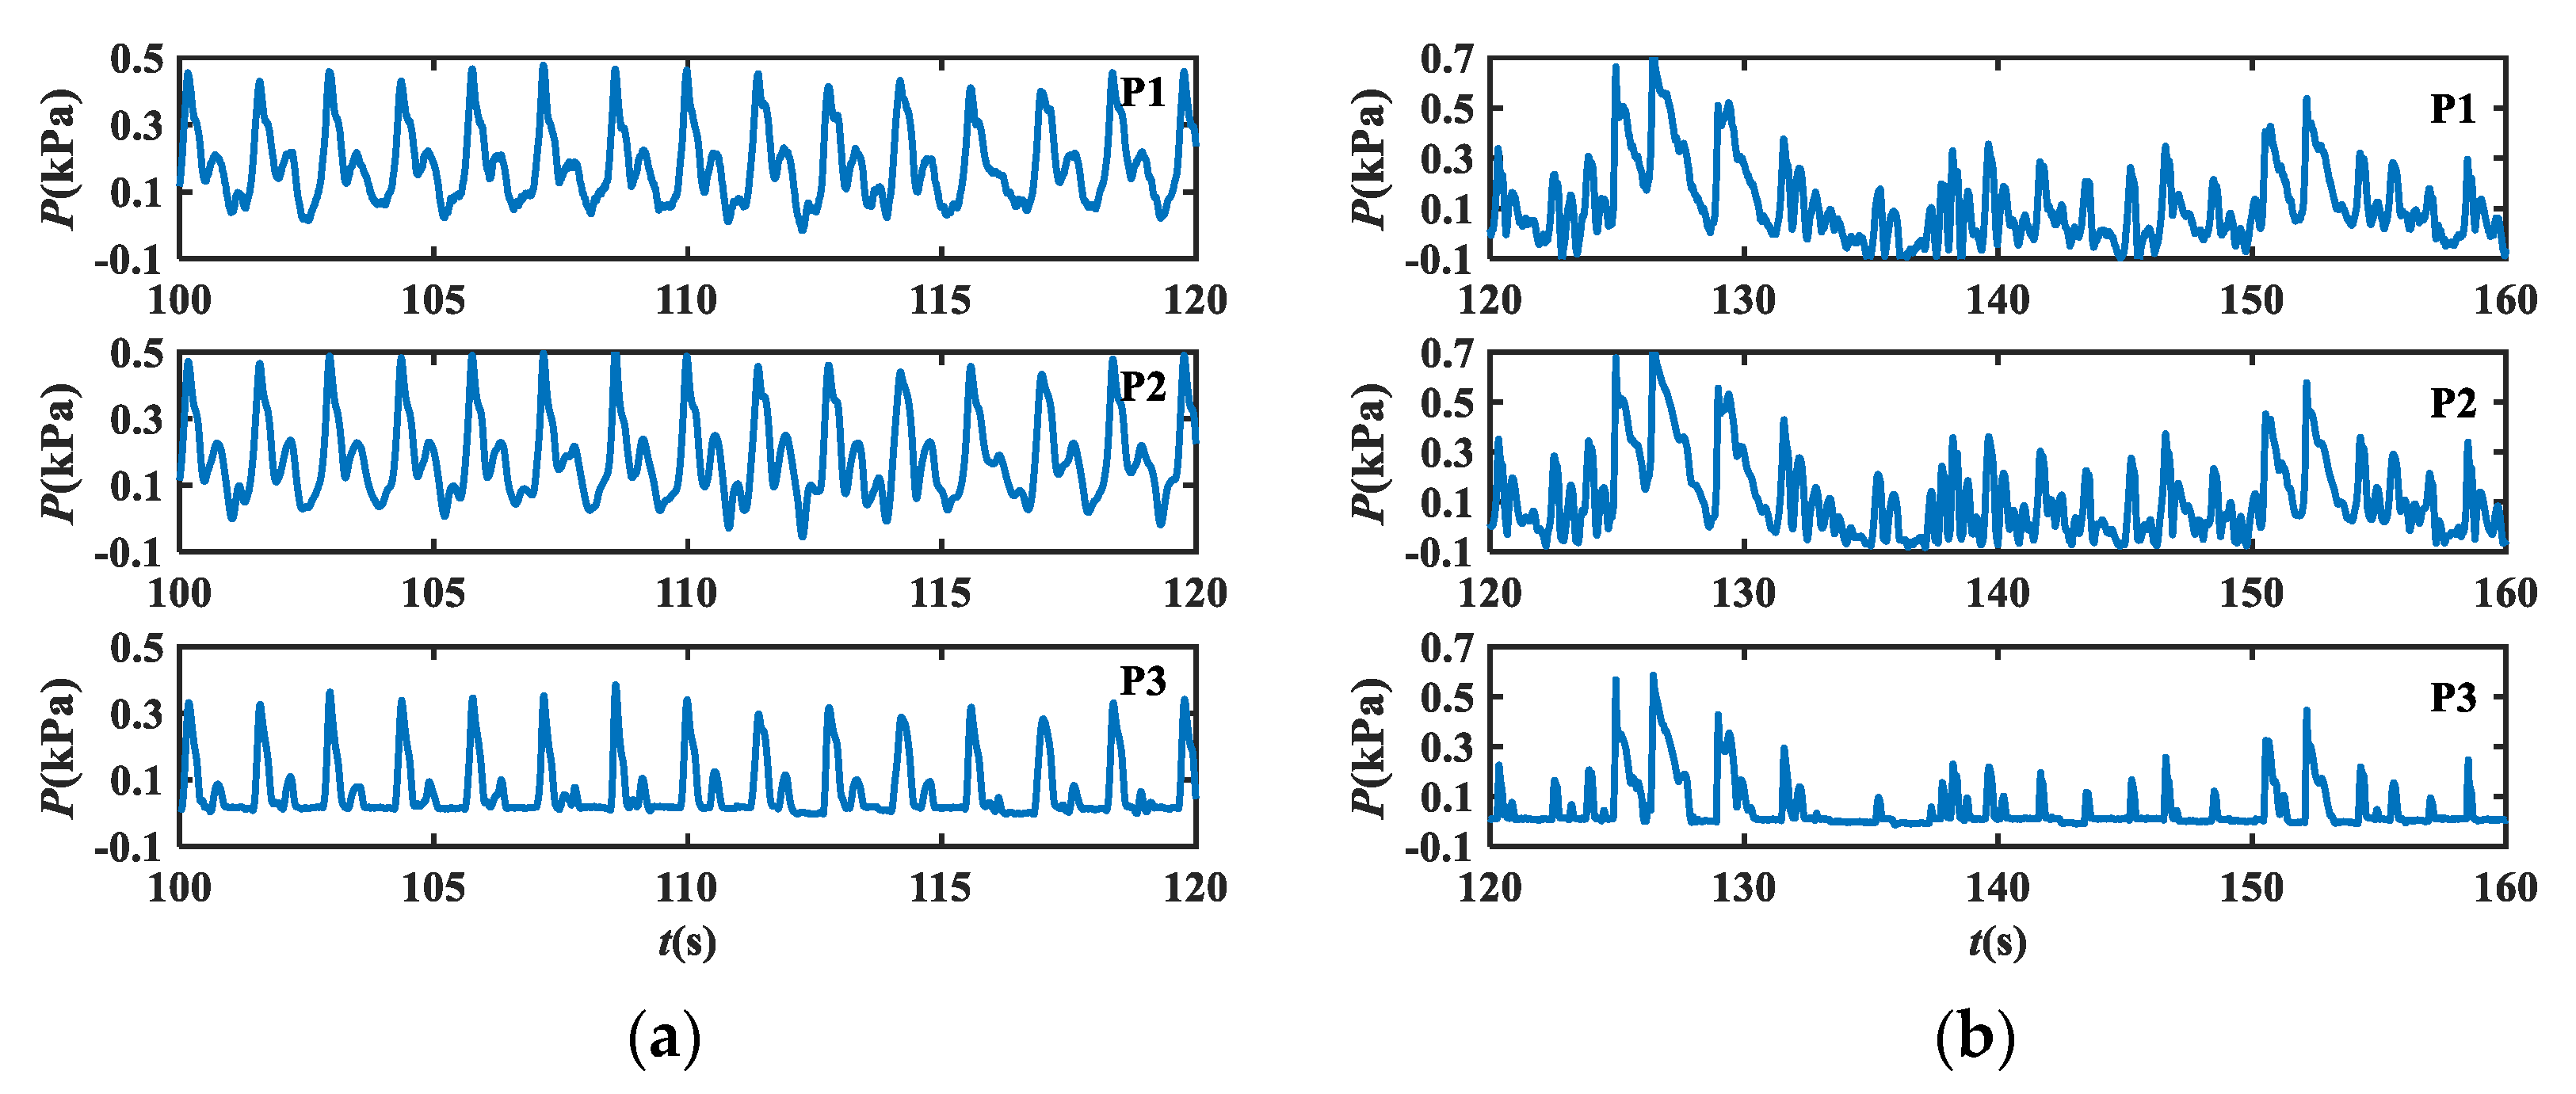
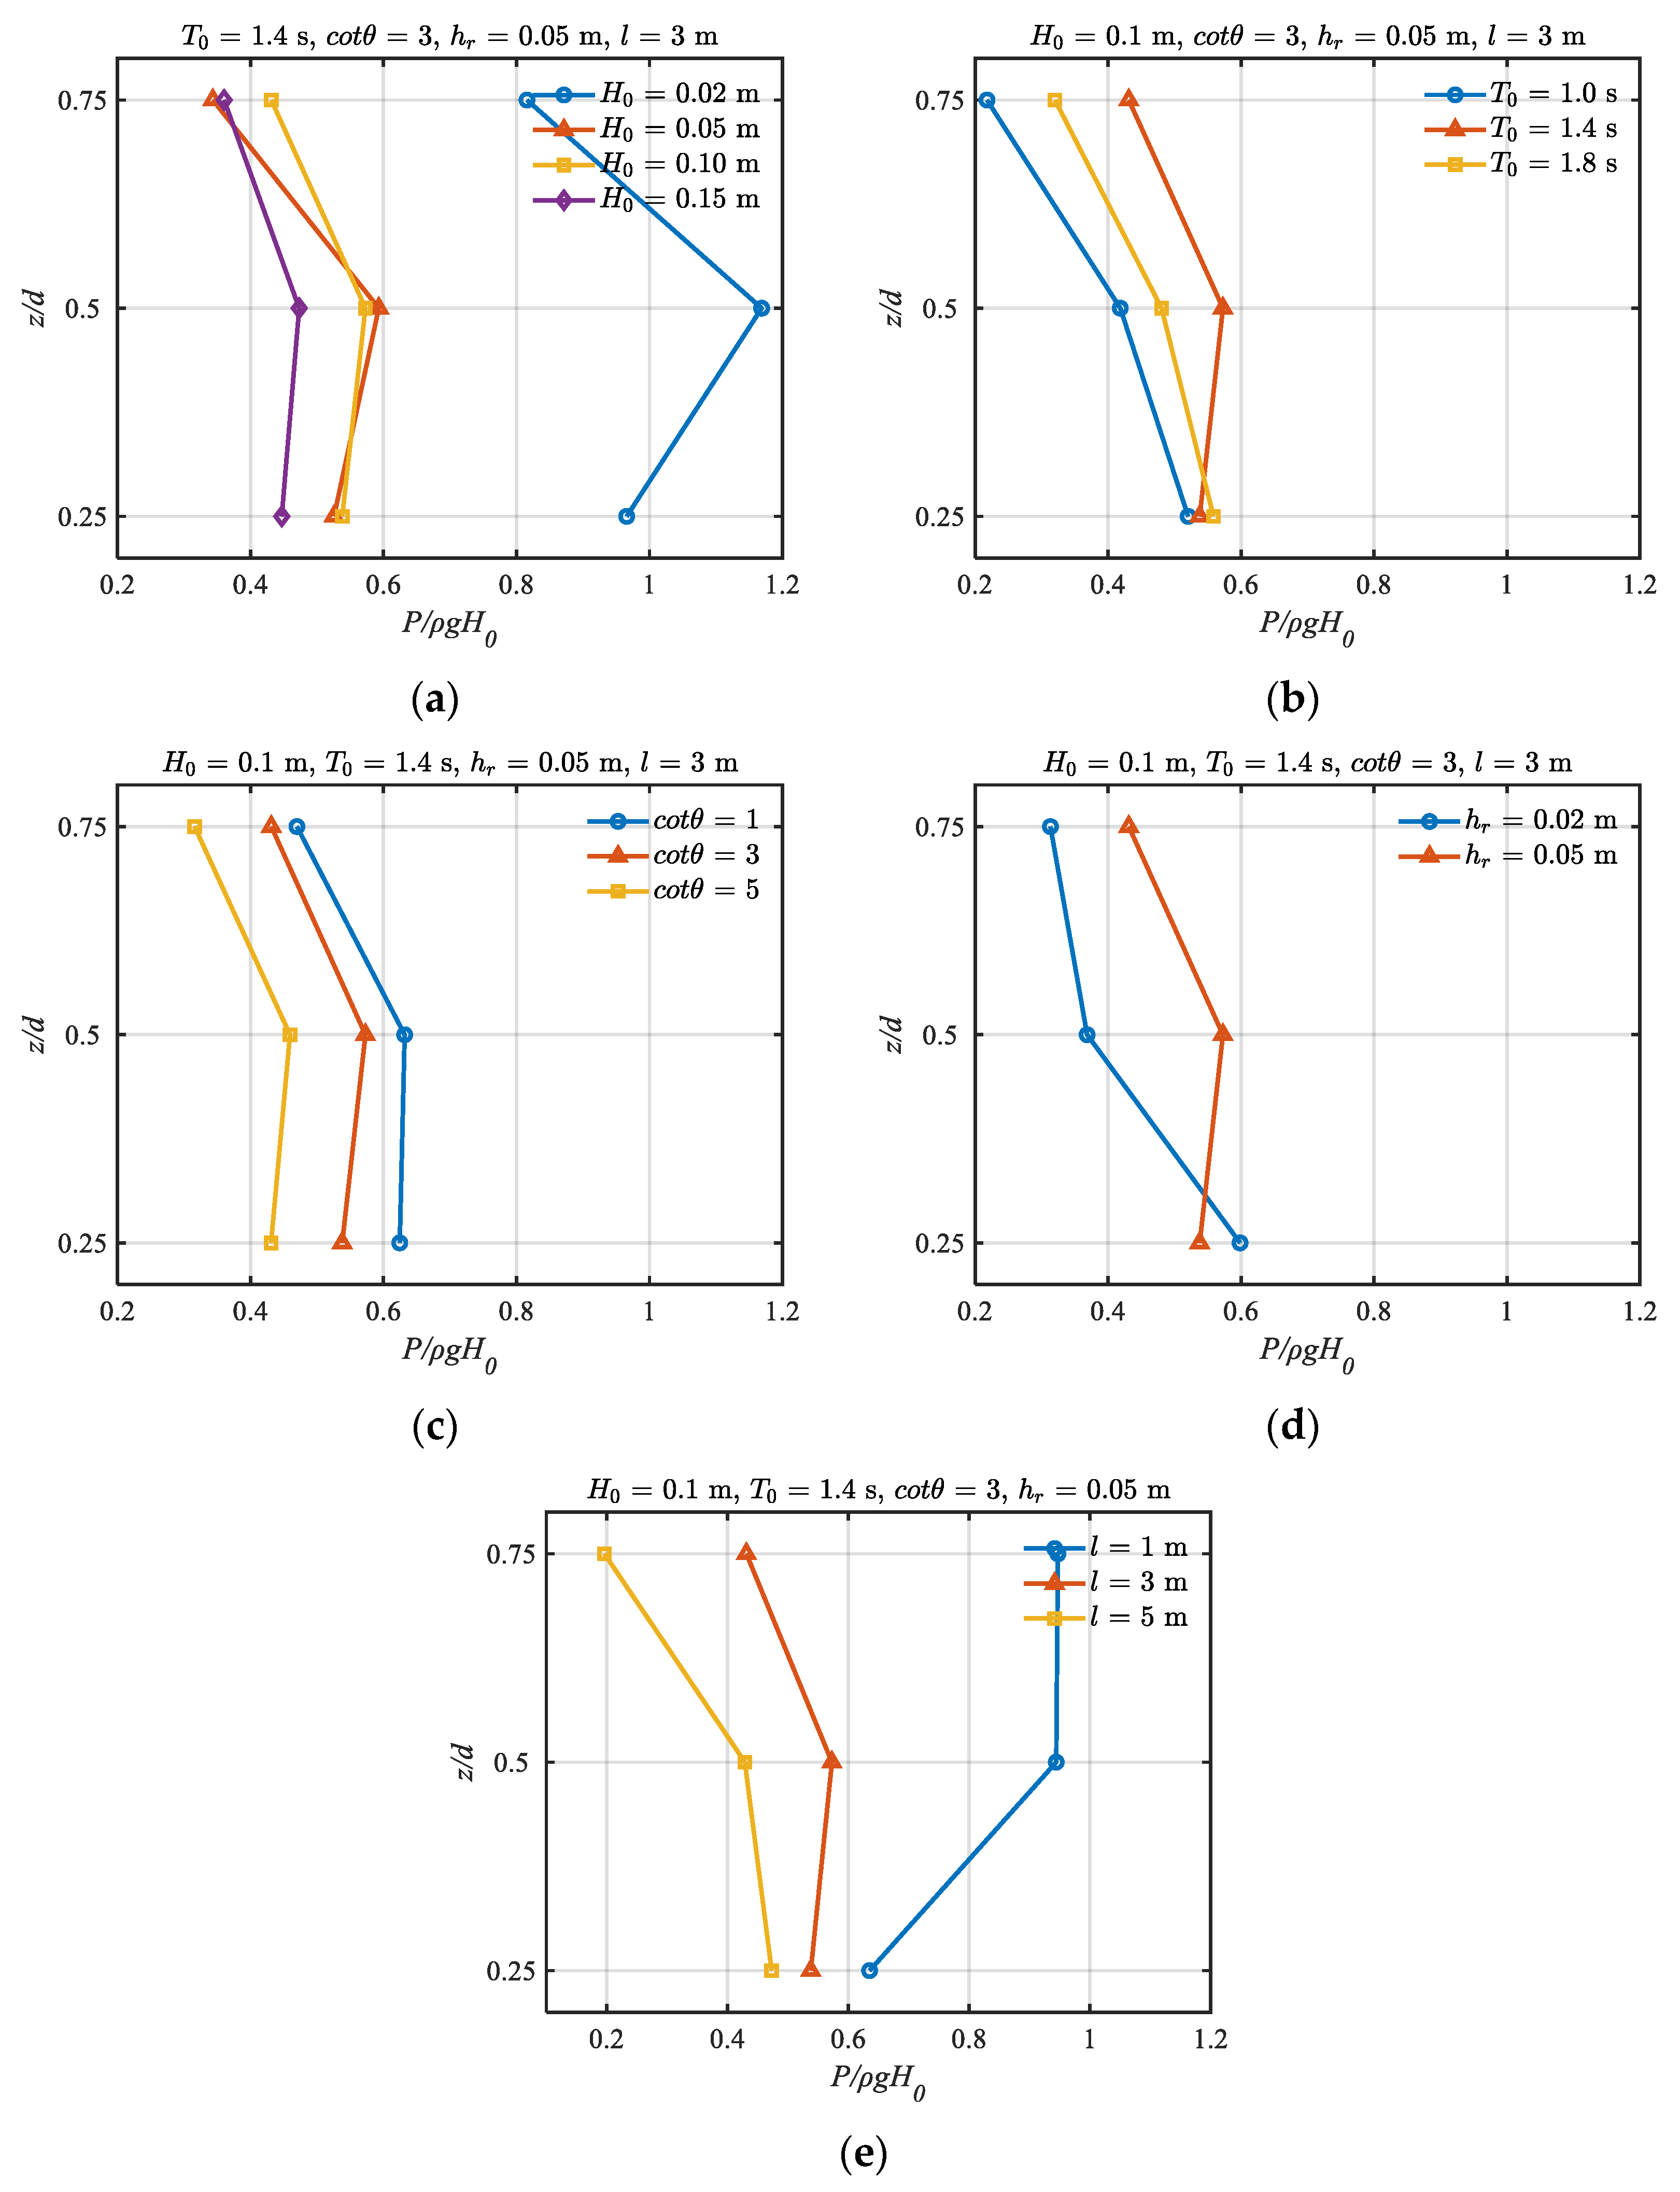
3.2. Wave Pressure Distribution

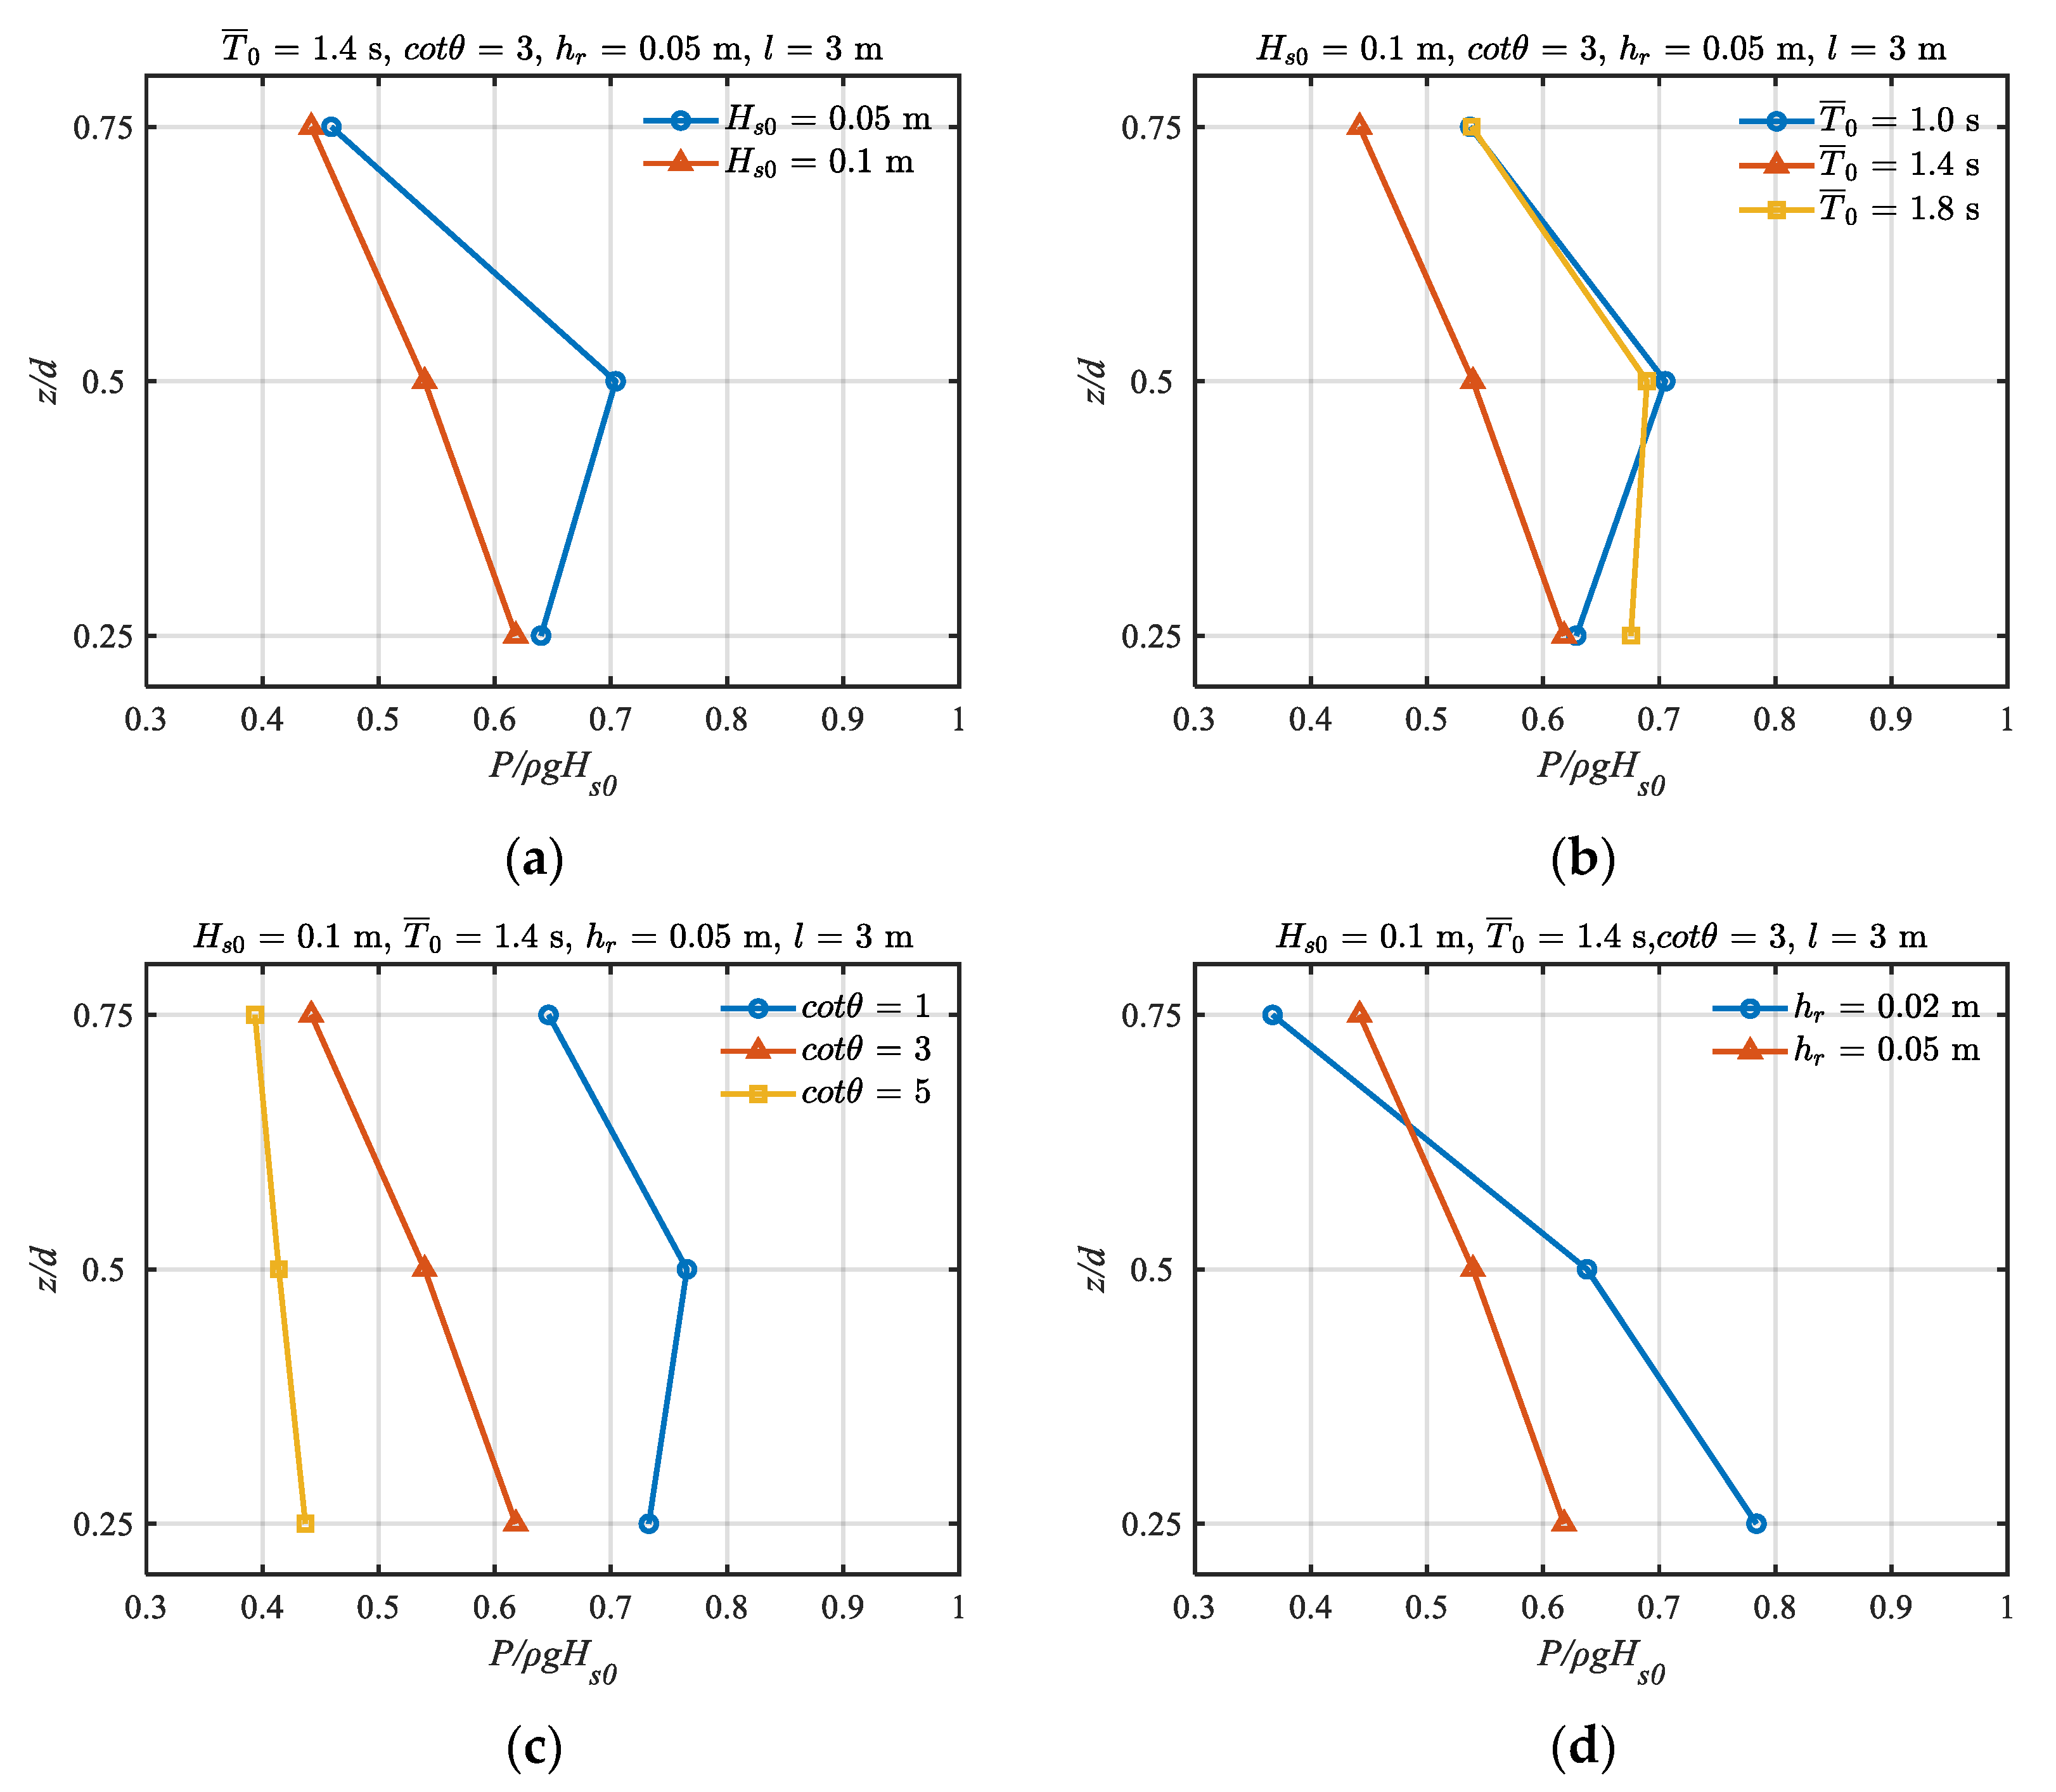
3.2.1. Wave Pressure Distribution on the Vertical Seawall

Figure 15 shows the time histories of wave pressures on the seaward surface of the vertical seawall under regular and irregular wave conditions. For the regular wave, the wave pressure profiles generally appear periodically at three measured points P1–P3; a small peak pressure is observed in the temporal variations. However, the wave pressure profiles are varied randomly for the irregular wave, and the peak values for the irregular wave are larger than those for the regular wave.
Figure 16 shows the regular wave peak pressure distributions on the seaward surface of the vertical seawall for different incident wave heights, wave periods, fore reef slope ratios, still-water depth, and relative distances. It is notable that the peak pressure on the seaward surface of the vertical seawall increases from P1 to P2 but deceases from P2 to P3. The reason may be attributed to the effects of strong turbulence and air bubbles entrained by the breaking waves. The non-dimensional peak pressure is particularly large for H0 = 0.02 m since no wave breaking occurs. The variation in wave pressure with the wave period is not monotonic; the maximum wave pressure is observed at z/h = 0.25 for T ¯ = 1.8 s. However, the peak pressures at z/h = 0.5 and 0.75 for T ¯ = 1.4 s are larger than that for T ¯ = 1.8 s.
It can be seen that for 3 fore reef slopes 1 ≤ cotθ ≤ 5, the peak pressure increases slightly from P1 to P2 and then decreases along the seaward surface of the vertical seawall. With the decrease in the fore reef slope ratio, the peak pressure decreases due to the wave energy dissipation with the steeper slope ratio. Compared to the case of cotθ = 1, the peak pressure is reduced to 67.2% of that at cotθ = 5 for z/h = 0.75. For small still-water depth hr = 0.02 m, the peak pressure at z/h = 0.25 is larger than that for hr = 0.05 m but becomes smaller than those for hr = 0.05 m at z/h = 0.5 and 0.75. The relative distance has a significant effect on the peak pressure distribution along the seaward surface of the vertical seawall. It is evident that the peak pressure decreases as the relative distance increases. This may be explained by the fact that as the relative distance increases, entrained air bubbles with breaking waves have a greater impact on the wave impacts. It can be seen that at z/h = 0.25, the effect of the relative distance on the wave pressure distribution is not obvious. However, the discrepancies of the peak pressures for 1 m ≤ l ≤ 5 m increase with the increase in h, especially for the location of z/h = 0.75. The peak pressure for l = 1 m is almost 4.83 times that for l = 5 m. For the cases of l = 1 m and 3 m, the wave impinges on the seaward surface of the vertical seawall, leading to a large impact force. When l = 5 m, the wave propagates over the reef flat; most of the wave energy is dissipated in the front of the vertical seawall, resulting in a significant reduction in peak pressure.
For the case of an irregular wave, as shown in Figure 17, the variations in peak pressures with the incident significant wave height, wave peak period, fore reef slope, relative distance, and still-water depth on the reef flat are similar to those of the regular wave condition. However, the peak pressure for Hs0 = 0.1 m is 1.49 times that for the regular wave. Distinct from the regular wave, the wave pressure increases from hr = 0.05 m to 0.075 m for l = 1 m; the maximum wave pressure is observed at z/h = 0.75. At a small still-water depth hr = 0.02 m, the peak pressure at z/h = 0.25 for the irregular wave is much larger than that for the regular wave.

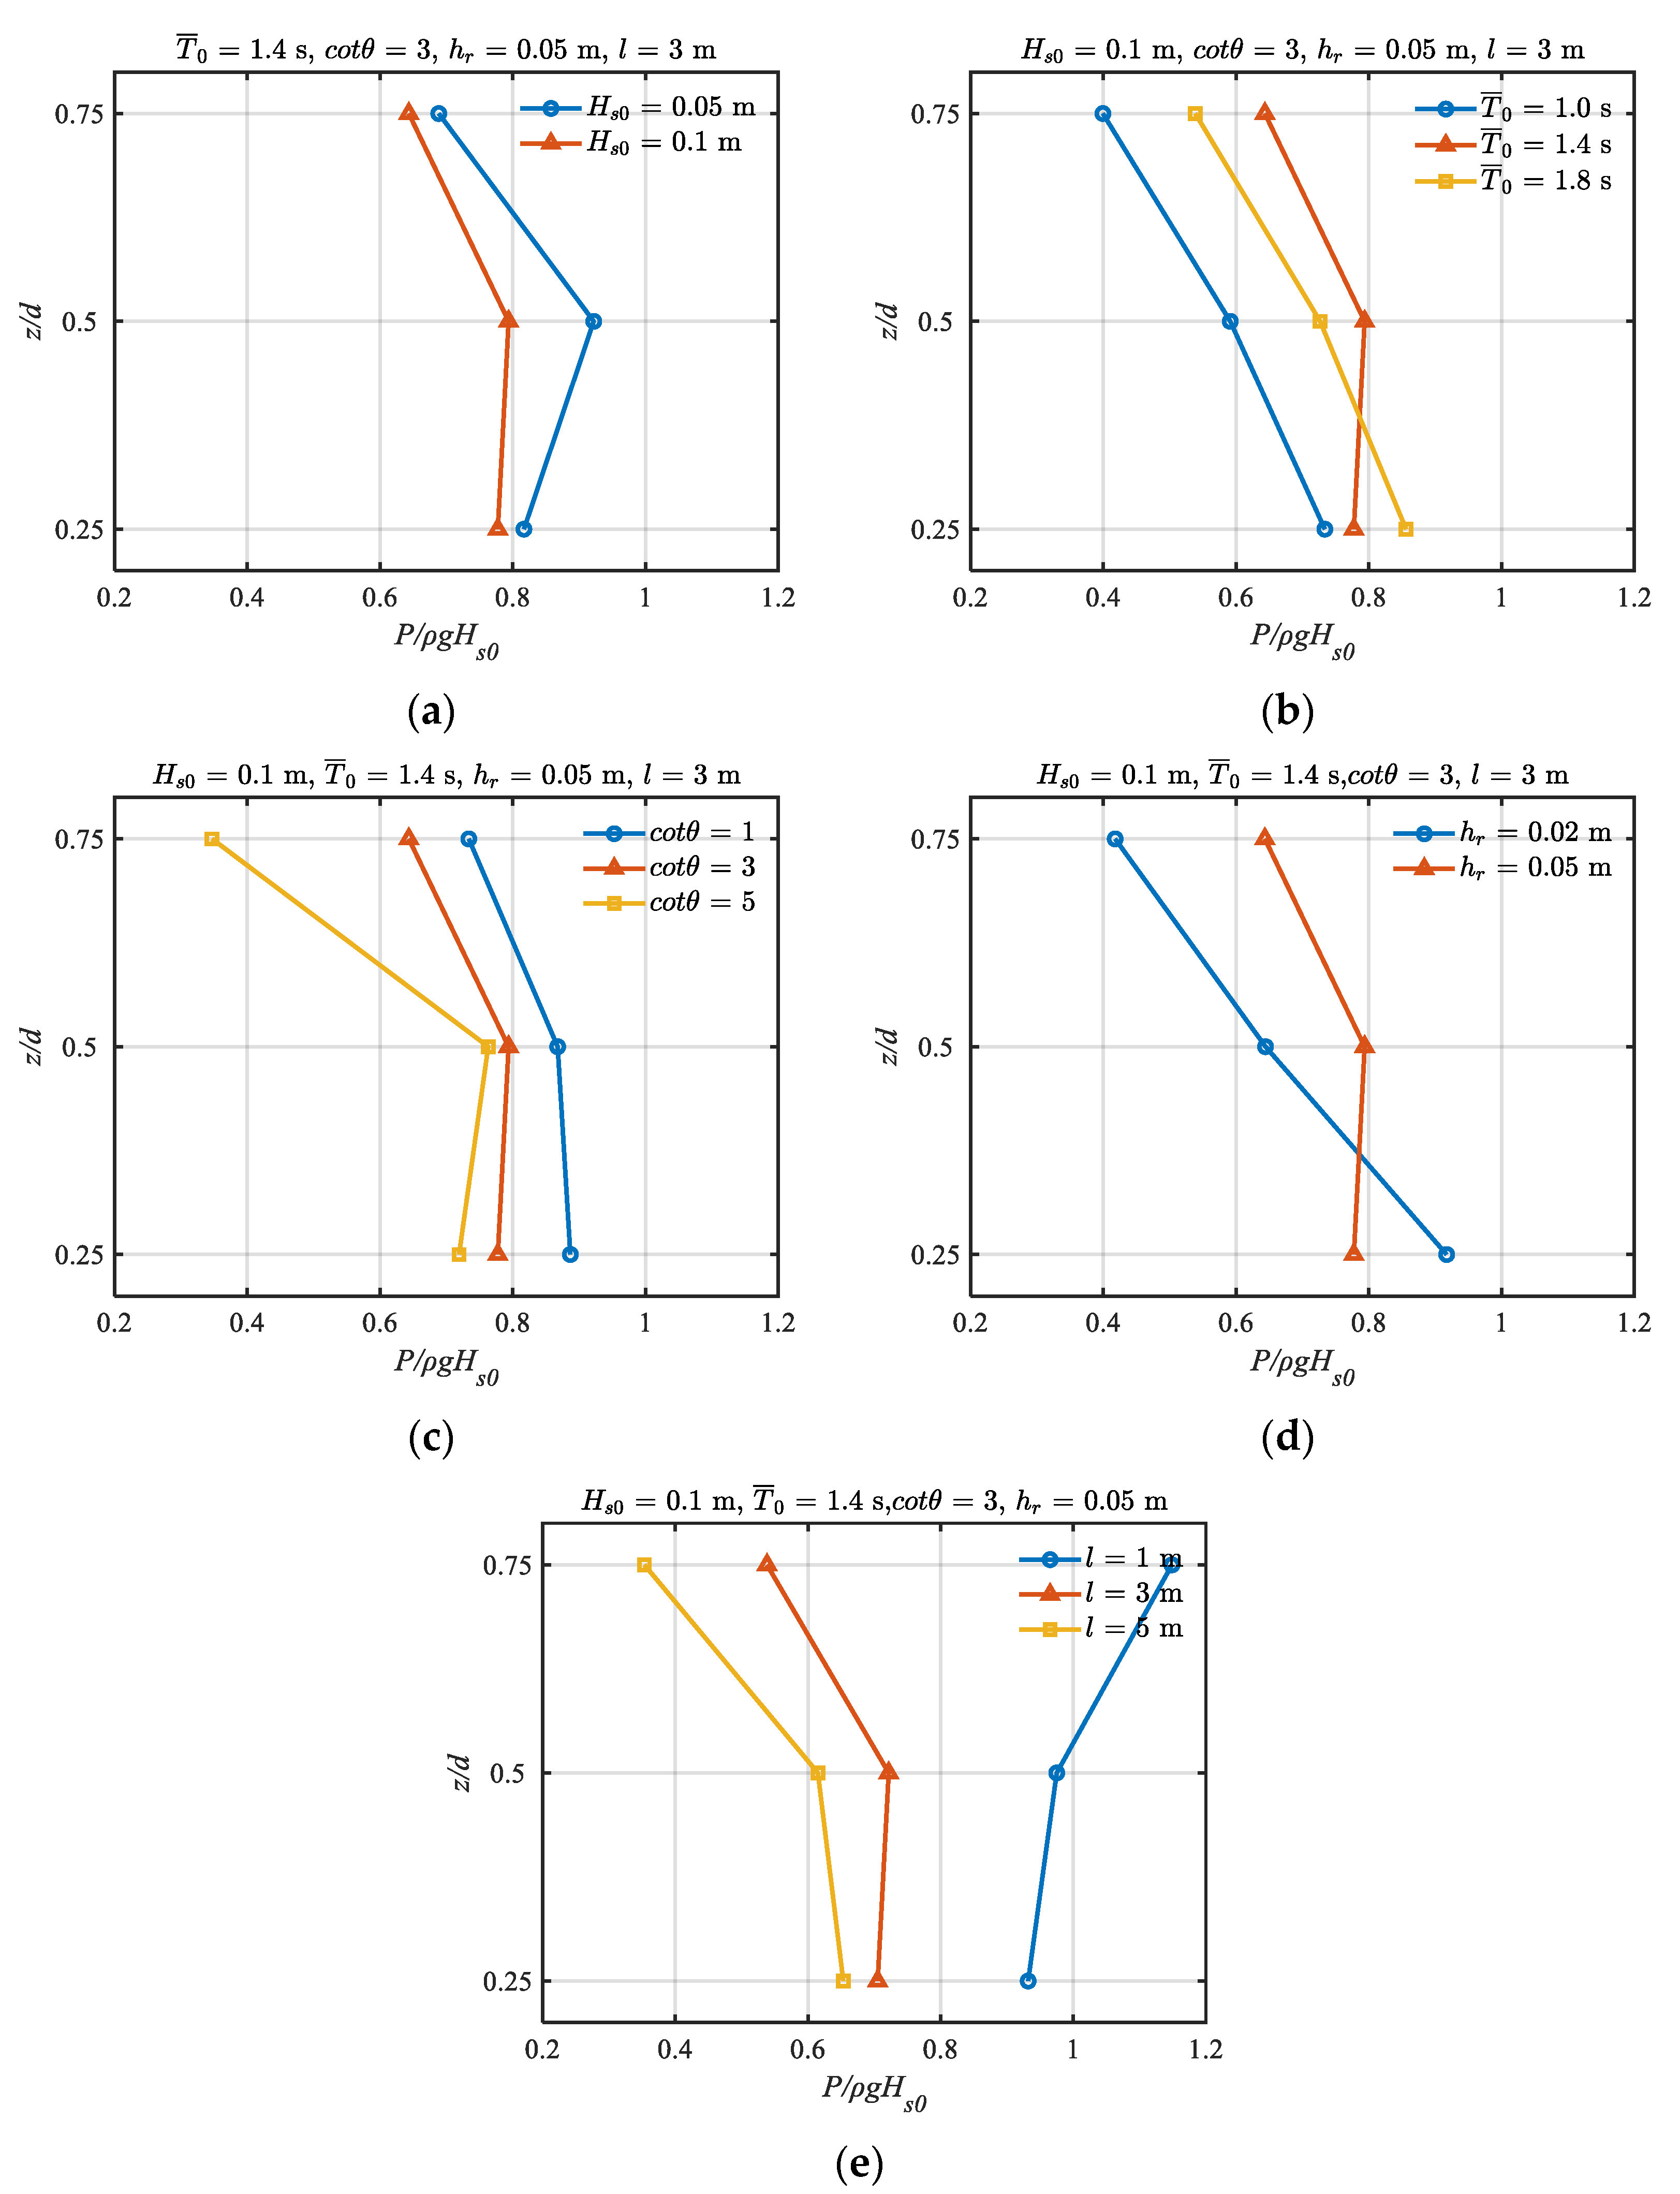
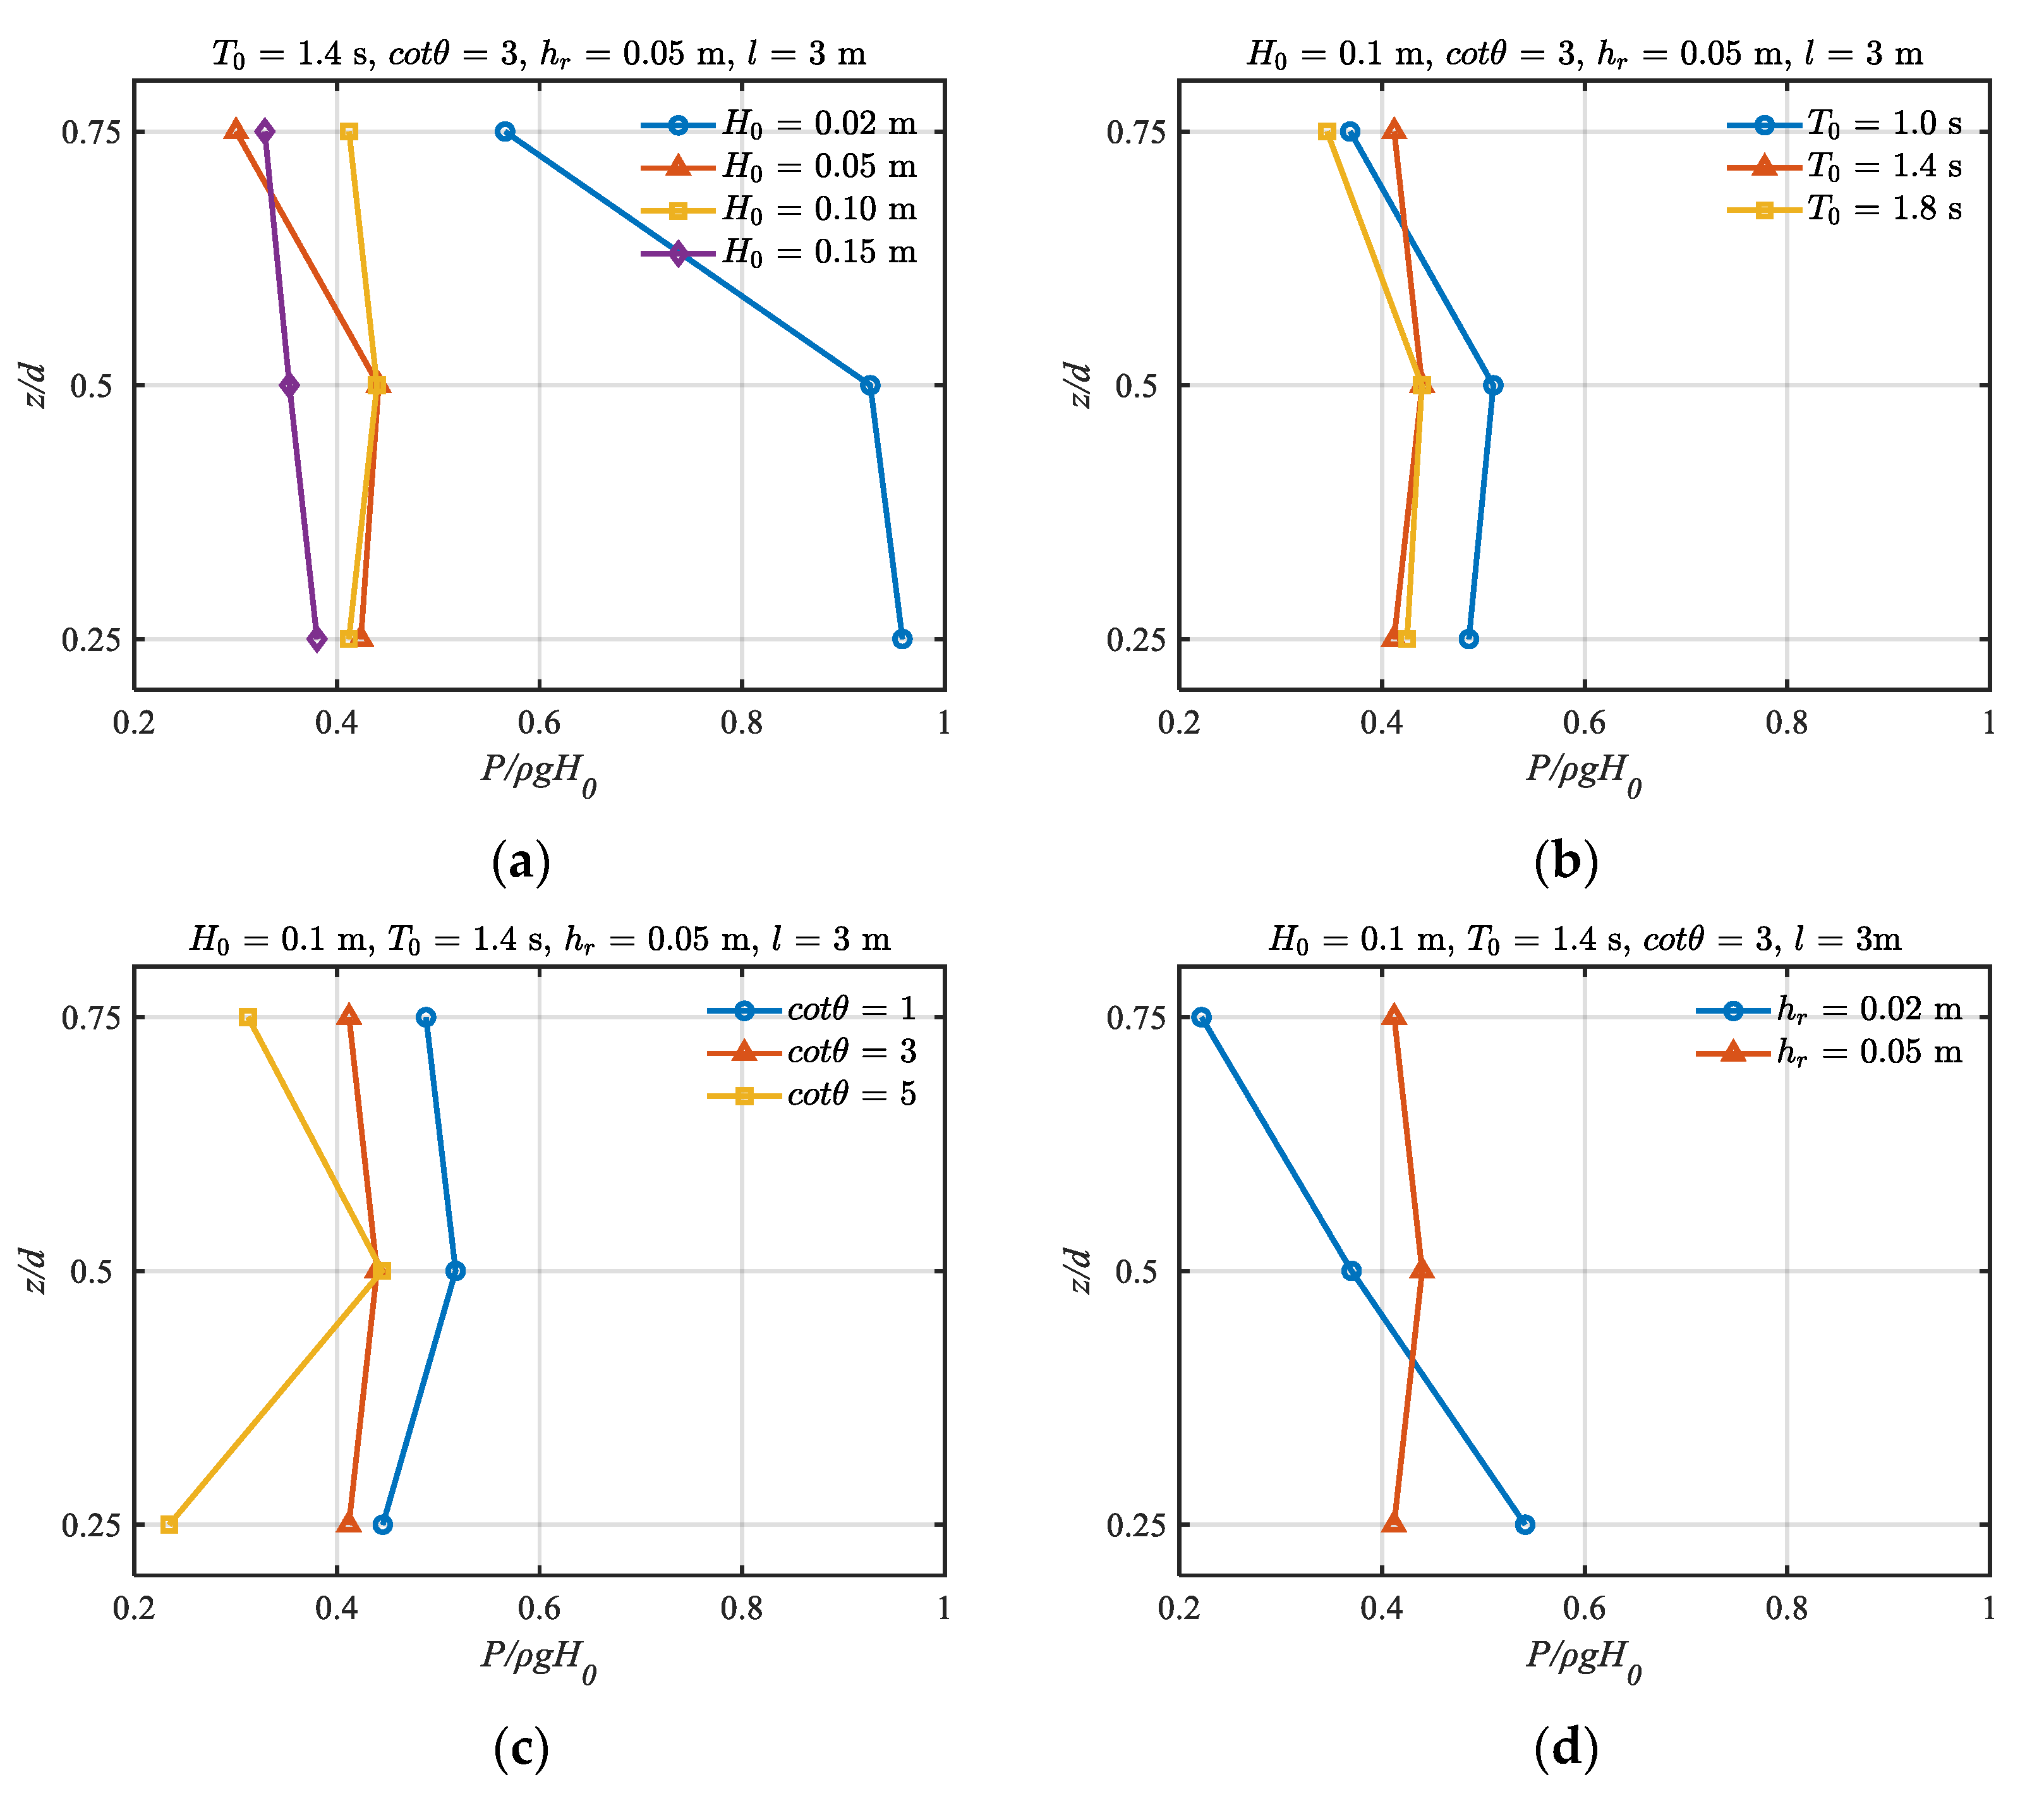
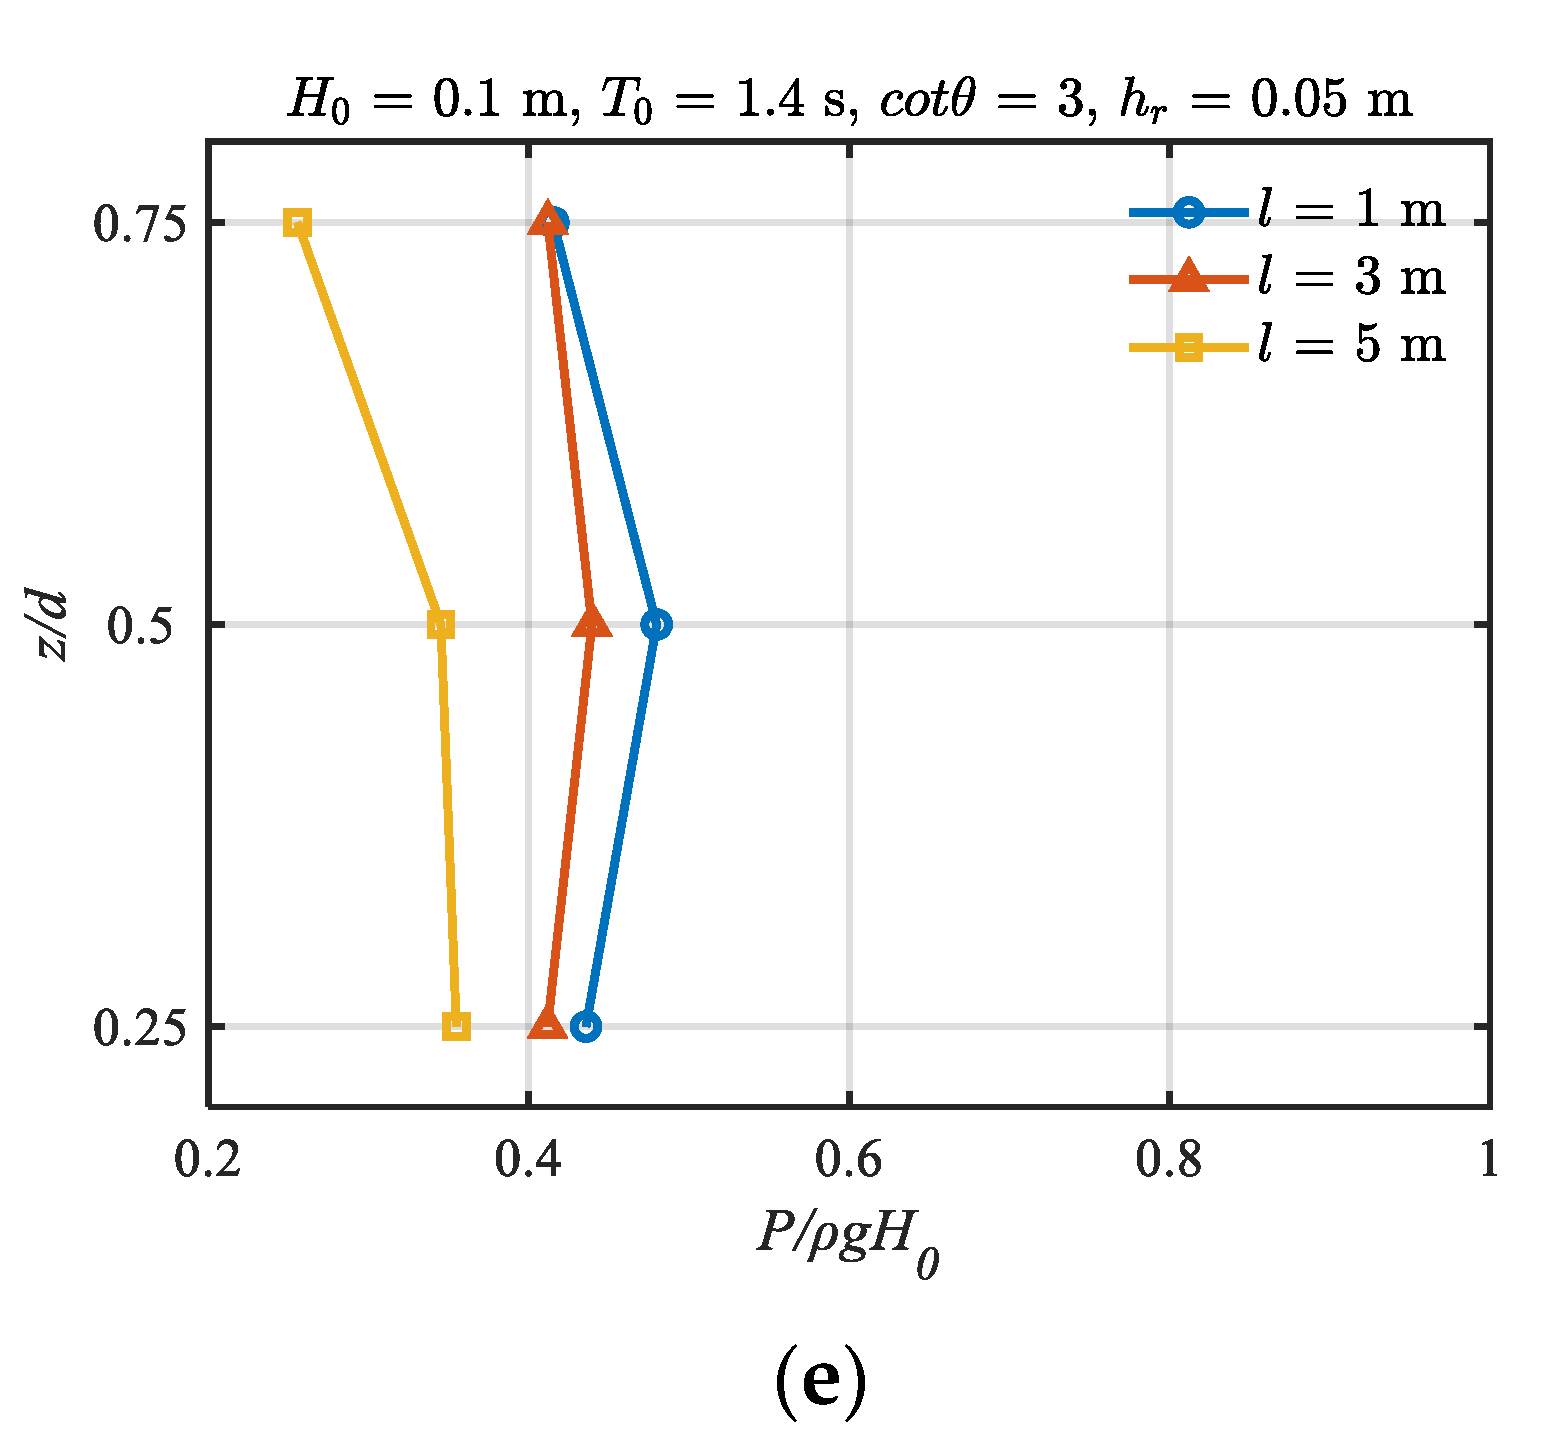
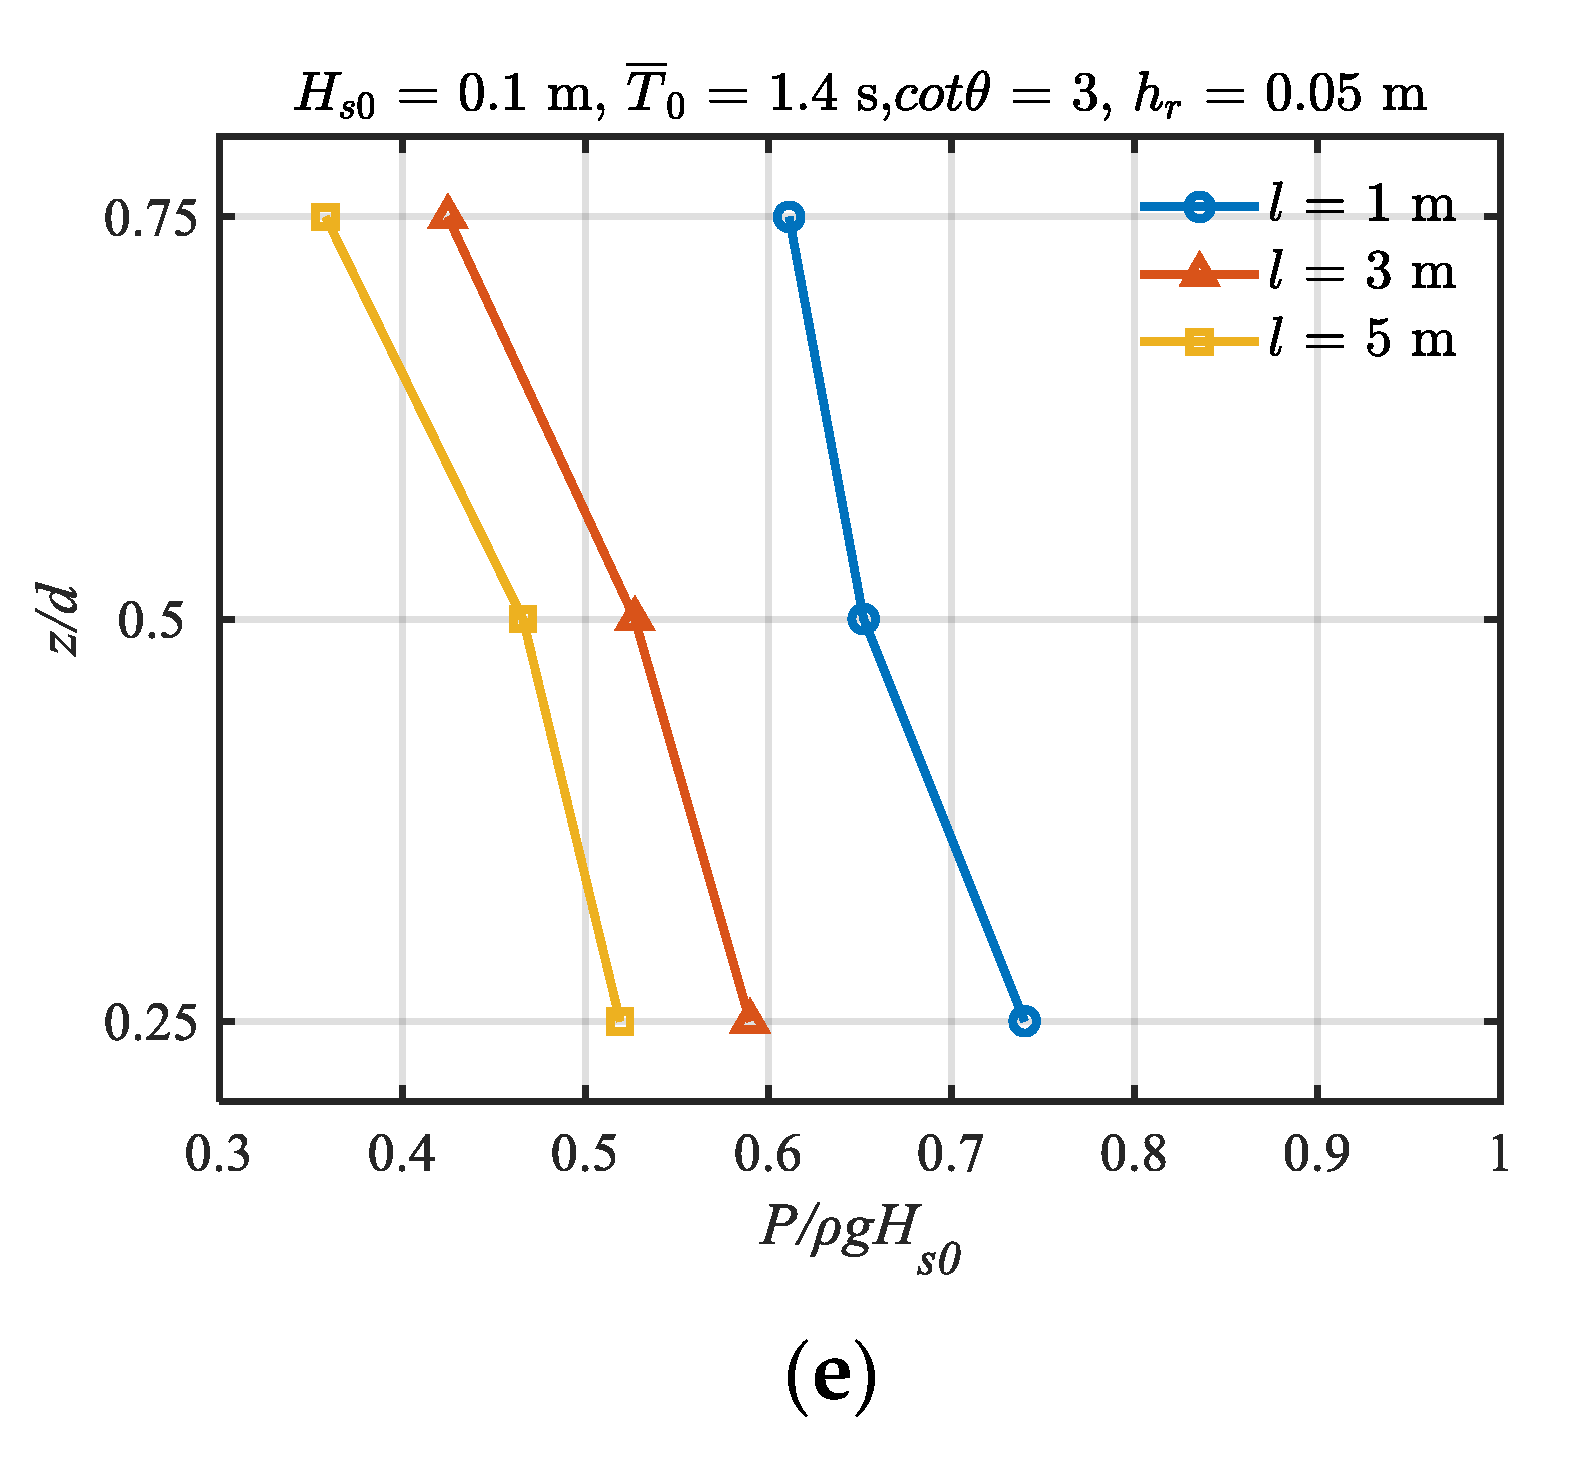
3.2.2. Wave Pressure Distribution on the Sloped Seawall

Figure 18 and Figure 19 show the distributions of regular and irregular wave peak pressures along the seaward surface of the sloped seawall for different cases, respectively. Similar to the case of the vertical wall, the incident wave height has a significant effect on the peak pressure distribution for the sloped seawall. The peak pressure increases with the increase in incident wave height at each location along the seaward surface of the sloped seawall. The wave period has a small effect on the peak pressure distributions. The variation in peak pressure with the wave period is not monotonous. The maximum wave pressure is observed at z/h = 0.5 for T = 1.0 s. With the increase in relative distance l and fore reef slope cotθ, the peak pressures at three locations decrease. Compared with the large still-water depth hr = 0.05 m, the wave pressure on the sloped seawall is significantly decreased with the increase in z/h at hr = 0.02 m. The energy dissipation caused by wave breaking decreases with the increase in still-water depth hr, resulting into more transmitted wave energy impacted on the sloped seawall. The larger still-water depth on the reef flat leads to less turbulence dissipation, results in a more significant pressure on the sloped seawall. As the still-water depth hr increases from 0.02 m to 0.05 m, the peak pressure increases from 0.22 to 0.41 at z/h = 0.75, but decreases from 0.54 to 0.41 at z/h = 0.25.
The variation trends in the peak pressures on the seaward surface of sloped seawall with the incident significant wave height, mean wave period, relative distance, fore reef slope and still-water depth for irregular wave are similar to those of regular wave. However, the peak pressures at the same variation parameters for irregular wave are much larger than those for regular wave. Different from those of regular wave, the maximum pressure for Hs0 = 0.05 m is observed at the location z/h = 0.5, and the peak pressures at z/h = 0.25 and 0.5 for hr = 0.02 m are larger than those for hr = 0.05 m, and smaller at z/h = 0.75. For the relative distance l = 1 m, different from the case of regular wave, the maximum wave pressure is observed at z/h = 0.25 for the irregular wave.

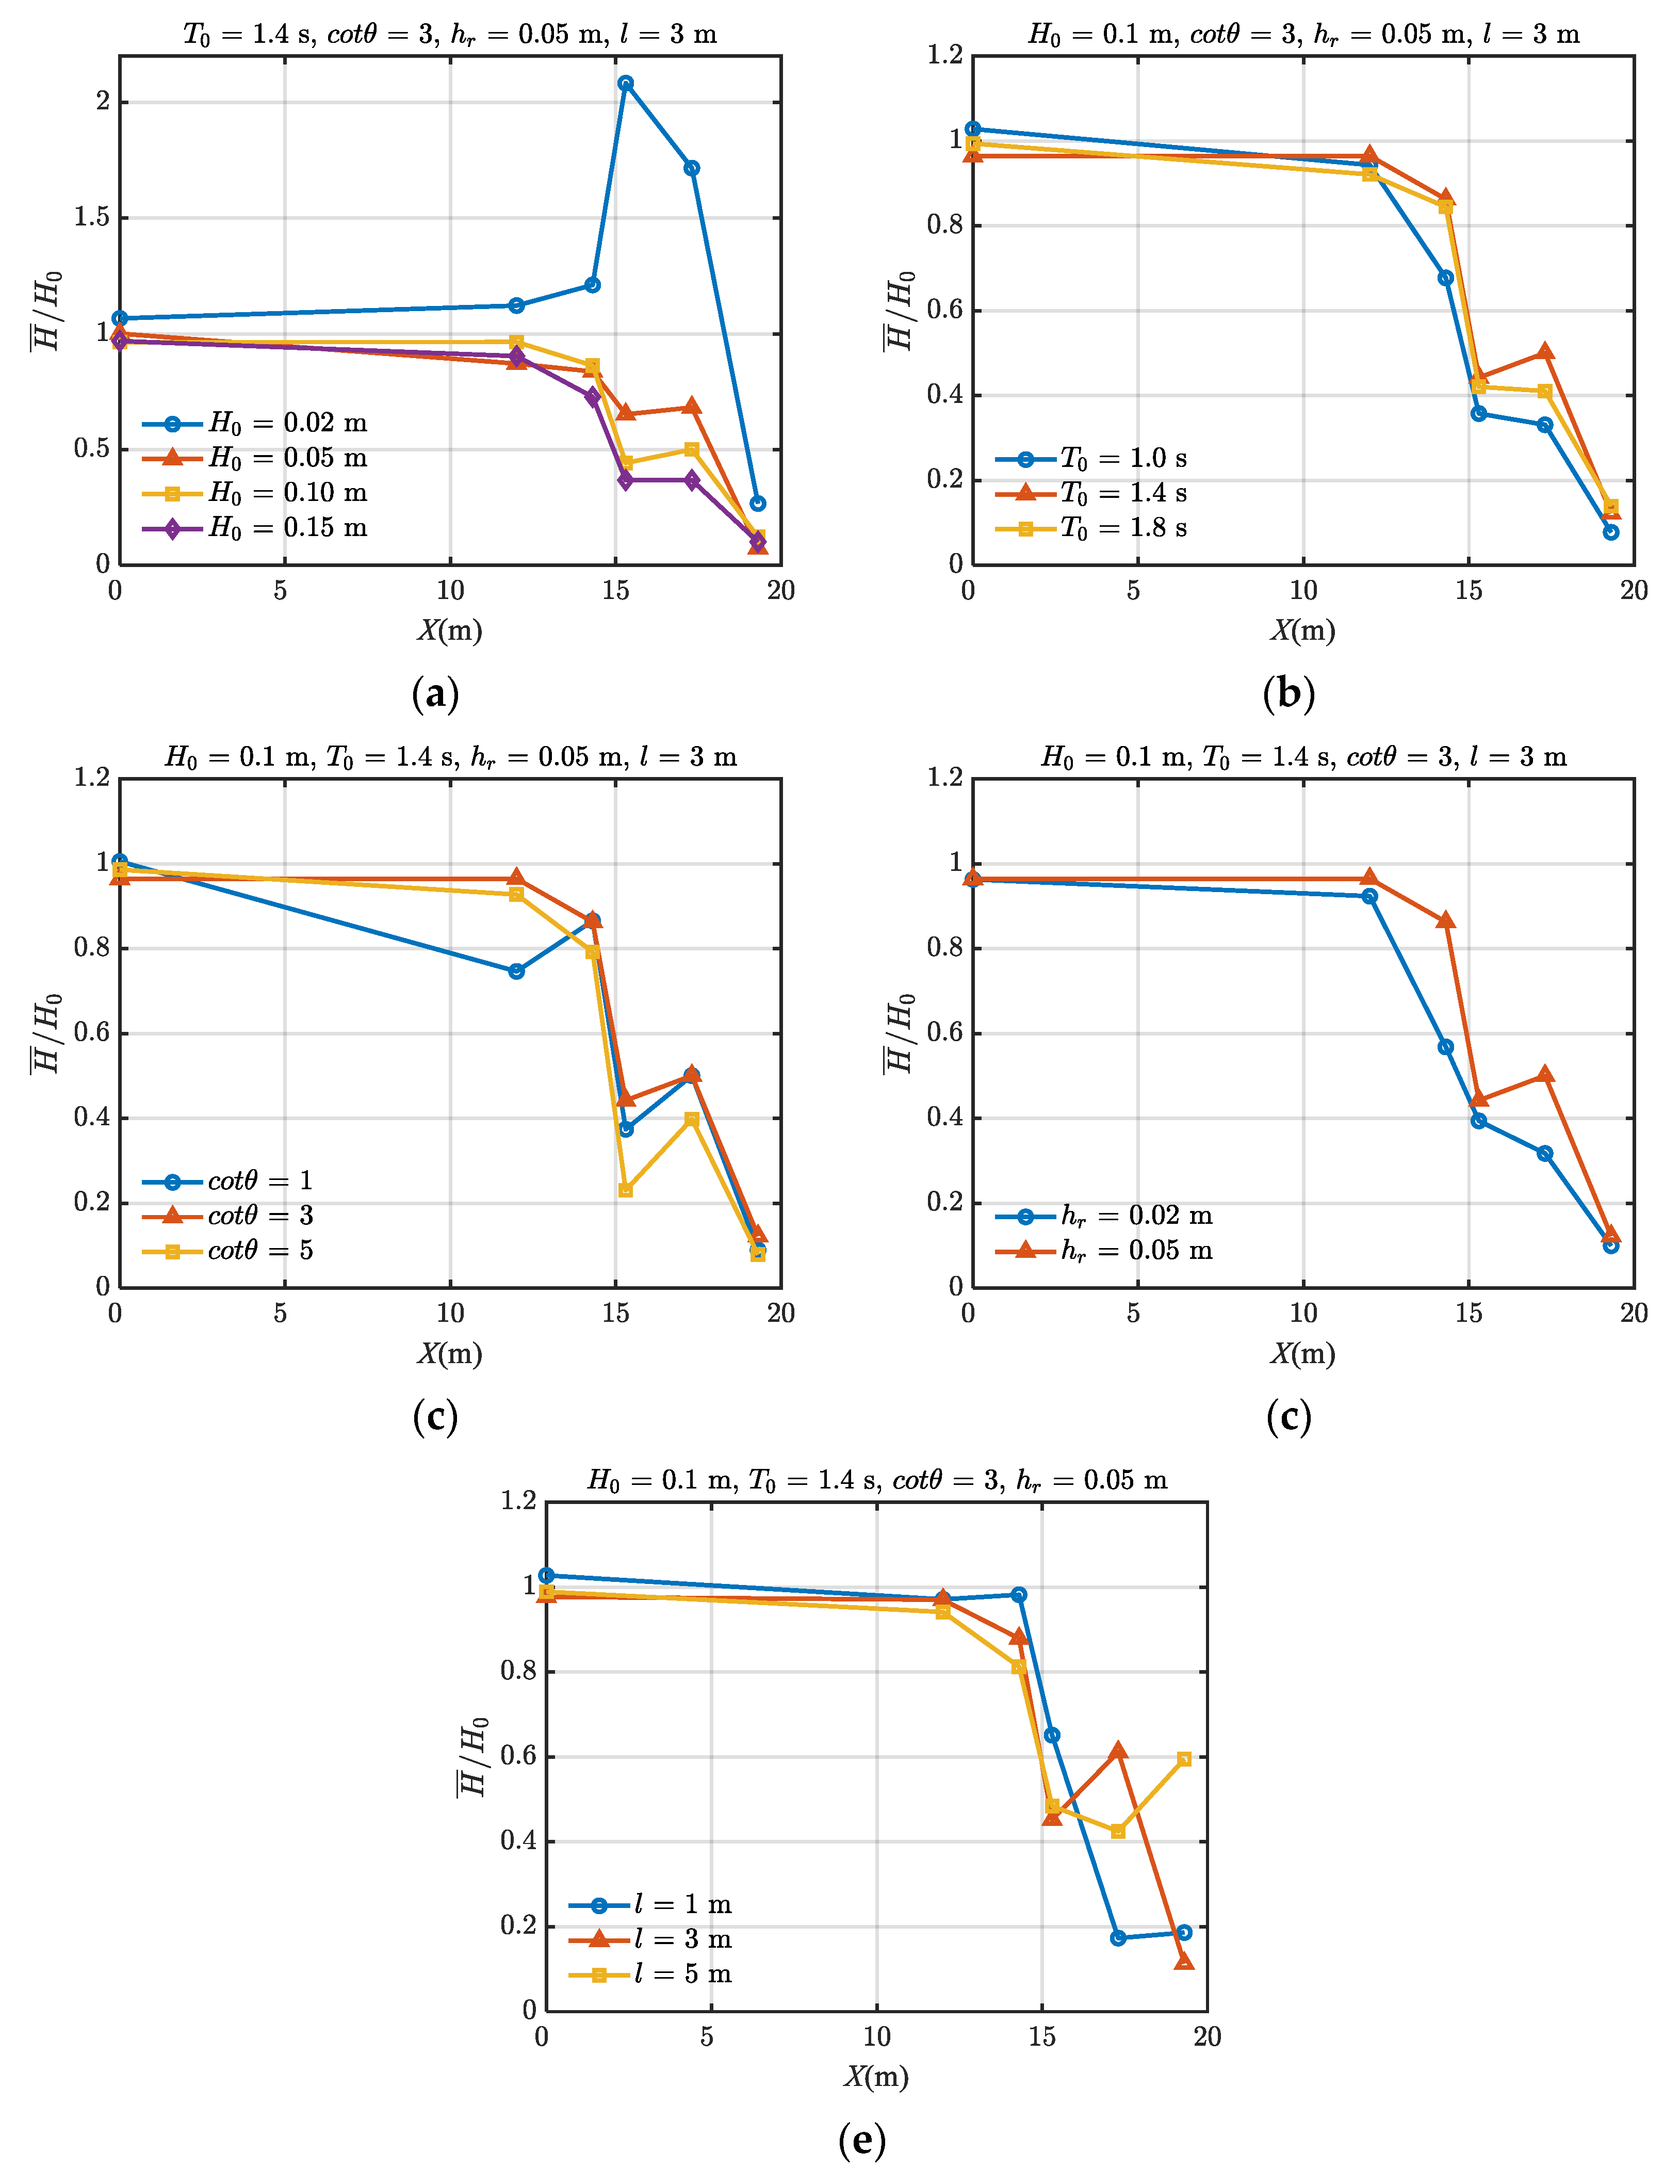
3.3. Wave Overtopping

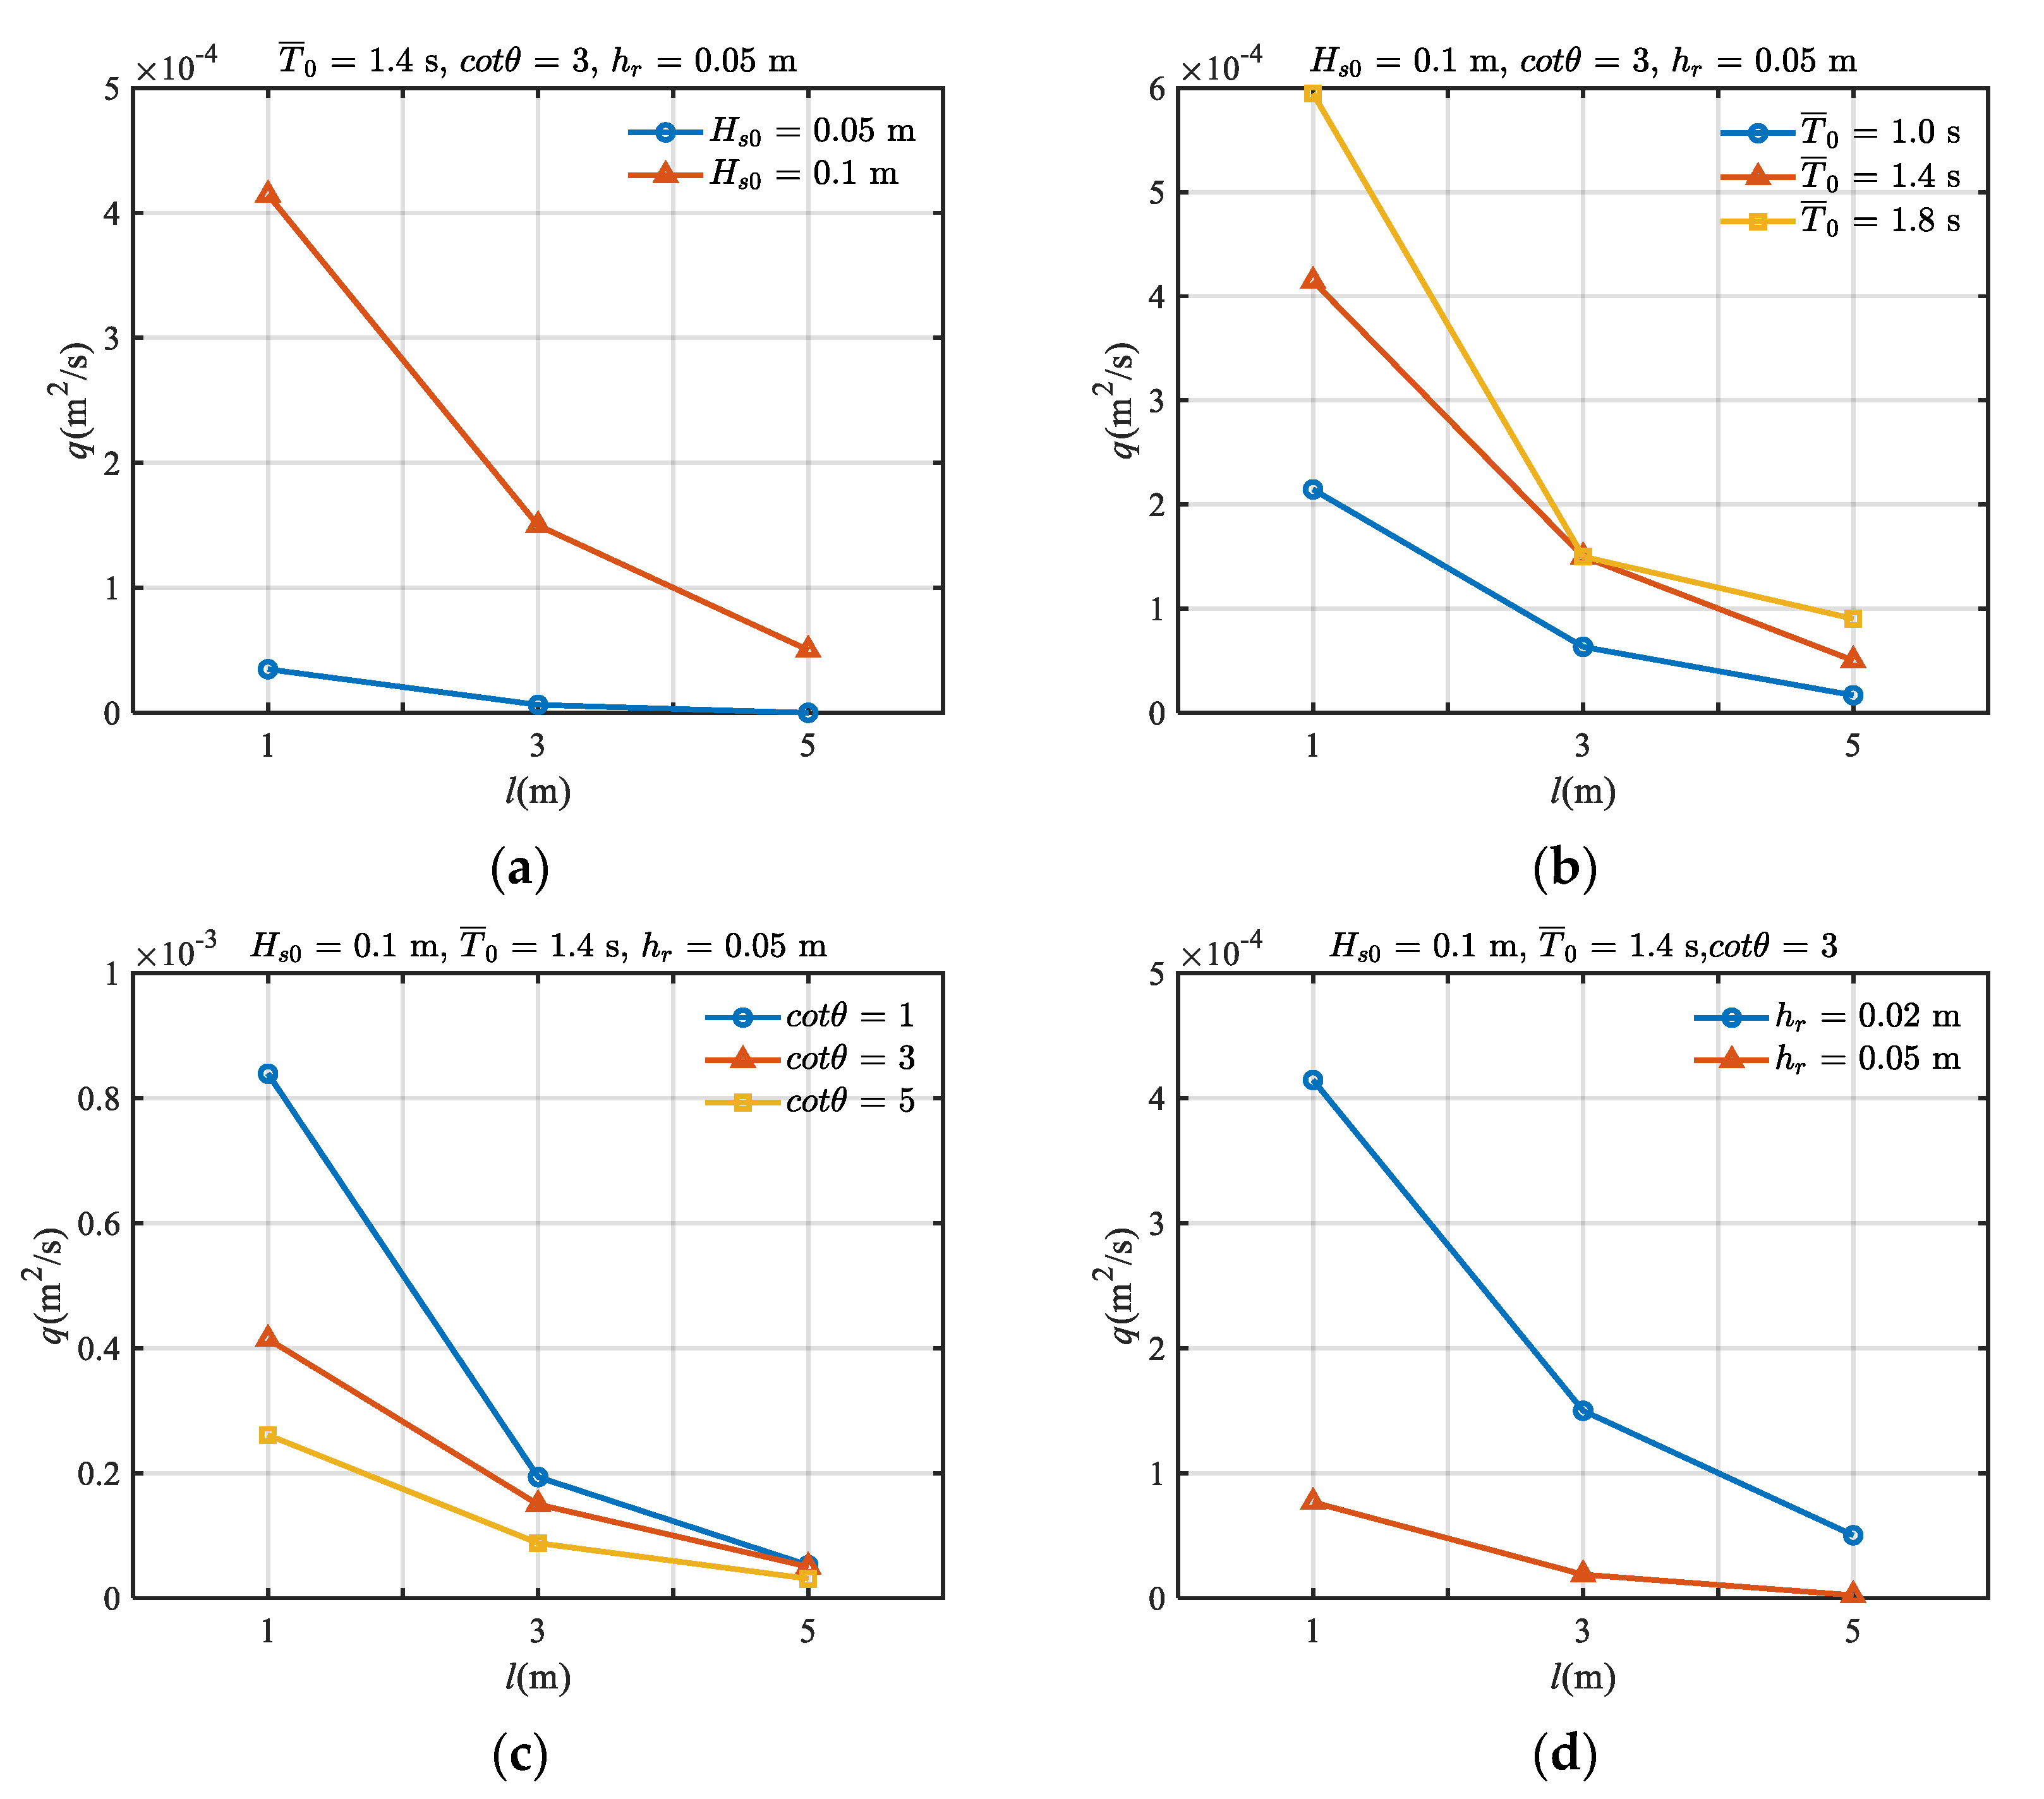
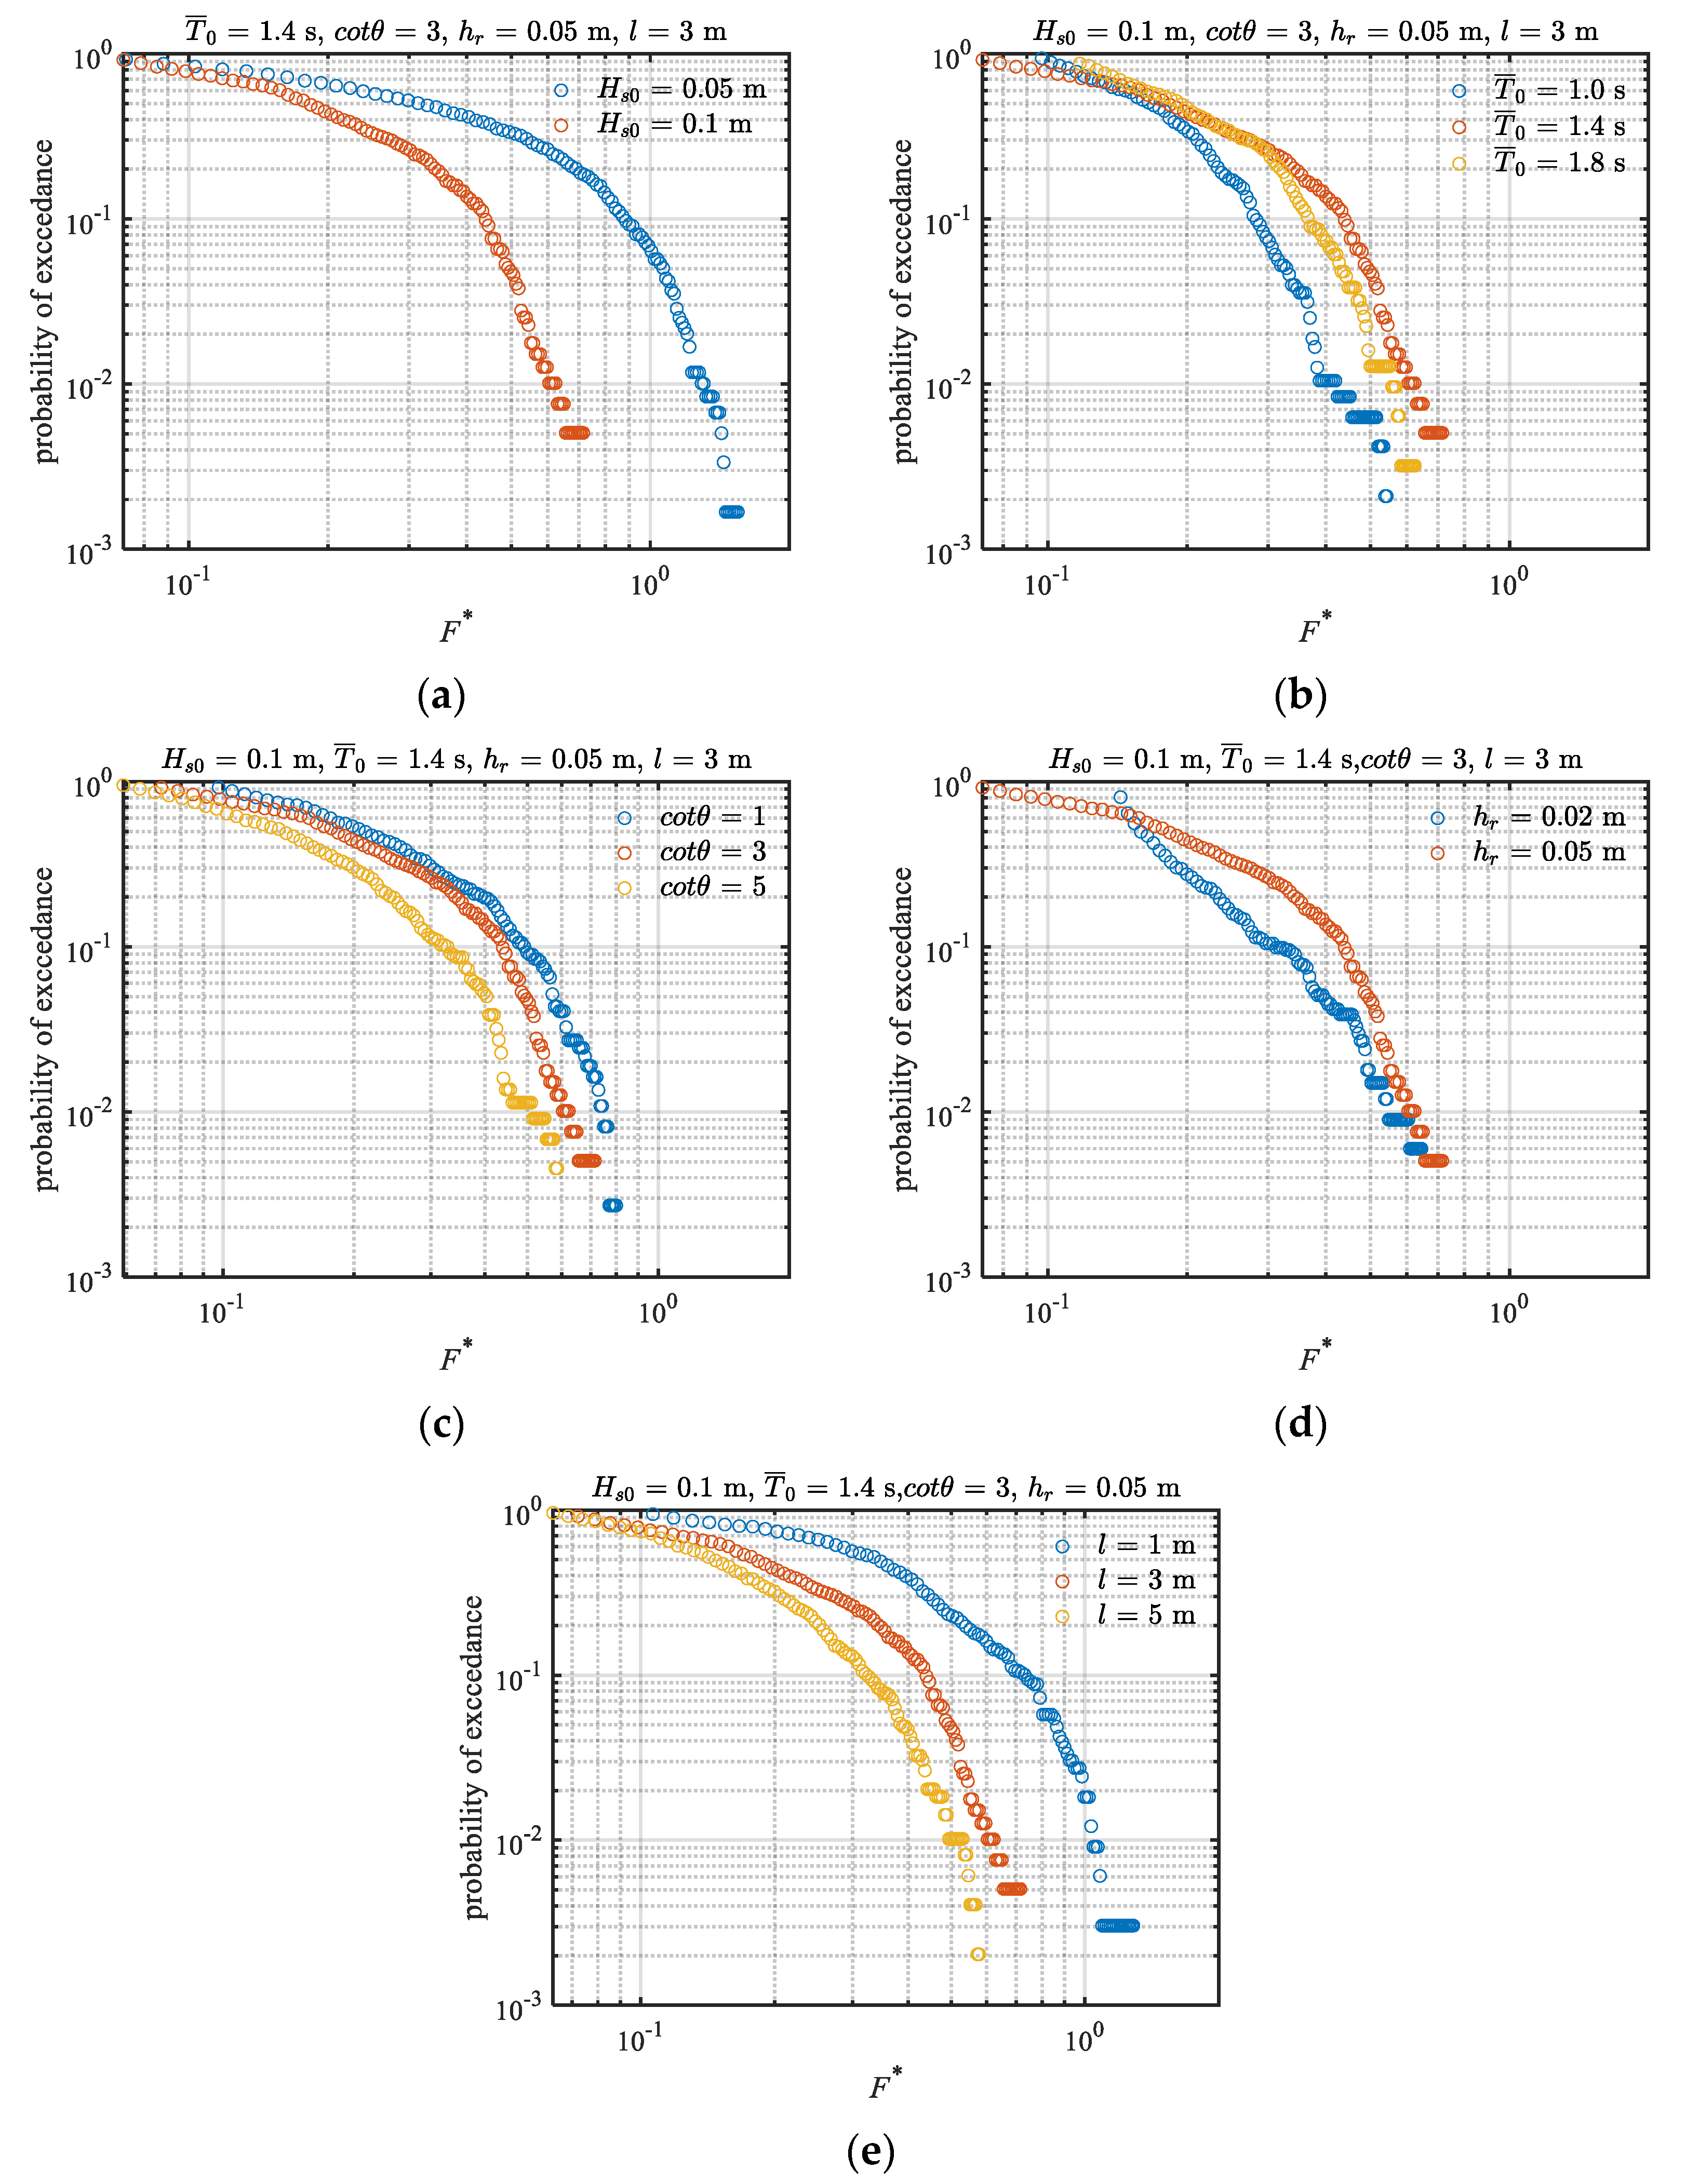
3.3.1. Wave Overtopping over the Vertical Seawall

Figure 20 and Figure 21 show the variations in mean wave overtopping discharge q with the relative distance between the vertical seawall and fore reef edge at different incident wave heights H0, wave periods T0, fore reef slope ratios cotθ and still-water depth hr for regular and irregular waves, respectively. It can be seen that the mean wave overtopping discharge per unite width q increases with the increase in incident wave height and wave period for both regular and irregular waves. With the increase in relative distance, the mean wave overtopping discharge is significantly reduced at l = 5 m, the reduction rate approaches to 78.9% for H0 = 0.15 m. It is interesting to note that for small incident wave heights H0 ≤ 0.05 m, the wave overtopping phenomenon is not obvious, at the relative distances l = 3 m and 5 m, the mean wave overtopping discharge q is 0, which indicates that most of the breaking wave energy has been dissipated in the surf zone, no wave overtopping phenomenon occurs in the front of vertical seawall. With the decrease in cotθ, the mean wave overtopping discharge q increases. At the relative distance l = 5 m, the mean wave overtopping discharge become almost the same at three different slope ratios cotθ. As the still-water depth hr increases, the mean wave overtopping discharge q significantly increases. At hr = 0.02 m, the water depth is relatively small since the wave could not overtop over the seawall crest. The mean wave overtopping discharge q drops dramatically when the relative distance l increases from 1 m to 5 m due to wave breaking in the wave surf zone, the energy dissipation increases with the increase in relative distance. However, q approaches to a constant when the seawall moves further shoreward.

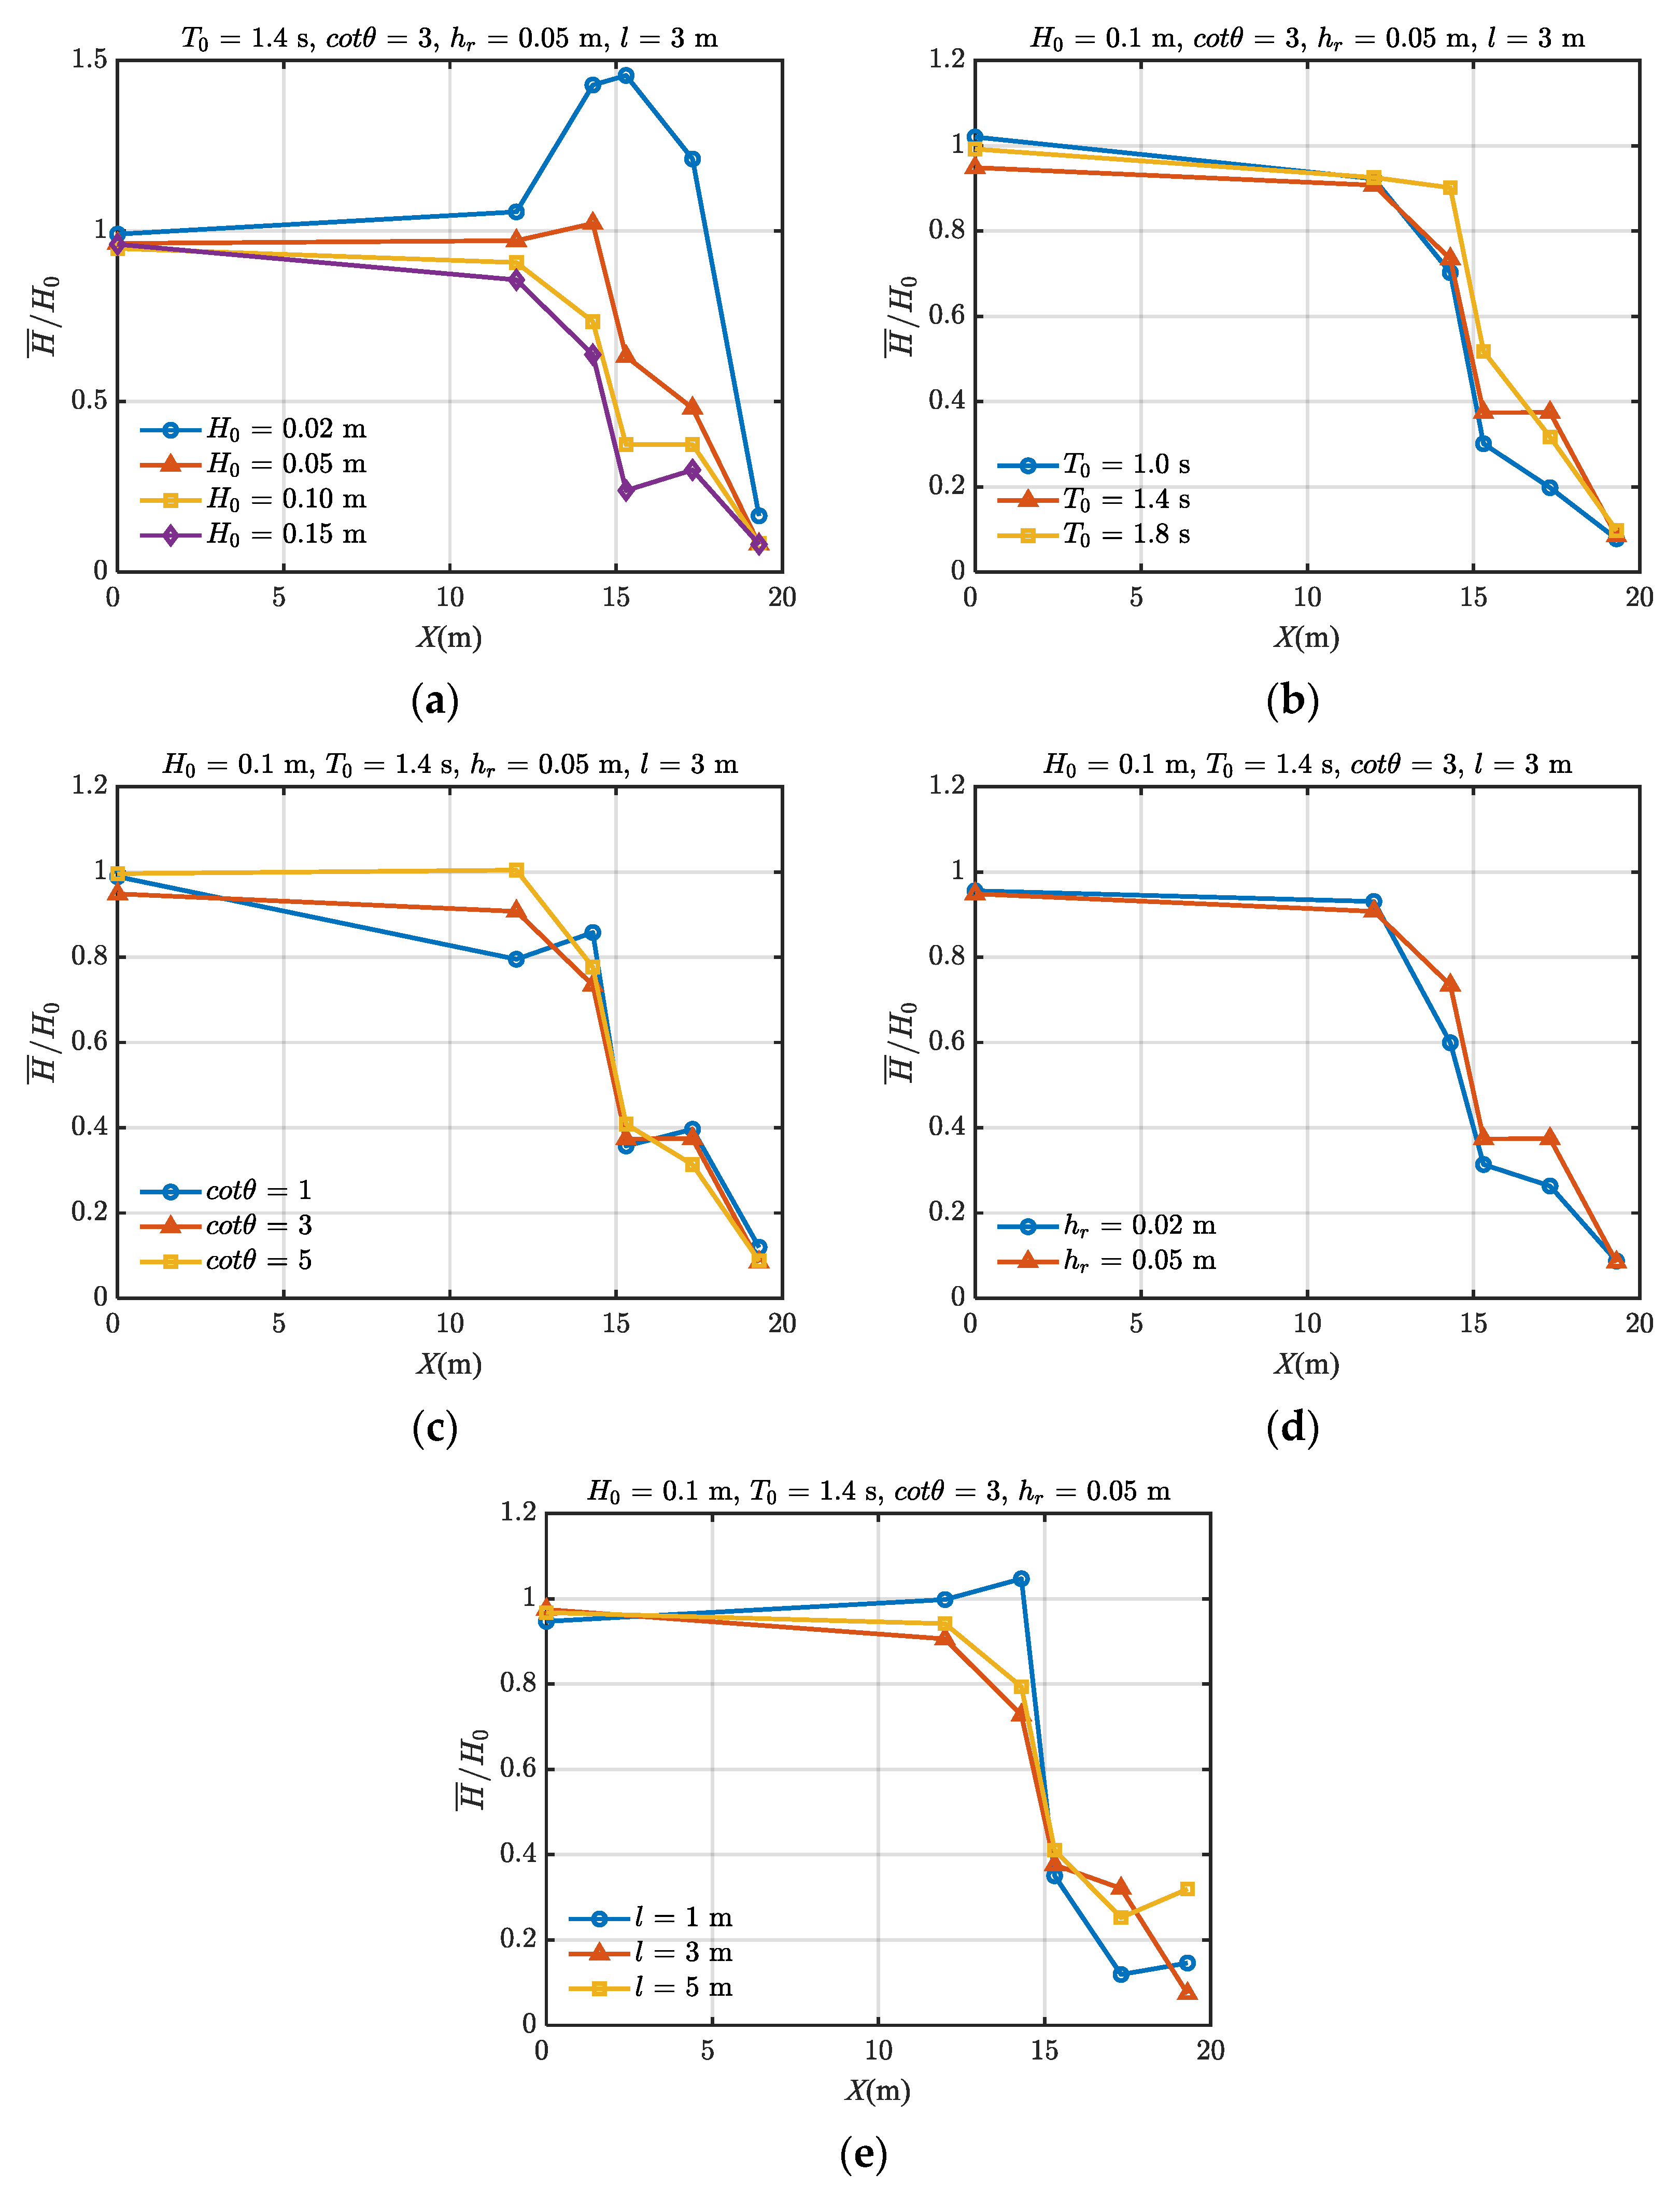
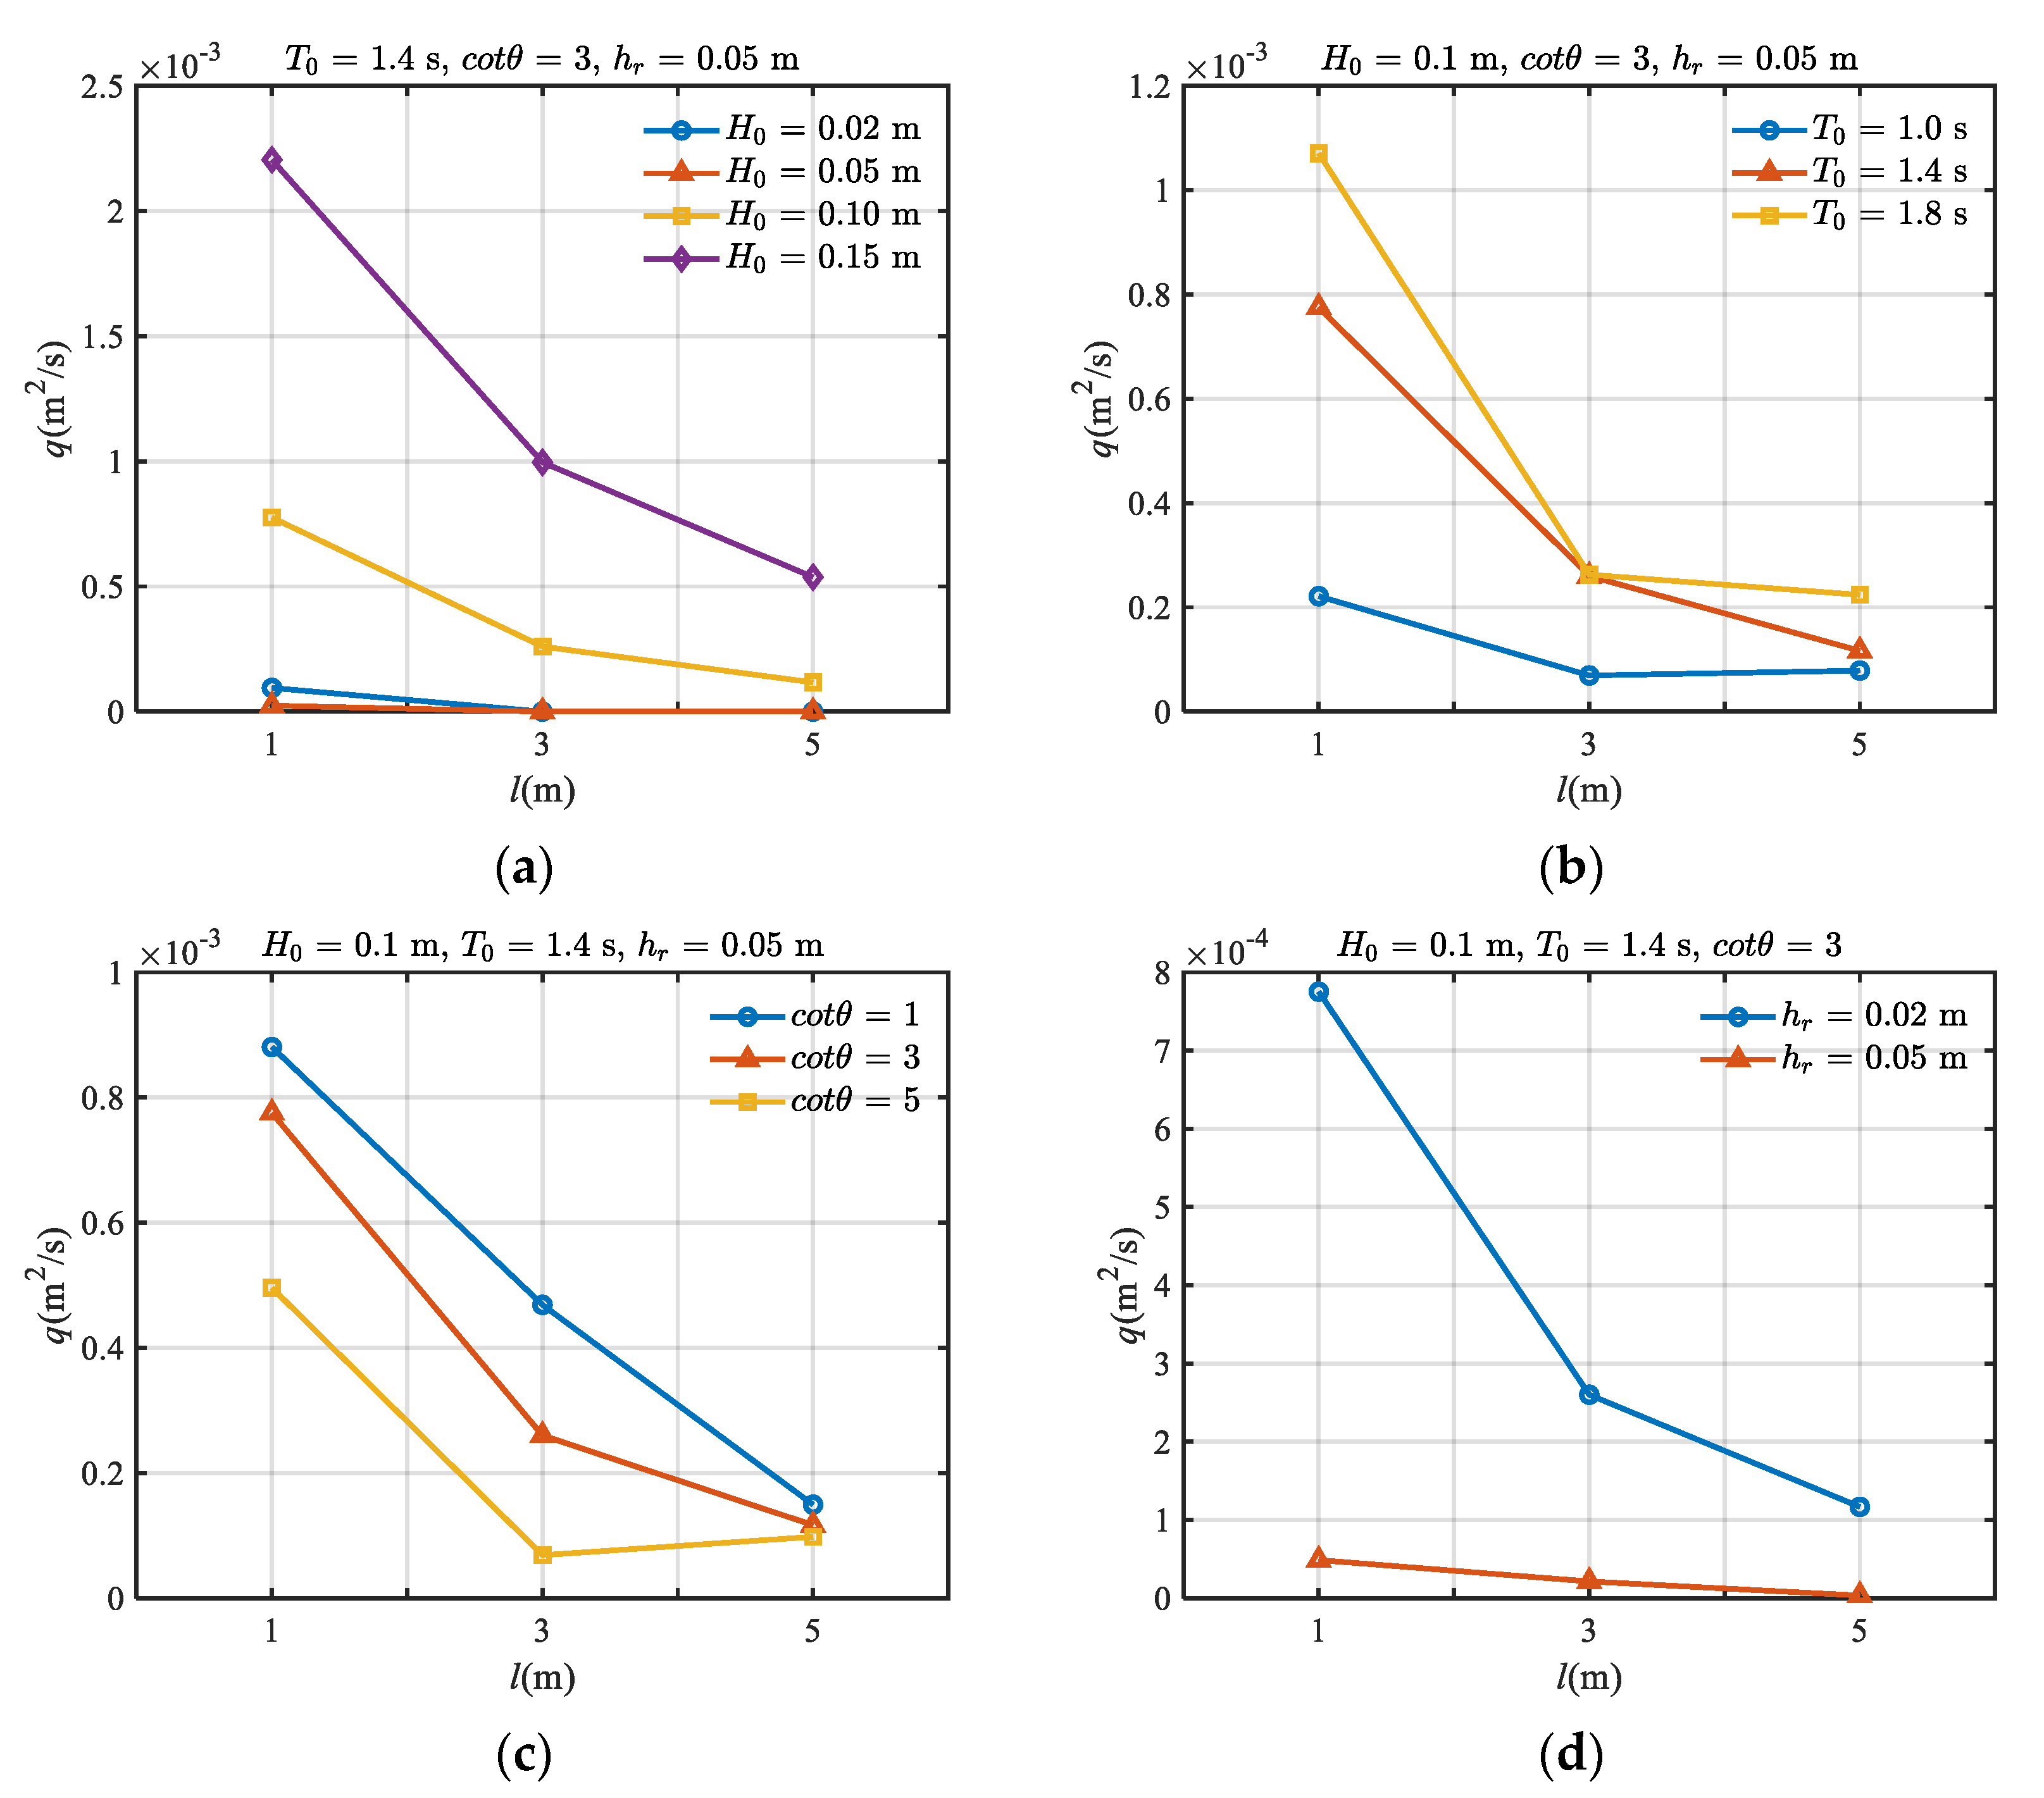
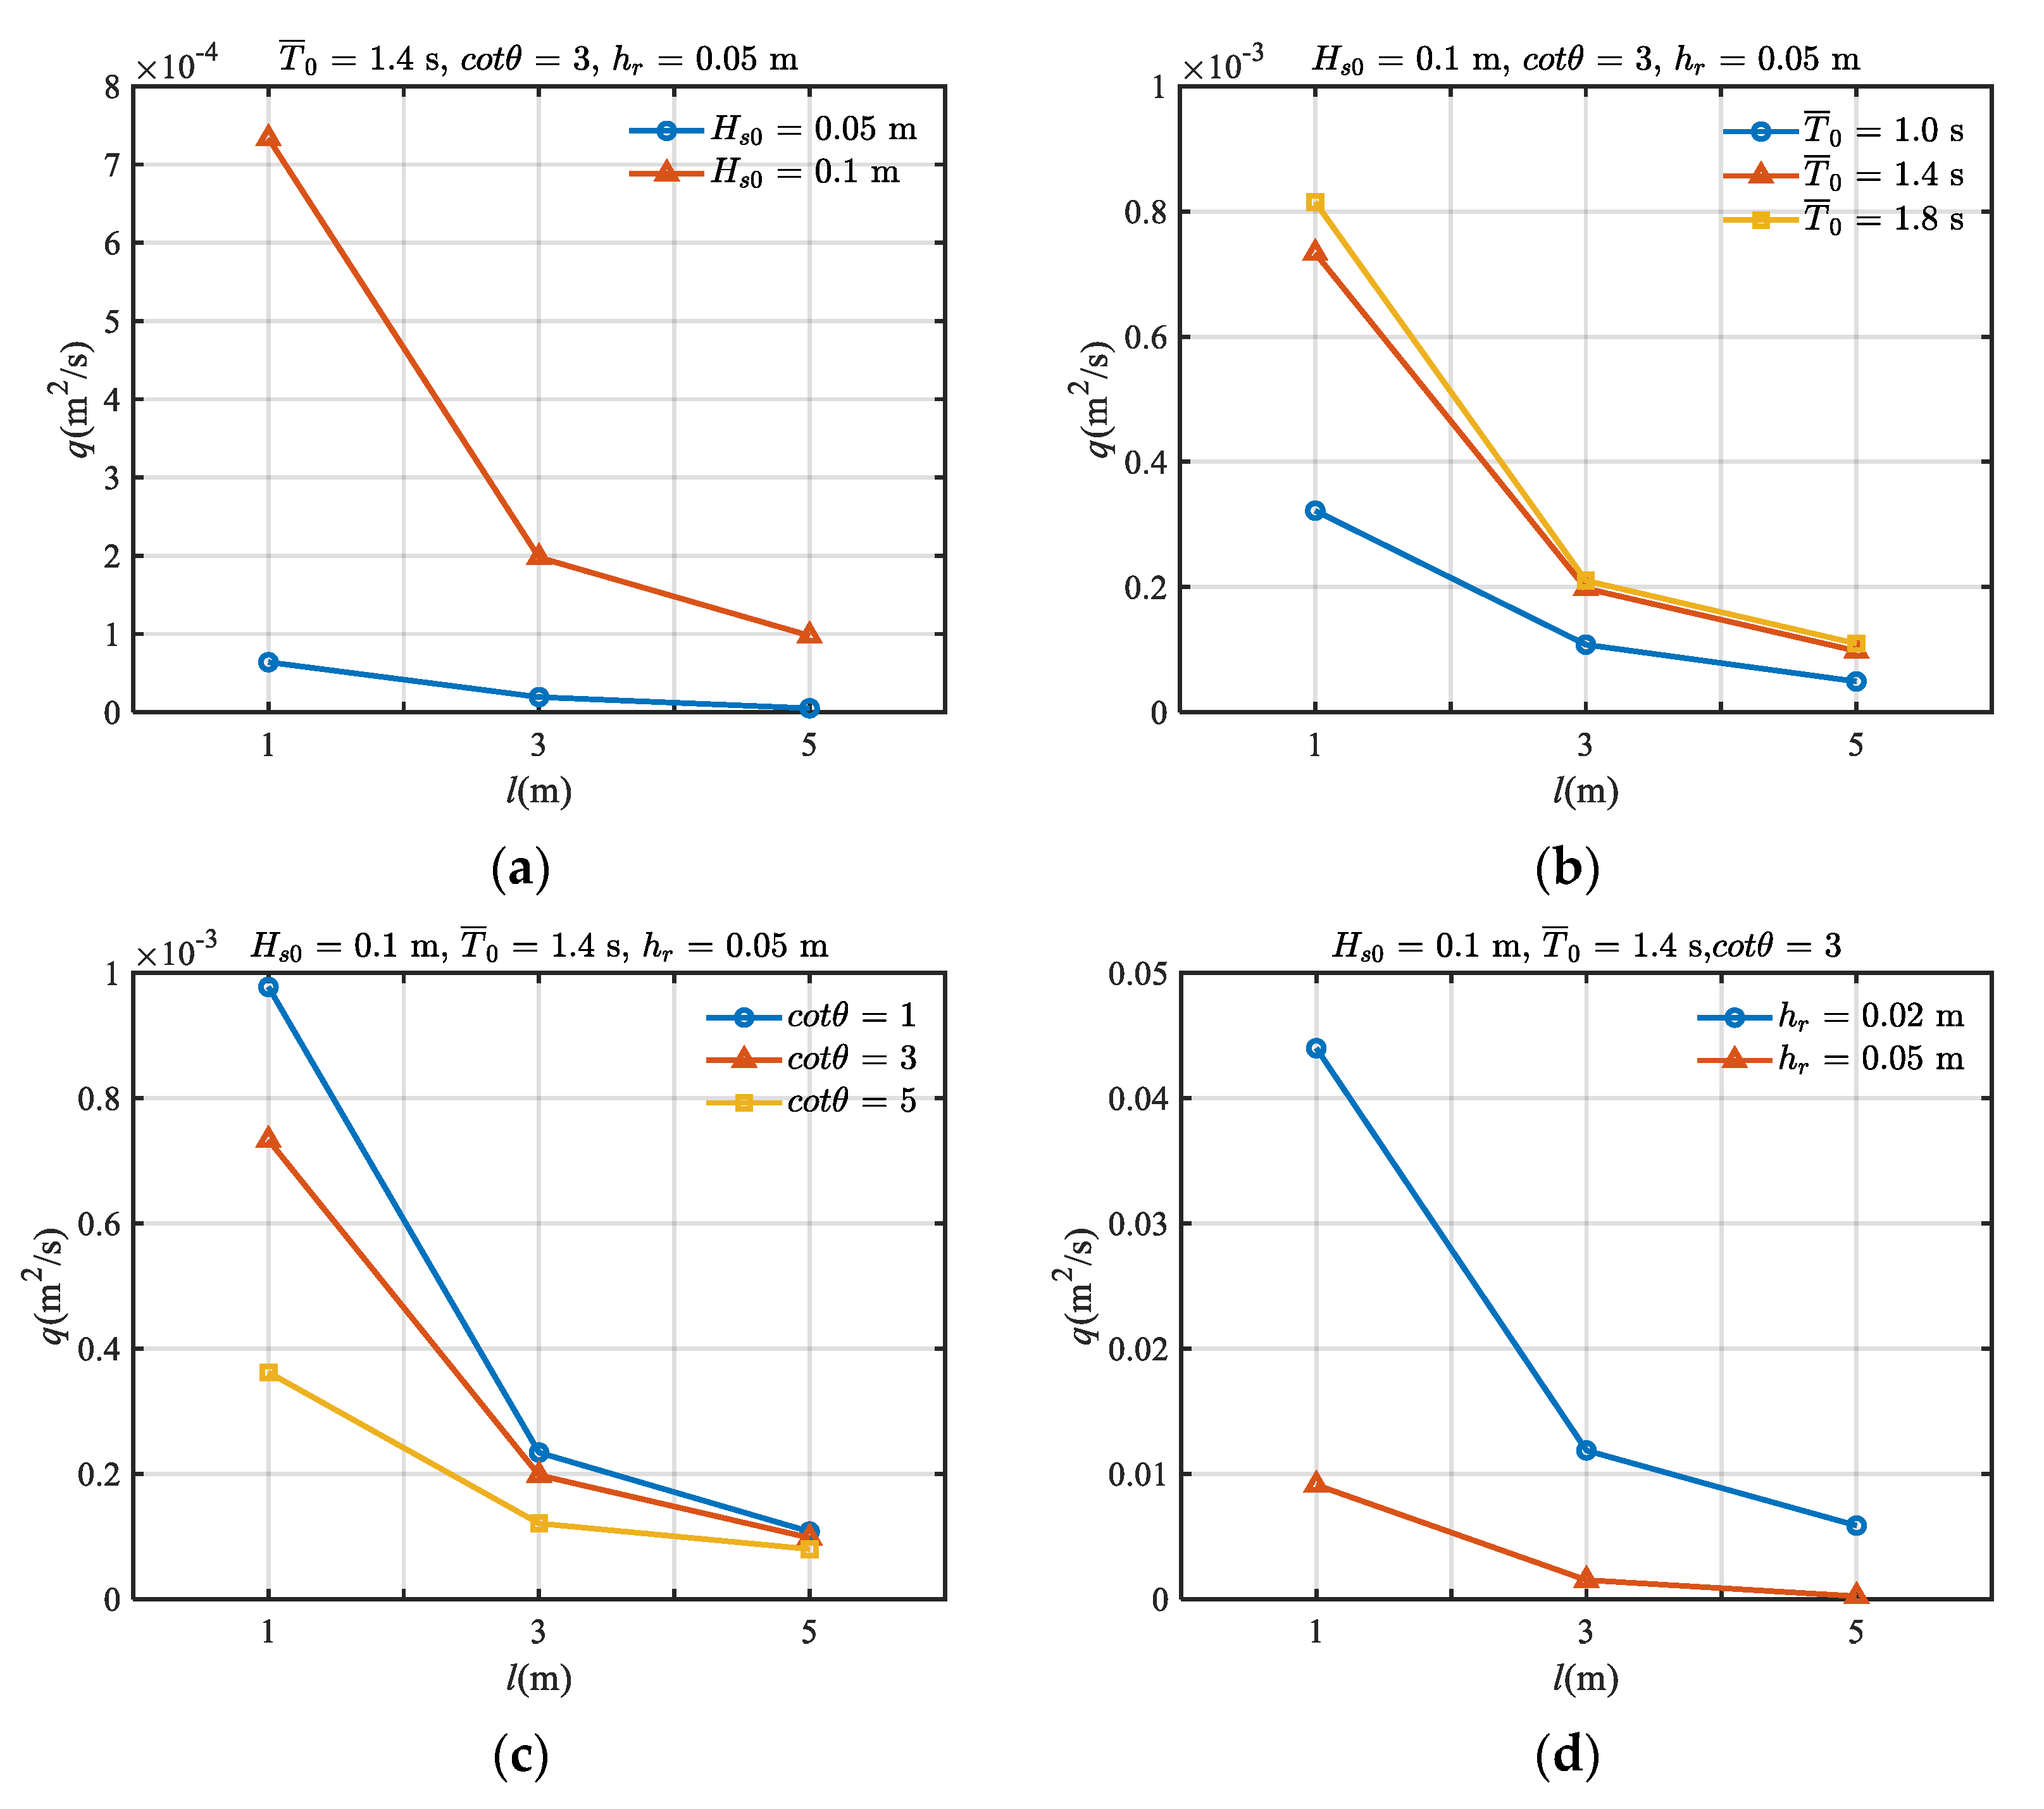
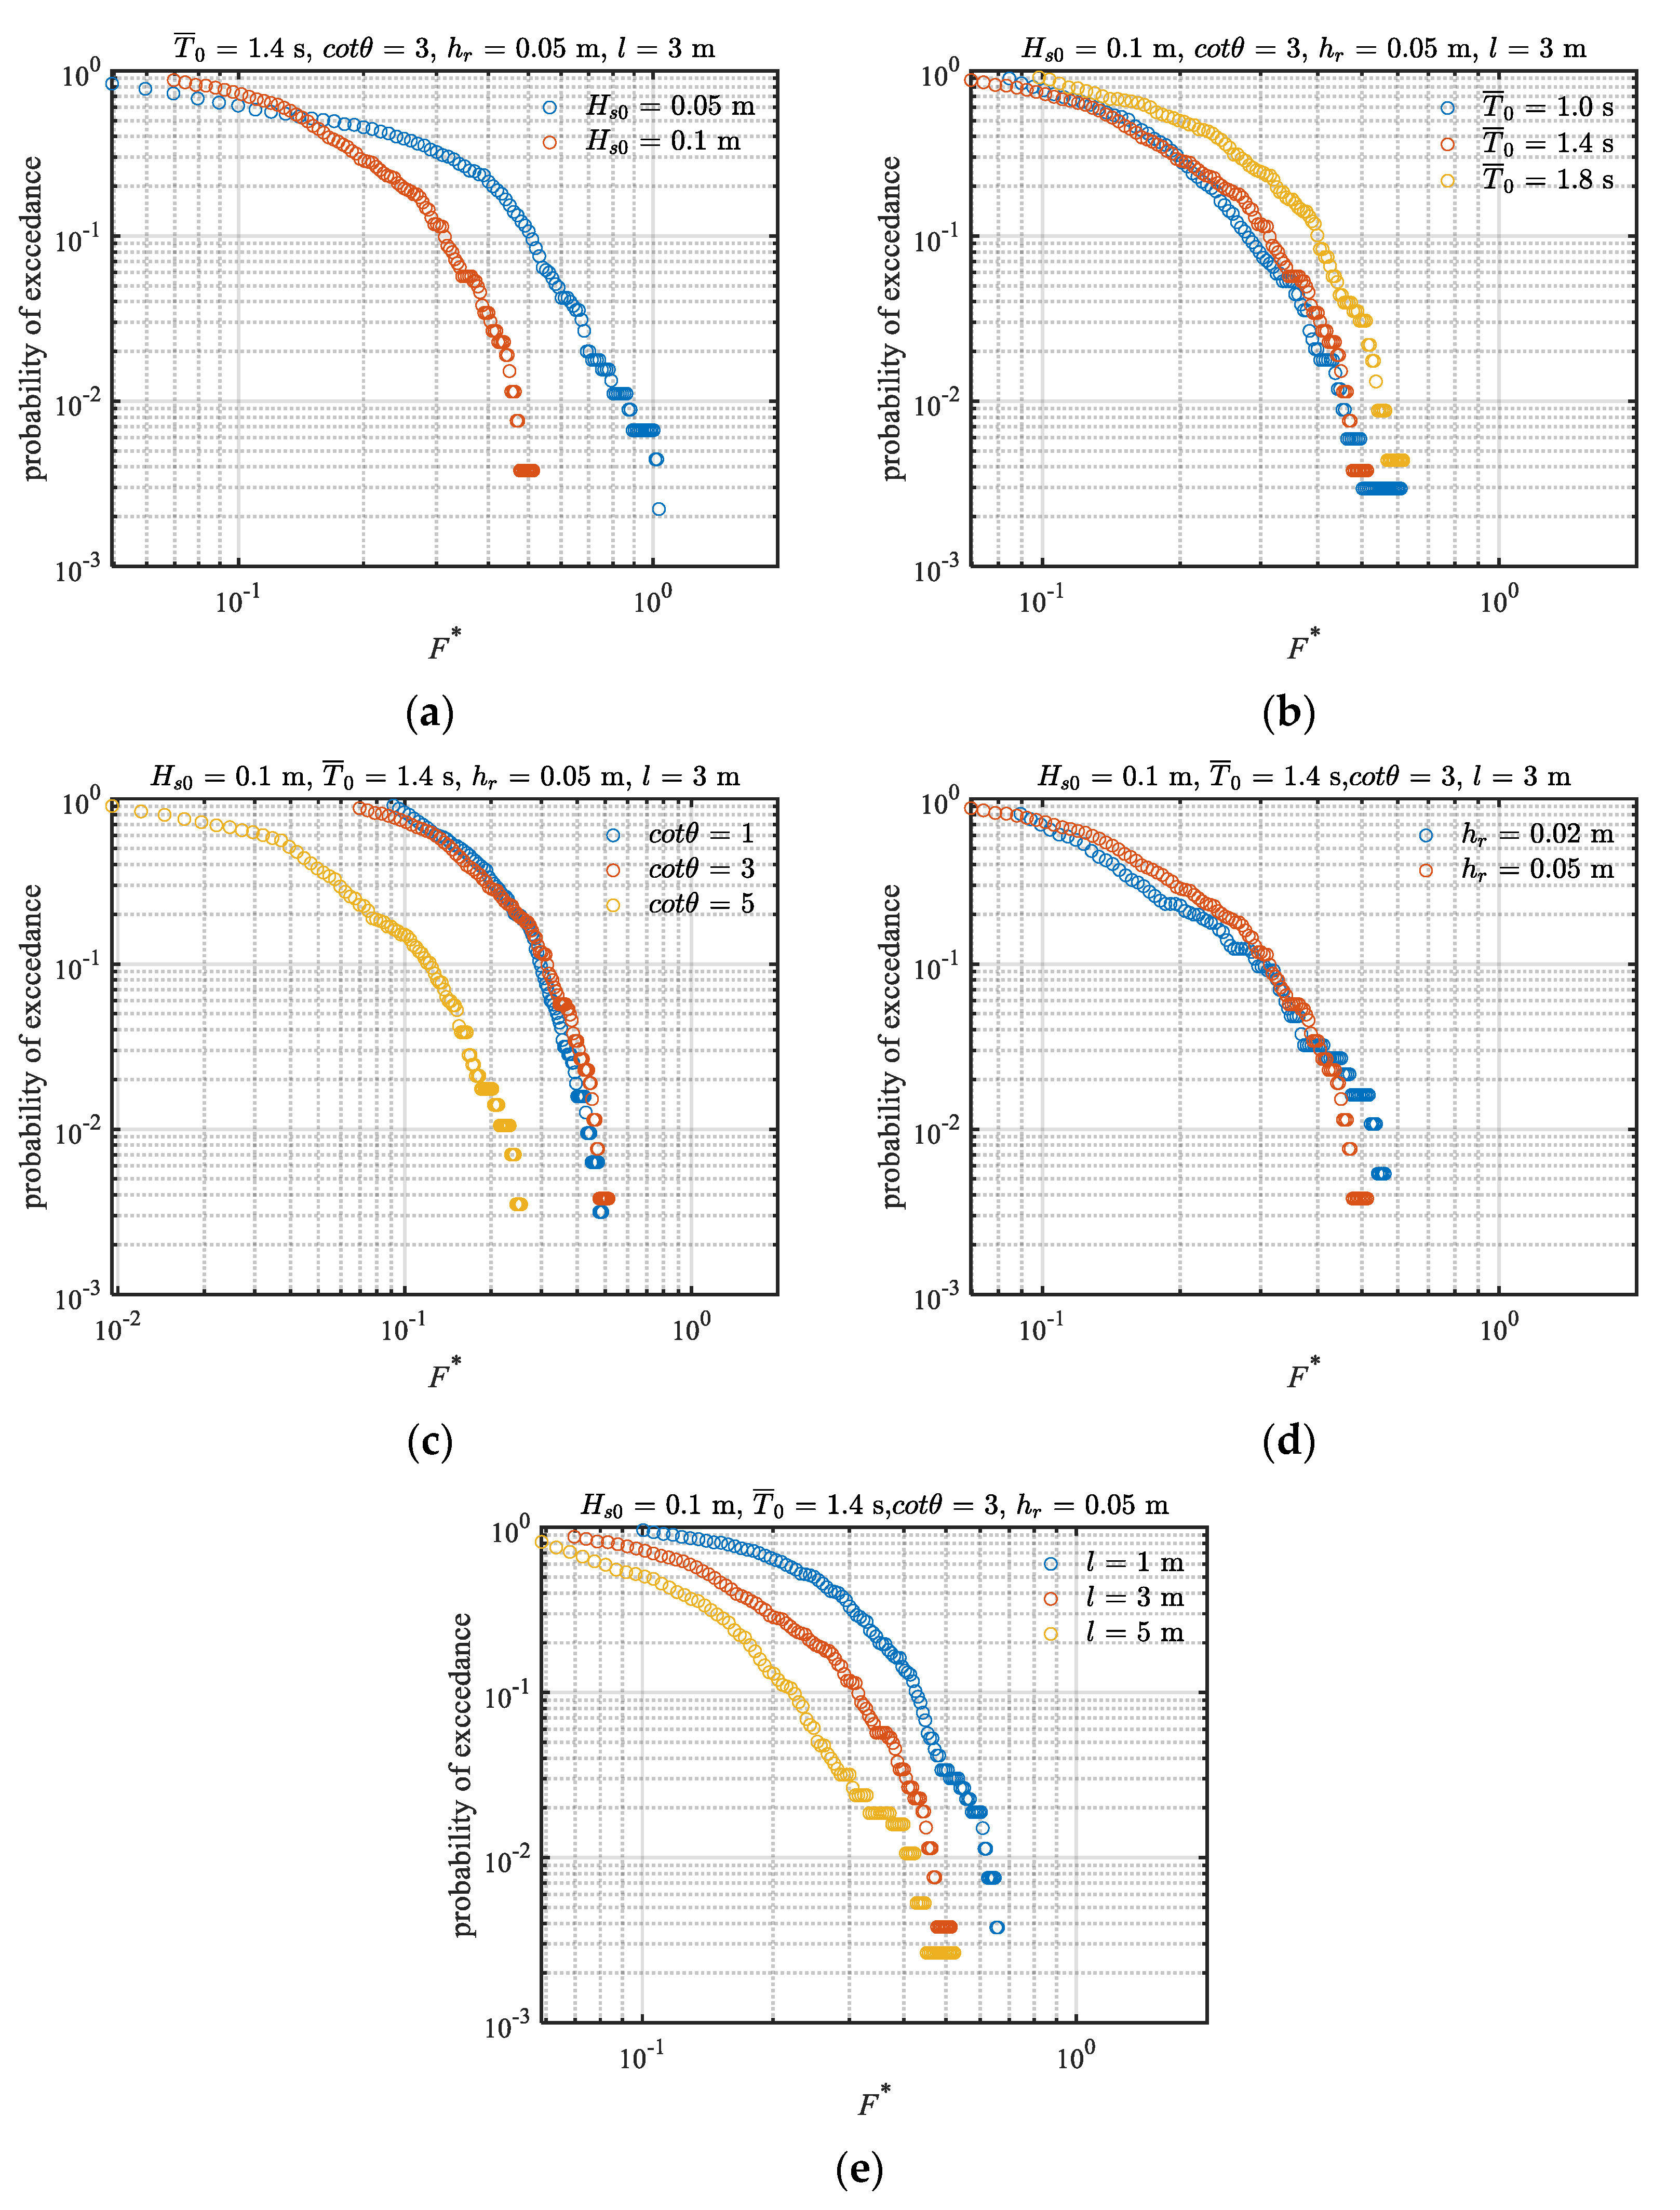
3.3.2. Wave Overtopping over the Sloped Seawall

Figure 22 and Figure 23 show the variations in mean wave overtopping discharge over the sloped seawall with the relative distance at different incident wave heights, wave periods, fore reef slope ratios and still-water depth for regular and irregular waves, respectively. With the increase in relative distance between the sloped seawall and the fore reef edge, the mean wave overtopping discharge is significantly reduced at l = 5 m; the maximum decrease rate approaches to 75.6%. Similar to the case of the vertical seawall, the mean wave overtopping discharge over the sloped seawall increases with the increase in incident wave height, wave period, and still-water depth. With the increase in l, the mean wave overtopping discharge is significantly reduced. Compared with the vertical seawall, the mean wave overtopping discharge over the sloped seawall becomes larger at the same incident wave height. The mean wave overtopping discharge for regular waves is almost the same as that for the irregular waves at Hs0 = 0.05 m and 0.1 m. At T ¯ 0 = 1.8 s, the mean wave overtopping discharge over the sloped seawall for a regular wave is larger than that for an irregular wave. However, the mean wave overtopping discharge for an irregular wave is larger than that for a regular wave at cotθ = 1. For both regular and irregular waves, the mean wave overtopping discharge over the sloped seawall is generally the same.

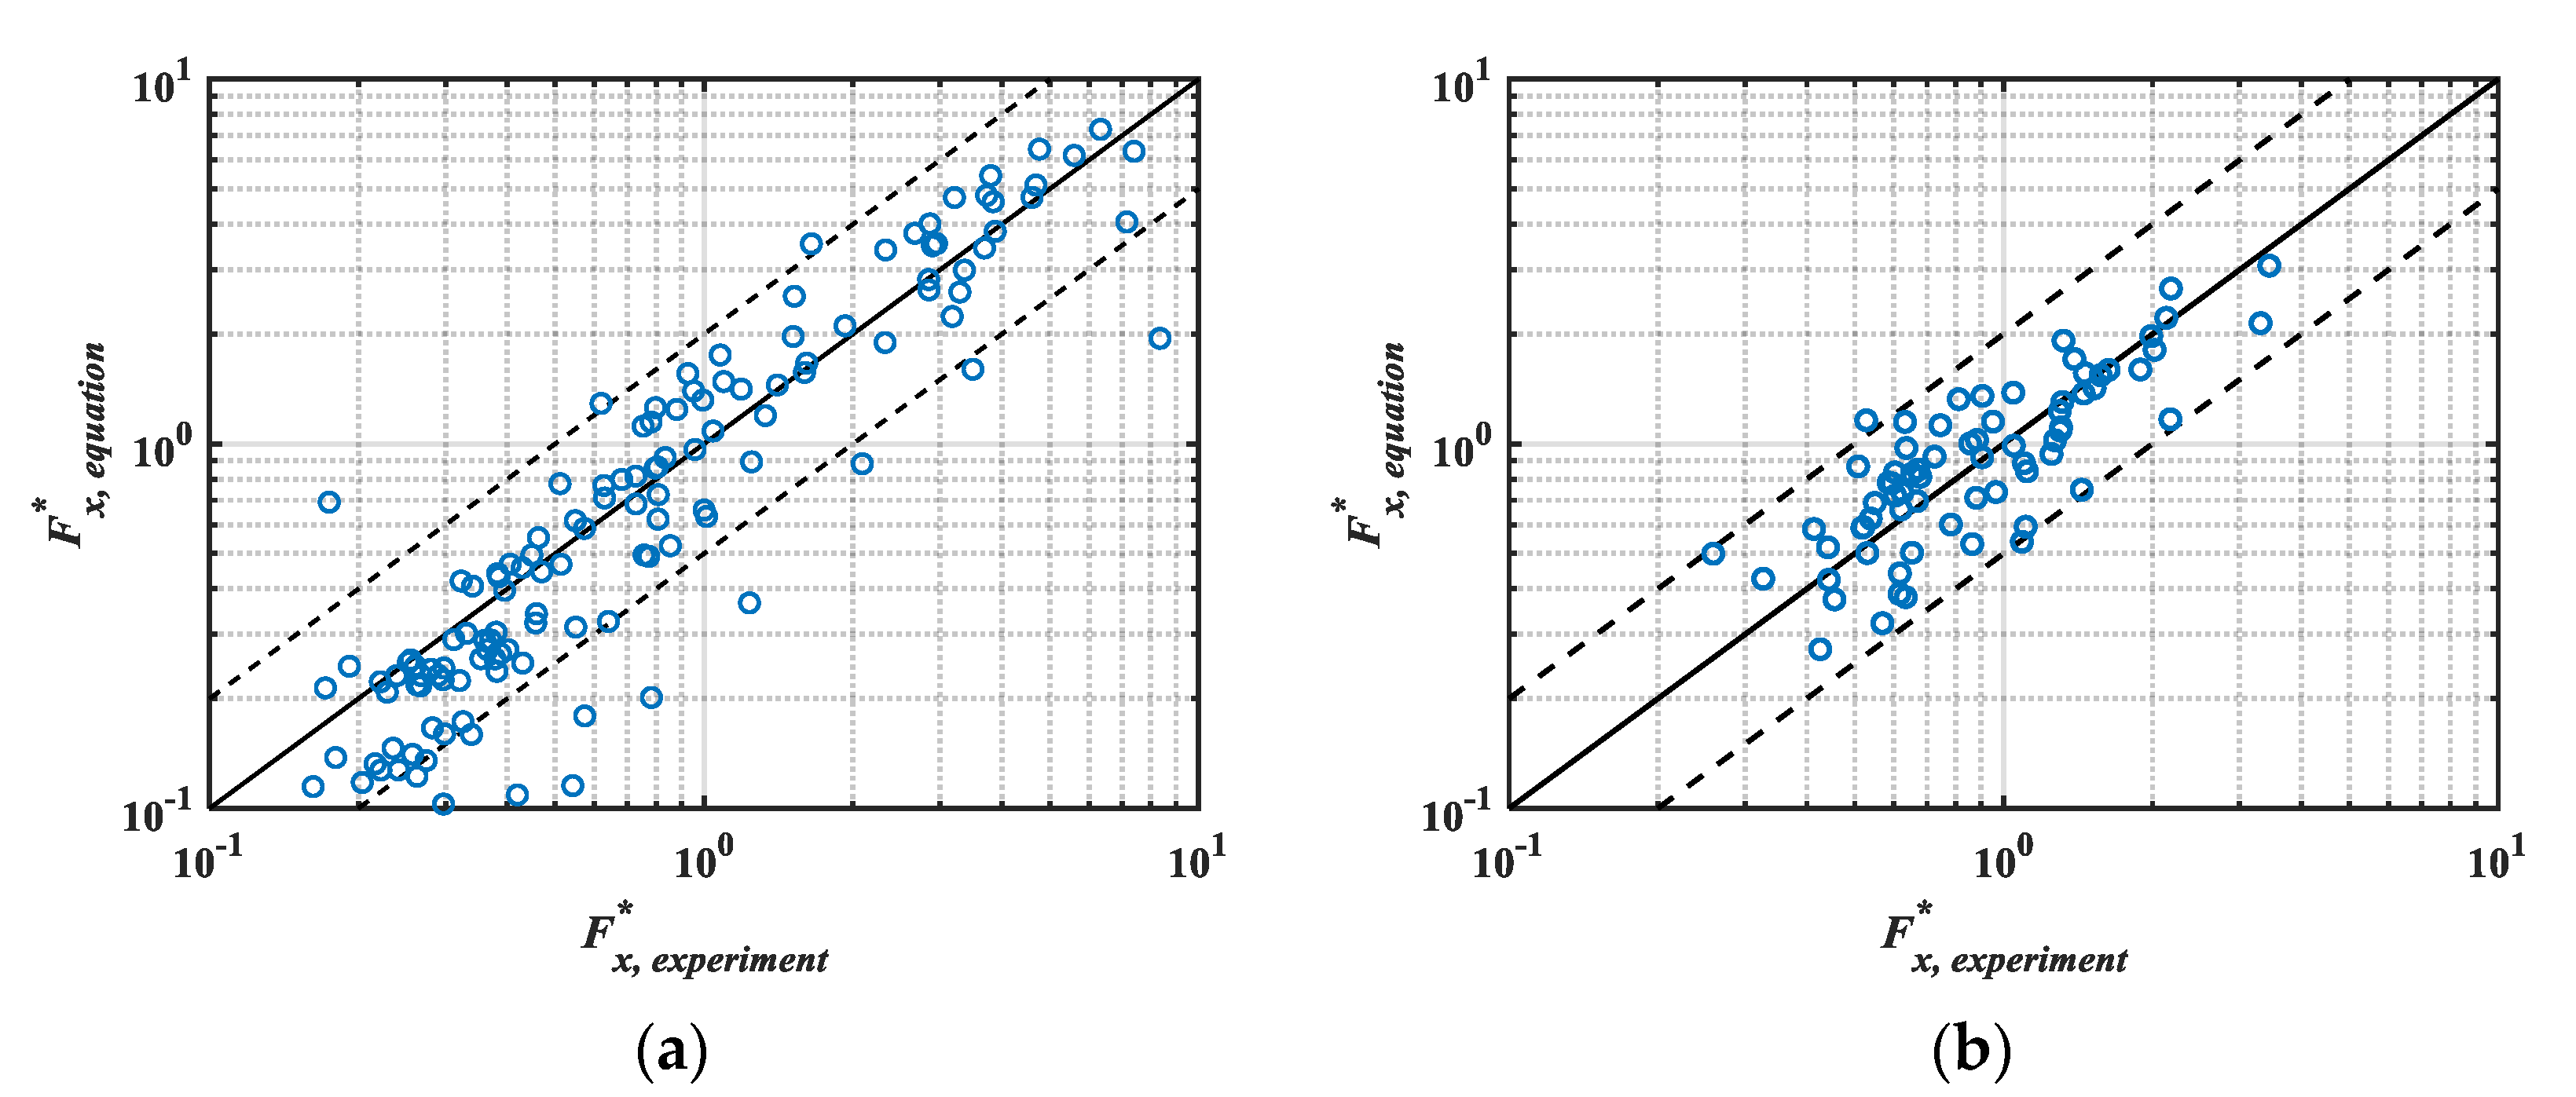
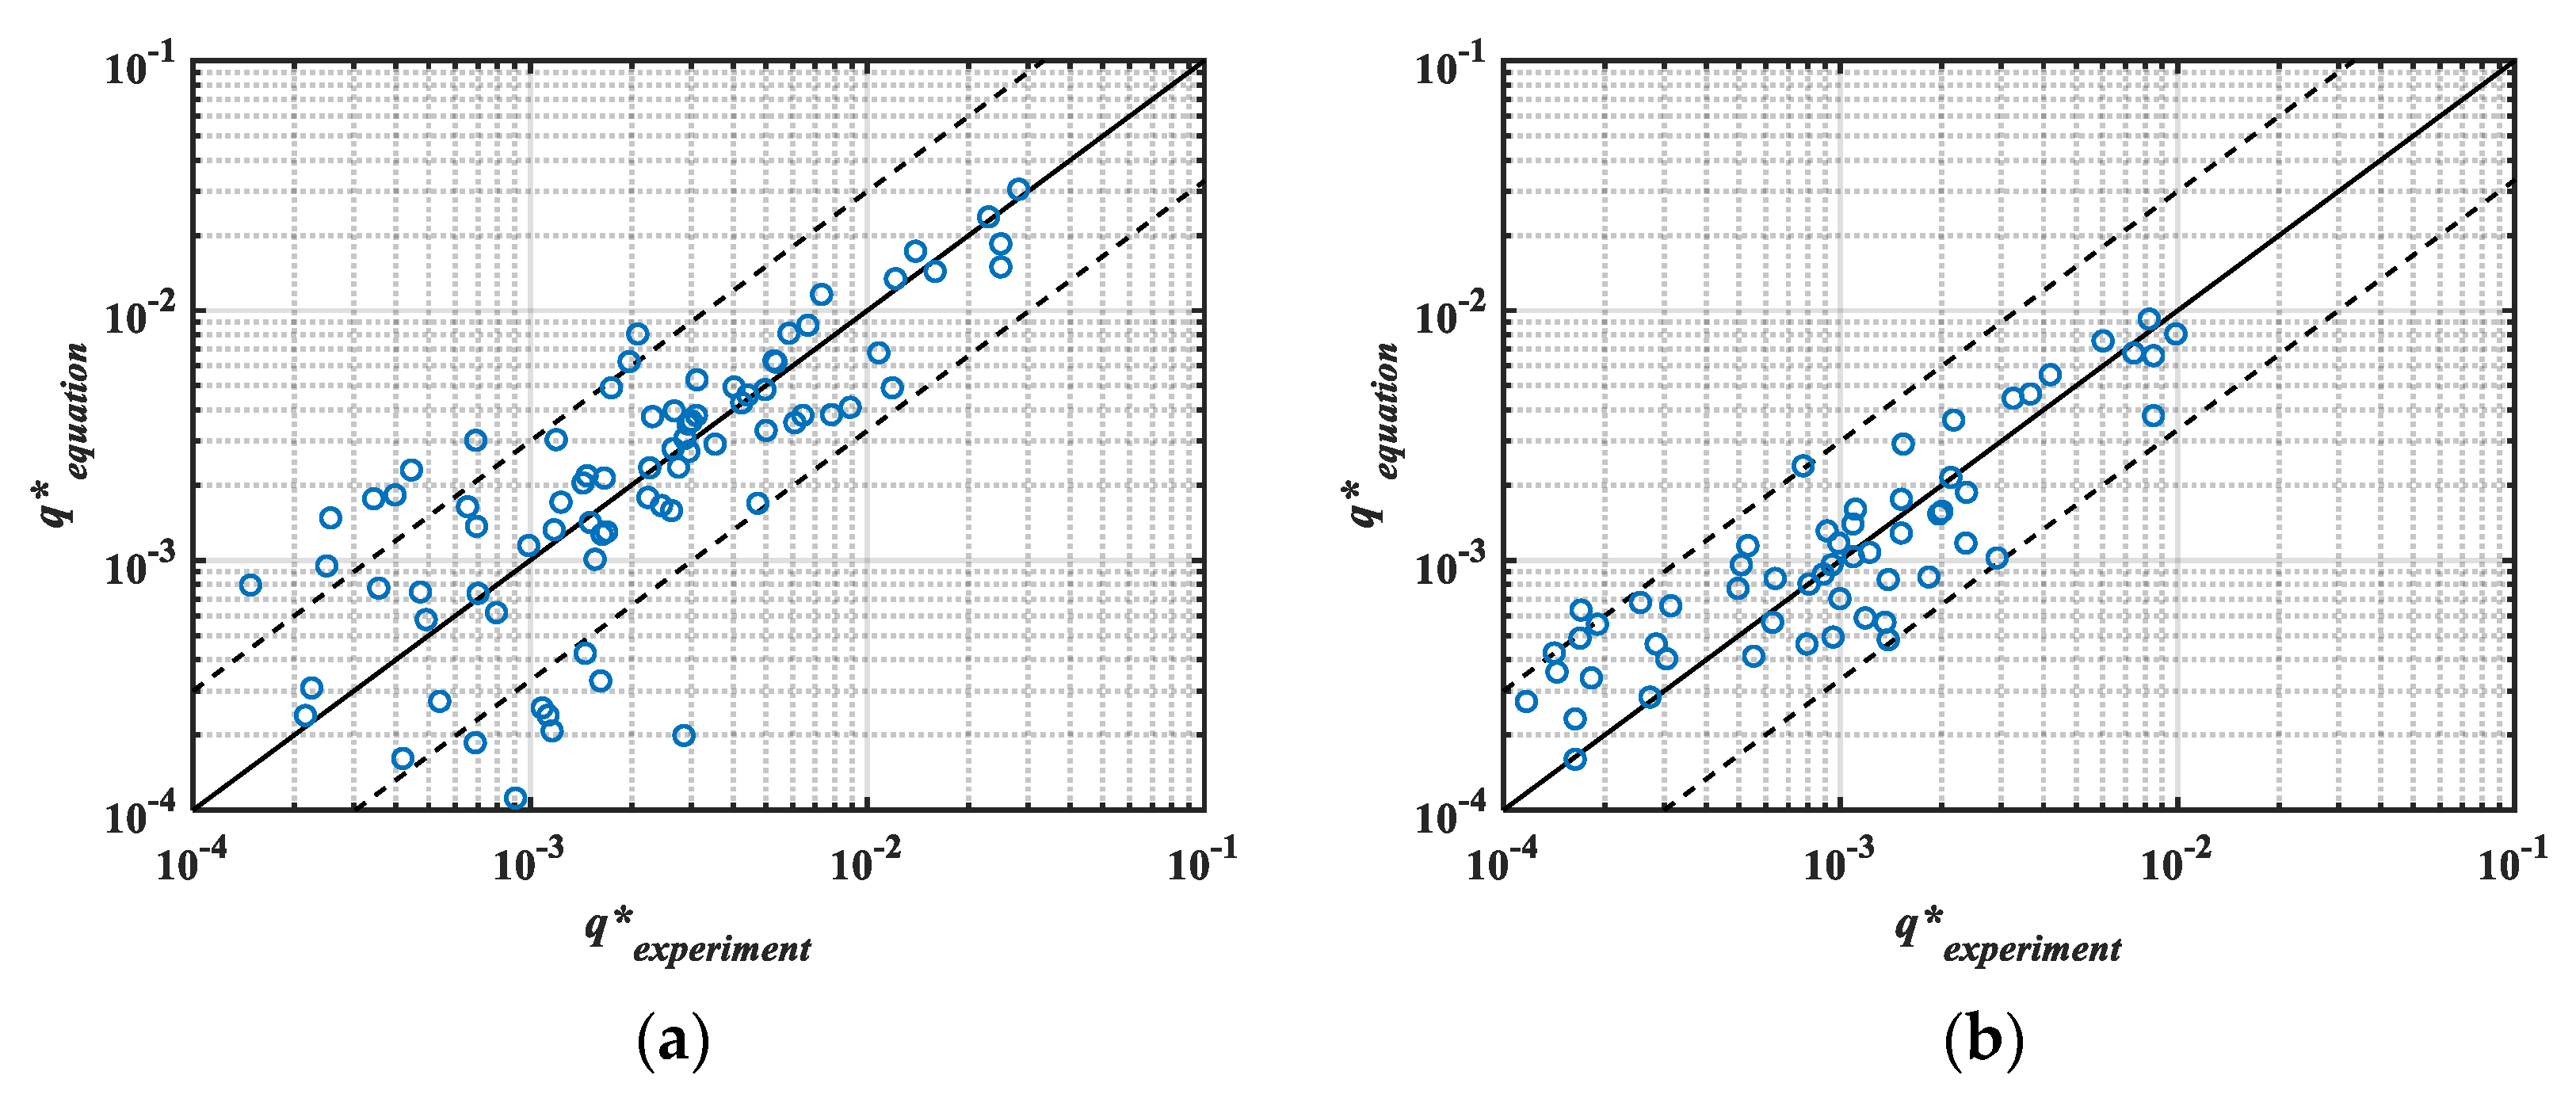
3.4. Prediction Formula

Usually, wave forces and mean wave overtopping discharge are predicted based on wave conditions at the structural location. However, sometimes wave data in front of structures are not directly available, and a preliminary estimate of wave forces and wave overtopping is required from reef topography and distant sea wave data. Wave force and wave overtopping prediction formulas are important to understand the effects of wave conditions and reef topography on seawalls. Previous studies have focused on the wave force and wave overtopping over vertical seawalls on the reef flat under different wave-type conditions [14,25,26]. A comprehensive prediction formula is required to consider both wave types and seawall types. In the present study, a modified empirical formula is proposed based on the formula of Chen et al. [25] for predicting the wave force acting on vertical and sloped seawalls on the reef flat for both regular and irregular waves. The expression of the formula is presented in Equation (5). The total wave forces on the vertical and sloped seawalls are obtained from integrating the wave pressures measured along the seaward surfaces of seawalls. The empirical coefficients for predicting the wave force on the seawalls for regular and irregular waves are obtained from the regression analysis of the experimental data, as shown in Table 3.
F * = F ρ g H i 2 = a 1 h r H i b 1 H i g T i 2 c 1 exp d 1 l H i ( cot θ ) e 1 ( sin φ ) f 1
where a1, b1, c1, d1, e1, and f1 are the empirical parameters, and φ is the slope angle of the seawall. Hi denotes the incident mean wave height for regular waves or the incident significant wave height for irregular waves. Ti denotes the incident mean wave period for regular and irregular waves.
Figure 24 shows the scatter diagrams of the measured and predicted wave forces for the vertical and sloped seawalls under regular and irregular wave conditions. The solid line represents the perfect agreement line; the error plots of two times underestimation/overestimation with two dashed lines are also presented. As shown in Figure 24, 83% of the predicted wave forces are in the interval between 0.5 times and 2 times the measured values for regular wave conditions, and 97% of the predicted wave forces are in the interval between 0.5 times and 2 times the measured values for irregular wave conditions. The determination coefficients R2 of the predicted and measured wave forces are 0.81 and 0.74 for regular and irregular wave conditions, respectively. The results show that the proposed modified formula in the present study can well predict the wave forces on the vertical and sloped seawalls located on the reef flat topography.
Most of the existing empirical formulas for predicting mean wave overtopping discharge are proposed for the seawall on the sloping beaches. In the present study, a modified empirical equation is proposed to predict the mean wave overtopping discharge over the vertical and sloped seawalls for regular and irregular wave conditions, as expressed in Equation (6). The combined effects of incident wave height, wave period, fore reef slope, still-water depth, relative distance, and slope angle of the seawall on the mean wave overtopping discharge over seawalls are considered in the present formula. The empirical coefficients are obtained from the regression analysis of the experimental results, as shown in Table 4.
q * = q g H i 3 = a 2 exp b 2 R c H i + c 2 H i l H i g T i 2 d 2 ( cot θ ) e 2 ( sin φ ) f 2
where a2, b2, c2, d2, e2, and f2 are the empirical parameters for the mean wave overtopping discharge prediction formula; Rc is the distance from the top of seawall to the surface of the still water.
Figure 25 shows the scatter diagrams of the measured and predicted mean wave overtopping discharge over the seawalls under regular and irregular wave conditions. The solid line represents the best fitting curve, and the error plots of three times underestimation/overestimation with two dashed lines are also presented. As shown in Figure 25, 77% of the predicted mean wave overtopping discharge are in the interval between 0.33 times and 3 times the measured values for regular wave conditions, and 86% of the predicted mean wave overtopping discharge are in the interval between 0.33 times and 3 times the measured values for irregular wave conditions, respectively. The determination coefficients R2 of the predicted and measured values are 0.86 and 0.84 under regular and irregular wave conditions, respectively. The results show that the proposed modified formula can well predict the mean wave overtopping discharge over the seawall on the reef flat topography.

4. Discussion

In this study, physical model tests were conducted on the wave propagation, pressure distribution, and overtopping processes on vertical and sloped seawalls on a reef flat, considering the effects of different wave parameters, still-water depth, fore reef slope, and relative distance on wave propagation, wave pressure distribution, and mean wave overtopping discharge. The empirical formulas for predicting wave force and mean wave overtopping discharge of seawalls usually use the wave data at the toe of the seawalls, which can ignore the topographic parameters. However, the topography has a massive impact on the wave propagation process. The wave propagation process on reef topography is significantly different from that on gentle beaches, and the corresponding empirical formulas cannot be directly applied [26]. For seawall engineering, it is necessary to estimate the wave force and mean wave overtopping discharge during the design stage, but the wave data at the toe of the seawall cannot be directly obtained. It is more feasible to use offshore wave parameters and topographic structure parameters of reef seawall to calculate wave force and mean wave overtopping discharge. Similar work has been carried out by Chen et al. [25] through numerical simulation and physical experiment verification, but they did not consider the working conditions of sloped seawalls and irregular waves. On this basis, this study proposes improved empirical formulas for predicting wave force and mean wave overtopping discharge on reef seawalls. Both formulas can accurately predict the wave force and mean wave overtopping discharge on vertical and sloped seawalls for both regular and irregular waves. Table 5 is a brief summary table.
The present study has been conducted to illustrate wave propagation and wave overtopping over the idealized vertical and slope seawalls on the reef flat, and it proposed the predicted formula for wave force and mean wave overtopping discharge for both regular and irregular waves. The influence factors such as surface roughness, incident wave angles, and wave driven current may also have effects on the predicted formulas. A further study on these factors will be performed to further optimize the predicted formulas for wave force and mean wave overtopping discharge.
Moreover, the exceedance probability distribution of wave force under the influence of different factors is worthy of attention. The exceedance probability distribution is a statistical indicator which represents the probability of reaching or exceeding a particular value. Figure 26 and Figure 27 show the exceedance probability distributions of normalized irregular wave force F* for vertical and sloped seawalls, respectively. It can be seen that the incident significant wave height is the dominant factor in the exceedance probability curve of the normalized irregular wave force for the vertical seawall. Due to the wave shoaling effect, the exceedance probability of wave force at Hs0 = 0.05 m significantly increases with the decrease in the incident significant wave height; there is an increase of up to twice the wave force at Pexc = 10−1 for the vertical and sloped seawall. The effect of the mean wave period on the exceedance probability of the normalized irregular wave force is not significant. The maximum divergence between the curves is 42% at Pexc = 10−2 for the vertical seawall and 20% at Pexc = 10−2 for the sloped seawall. The exceedance probability of the normalized irregular wave force generally decreases with the increase in fore slope cotθ for the vertical seawall. However, for the sloped seawall, the exceedance probability distribution is distributed mainly in the interval [10−1, 1]. The effects of still-water depth on the exceedance probability of the normalized wave forces are not significant for the vertical and sloped seawalls. The relative locations of vertical and sloped seawalls have significant effects on the exceedance probability distributions of normalized wave forces; the exceedance probability increases with the decrease in relative distance. The maximum divergence between the curves is 97% at Pexc = 10−2 for vertical seawall and 55% at Pexc = 10−2 for sloped seawall.

5. Conclusions

A series of physical model tests are performed to investigate the wave propagation and wave overtopping processes over the vertical and sloped seawalls on the reef flat. The effects of incident wave parameters, still-water depth, fore reef slope, and relative distance on the wave transformation, wave pressure distribution, and mean wave overtopping discharge are investigated. The variation trends in wave height with variable parameters for both regular and irregular waves are generally the same; the infragravity wave energy increases as the wave propagates over the reef flat. The peak pressure is strongly dependent on the incident wave height, relative distance, and fore reef slope for vertical and sloped seawalls, and the peak pressure increases with increasing incident wave height and decreases with increasing relative distance and fore reef slope. The mean wave overtopping discharge over the vertical and sloped seawalls increases with the increase in incident wave height, wave period, and still-water depth and significantly decreases with the increase in relative distance and fore reef slope for both regular and irregular waves. The modified empirical formulas are proposed to predict the wave force and mean wave overtopping discharge over the seawalls; both of the two formulas are able to accurately predict the wave force and mean wave overtopping discharge on the vertical and sloped seawalls for both regular and irregular waves.

Author Contributions

Y.G.: conceptualization, experimentation, supervision, investigation, writing—original draft paper, writing—reviewing and editing. L.R.: experiment, data curation, investigation, writing—original draft preparation and editing. L.W.: writing—reviewing and editing. All authors have read and agreed to the published version of the manuscript.

Funding

This research was funded by the Hainan Province Science and Technology Special Fund, grant number ZDKJ202019.

Institutional Review Board Statement

Not applicable.

Informed Consent Statement

Not applicable.

Data Availability Statement

The data presented in this study are available on request.

Acknowledgments

This research was supported by the Hainan Province Science and Technology Special Fund, grant number ZDKJ202019. Thanks to those who provided support and encouragement to the author during the writing process.

Conflicts of Interest

The authors declare no conflict of interest.

References

  1. Tajima, Y. Case study on impact of storm waves on inundation characteristics. In Proceedings of the IUTAM Symposium on Storm Surge Modelling and Forecasting, Shanghai, China, 17–20 October 2016; pp. 36–43. [Google Scholar]
  2. Madin, J.S.; Connolly, S.R. Ecological consequences of major hydrodynamic disturbances on coral reefs. Nature 2006, 444, 477–480. [Google Scholar] [CrossRef]
  3. Baldock, T.E.; Shabani, B.; Callaghan, D.P.; Hu, Z.; Mumby, P.J. Two-dimensional modelling of wave dynamics and wave forces on fringing coral reefs. Coast. Eng. 2020, 155, 103594. [Google Scholar] [CrossRef]
  4. Yu, T.S.; Meng, X.Y.; Li, T.Y.; Guo, Q.Y.; Li, Y.C. Numerical simulation of interaction between wave-driven currents and revetment on coral reefs. Ocean Eng. 2022, 254, 20. [Google Scholar] [CrossRef]
  5. Nwogu, O.; Demirbilek, Z. Infragravity Wave Motions and Runup over Shallow Fringing Reefs. J. Waterw. Port Coast. Ocean Eng.-ASCE 2010, 136, 295–305. [Google Scholar] [CrossRef]
  6. Ma, G.F.; Su, S.F.; Liu, S.G.; Chu, J.C. Numerical simulation of infragravity waves in fringing reefs using a shock-capturing non-hydrostatic model. Ocean Eng. 2014, 85, 54–64. [Google Scholar] [CrossRef]
  7. Lowe, R.J.; Koseff, J.R.; Monismith, S.G. Oscillatory flow through submerged canopies: 1. Velocity structure. J. Geophys. Res.-Ocean. 2005, 110, 17. [Google Scholar] [CrossRef] [Green Version]
  8. Gelfenbaum, G.; Apotsos, A.; Stevens, A.W.; Jaffe, B. Effects of fringing reefs on tsunami inundation: American Samoa. Earth-Sci. Rev. 2011, 107, 12–22. [Google Scholar] [CrossRef]
  9. Ferrario, F.; Beck, M.W.; Storlazzi, C.D.; Micheli, F.; Shepard, C.C.; Airoldi, L. The effectiveness of coral reefs for coastal hazard risk reduction and adaptation. Nat. Commun. 2014, 5, 9. [Google Scholar] [CrossRef] [Green Version]
  10. Yao, Y.; He, F.; Tang, Z.J.; Liu, Z.S. A study of tsunami-like solitary wave transformation and run-up over fringing reefs. Ocean Eng. 2018, 149, 142–155. [Google Scholar] [CrossRef]
  11. Ning, Y.; Liu, W.; Sun, Z.; Zhao, X.; Zhang, Y. Parametric study of solitary wave propagation and runup over fringing reefs based on a Boussinesq wave model. J. Mar. Sci. Technol. 2019, 24, 512–525. [Google Scholar] [CrossRef]
  12. Zheng, J.H.; Yao, Y.; Chen, S.G.; Chen, S.B.; Zhang, Q.M. Laboratory study on wave-induced setup and wave-driven current in a 2DH reef-lagoon-channel system. Coast. Eng. 2020, 162, 13. [Google Scholar] [CrossRef]
  13. Fang, K.; Xiao, L.; Liu, Z.; Sun, J.; Dong, P.; Wu, H. Experiment and RANS modeling of solitary wave impact on a vertical wall mounted on a reef flat. Ocean Eng. 2022, 244, 110384. [Google Scholar] [CrossRef]
  14. Robertson, I.N.; Paczkowski, K.; Riggs, H.R.; Mohamed, A. Experimental Investigation of Tsunami Bore Forces on Vertical Walls. J. Offshore Mech. Arct. Eng. Trans. ASME 2013, 135, 8. [Google Scholar] [CrossRef]
  15. Yao, Y.; Du, R.; Yuan, W.; Jiang, C. Experimental study of wave transformation around the surf zone over fringing reefs. Acta Oceanol. Sin. 2015, 37, 66–73. [Google Scholar]
  16. Liu, Y.; Li, S.; Liao, Z.; Liu, K. Physical and numerical modeling of random wave transformation and overtopping on reef topography. Ocean Eng. 2021, 220, 108390. [Google Scholar] [CrossRef]
  17. Beetham, E.; Kench, P.S.; O’Callaghan, J.; Popinet, S. Wave transformation and shoreline water level on Funafuti Atoll, Tuvalu. J. Geophys. Res. Ocean. 2016, 121, 311–326. [Google Scholar] [CrossRef] [Green Version]
  18. Masselink, G.; Tuck, M.; McCall, R.; van Dongeren, A.; Ford, M.; Kench, P. Physical and Numerical Modeling of Infragravity Wave Generation and Transformation on Coral Reef Platforms. J. Geophys. Res. Ocean. 2019, 124, 1410–1433. [Google Scholar] [CrossRef]
  19. Yao, Y.; Chen, X.J.; Xu, C.H.; Jia, M.J.; Jiang, C.B. Modeling solitary wave transformation and run-up over fringing reefs with large bottom roughness. Ocean Eng. 2020, 218, 12. [Google Scholar] [CrossRef]
  20. Fu, R.L.; Ma, Y.X.; Dong, G.H. Investigation of wave-driven currents and statistical moments of irregular waves over a one dimensional horizontal fringing reef. Appl. Ocean Res. 2021, 112, 14. [Google Scholar] [CrossRef]
  21. Molines, J.; Herrera, M.P.; Gomez-Martin, M.E.; Medina, J.R. Distribution of individual wave overtopping volumes on mound breakwaters. Coast. Eng. 2019, 149, 15–27. [Google Scholar] [CrossRef]
  22. AlYousif, A.; AlKhaldi, M.S.; Al-Amer, F.; Neelamani, S. Wave action on a vertical wall with a submerged horizontal plate: Analysis of phase variation of forces and probability of exceedance. Int. J. Nav. Archit. Ocean Eng. 2022, 14, 14. [Google Scholar] [CrossRef]
  23. Mares-Nasarre, P.; Molines, J.; Gomez-Martin, M.E.; Medina, J.R. Individual wave overtopping volumes on mound breakwaters in breaking wave conditions and gentle sea bottoms. Coast. Eng. 2020, 159, 12. [Google Scholar] [CrossRef]
  24. Koosheh, A.; Etemad-Shahidi, A.; Cartwright, N.; Tomlinson, R.; Van Gent, M.R.A. Experimental study of wave overtopping at rubble mound seawalls. Coast. Eng. 2022, 172, 11. [Google Scholar] [CrossRef]
  25. Chen, S.; Yao, Y.; Guo, H.; Jia, M. Numerical investigation of monochromatic wave interaction with a vertical seawall located on a reef flat. Ocean Eng. 2020, 214, 107847. [Google Scholar] [CrossRef]
  26. Liu, Y.; Li, S.; Chen, S.; Hu, C.; Fan, Z.; Jin, R. Random wave overtopping of vertical seawalls on coral reefs. Appl. Ocean Res. 2020, 100, 102166. [Google Scholar] [CrossRef]
  27. Cao, D.P.; Yuan, J.; Chen, H.; Zhao, K.F.; Liu, P.L.F. Wave overtopping flow striking a human body on the crest of an impermeable sloped seawall. Part I: Physical modeling. Coast. Eng. 2021, 167, 17. [Google Scholar] [CrossRef]
  28. Wen, H.; Ren, B.; Zhang, X.; Yu, X. SPH Modeling of Wave Transformation over a Coral Reef with Seawall. J. Waterw. Port Coast. Ocean Eng. 2019, 145, 04018026. [Google Scholar] [CrossRef]
  29. Yao, Y.; Huang, Z.; Monismith, S.G.; Lo, E.Y.M. 1DH Boussinesq modeling of wave transformation over fringing reefs. Ocean Eng. 2012, 47, 30–42. [Google Scholar] [CrossRef]
Figure 1. Schematic representation of the experimental setup and seawalls.
Jmse 11 00836 g001
Figure 2. Wave propagation process on the reef flat for H0 = 0.14 m, T0 = 1.4 s, cotθ = 3, hr = 0.05 m.
Jmse 11 00836 g002
Figure 3. Time histories of free surface elevations for the reef at H0 = 0.1 m (Hs0 = 0.1 m), T0 = 1.4 s ( T ¯ 0 = 1.4 s), cotθ = 3, hr = 0.05 m: (a) regular wave; (b) irregular wave.
Jmse 11 00836 g003
Figure 4. Regular wave height transformation on the reef topography for different cases: (a) H0; (b) T0; (c) cotθ; (d) hr.
Jmse 11 00836 g004
Figure 5. Irregular wave height transformation on the reef topography for different cases: (a) Hs0; (b) T ¯ 0 ; (c) cotθ; (d) hr.
Jmse 11 00836 g005aJmse 11 00836 g005b
Figure 6. Wave propagation process of the vertical seawall on the reef flat for H0 = 0.1 m, T0 = 1.4 s, cotθ = 3, l = 1 m, and hr = 0.05 m.
Jmse 11 00836 g006
Figure 7. Time histories of free surface elevations for the vertical seawall for H0 = 0.1 m (Hs0 = 0.1 m), T0 = 1.4 s ( T ¯ 0 = 1.4 s), cotθ = 3, l = 3 m, and hr = 0.05 m: (a) regular wave; (b) irregular wave.
Jmse 11 00836 g007
Figure 8. Regular wave height transformation for the vertical seawall on the reef flat for different cases: (a) H0; (b) T0; (c) cotθ; (d) hr; (e) l.
Jmse 11 00836 g008
Figure 9. Irregular wave height transformation for the vertical seawall on the reef flat for different cases: (a) Hs0; (b) T ¯ 0 ; (c) cotθ; (d) hr; (e) l.
Jmse 11 00836 g009
Figure 10. Wave propagation process for the sloped seawall on the reef flat for H0 = 0.1 m, T0 = 1.4 s, cotθ = 3, l = 1 m, and hr = 0.05 m.
Jmse 11 00836 g010
Figure 11. Time histories of free surface elevation for the sloped seawall for H0 = 0.1 m (Hs0 = 0.1 m), T0 = 1.4 s ( T ¯ = 1.4 s), cotθ = 3, l = 3 m, hr = 0.05 m: (a) regular wave; (b) irregular wave.
Jmse 11 00836 g011
Figure 12. Regular wave height transformation for the sloped seawall on the reef flat for different cases: (a) H0; (b) T0; (c) cotθ; (d) hr; (e) l.
Jmse 11 00836 g012
Figure 13. Irregular wave height transformation for the sloped seawall for different cases: (a) Hs0; (b) T ¯ 0 ; (c) cotθ; (d) hr; (e) l.
Jmse 11 00836 g013
Figure 14. Variations in irregular wave spectra across the reef for Hs0 = 0.1 m, T ¯ 0 = 1.4 s, cotθ = 3, l = 3 m, and hr = 0.05 m: (a) without seawall; (b) vertical seawall; (c) sloped seawall.
Jmse 11 00836 g014
Figure 15. Time histories of wave pressure on the vertical seawall for the case of H0 = 0.1 m, T0 = 1.4 s, cotθ = 3, hr = 0.05 m: (a) regular wave; (b) irregular wave.
Jmse 11 00836 g015
Figure 16. Regular wave peak pressure distribution along the front surface of the vertical seawall for different cases: (a) H0; (b) T0; (c) cotθ; (d) hr; (e) l.
Jmse 11 00836 g016
Figure 17. Irregular wave peak pressure distribution along the seaward surface of the vertical seawall for different cases: (a) Hs0; (b) T ¯ 0 ; (c) cotθ; (d) hr; (e) l.
Jmse 11 00836 g017
Figure 18. Regular wave peak pressure distribution along the seaward surface of sloped seawall for different cases: (a) H0; (b) T0; (c) cotθ; (d) hr; (e) l.
Jmse 11 00836 g018aJmse 11 00836 g018b
Figure 19. Irregular wave peak pressure distribution along the seaward surface of sloped seawall for different cases: (a) Hs0; (b) T ¯ 0 ; (c) cotθ; (d) hr; (e) l.
Jmse 11 00836 g019aJmse 11 00836 g019b
Figure 20. Regular mean wave overtopping discharge over the vertical seawall for different cases: (a) H0; (b) T0; (c) cotθ; (d) hr.
Jmse 11 00836 g020aJmse 11 00836 g020b
Figure 21. Irregular mean wave overtopping discharge over the vertical seawall for different cases: (a) Hs0; (b) T ¯ 0 ; (c) cotθ; (d) hr.
Jmse 11 00836 g021
Figure 22. Regular mean wave overtopping discharge over the sloped seawall for different cases: (a) H0; (b) T0; (c) cotθ; (d) hr.
Jmse 11 00836 g022
Figure 23. Irregular mean wave overtopping discharge over the sloped seawall for different cases: (a) Hs0; (b) T ¯ 0 ; (c) cotθ; (d) hr.
Jmse 11 00836 g023
Figure 24. Scatter diagrams of the measured and predicted wave forces for the vertical and sloped seawalls: (a) regular wave; (b) irregular wave.
Jmse 11 00836 g024
Figure 25. Scatter diagrams of the measured and predicted mean wave overtopping discharge over the seawalls: (a) regular wave; (b) irregular wave.
Jmse 11 00836 g025
Figure 26. Probability of exceedance of irregular wave force on the vertical seawall for different cases: (a) Hs0; (b) T ¯ 0 ; (c) cotθ; (d) hr; (e) l.
Jmse 11 00836 g026
Figure 27. Probability of exceedance of irregular wave forces on the sloped seawall for different cases: (a) Hs0; (b) T ¯ 0 ; (c) cotθ; (d) hr; (e) l.
Jmse 11 00836 g027
Table 1. Experimental test cases for the regular wave acting on the seawall.
No.cotθT0 (s)hr (m)H0 (m)Seawalll (m)
111.40.050.02, 0.05, 0.1, 0.15//
231.40.050.02, 0.05, 0.1, 0.15//
351.40.050.02, 0.05, 0.1, 0.15//
431.00.050.02, 0.05, 0.1, 0.15//
531.80.050.02, 0.05, 0.1, 0.15//
631.40.020.02, 0.05, 0.1, 0.15//
711.40.050.02, 0.05, 0.1, 0.15vertical seawall1, 3, 5
811.40.050.02, 0.05, 0.1, 0.15sloped seawall1, 3, 5
931.40.050.02, 0.05, 0.1, 0.15vertical seawall1, 3, 5
1031.40.050.02, 0.05, 0.1, 0.15sloped seawall1, 3, 5
1151.40.050.02, 0.05, 0.1, 0.15vertical seawall1, 3, 5
1251.40.050.02, 0.05, 0.1, 0.15sloped seawall1, 3, 5
1331.00.050.02, 0.05, 0.1, 0.15vertical seawall1, 3, 5
1431.00.050.02, 0.05, 0.1, 0.15sloped seawall1, 3, 5
1531.80.050.02, 0.05, 0.1, 0.15vertical seawall1, 3, 5
1631.80.050.02, 0.05, 0.1, 0.15sloped seawall1, 3, 5
1731.40.020.02, 0.05, 0.1, 0.15vertical seawall1, 3, 5
1831.40.020.02, 0.05, 0.1, 0.15sloped seawall1, 3, 5
Table 2. Experimental test cases for the irregular wave acting on the seawall.
No.cotθ T ¯ 0 hr (m)Hs0 (m)Seawalll (m)
111.40.050.05, 0.1//
231.40.050.05, 0.1//
351.40.050.05, 0.1//
431.00.050.05, 0.1//
531.80.050.05, 0.1//
631.40.020.05, 0.1//
711.40.050.05, 0.1vertical seawall1, 3, 5
811.40.050.05, 0.1sloped seawall1, 3, 5
931.40.050.05, 0.1vertical seawall1, 3, 5
1031.40.050.05, 0.1sloped seawall1, 3, 5
1151.40.050.05, 0.1vertical seawall1, 3, 5
1251.40.050.05, 0.1sloped seawall1, 3, 5
1331.00.050.05, 0.1vertical seawall1, 3, 5
1431.00.050.05, 0.1sloped seawall1, 3, 5
1531.80.050.05, 0.1vertical seawall1, 3, 5
1631.80.050.05, 0.1sloped seawall1, 3, 5
1731.40.020.05, 0.1vertical seawall1, 3, 5
1831.40.020.05, 0.1sloped seawall1, 3, 5
Table 3. Empirical coefficients for predicting the wave force on the seawall.
No.a1b1c1d1e1f1
Regular wave1.041.59−0.120.0029−0.210.74
Irregular wave0.300.70−0.43−0.0088−0.360.58
Table 4. Empirical coefficients for predicting the mean wave overtopping discharge over the seawall.
No.a2b2c2d2e2f2
Regular wave0.0059−6.813.21−1.10.130.35
Irregular wave0.0039−2.821.9−0.620.34−0.25
Table 5. Summary of empirical formulas.
Empirical Formula Modification and Contribution
F * = a 1 h r H i b 1 H i g T i 2 c 1 exp d 1 l H i ( cot θ ) e 1 ( sin φ ) f 1 Considered the effect of relative distance l.
Considered the effect of the slope angle of the seawall.
Applied for both regular and irregular waves.
q * = a 2 exp b 2 R c H i + c 2 H i l H i g T i 2 d 2 ( cot θ ) e 2 ( sin φ ) f 2 Considered the effect of relative distance l.
Considered the effect of the slope angle of the seawall.
Applied for both regular and irregular waves.
Disclaimer/Publisher’s Note: The statements, opinions and data contained in all publications are solely those of the individual author(s) and contributor(s) and not of MDPI and/or the editor(s). MDPI and/or the editor(s) disclaim responsibility for any injury to people or property resulting from any ideas, methods, instructions or products referred to in the content.

