1. Introduction
In the last decades, the population living in coastal areas has increased [
1,
2]; it is estimated that approximately 40% of the world’s population lives in these areas [
3], and about 10% is the population living in areas that are at an elevation close to that of the sea (<10 m) [
4]. Consequently, an increase in tourism, economic, and social activities in coastal locations has been observed. This means an increase in the exposed population to coastal flooding and, more generally, in the vulnerability of coastal areas. This must be followed by strong efforts for risk management taking into account also cultural, environmental, and social aspects to be included in vulnerability assessments (e.g., [
5,
6]). However, coastal risk arises from the combination of exposure and vulnerability to one or more hazards (e.g., [
7]).
It is well known that the most important drivers of coastal flooding are storm surges (e.g., [
8,
9]) and wave runup (e.g., [
10,
11]). In particular, the combination of these two phenomena can intensify the effects of flooding along the coastal zone due to wave actions. The sea level can be viewed as the superposition of the tidal component (often referred to as astronomical tide) that is deterministic and the storm surge induced by meteorological forcing. While the astronomical component is not significantly sensitive to climatic variations, the storm surge depends on weather conditions (e.g., [
8,
12]) and is prone to change under the effect of a changing climate. Wave runup and setup (e.g., [
13]), instead, is the elevation of the sea level caused by waves [
10]. It is mainly due to the breaking waves in the surf zone where, besides the energy dissipation due to breaking waves, there is also the variation of the mean sea level at the shoreline [
14]. In that case, IPCC confirmed that modification in the intensity and direction of the waves induced by climate change are to be expected [
15]. As confirmed by the more recent report of the Intergovernmental Panel on Climate Change (IPCC) [
15] adverse impacts of climate change are expected on coastal areas while Pörtner et al. [
16] confirm that the increase in sea levels, combined with wave runup and storm surge, will increase the risk of flooding in the next decades.
Therefore, variations in the accessibility of the coastal area, the functionality of coastal and harbor structures, and the modified hazard of coastal flooding make the study of the potential effects of climate change crucial even considering the possibility of implementing adaptation strategies in the long term to enable stakeholders to integrate them into policies and land management. In this context there are a lot of possible adaptation strategies that can be adopted to increase the future resilience of coastal areas [
17,
18]. However, in order to plan adaptation measures to upcoming changes, it is necessary to evaluate which modifications are expected, which variables are involved, and the magnitude and directions of these variations.
In the literature, the focus is indeed generally on extreme events concerning both waves and storm surges (e.g., [
12,
19,
20,
21,
22]). Minor insights instead concern the case of the average and mild conditions affecting coastal areas (e.g., [
23]). These conditions, although of lesser magnitude, can still be characterized by significant intensity and occur more frequently compared to the return periods commonly considered, for example, in the design of coastal structures (e.g., [
24,
25]). Certainly, it is important to assess how design loads will change in the coming decades to assess the stability of structures. Nevertheless, it is just as important to consider average and mild energy conditions that could locally affect water quality conditions and the sandy beaches’ evolution in the long term (e.g., [
26,
27]).
This work aims to assess and identify whether and what kind of variations can occur in terms of wave intensity, duration, and direction close to the coast considering the predicted climate change scenarios for the analysis of mild energy events (i.e., the variation in wave climate and the sea states in which the significant wave height exceeds a given and low enough threshold).
This paper relies on specific analyses of time series data of sea state synthetic parameters (significant wave height, mean wave direction, mean and peak wave periods) related to the current and future scenarios. The case study of Sardinia island has been considered. To assess the effects of climate change, the current climate scenario (period 2001–2017) has been set as a reference scenario for the two climate change projections, RCP 4.5 and RCP 8.5, extracted from the Copernicus database. The analyses have been performed on the entire reference period, but particular attention was also given to the variability of parameters on a decades scale by examining the variations of the parameters defining the wave climate over windows of 10-year duration. This work focuses the attention only on the wave climate not considering the effects of sea level rise and storm surges that will be considered and analyzed in future studies.
The paper is structured as follows.
Section 2 illustrates the proposed methodology.
Section 3 describes data that may be used for the proposed analysis.
Section 4 describes the results obtained from the application of the method to Sardinia island, while
Section 5 discusses the obtained results.
Section 6 closes the paper with the concluding remarks.
2. Methods
The main goal of this work is the evaluation of possible changes in future climate change scenarios in terms of wave characteristics related to average and mild conditions. To reach this goal, wave time series have to be analyzed considering average and mild energy conditions. Then, two different analyses are proposed to be performed. The first one is applied to the whole time series. The second one is related to the mild- to high-energy events that can be extracted from the time series.
Considering the characterization of the average exposure the wave climate, at given points of interest, may be characterized by considering the persistence of a specific significant wave height. In analogy with a largely used method in hydrology, e.g., [
28], the evaluation of a duration curve of the significant wave height is proposed to be a meaningful tool to highlight variations in the average climate. In detail, the duration curve can be interpreted as a frequency curve (considering the durations referred to the observation period). The duration curve can be then used to extract synthetic parameters, i.e., the significant wave height that is reached or exceeded, on average, for a series of given durations. The duration curve can be used for the characterization of peak period, mean wave direction, and wave steepness as well. As far as the latter is concerned, wave steepness (
) is approximated by the proxy estimated by using the deepwater assumption, using the value of the peak period to evaluate the offshore wave length (
).
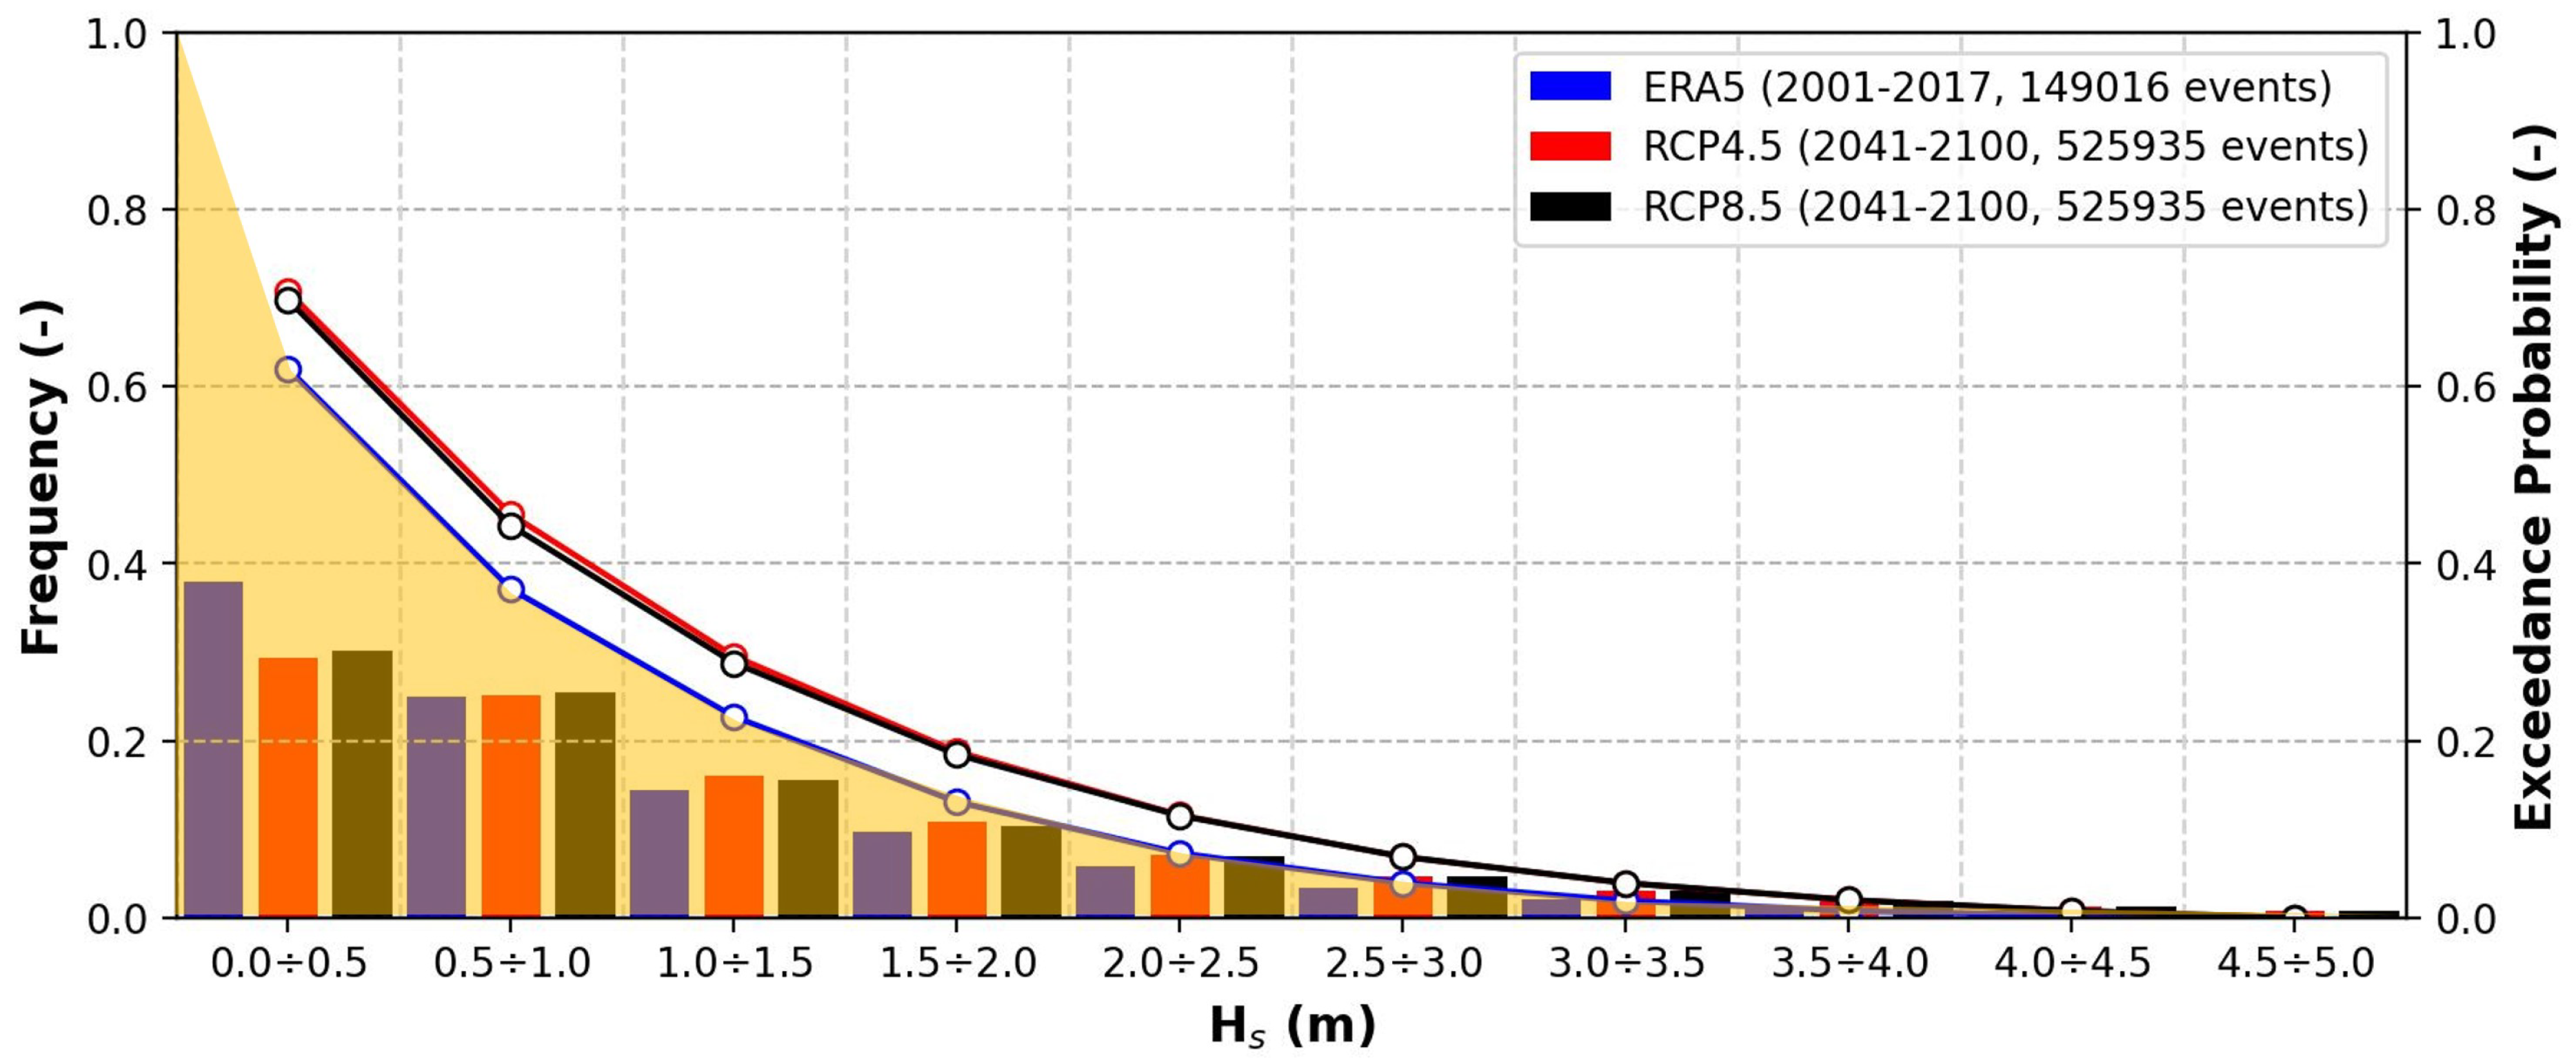
Similarly, with the aim of synthesizing the results, the values of some meaningful statistical measures for characterizing long-term variation can be estimated. On the one hand, the numerical value of the relative frequency of sea states with a significant wave height below the (conventional) threshold of 0.5 m (referred to as “calm” conditions) is specified. On the other hand, the value of the integral, normalized over the integration interval, of the empirical probability function of the significant wave height was estimated (see
Figure 1).
This parameter (hereinafter referred to as ) can be interpreted as the skewness of the empirical probability distribution function. It decreases as the frequency of lower classes increases, and vice versa. This allows us to observe that, if there is an increase in the parameter for climate change scenarios, then this will indicate an increase, on average, in the frequency of higher significant wave height.
Moreover, the characterization of wave-directional sectors can be performed by investigating the empirical probability distribution function of wave directions.
When mild- to high-energy events are concerned, they can be extracted by means of the peak over threshold analysis (POT, e.g., [
29]). More in detail, the extraction aimed to identify the time intervals during which the significant wave height exceeded a given threshold (
). It is important to note that the selection of the threshold is not intended to identify extreme events from a probabilistic point of view, i.e., with a limited probability of exceedance. Rather, it is intended to extract mild- to high-energy events (hereinafter referred to as “storms”).
Statistical characterization of the extracted samples is further achieved in terms of the total number of identified storms, the number of storms for a given duration (i.e., less than 1 day, or within 2 and 3 days, etc.), and the number of storms for which the significant wave height ranges into given classes (i.e., within 2 and 3 m, 3 and 4, etc.). The choice of the threshold values and the classes for the storm duration and the significant wave height relies on the average energetic features of the wave time series. In analogy to the average conditions (i.e., for the analysis of the whole time series), also in the case of storms, the statistical characterization of event duration and of the significant wave height at the peak of the storm can be evaluated considering the empirical probability distribution function and the related skewness parameters is considered. Therefore, if an increase in the parameter (skewness parameter related to storm duration) is observed for climate change scenarios, this will indicate an increase, on average, in the storm duration. Finally, in order to characterize the prevalent wave directions in a point of interest, the empirical probability distribution function of the wave direction has also been used to identify the number of directional sectors the storms come from. Then, prevalent wave direction sectors in a point of interest have also been extracted for characterizing and identifying the number of directional sectors from which waves with a frequency exceed a given threshold by the use of the empirical probability distribution function of the wave direction. Therefore, the obtained results consist of the number of sectors of wave directions corresponding to each sector’s highest frequency (mode), namely the prevailing directions of the main traversal sector and any secondary traversal one.
Figure 2 synthesizes the main features of the proposed methodology.
3. Data
The data analysis described in the preceding section requires time series referring to the current conditions and to future scenarios. In this study, in order to test the feasibility of the proposed method, significant wave height, mean wave propagation direction and average and peak wave periods were extracted from the Copernicus Climate Change Service (hereinafter referred to as C3S) for the two climate change scenarios, RCP 4.5 and RCP 8.5, spanning the period 2041–2100 [
30]. Basically, the time series (for both current and future scenarios) have been estimated by performing an ad hoc numerical investigation by means of the ECMWF’s wave model (SAW) forced by surface winds. The forcing wind was extracted from the EURO-CORDEX climate model ensemble (e.g., [
31]). To have homogeneous time series, i.e., to use the same numerical model for all the considered scenarios, the time series related to the current scenario has been achieved by using the ECMWF’s wave model forced by winds extracted from the ERA5 database (e.g., [
32]). It could then be argued that long-term variations in wave climate can be directly related to variations in the surface wind forcing and to the propagation features at the 20 m bathymetric line (e.g., [
19]) rather than in differences in the numerical implementation. The reanalysis dataset, covering the period 2001–2017, has been taken as representative of the current situation and used as reference to compare both the RCP4.5 and RCP8.5 climate change scenarios. All the considered time series have a temporal resolution equal to 1 h and a spatial resolution of about 30 km at the European coastline along the 20 m bathymetric contour. The readers are referred to Caires and Yan [
30] for further details on the considered datasets.
However, it is essential to note that since the data refer to a single combination of regional and global climate models, it is not possible to provide a definite level of uncertainty associated with long-term climate evolution [
33]. Uncertainty assessment could be carried out by comparing the results obtained by using different EURO-CORDEX climate projections (e.g., [
19]). Nevertheless, this is out of the scope of the manuscript and could be the aim of specific further research work.
4. The Sardinia Island Case Study
The proposed methodology has been applied to the whole coast of Sardinia island. Sardinia is located to the west of Italy, in the Tyrrhenian Sea. It is the second-largest island in the Mediterranean Sea and it is a valuable tourist destination for the presence of beaches of high environmental value and the quality of their bathing waters, beaches, and cliffs of remarkable natural beauty. Moreover, especially during the summer season, the regional economy relies on tourism related to beach activities as well as nautical tourism.
In this context of high vulnerability and exposure, the evaluation of possible variations in the coastal flooding hazard makes crucial the assessment of potential effects of climate change (namely variations in risk indexes), even considering the possibility of implementing adaptation policies to enable stakeholders to integrate them into policies and land management. Considering the extension in latitude, the different exposition of the coasts to wind and waves in different geographical exposures (namely north, east, south, and west), to obtain a comprehensive evaluation across the entire region of a total of 65 points of interest (see
Figure 3) were identified based on their geographical positions along the coast at which the data are available (see
Section 3).
Following the methodology described in
Section 2, the analyses have been carried out for each of the considered points of interest. Consistently with the aim of the work, namely in order to study the long-term climate evolution in Sardinia island, the analyses have been carried out considering the three databases: the current scenario (taken as reference), and RCP 4.5 and RCP 8.5 for the two climate change scenarios. Some of the main results are summarized in the following.
Looking at the average conditions,
Figure 4 shows the significant wave height value with average annual durations of 1 day (
), 1 month (
), and 3 months (
) from top to bottom in each of the 65 considered points.
It can be observed that, for all the considered durations, there is a different trend in the various coastal stretches (north, east, south, and west), and a long-term increase in the long-term projection (i.e., RCP 4.5 and RCP 8.5 in the plots) is noticeable if compared to current conditions (i.e., ERA5 in the plots). The percentage increase (with respect to the current condition, i.e., ERA5) of the significant wave height with an average annual duration of 1 day reaches an average value of 31%. Percentage increases of 27% are observed for the significant wave height with durations of both 1 month and 3 months. The greatest increase is observed, in particular, along the western stretch of the south coast and the entire west coast. It should be underlined that the west coast is directly exposed to harsh weather perturbations coming from NW, besides being affected by meso and sub-mesoscale circulation structures coming from the Atlantic Ocean.
The variation of the average features of sea states is also rather clear by observing the long-term decrease in the frequency of calms (sea states with a significant wave height below the threshold of 0.5 m). On average, the frequency of calms decreases by about 24%. The largest decreases are observed along the east coast of the region, where, however, the frequency still exceeds 40% even for climate change scenarios (
Figure 5, upper panel). On average, the sectors from which sea states originate undergo slight variations. However, there are cases where additional wave sectors appear. This aspect potentially has a strong impact on the long-term evolution of coastlines and the maintenance of port entrances (e.g., [
33]). In fact, there are some points where the average wave climate switches from unimodal to bimodal. Referring to
Figure 5 (lower panel), it is possible to observe that the number of prevailing origin sectors undergoes a modification, particularly for the northern sector of the east coast.
Regarding the long-term evolution of storm characteristics,
Figure 6 shows the average annual number of storms. An increase in the number of storms is observed, which is 46% on average. The greatest increase is observed for the east coast, where, however, the number is lower compared to the other coasts. The analysis of the durations and significant wave heights at the peak of storms reveals additional aspects.
Indeed, despite an increase in the average number of storms for all coastlines, the number of storms with a duration of less than 1 day remains substantially unchanged for the south, west, and north coasts, while those with durations between 1 and 2 days slightly increase (
Figure 7 and
Figure 8).
Except for the east coast, the average increase in storms mainly concerns those with durations longer than 2 days. In addition to this observation, for the south, west, and north coasts, it is evident that the increase in the number of storms is accompanied by an increase in storms with a significant wave height at the peak exceeding 4 m (
Figure 9 and
Figure 10). However, the east coast is an exception. In this case, despite the average increase in the number of storms, those with durations longer than 3 days and with significant wave heights at the peak of the storms exceeding 5 m continue to be infrequent.
As far as the parameters
and
related to storms are concerned (
Figure 11), the analyses revealed that both of them tend to increase in the two climate change scenarios, i.e., there is an increase in the higher classes.
5. Discussion of the Results
The previous section aims to illustrate the results of the analysis performed on the 65 points along Sardinia Island. However, the considered time series have different extensions, in particular 17 years for ERA5, 60 years for RCP 4.5, and RCP 8.5.
Therefore, in order to assess the statistical reliability of the comparison of the results, analyses were carried out on some of the parameters illustrated in the previous section, evaluating them by analyzing time windows of increasing duration. In detail, for each of the considered time series the value of the significant wave height with an annual average duration of 1 day, the frequency of calm periods (sea states with a significant wave height below 0.5 m) and the average annual number of storms have been evaluated. Furthermore, the variation in the mean value of significant wave heights at the peak of the storm was analyzed.
Each of the parameters was estimated based on the analysis of time windows with increasing durations, starting from the initial year of each series (2001 for ERA5, 2040 for RCP 4.5, and RCP 8.5). Hence, the estimations were performed, for each data point, on 18 different durations of the time window for ERA5 and 60 durations for RCP 4.5 and RCP 8.5. A quantitative evaluation of the statistical representativeness of the time series (and analyses) is possible by assessing the stability of the results as the duration of the time window increases. The measure of stability was defined as the relative difference (expressed as a percentage) between the estimation obtained for the longest duration (17 years for ERA5 and 60 years for RCP4.5 and RCP8.5) and the average of the values obtained for the 10 longest time windows (from 9 to 18 years for ERA5, from 51 to 60 years for RCP4.5 and RCP8.5).
Figure 12 shows the estimations carried out at a point located on the west coast. In terms of significant wave height with an annual average duration of 1 day, it can be observed that all estimations tend to “stabilize” for increasing durations and for all considered scenarios. The same big picture can be drawn for the other parameters and for other points.
This observation, although qualitative and referring to a single point, is confirmed by the stability analysis reported in
Figure 13. The relative variation of all parameters remains generally limited to a few percentage points.
More in detail, the results of the analysis of the significant wave height with a duration of 1 day show a stability parameter averaging around 2% for the ERA5 scenario, with values slightly higher than the average for the west coast. For the RCP 4.5 and RCP 8.5 scenarios, the parameter shows average values below 1%. This higher stability is justified by the longer duration of the analysis series. The results of the stability analysis of the frequency of calm periods reveal an average stability parameter below 1%, particularly for the west coast. A similar trend can be observed for the mean value of the significant wave height at the peak of the storm, which exhibits an average stability parameter below 1%, with values above the average for the south and west coasts in the ERA5 scenario. The average number of storms is the parameter that shows the worst stability, with average values higher, especially for the ERA5 scenario and the south and west coasts.
Overall, the analysis results reasonably indicate that the statistical analysis outcomes (i.e., the comparisons between different scenarios) are not significantly influenced by the duration of the data series. However, it is essential to note that since the data refer to a single combination of regional and global climate models, it is not possible to provide a definite level of uncertainty associated with long-term climate evolution [
30].
Some of the analyses conducted for the entire temporal range of the data considered (17 years for ERA5, 60 years for RCP 4.5, and RCP 8.5) were also repeated for decadal time windows. Following the strategy described earlier for verifying the statistical representativeness of the data, some parameters were estimated for time windows with a duration of 10 years, with the first year incrementally varied from the first available year in the series up to the last possible one (i.e., up to the tenth year preceding the last available year in the series). For clarity, 8 decadal windows were analyzed for the ERA5 scenario (from 2001–2010 up to 2008–2017), and similarly, 51 decadal windows were analyzed for the RCP 4.5 and RCP 8.5 scenarios (from 2040–2049 up to 2091–2100).
The analysis of the results reveals that the ERA5 scenario shows a clear increase in the significant wave height with an average annual duration of 1 day (see
Figure 14, similar results were obtained for other points). On the contrary, the future scenarios RCP 4.5 and RCP 8.5 exhibit slightly greater dispersion (still limited to a few tens of centimeters) with a slight tendency towards an increase. Similar observations can be made for the other parameters.
Shifting the focus to the overall picture, the spatial distribution of the standard deviation of the results obtained for all the considered time windows is analyzed (see
Figure 15). It is noted that the dispersion for future scenarios is higher than that of the current scenario.
In general, to build a big picture of the obtained results, it is possible to summarize the key points arising from the analysis of the results.
The results do not reveal significant differences between the two considered climate change scenarios (i.e., RCP 4.5 and RCP 8.5).
On average, the long-term evolution of average conditions shows a tendency towards the intensification of wave climate in Sardinia (see
Figure 4 and
Figure 5).
An increase in the significant wave height value is estimated, with an average annual duration of 1 day, reaching about 30%. The increase decreases to approximately 27% for more frequent sea states (with an average annual duration of up to 3 months; see
Figure 4).
The intensification of wave climate is higher on the west coast of Sardinia compared to other coastal stretches (see
Figure 4 and
Figure 5). It should be underlined that the west coast is currently exposed to harsh weather perturbations.
A decrease in the frequency of sea states with a significant wave height lower than 0.5 m, by about 25%, is estimated (see
Figure 5, upper panel).
The frequency of sea states with a significant wave height between 0.5 m and 1.0 m remains substantially unchanged.
The wave direction sectors remain largely unchanged, except for the northern sector of the eastern coast, where modifications in wave directions are observed (see
Figure 5, lower panel): the unimodal wave climate in the current scenario is estimated to exhibit bimodal characteristics in future projections.
The average annual number of storms (sea states with a significant wave height greater than 2 m) experiences an increase of about 46% (see
Figure 6).
For the southern, western, and northern coasts, the increase in the number of storms mainly concerns those lasting more than 2 days, with a significant wave height at the peak exceeding 4 m (see
Figure 7).
For the eastern coast, despite an increase in the average annual number of storms, a low frequency is estimated for storms lasting more than 3 days, with significant wave heights at the peak exceeding 5 m (see
Figure 8,
Figure 9 and
Figure 10).
The analysis conducted on a decade-long basis reveals some dispersion (still limited to an average standard deviation of approximately 0.20 m) for the estimates of the future evolution of the significant wave height with an average annual duration of 1 day, higher than that obtained for the current scenario (see
Figure 14).
The increase of the
parameter indicates, on average, an increase in the frequency of higher significant wave height (see
Figure 11 upper panel).
The increase of the
parameter indicates, on average, an increase in the storm duration (see
Figure 11 lower panel).
The comparison of the obtained results with past studies reveals not always consistent conclusions. For instance, the increase in the 90th percentiles of the empirical cumulative distribution function of the significant wave height on the west coast agrees with the results achieved by Simonetti and Cappietti [
34]. Instead, looking at [
19,
35] (that used different datasets), opposite results have been obtained, i.e., in the Mediterranean Sea the significant wave height shows a negative trend. This difference could be referred to the different datasets (e.g., [
34] used the same dataset used in this study) and to the different rationale of the analysis. Indeed, it has to be stressed that detailed comparisons are not possible since this work presents the study of different parameters (i.e., the number of events or the frequency of the calm conditions) that have seldom been considered in previous works.
6. Concluding Remarks
A methodology to assess the wave forcing at a regional scale in a climate change scenario is proposed. The methodology is aimed to characterize average and mild- to high-energy sea states, often analyzed in the foreground in the literature. Considering long-term variation, instead, the analysis of events with lesser magnitude, but occurring with greater frequency than extreme ones, can be useful to plan, for example, adaptation strategies to climate change.
The main idea is to estimate (standard) parameters from the whole time series that can summarize if variations in wave climate are expected to happen. The methodology analyzes the duration curves of the significant wave height, variations in calm conditions, the number of directional sectors of waves, or the average annual number of sea states with a wave height at the peak of the storm exceeding a given threshold. Moreover, variations in the average annual number of storms with given durations have been considered.
The methodology has been applied to the case of Sardinia island. A detailed analysis of the statistical representativeness of the results shows that they are not significantly influenced by the duration of the time series. However, it has to be underlined that the data refer to a single member of regional and global climate models, therefore it is not possible to provide a definite level of uncertainty associated with long-term climate evolution.
Moreover, the Sardinia case study demonstrates that general trends do not always comprehensively summarize the specific situation. Different coastal stretches can have different long-term projections. In practice, data and information about the variation in wave climate (in terms of intensity and direction) provide the necessary knowledge to the public authority (in charge of long-term adaptation planning) about either possible variations in sediment transport that influence coastal morphodynamics or possible variations of coastal hydrodynamics that influence bathing water quality. Just as a further example, variations in wave direction may influence the safety of existing port entrances. The obtained results demonstrate that the proposed methodology allows to outline of changing trends in the parameters that influence the intensity, duration, and prevalent direction of storms in a changing climate.


