Article

Notes on Towed Self-Propulsion Experiments with Simulated Managed Ice in Traditional Towing Tanks

by
José Enrique Gutiérrez-Romero
1,
Blas Zamora-Parra
2,*,
Samuel Ruiz-Capel
3,
Jerónimo Esteve-Pérez
1,
Alejandro López-Belchí
1,
Pablo Romero-Tello
1 and
Antonio José Lorente-López
1
1
Department of Naval Architecture Technology, Universidad Politécnica de Cartagena, Paseo Alfonso XIII 52, 30203 Cartagena, Spain
2
Department of Thermal and Fluids Engineering, Universidad Politécnica de Cartagena, Paseo Alfonso XIII 52, 30203 Cartagena, Spain
3
Department of Built Environment, Oslo Metropolitan University (OsloMet), Post Box 4, St Olavs Plass, N-0130 Oslo, Norway
*
Author to whom correspondence should be addressed.
J. Mar. Sci. Eng. 2024, 12(10), 1691; https://doi.org/10.3390/jmse12101691
Submission received: 2 August 2024 / Revised: 4 September 2024 / Accepted: 22 September 2024 / Published: 24 September 2024
(This article belongs to the Special Issue Ice-Structure Interaction in Marine Engineering)

Abstract

:
Efficiency estimation of a propeller behind a vessel’s hull while sailing through ice floes, together with the ship’s resistance to motion, is a key factor in designing the power plant and determining the safety measures of a ship. This paper encloses the results from the experiments conducted at the CEHINAV towing tank, which consisted of analyzing the influence of the concentration at the free surface of artificial blocks, simulating ice, in propeller–block interactions. Thrust and torque were measured for a towed self-propelled ship model through simulated broken ice blocks made of paraffin wax. Three block concentrations of different block sizes and three model speeds were studied during the experimentation. Open-water self-propulsion tests and artificial broken ice towed self-propulsion tests are shown and compared in this work. The most relevant observations are outlined at the end of this paper, as well as some guidelines for conducting artificial ice-towed self-propulsion tests in traditional towing tanks.

1. Introduction

Rising global warming effects and continuous pollutant gas emissions from human activities are notoriously affecting the state of current and future sea ice. This phenomenon is especially relevant in the poles, where the increase in temperature is higher than in other regions of the globe [1]. Sea ice recedes in extensions year by year, as well as the maximum average thickness it reaches [2]. This is expected to worsen in the future, as suggested by worldwide measurements (Integrated Pollution Prevention and Control, IPPC, European Directive 2008/1/EC; Industrial Emissions Directive, IED, European Directive 2010/75/EU; Corbett et al. [3]).
Besides the negative effects of this event, it may also present opportunities in shipping, such as the opening of northern Arctic routes for navigation in almost ice-free waters [4]. However, sea ice may always be present when sailing in the high latitudes of the planet, posing a risk to safety during navigation under harsh conditions. Navigation in ice may be unforeseeable, thus the study of ship navigation in ice plays an essential role in preventing accidents in such conditions. In addition, the current interest in exploiting resources in the Arctic and the opening of Arctic routes have boosted the construction and study of this type of vessel, which is suitable for polar navigation [5]. The effects of global warming are spreading navigation and maritime research, placing a greater focus on polar regions.
Ship–ice and propeller–ice interactions are complex processes that require the development of numerous testing methodologies able to capture this complexity. Therefore, various studies have been carried out within this field, with the aim of obtaining patterns from these interactions or estimating the total resistance of a vessel when sailing in ice-infested waters.
The prediction of the added resistance by ice has been widely studied by several authors [6,7,8,9,10]. When a ship is sailing through ice, the flow around the hull is modified by the ice floes encountered in nature, or by those ice pieces resulting from the ice-breaking process. The total ship resistance can be decomposed into several components, such as those proposed by Lindqvist [11] and Riska [12], involving ice breaking, crushing, clearance of ice pieces to the sides, and friction or buoyancy of the submerged pieces with the hull.
Since sea ice is frequently encountered in the form of ice floes or brash ice [13] during polar navigation, several authors have tried to estimate ship resistance in such conditions. Experimental tests are restricted to those special facilities that can provide proper conditions for testing in ice, called ice basins. From these towing tank tests, it is possible to obtain relationships between different parameters such as ship speed, ice concentration, ice size, and ice thickness, along with total ship resistance [14,15,16,17]. Although these types of tests provide accurate results, the high cost incurred in conducting an experimental campaign in these facilities pushes researchers to develop new numerical tools, which generally incur much lower costs and testing time.
With the increase in computational capabilities during recent years, these tests are usually performed to validate or adjust numerical tools. For instance, Zhang et al. [18], performed Computational Fluid Dynamics (CFD) coupled with Discrete Element Method (DEM) simulations to investigate the contact model and properties in the ship–ice interaction. Numerical results were compared with those from experimental tests in brash ice, conducted at the Hamburg Ship Model Basin (HSVA). They compared the total mean resistance, as well as different models of contact between ship and ice and ice shape, which influences ship ice resistance. They concluded that the features observed in the numerical model agreed with those from the experimental tests. The CFD–DEM approach is becoming very popular, and is usually validated with experimental tests in ice basins [16,19,20].
These methods have proven to be appropriate to study the ship–ice interaction process. However, the flow around the hull modified by the ice, as well as ice floes, pieces, and particles, can reach the propeller. The propeller–ice interaction has been studied in various works. The most utilized model to study this phenomenon is that proposed by Wang [21]. He studied the propeller–ice interaction of a podded propulsor in ice. Ice loads during the propeller–ice interaction process were divided into ice contact loads, resulting from the contact between the propeller blades and ice; inseparable hydrodynamic loads, which are suction loads produced by blockage of the flow due to the presence of ice; and separable hydrodynamic loads, which are the traditional open-water hydrodynamic loads.
In order to further isolate the components of the propeller–ice interaction process, Bach and Myland [22] proposed a set of experimental tests to study the ice contact load, removing hydrodynamic loads. For that purpose, they performed an ice milling test in the air with a model podded propeller and ice made according to HSVA standard procedures. They measured thrust and torque and produced visual data to better understand how impact occurs between a propeller and ice. The effect of cavitation was also found to be significant in podded ice-capable vessels during the cavitation tunnel tests performed by Sampson et al. [23].
The CFD–DEM approach is also common within the study of the propeller–ice interaction. CFD–DEM approach is frequently used to model ship–ice interactions, whilst other methods are used to model the characteristics of the propeller–ice interaction process. Xie et al. [24] proposed the Discretized Propeller Model (DPM) and the Body Force Model (BFM) to simulate this process; the BFM provided better results. Yang et al. [25] modeled the propeller–ice interaction with the DEM–FEM (Finite Element Method) approach. FEM was also used by Khan et al. [26], coupled with a panel-based code and empirical formulas, to study the effect of the presence of ice on the propeller. All these numerical methods were validated or adjusted with experimental tests.
Since numerical methods still necessitate experimental tests to validate their accuracy, researchers have tried to reduce the costs of ice basin experiments by proposing alternative testing materials. Various studies are found either for the propeller–ice or hull–ice interaction processes with artificial ice. Sampson et al. [23] performed their experiments with artificial ice blocks made from resin cast. Huisman et al. [27] proposed a warm model of ice to determine whether the crushing strength of ice is a dominant parameter in the propeller–ice interaction process. Two warm models of ice were tested, one based on expanded polystyrene (EPS) beads and the other on “E-por” beads, with both bounded by paraffin. These models provided similar properties for crushing strength to that of sea ice. Xiong et al. [28] studied the influence of the cut debris and loads applied on a propeller when cutting an artificial ice block made of liquid paraffin mixed with quartz and silicon powders, as proposed by Tian and Huang [29].
Emerging tools such as Artificial Intelligence (AI) have also been applied to various aspects of this field of research. For instance, Dong et al. [17] implemented a method to identify ice channel edges based on the lane detection algorithm UFAST, which can potentially lead to a great advance in the autonomous navigation of ships through ice channels. The tool was trained and tested with a dataset of built ice channels, and the results show that the predictions have an average accuracy of 84.1%. The database is complemented with rendered synthetically generated images.
Artificial ice floes to conduct towing tank tests have been simulated with polypropylene (PP) by Zong et al. [7]. Van der Werf [30] also used PP to simulate a pre-sawn ice channel surrounded by large PP plates, imitating the procedures conducted in ice basins. Paraffin wax and its variations have been widely employed in this type of test due to its similar physical and mechanical properties to ice [22,23,27,28,31,32]. Kim et al. [31,32] used semi-refined paraffin wax to make triangular ice floes, and they compared the towing tank test results from artificial ice with those of an ice basin. The experimental results were used to successfully validate a numerical tool. In a previous work (Gutiérrez-Romero et al. [6]), we used macro-crystalline paraffin wax to simulate rectangular ice floes of two sizes. An experimental campaign of towing tank tests with the Research Vessel (RV) Hespérides was developed for different speeds and block concentrations. We used photogrammetry to capture the initial position of each block, which was essential for a later reproduction of the initial conditions in towing tank tests for the development of a numerical tool.
Several works study the isolated effect of hull–ice and propeller–ice interactions to find new models and methods to tackle these phenomena. A greater understanding of the isolated effects of these interactions will lead to better physical and numerical models, and eventually a more accurate prediction of the behavior of a vessel in these conditions. The global influence of ice on the flow around the hull and propeller of a ship can be quantified by measuring the total resistance of a vessel with its propeller, that is, through towed self-propulsion tests. Xie et al. [33] presented a coupled CFD–DEM approach to study the self-propulsion efficiency of a Panamax bulker reinforced for sea ice navigation through an ice channel. The simulation results reasonably reproduced ship–ice and propeller–ice interaction processes, obtaining differences of 8.5% between tested and simulated power. Experimental tests in an ice basin were performed by Wang and Jones [34]. They conducted towing propulsion tests in ice and open water by using an overloading propeller method. Hellman et al. [35] also conducted towed propulsion tests in brash ice.
Although few studies have been performed for towed self-propulsion, all of them incurred high testing costs since they were performed in ice basin facilities. This paper proposes a thorough description of a methodology to conduct towed self-propulsion tests with artificial ice. Ice floes are simulated as appointed by Gutiérrez-Romero et al. [6], breaking and crushing of the floes are neglected, and the interaction with the propeller is reduced to avoid damage to the propeller that could prevent the performance of the test. The interaction of the simulated ice floes with the flow around the hull and propeller is measured with a load cell that provides the value of the model resistance during the towed self-propulsion tests. These results will be useful to validate future numerical tools, and guidelines to conduct this type of test in traditional towing tanks, performed under room temperature conditions, can be derived.
This manuscript is organized into different sections. Firstly, the ship model and testing facilities are presented. Secondly, the set-up for the experiments is introduced. Next, the results obtained from the tests are shown and analyzed, including a data uncertainty study. A description of the methodology followed to carry out the experimentation is shown for testing artificial ice in traditional towing tanks. Finally, the main conclusions and findings reached throughout the work are outlined.

2. Testing Facilities and Ship Model

In this section, the facilities where the tests were conducted, the selected ship model, and the artificial ice blocks made of paraffin wax for simulating managed ice are described. As mentioned above, the goal of this paper is to propose a methodology and show results to test ship models under certain conditions of free surface block coverages in traditional towing tanks, where making ice is not possible, either for towing tank tests or towed self-propulsion tests. The latter type of test is described in this paper.

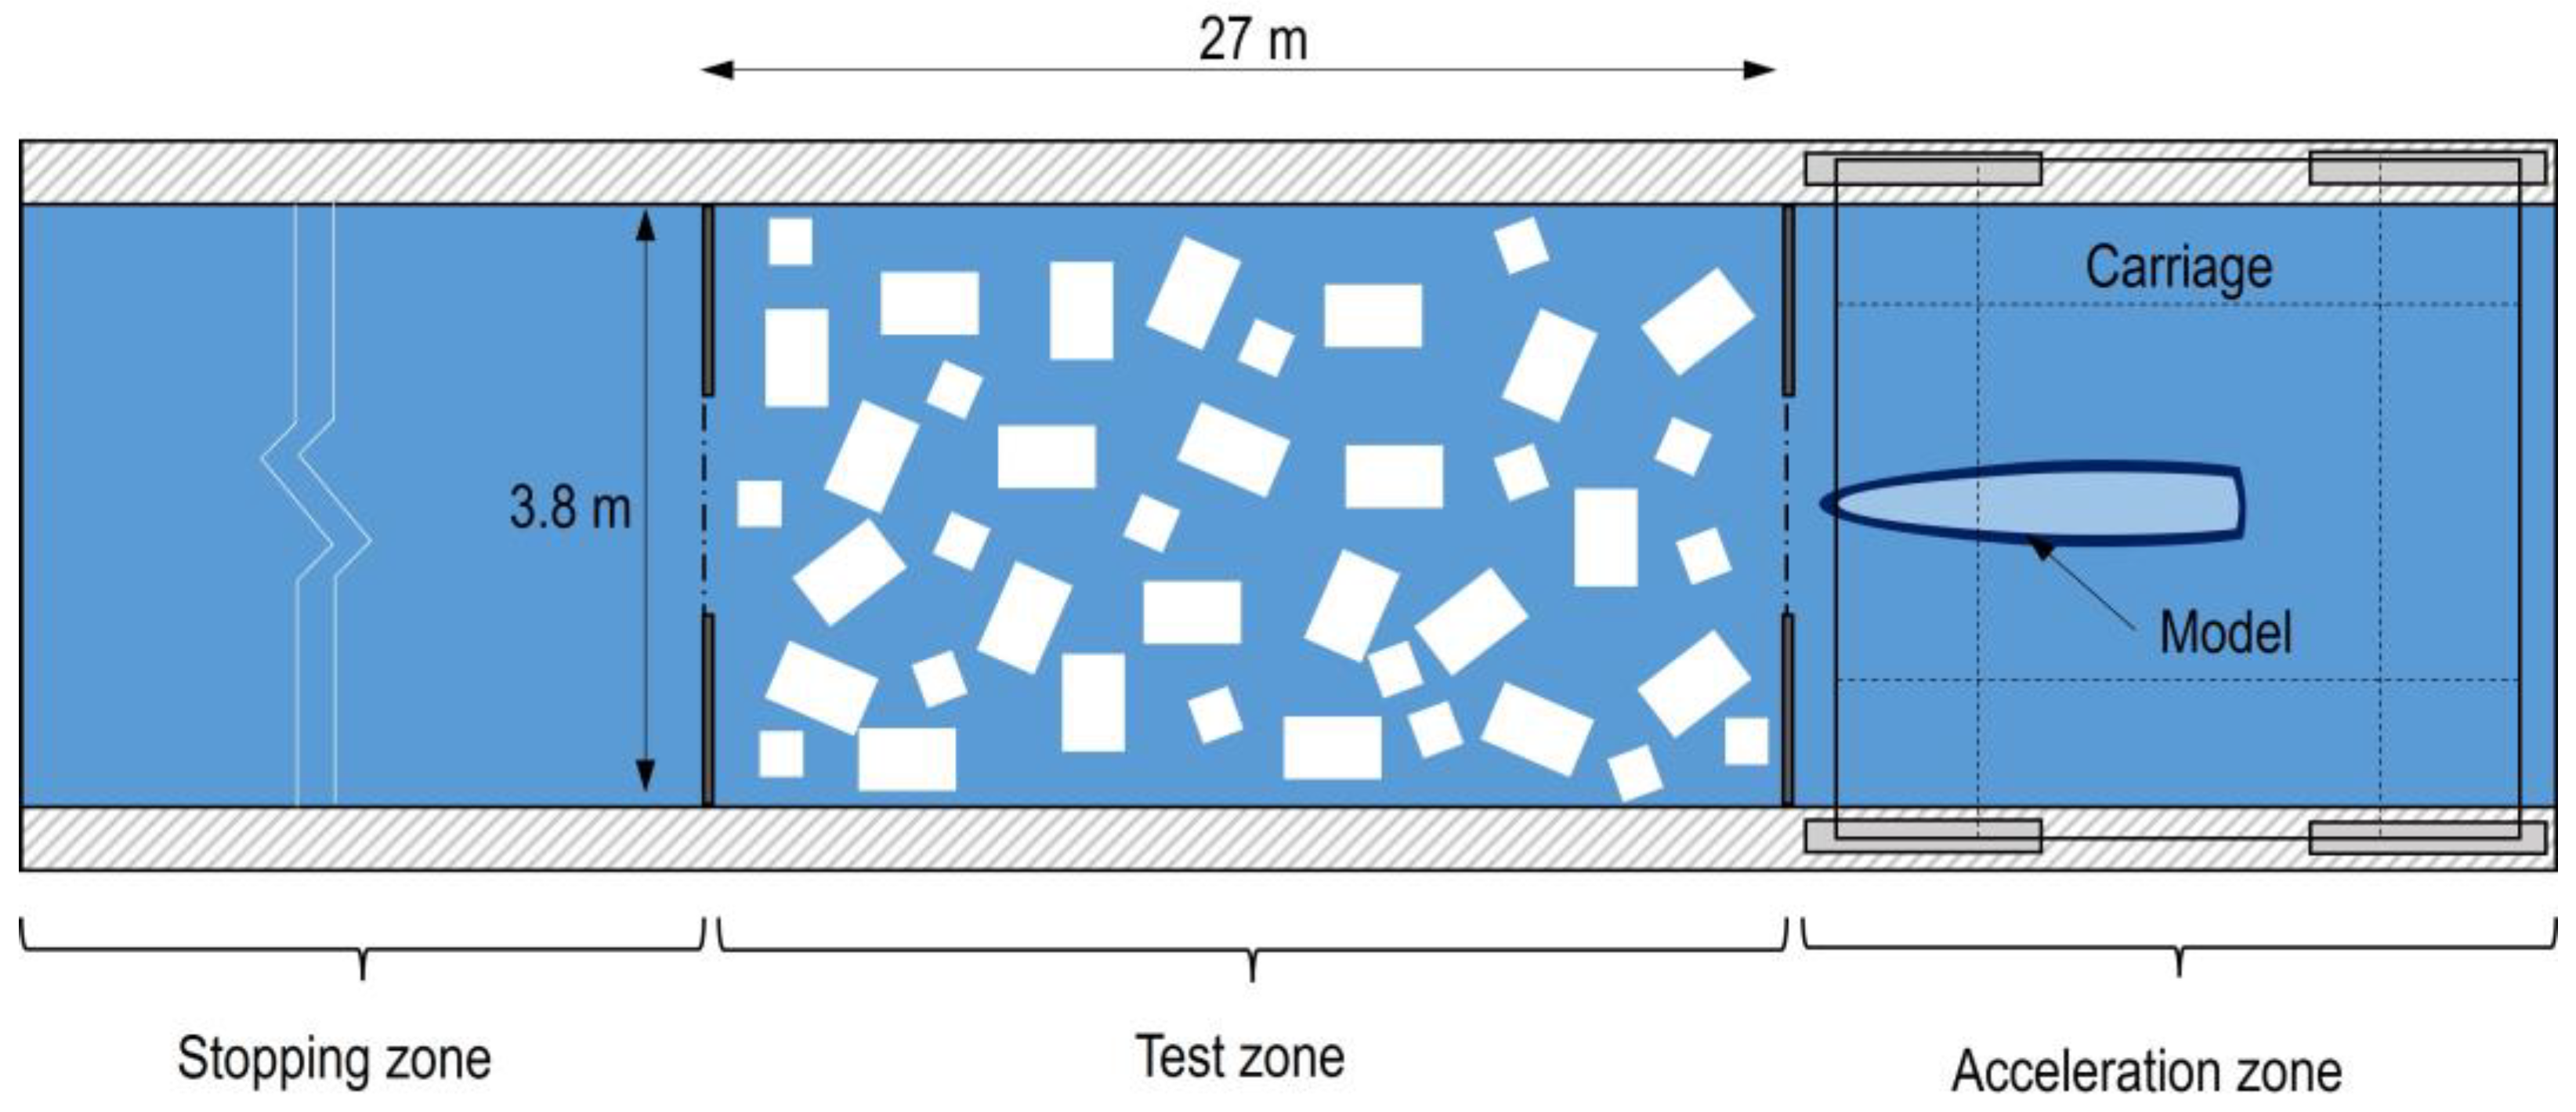
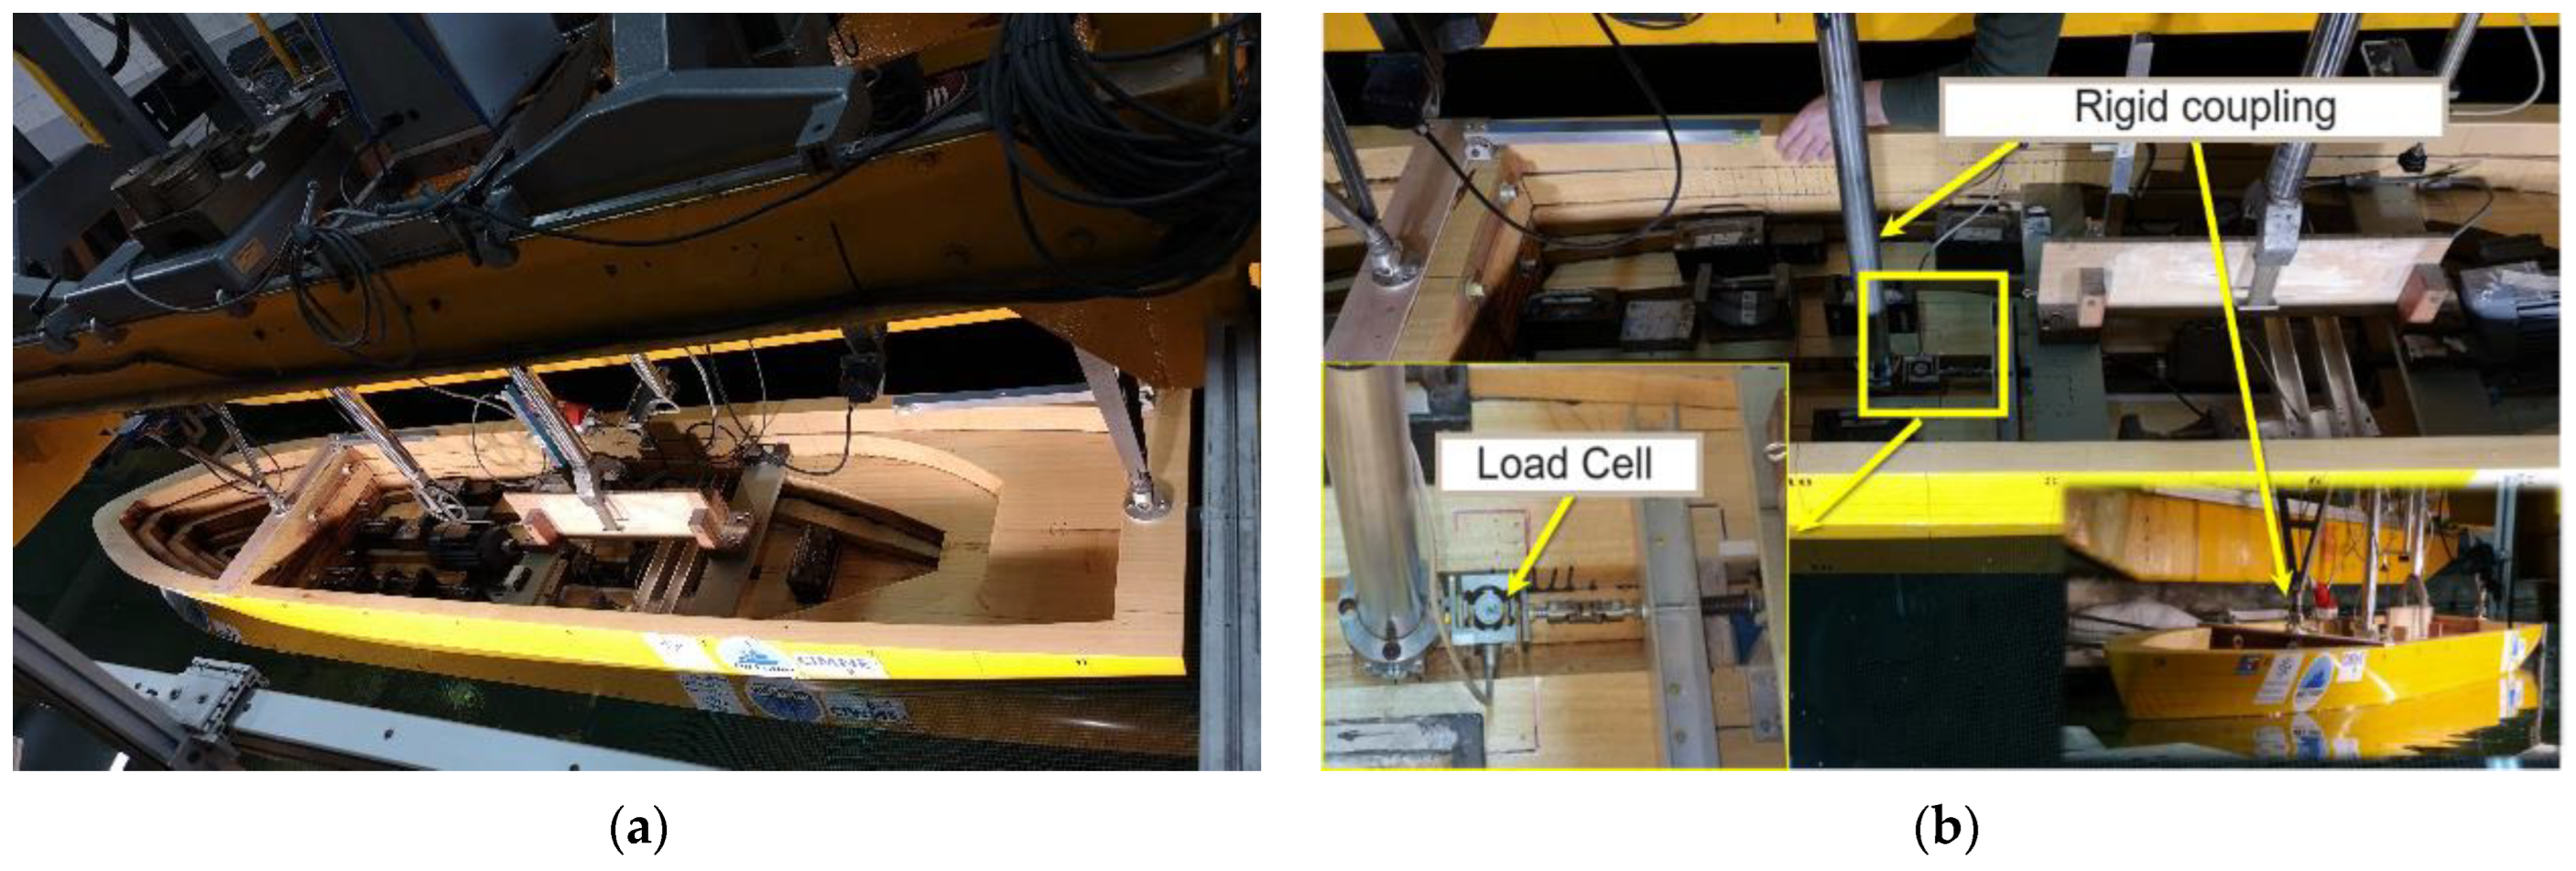
2.1. CEHINAV Testing Facilities

The tests were conducted in the CEHINAV (“Canal de Ensayos Hidrodinámicos de la ETSI Navales”) towing tank, at the Technical School of Naval Architects (ETSIN) of the Technical University of Madrid (UPM). CEHINAV has been an ITTC member since 1990, and their experience is supported by the numerous studies in ship hydrodynamics that have been performed there. To carry out the towing tank tests, as well as the towed self-propulsion tests, the tank has been divided into three different zones: an acceleration zone; a zone with floating blocks at the free surface for testing that is confined by metallic fences; and a deceleration or stopping zone (see Figure 1).
The main dimensions of the towing tank are a length of 100 m, a width of 3.8 m, and a depth of 2.2 m. The length of the confined or test zone has been selected according to ITTC guidelines [36]. ITTC procedures recommend at least 1.5–2.0 times the ship length to obtain reliable values of different parameters to be measured [36]. The segmentation hypothesis was considered for signal analyses. The length of the test zone was reduced for practical purposes (a length of 27 m, which is seven times the ship length) and the number of experiments was increased in both the resistance [6] and towed-self propulsion tests. In general, five segments of the signal were considered [6]. Note that these procedures and guidelines have been established for testing in level ice, not for floating ice floes [36]. As described in a previous work conducted by Gutierrez-Romero et al. [6], these tests simulate navigation through an ice patch, obtaining appropriate results for the designed tests.

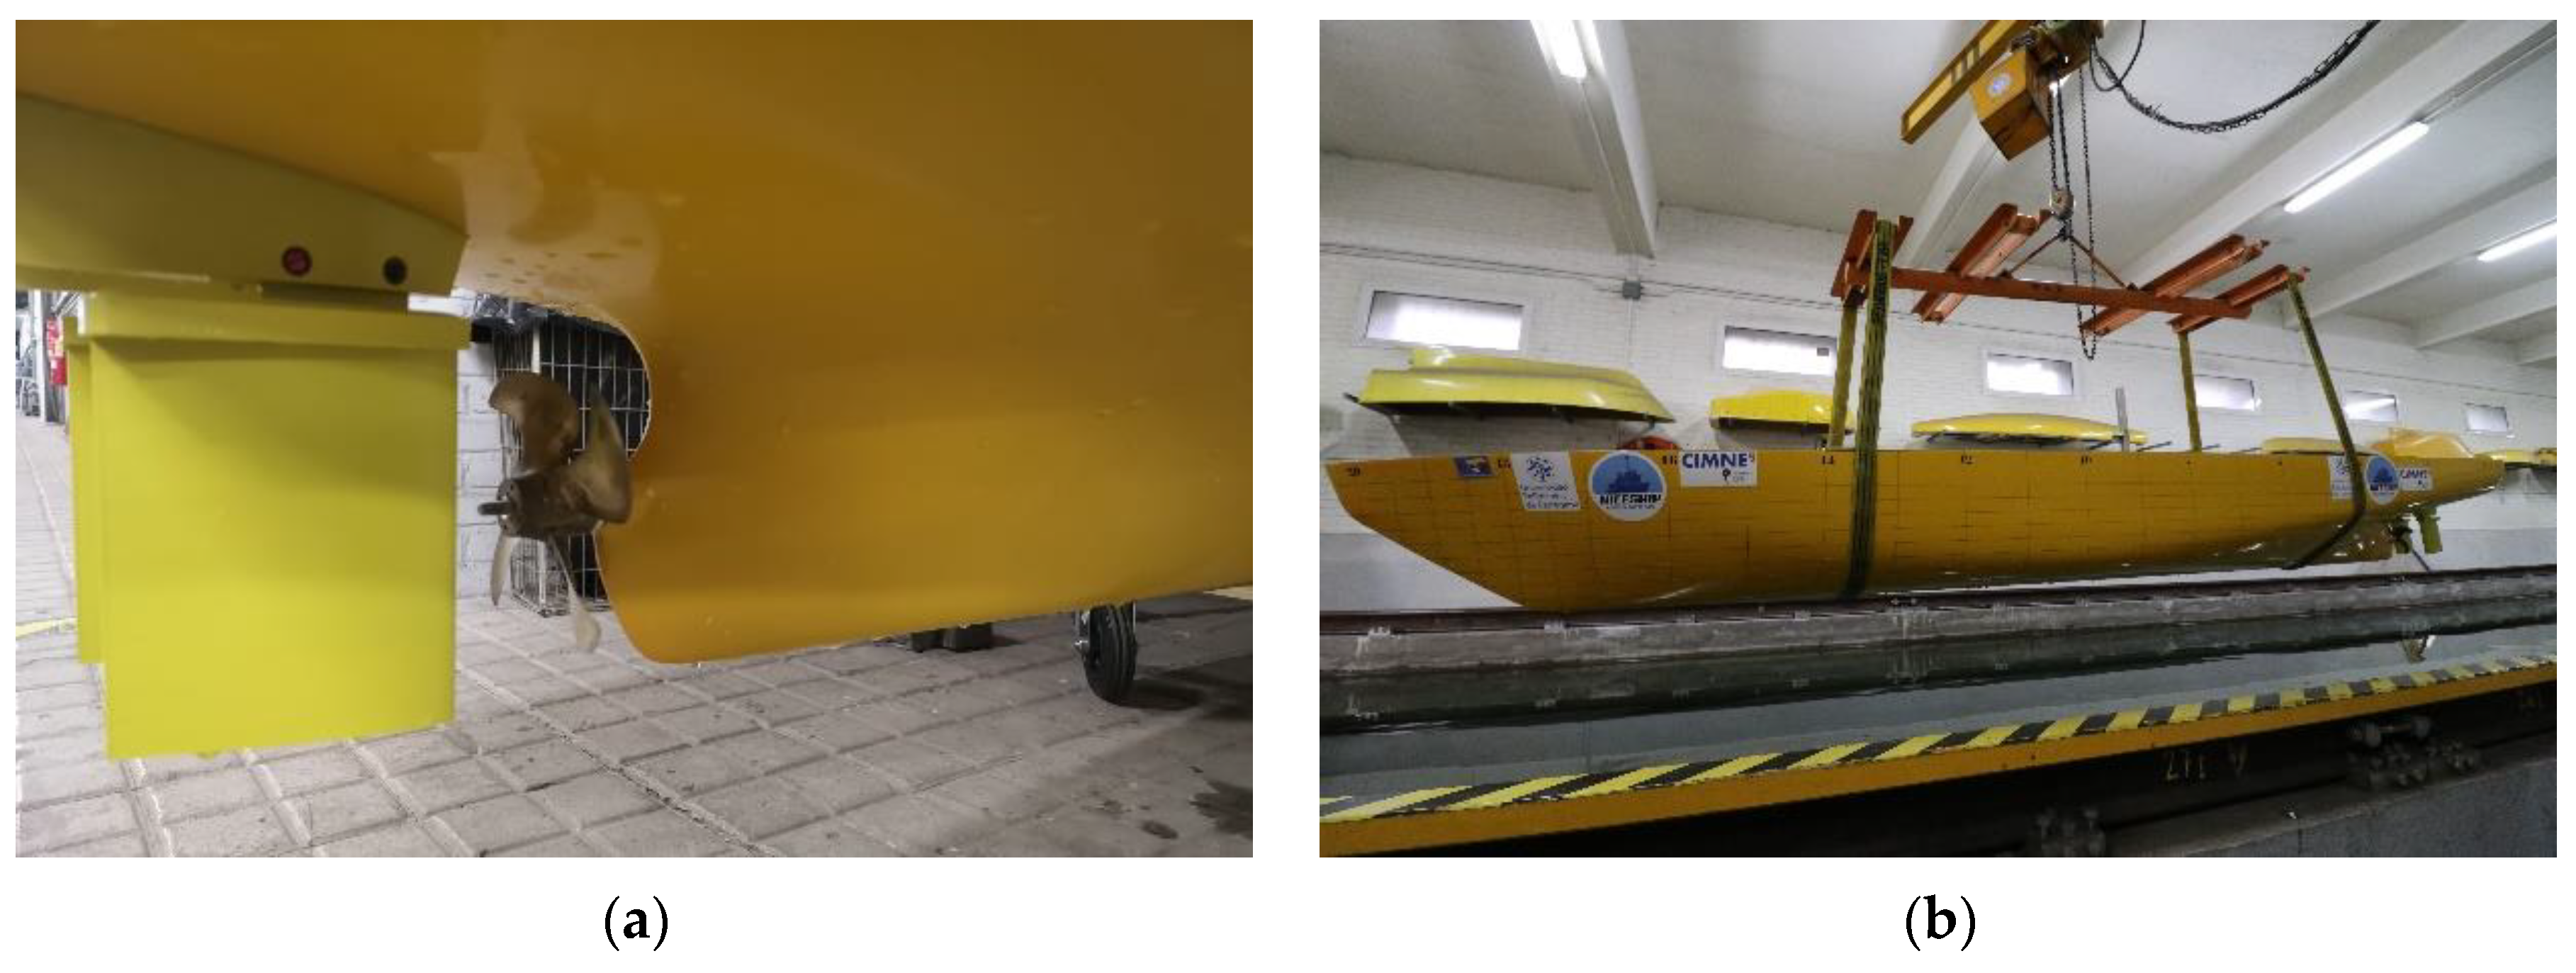
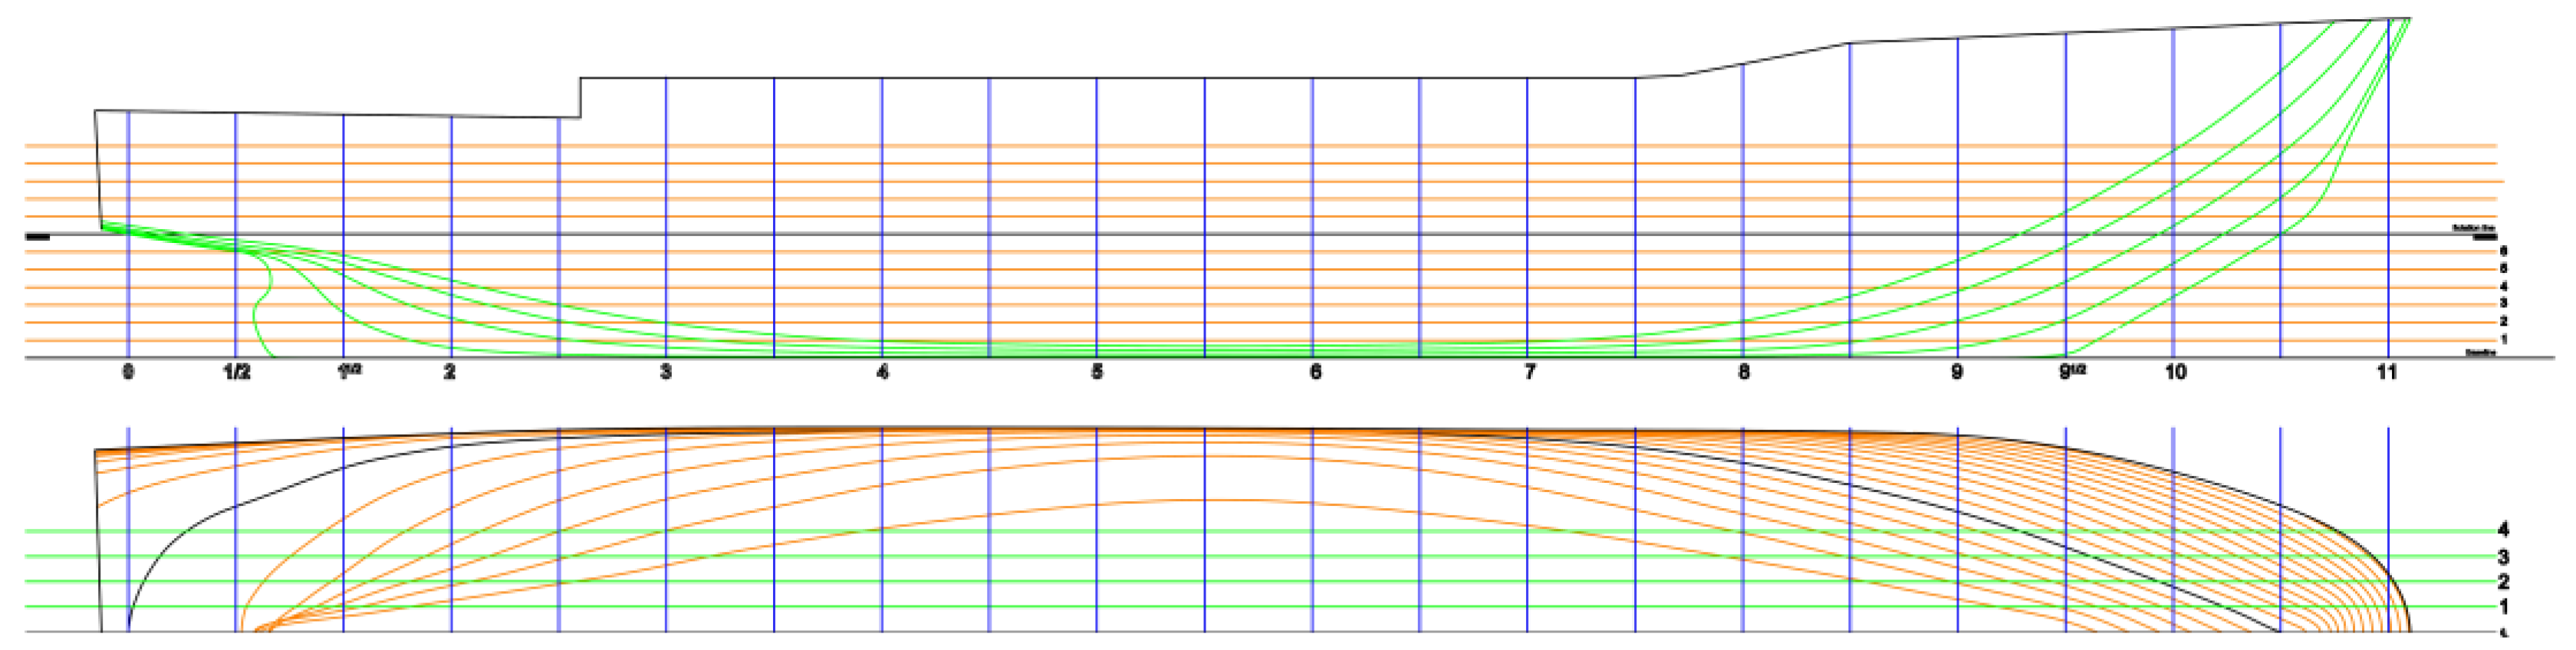
2.2. Hespérides Ship Model

The tested model is based on the Spanish Army’s Research Vessel Hespérides [37]. This vessel has two rudders installed (see Figure 2a) and a compromise bow that allows navigation under mild ice conditions. The main features of the full-scale vessel are shown in Table 1. As was pointed out in a previous work [6], the model scale was restricted to the thickness of the artificial floating ice blocks. The scale used for the tests either for the model or for the propeller is 1:21.43. Figure 2b shows the model built for the tests, while Figure 3 shows the plan of the hull lines for the selected vessel. The model scale was selected according to two main reasons: to reduce scale effects by building a model as large as possible, and the thickness of the simulated floes. In the last case, the average manufacturing thickness of the blocks was 39.3 mm [6]. Considering the class rules [38,39] for the construction of polar ships, a typical ice flow thickness of 840 mm was considered for the full-scale vessel. This ratio, along with the previous one, determined the scale of the tested model.

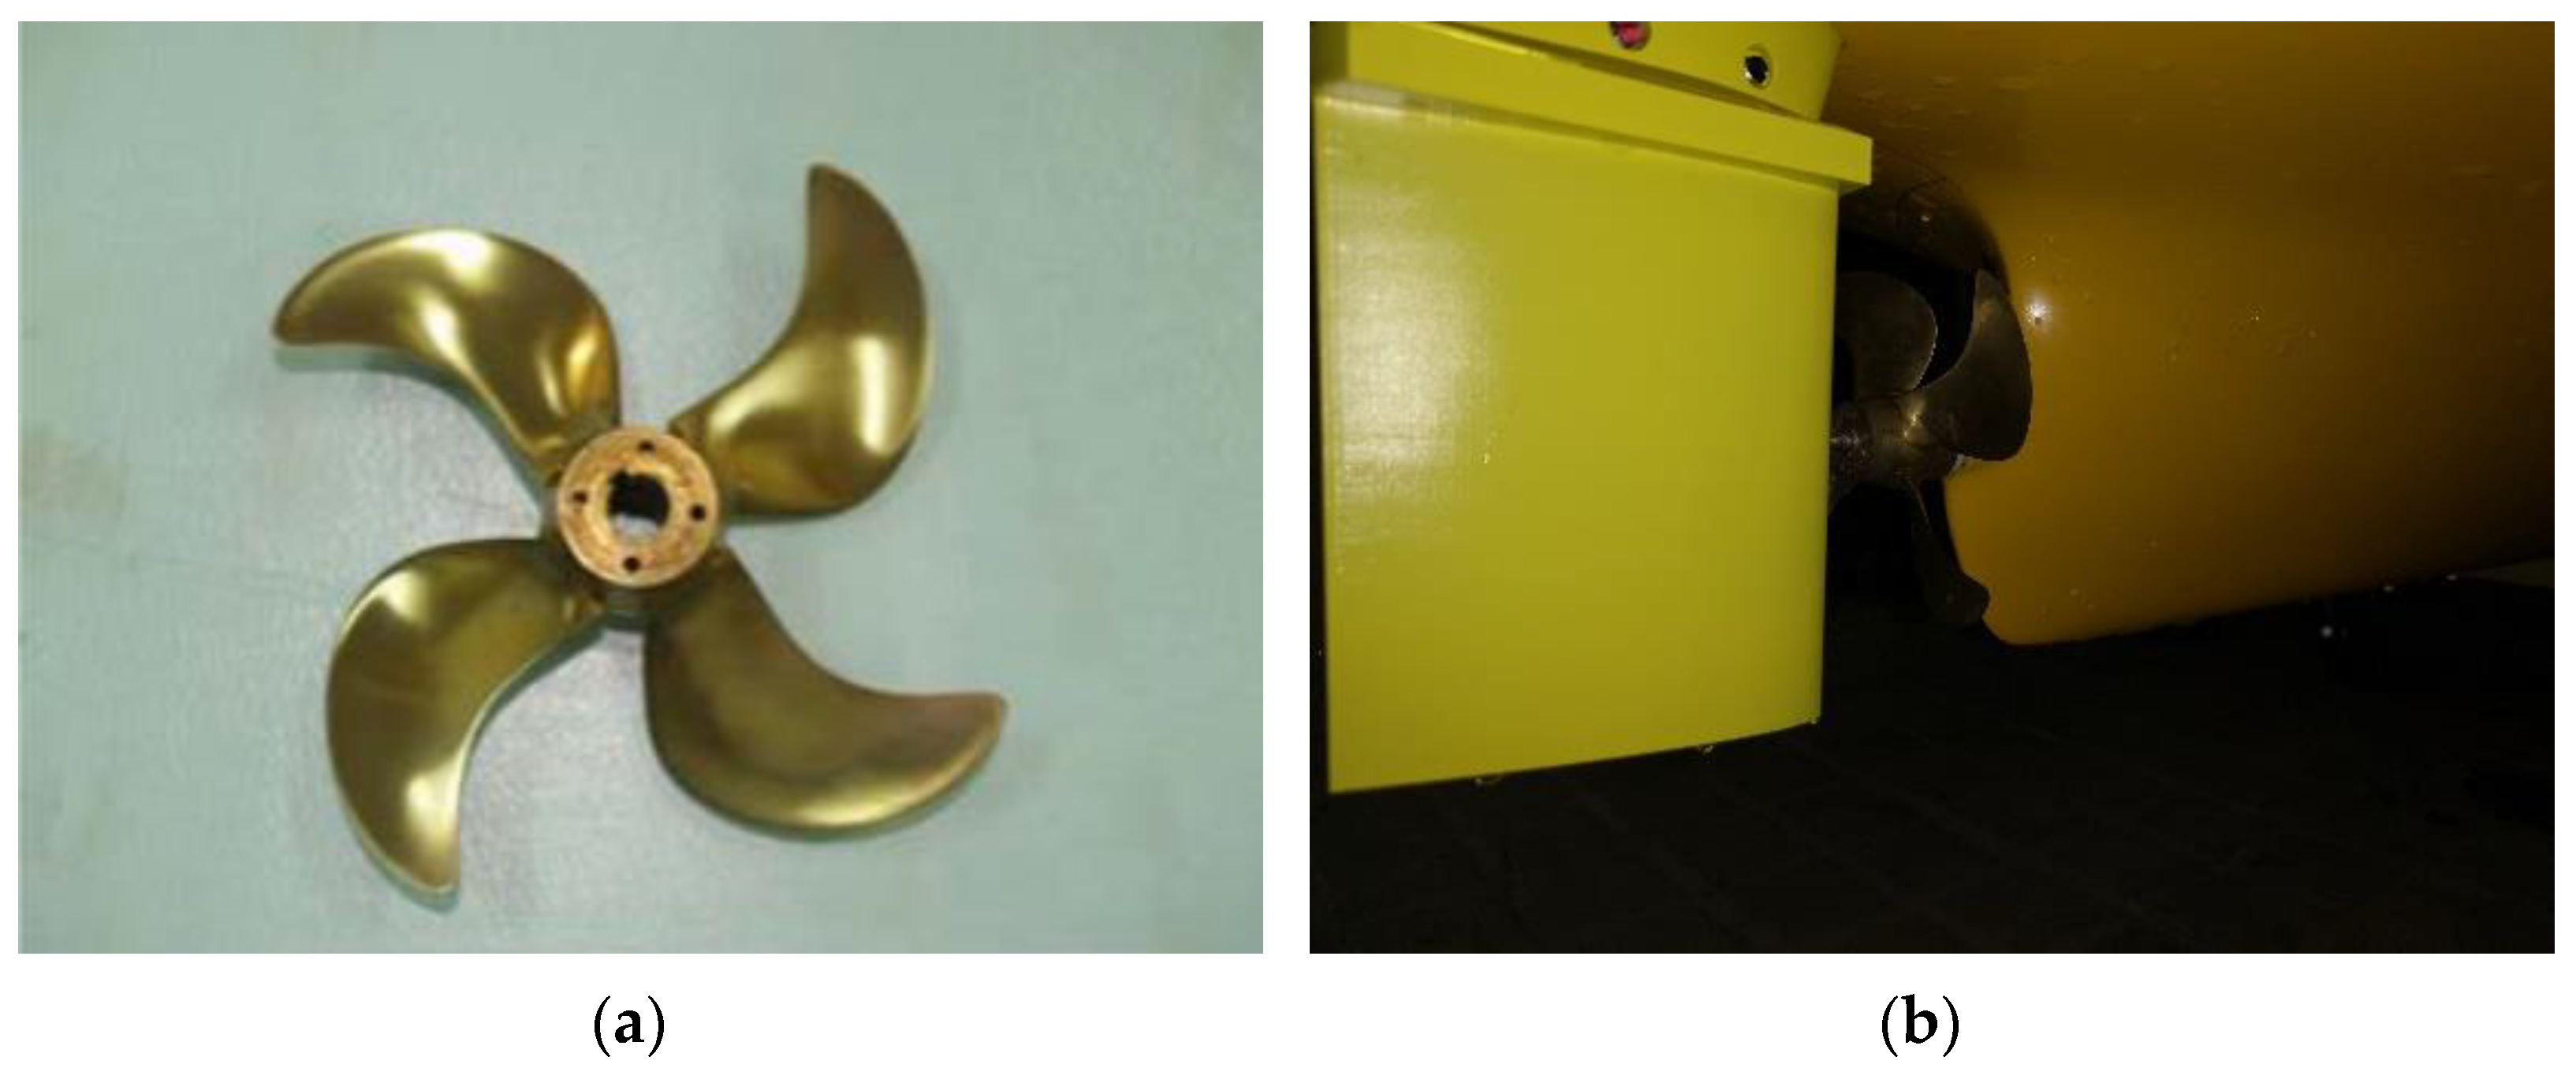
2.3. Features of the Propeller

To perform towed self-propulsion tests, a four-blade propeller has been used (see Figure 4), whose features are shown in Table 2. This propeller is similar to the one installed on the full-scale ship [37].

3. Set-Up for the Experimental Campaign

In this section, the set-up for the experiments is introduced. Features are described related to the block coverage, model speeds, and previous tests such as open water tests and self-propulsion tests without blocks on the free surface. The latter are described further in this paper. As shown by Gutierrez-Romero et al. [6], macrocrystalline paraffin wax with ice-like physical and mechanical properties was used to simulate the presence of broken ice blocks on the free surface during the tests [6,7,30].

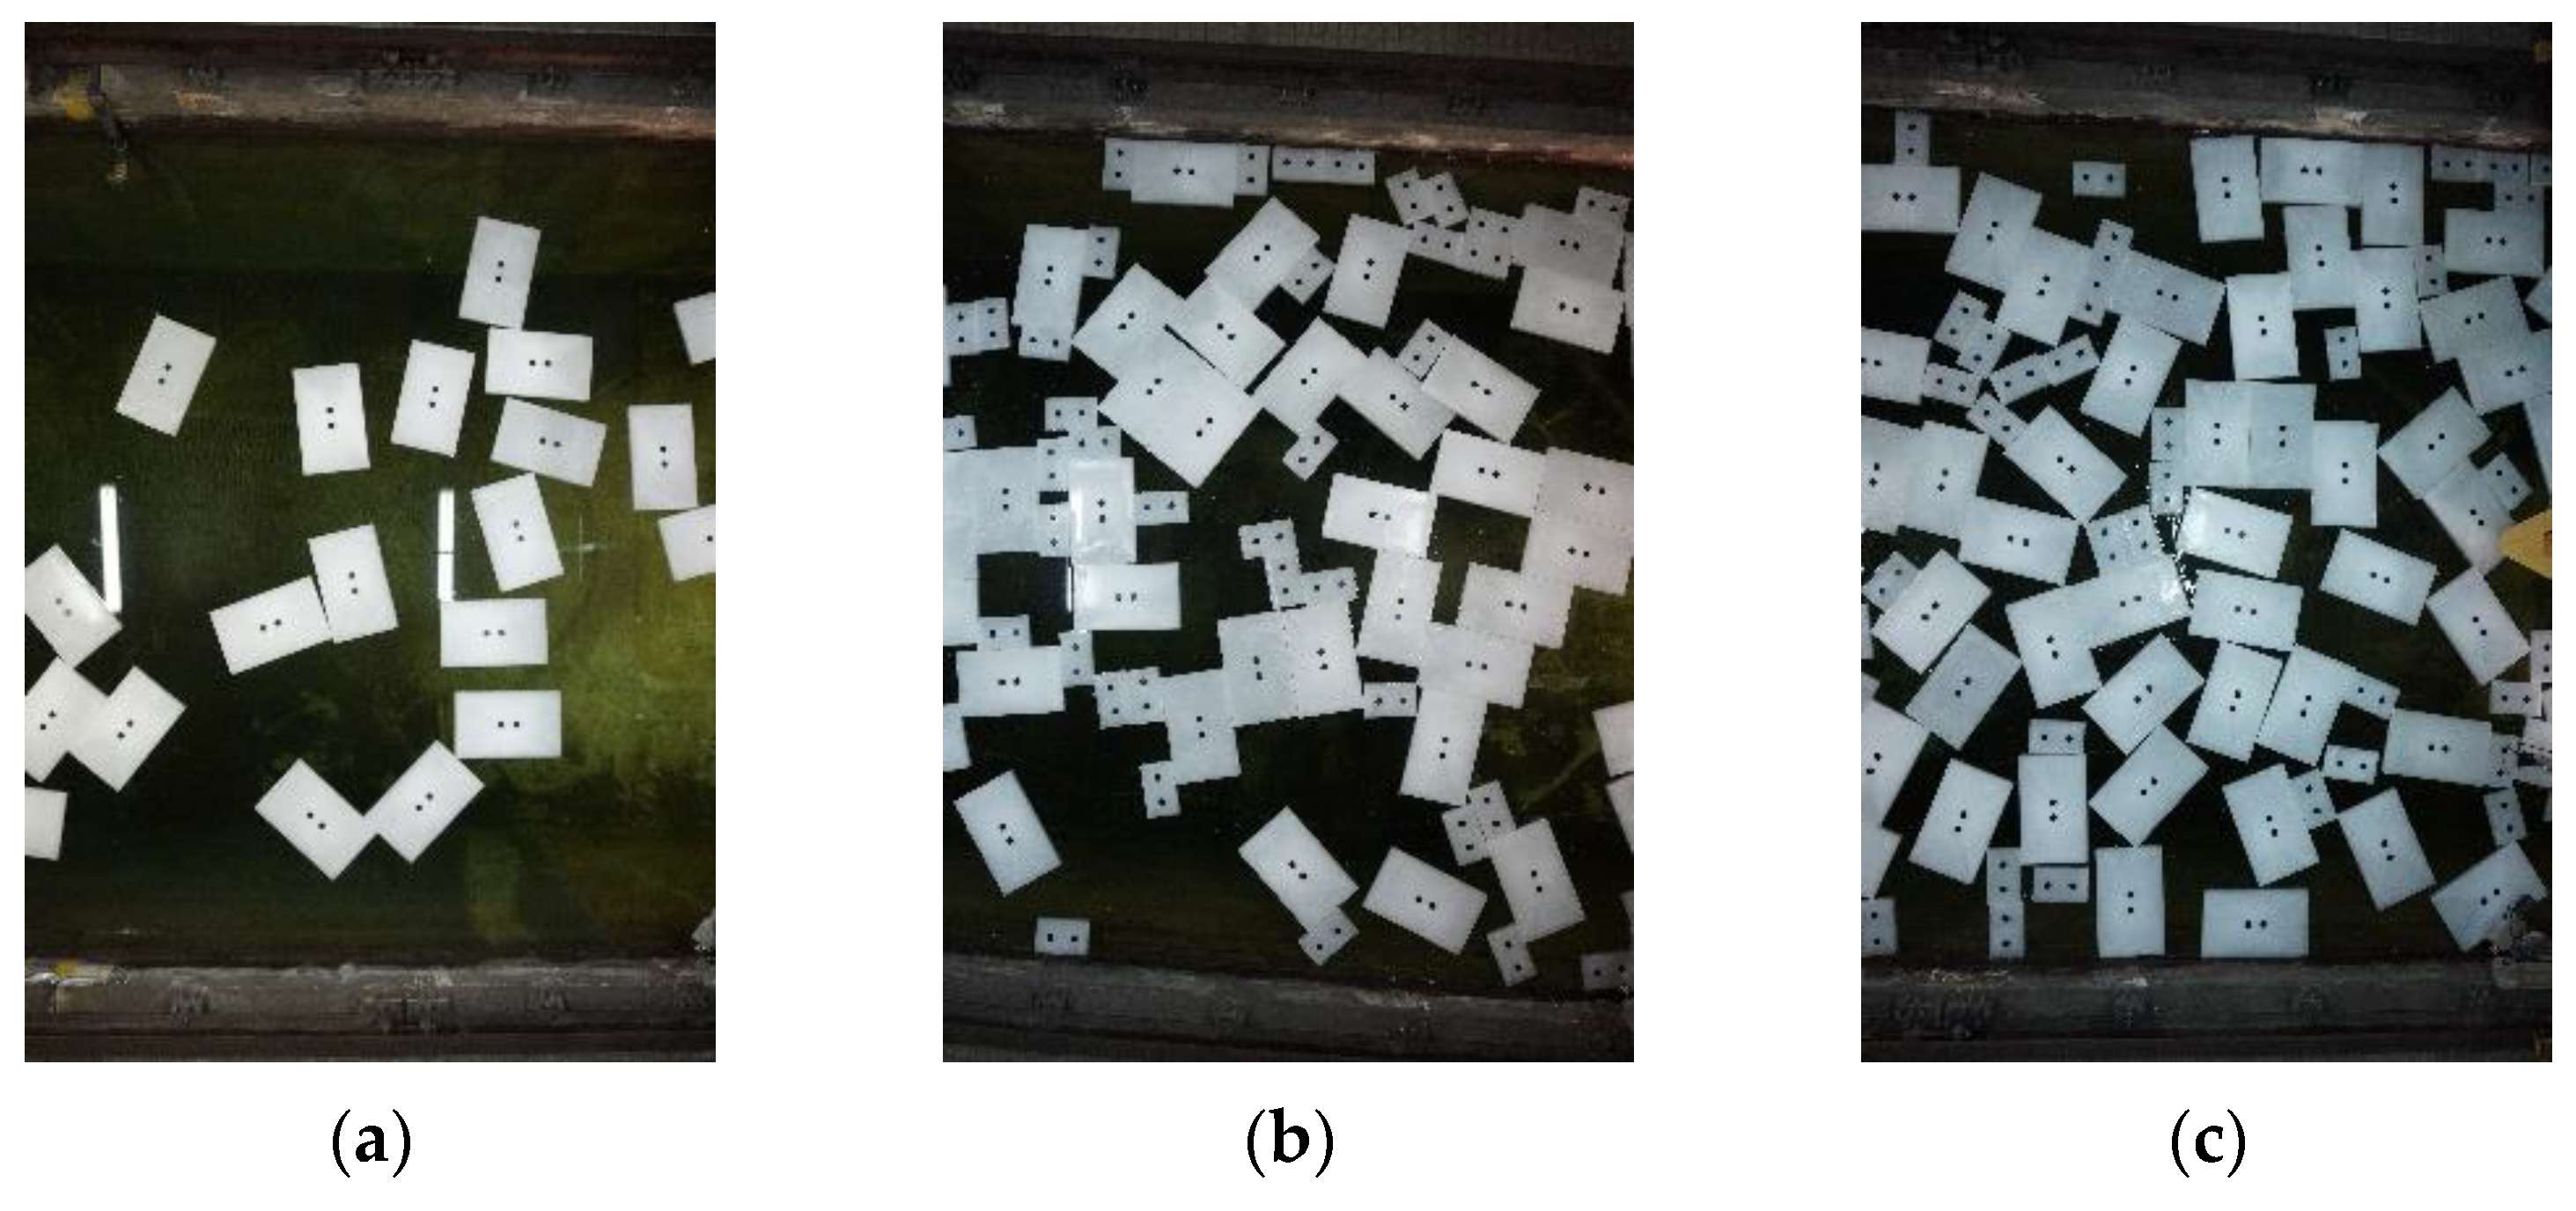
3.1. Paraffin Wax as Floes

Experimentation in sea ice navigation is costly and complex due to the need for specific experimental facilities and thermal conditions. The ITTC highlights the high expenses and time involved [40]. However, new techniques are emerging to reduce these costs, driven by increased interest in polar technology.
Trends in using artificial ice for ship navigation studies are also noted. Different materials have been used to simulate ice behavior in experiments. For instance, an aqueous solution with chemical compounds (diluted aqueous solution of ethylene glycol (EG), aliphatic detergent (AD), and sugar (S)—the EG/AD/S mixture) mimics sea ice properties but requires refrigeration (Timco [41]). Alternatives include materials such as paraffin wax, which matches sea ice density, or polypropylene, which has been used in other studies [7,42].
In this experiment, paraffin wax was considered because it matches the density of ice floes (830 kg/m3), and the main experimental goal was to serve as a benchmark study of the interaction of simulated ice floes with ships [6] in traditional towing tanks, unlocking other perspectives in this type of study. Clearing resistance was the key factor studied, and no breaking resistance was considered. More information about paraffin wax can be found in [6]. Additionally, towed self-propulsion tests were conducted.
The movement of simulated ice floes can be considered rigid-body motion due to negligible flexural or elastic deformation. This research did not account for breaking resistance, and similar assumptions to other previous works [7,42] were made to prevent artificial floes from failing under bending stresses.

3.2. Free Surface Coverage Distribution for the Tests

Three different block coverages were selected to perform the tests. Two different block sizes were selected to simulate realistic ice conditions in the distribution of the blocks. The features regarding the block size are widely described and available in Gutierrez-Romero et al. [6]. Block distribution on the free surface is shown in Table 3.
The free surface block distribution for each test was randomly chosen to obtain a distribution that was as homogeneous as possible in the testing zone. Figure 5a–c shows examples of each of the three tested coverages.
As previously mentioned, the recommendations are for level ice conditions, not for ice floes. The experiments simulated a ship navigating across an ice patch smaller than 27 m, with dimensions large enough to obtain valid results.

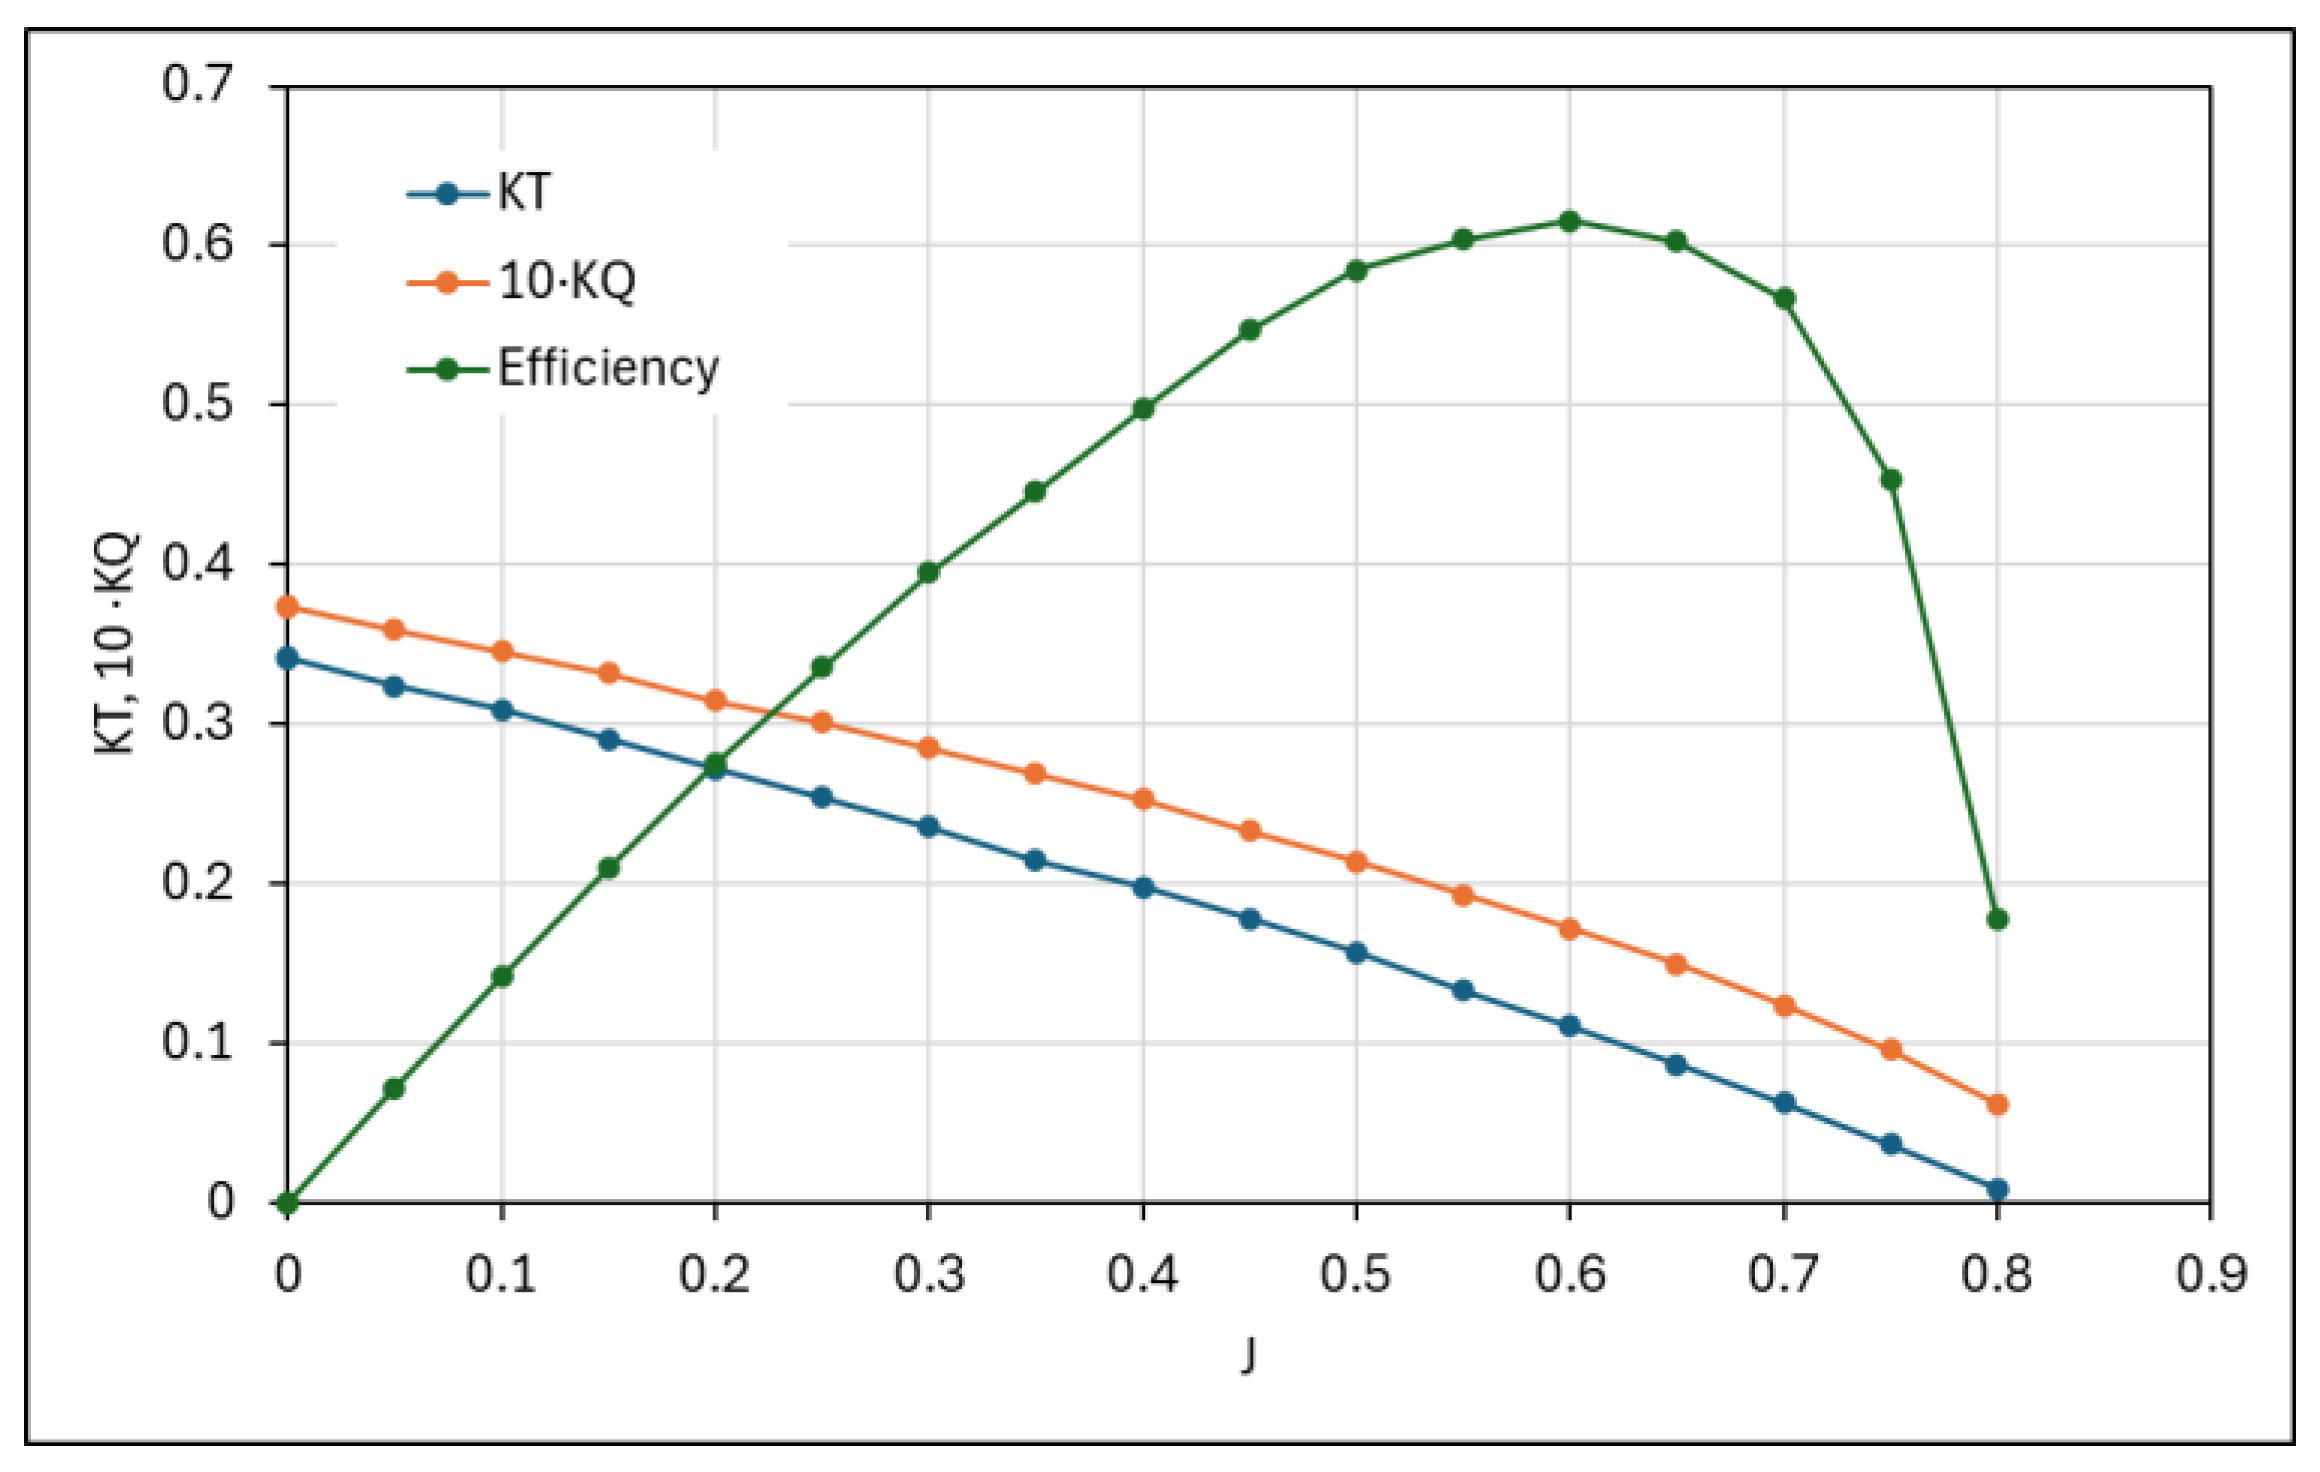
3.3. Preliminary Isolated and Open Water Self-Propulsion Tests

Finnish–Swedish Ice Class Rules (FSICR) [43] recommend 5 knots as the designated speed for the power requirements of icebreakers. Although the Hesperides ship is not a proper icebreaker, for the experiments, three different speeds of the full-scale vessel below the reference speed were selected based on realistic assumptions: 2.0, 3.0, and 4.8 knots corresponding with a model speed of 0.22, 0.33, and 0.53 m/s, respectively. Speeds over 5 knots are not desirable for carrying out resistance tests in ice (or simulated ice). These speeds were set for the towing tank tests as well as for the towed self-propulsion tests. The experimental campaign consisted of a total number of 45 towing tank tests with floating blocks [6] and 20 towed self-propulsion tests. Additionally, other tests whose results have not been included were performed, as they were used to calibrate the final configuration of the testing system.
The testing zone was confined by two metallic fences at the beginning and end, which allowed us to perform the tests and keep the block coverage constant. The presence of the fences at the end of the test channel sometimes increases the coverage because the mass of blocks moves along with the ship model. From the conclusions of the previous work [6], these metallic devices produce block jams at the end of the confined test zone, increasing the resistance to motion exerted by the blocks. This occurs because there is an increment in the local surface coverage in this area due to the forward movement of the ship.
Next, parameters and coefficients needed to understand the results are defined. Thrust and torque coefficients are, respectively, defined as
K T = T ρ n 2 D 4 ,
K Q = Q ρ n 2 D 5 ,
T and Q are the thrust and torque, respectively, ρ is the water density, n is the rotational speed of the propeller, and D is the propeller diameter.
The advance coefficient, J, and the propeller’s open water efficiency (η0) are defined, respectively, as
J = V A n D ,
η 0 = T   V A 2 π n Q ,
where VA is the speed of the vessel.
Initially, open water tests and self-propulsion tests were conducted to obtain the features of the propeller. Figure 6 shows KTJ, 10 KQJ, and open water efficiency (η0) curves obtained from the open water test. These curves show a high correlation for linear regression (values of coefficient regression, R2, are indicated),
K T = 0.4064   J + 0.3511 R 2 = 0.995 ,
10   K Q = 0.3697   J + 0.3869 R 2 = 0.985 .
From the self-propulsion tests, without floating blocks, the values of the advance number (J) for the full-scale propeller can be obtained, as well as the effective wake (w), relative rotative efficiency (ηR), and thrust deduction coefficient (t) for the studied range of speeds (see Table 4).
From the given values for the advance number of the propeller, it is assumed that the propeller works within an appropriate range of operating conditions (see the open water diagram in Figure 6). It is observed that the propeller works well for a range of full-scale speeds between 5.34 and 9.34 knots. Subsequently, it can be assumed that the behavior of the propeller is not optimal at lower speeds. From these facts, it can be inferred that the installed propeller on the full-scale vessel was designed for navigation in open water, not optimized for the low-speed regime. This means a loss in propulsive efficiency when operating at lower speeds. The extrapolated results to the full-scale vessel are shown in Table 5.

4. Discussion of Results

In this section, results from the towed self-propulsion tests with floating blocks are shown. Different values of thrust and torque at several speeds are presented, for different free surface coverages. Table 6 shows the values of model speed (VA) and coverage as a percentage (C) versus mean torque ( Q ¯ ) and mean thrust ( T ¯ ).
Table 7, Table 8 and Table 9 show the statistical data of thrust and torque for each performed test. The root mean square (RMS) and random uncertainty (U) are shown. Random uncertainty values were obtained following ITTC procedures [40], and signal segmentation and the Chauvenet criterion were used to eliminate outliers from the raw data. Figure 7 compares the thrust and torque time signals at different speeds with the same coverage. The shown signals were filtered with a moving average. Data related to the bias uncertainty can be found in [44].
Of the total number of tests, two were discarded as the values obtained were outliers. It can be observed that both thrust and torque decrease as test speed increases. Figure 8a shows how thrust is almost constant over percentages of block coverage, while Figure 8b shows a decrease in torque as block coverage increases for the same speed.

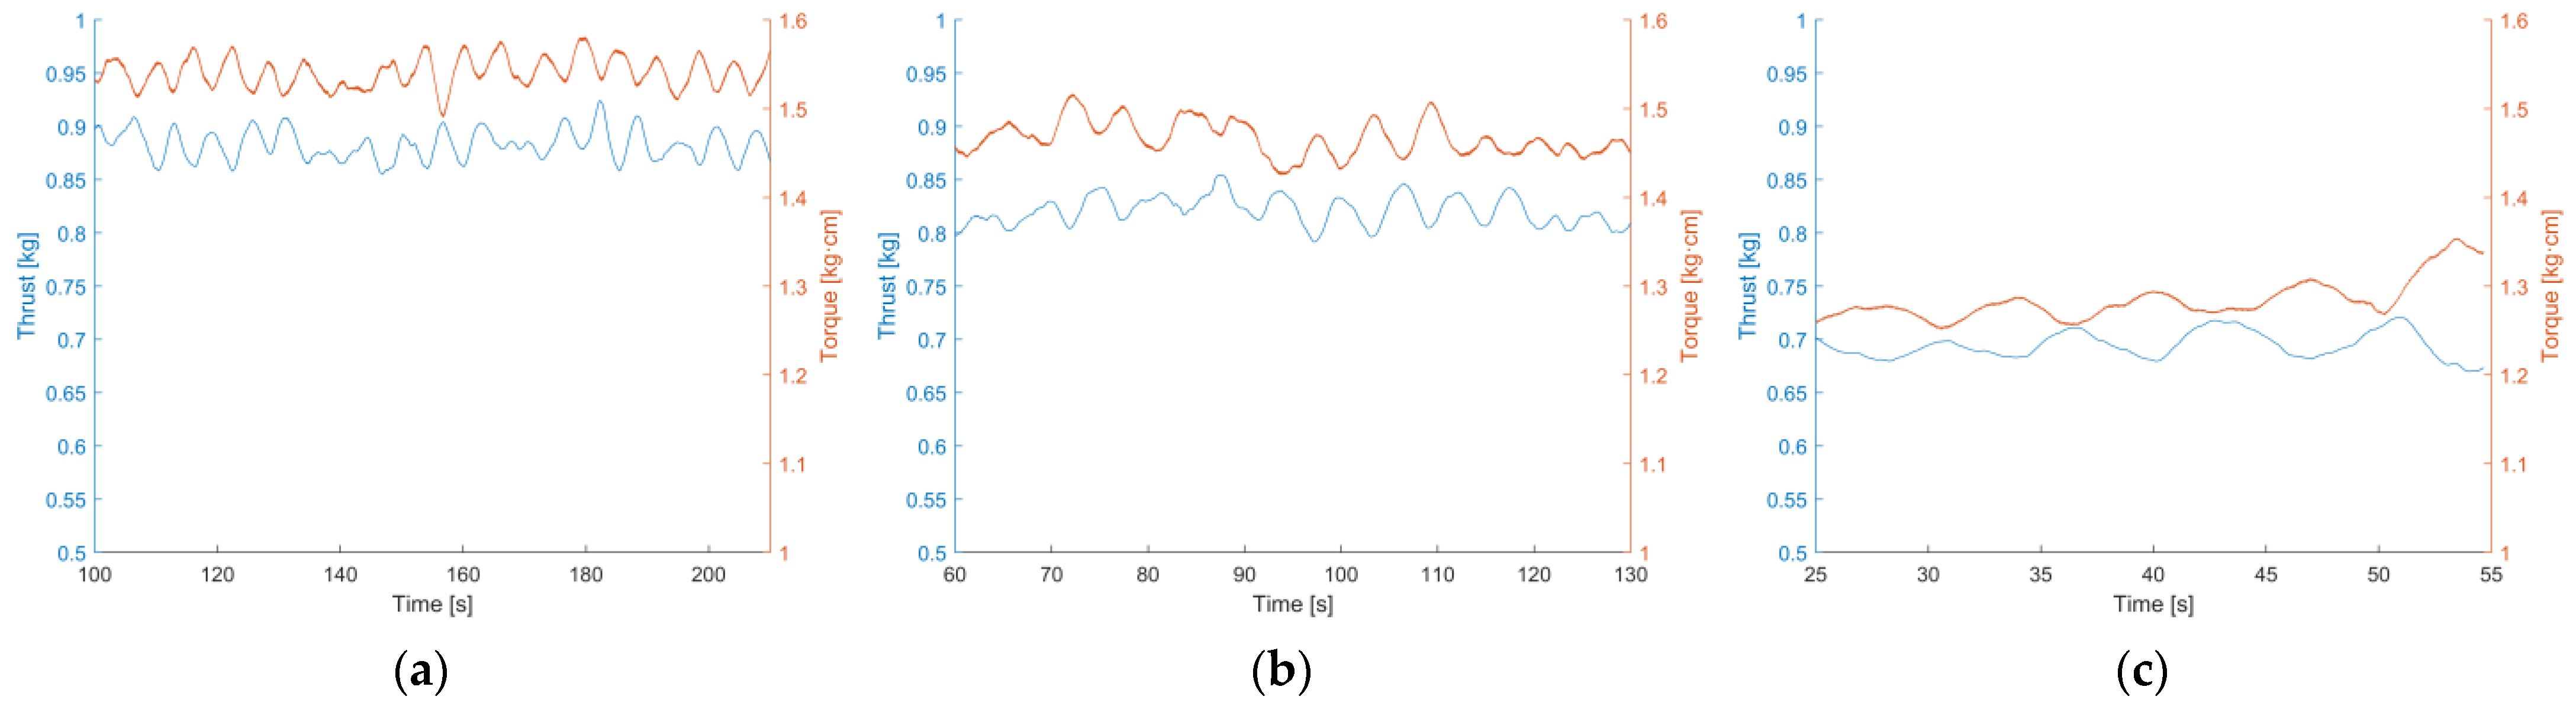
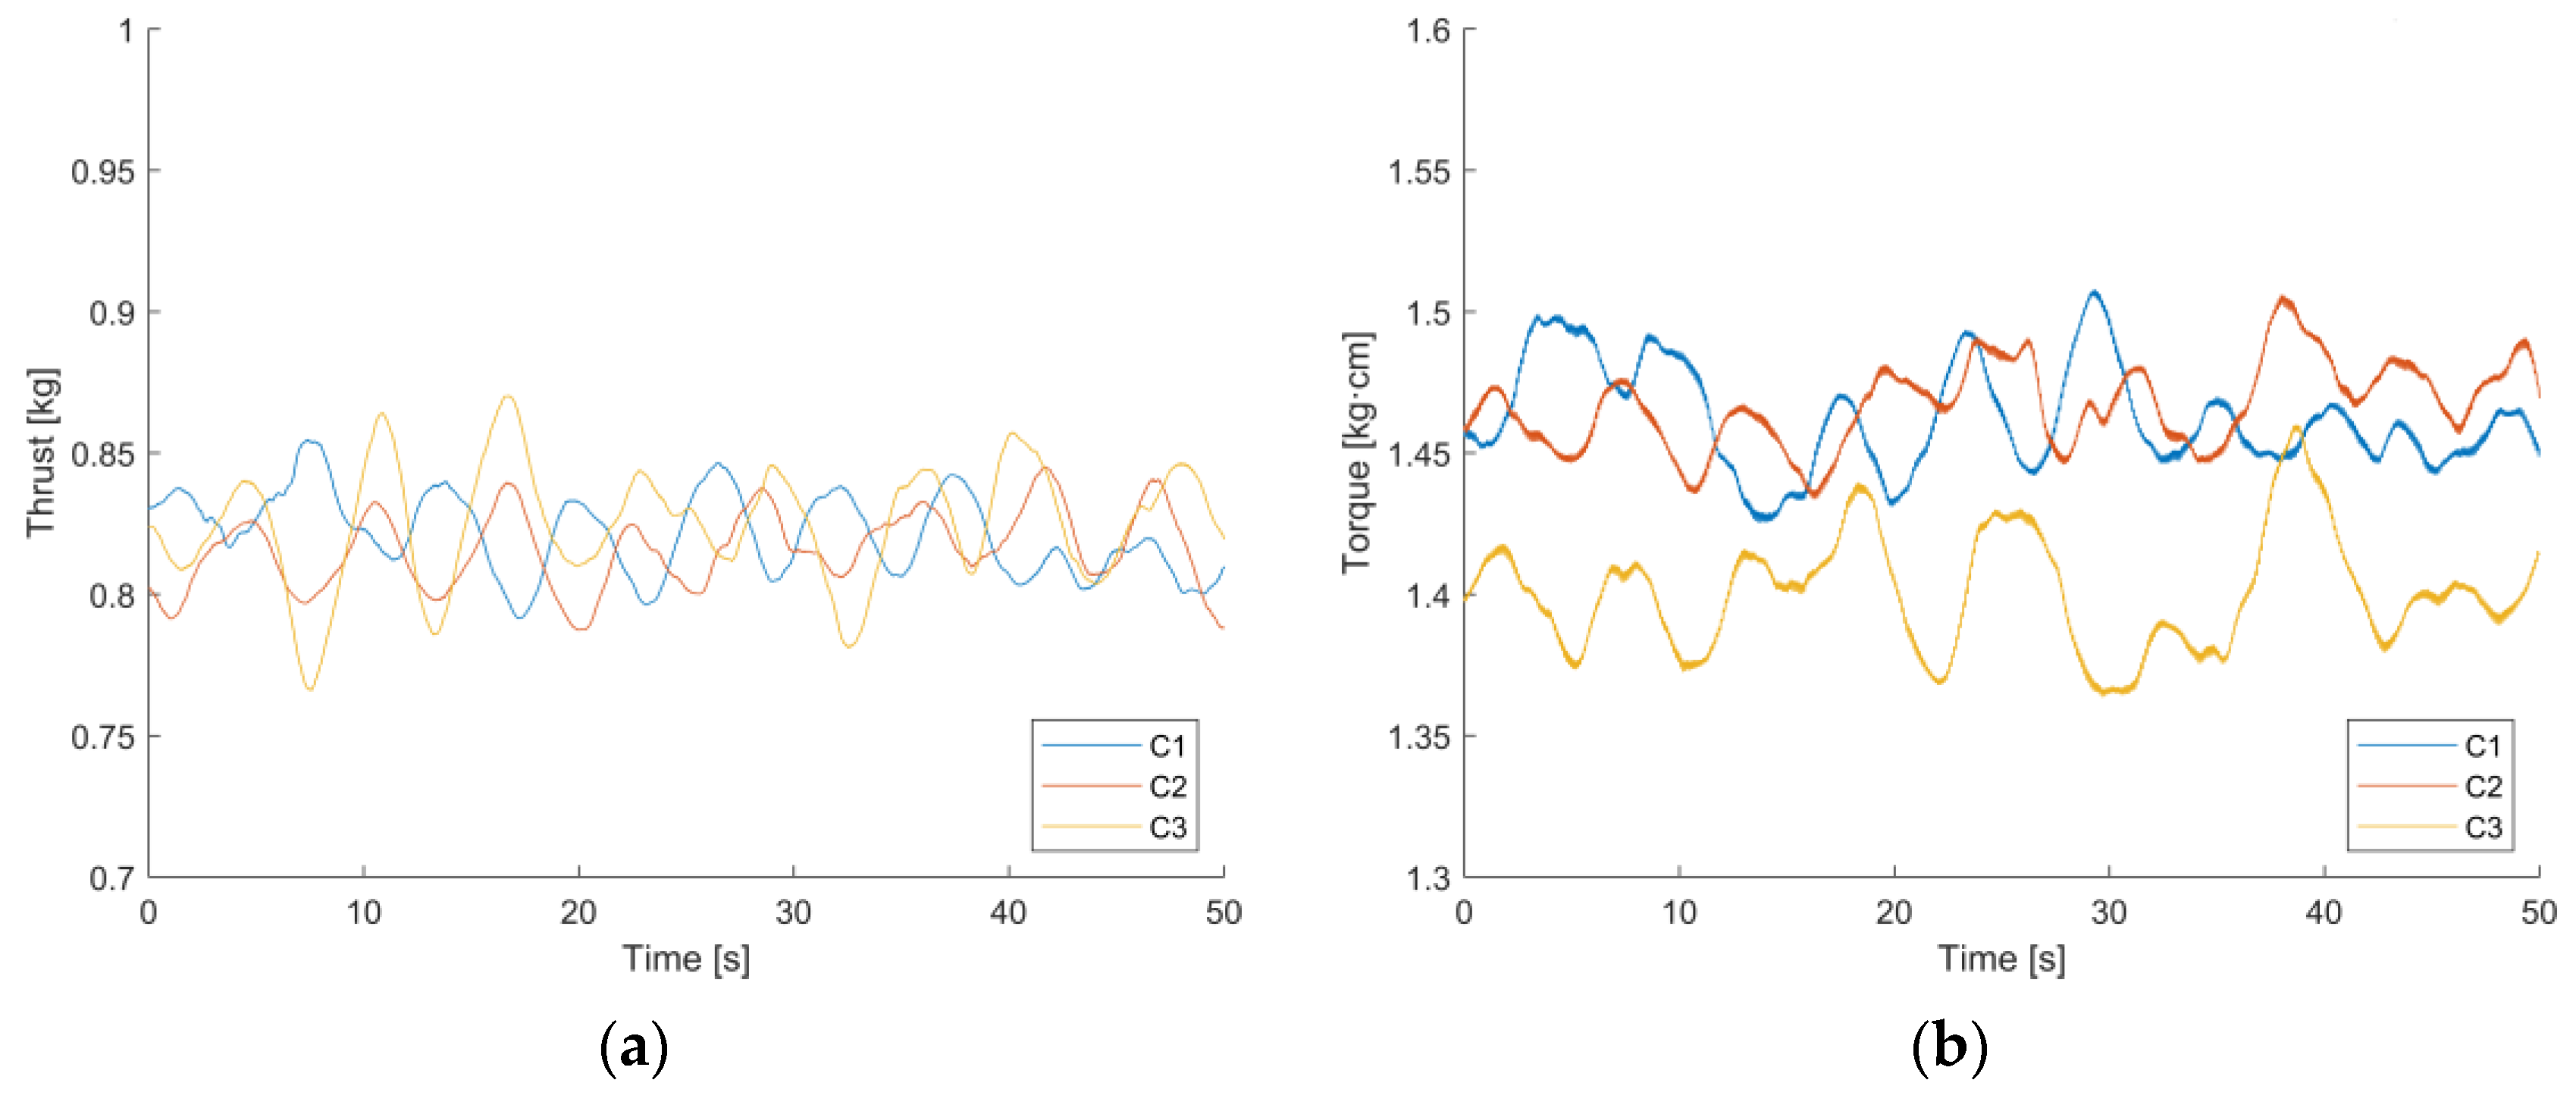
4.1. Thrust (T) Analysis

In Figure 9, a variability in the results of mean thrust ( T ¯ ) can be observed as a function of the number of blocks on the free surface (see Table 6). However, when speed increases, the values of thrust correlate linearly with high reliability.
From Figure 9, it can be inferred that a lower coverage induces higher dispersion in the obtained results for thrust. The variance σ per coverage is 4.48 N for lower coverage, 0.75 N for 45% of coverage, and 0.31 N for 60% of coverage (see Figure 9a).

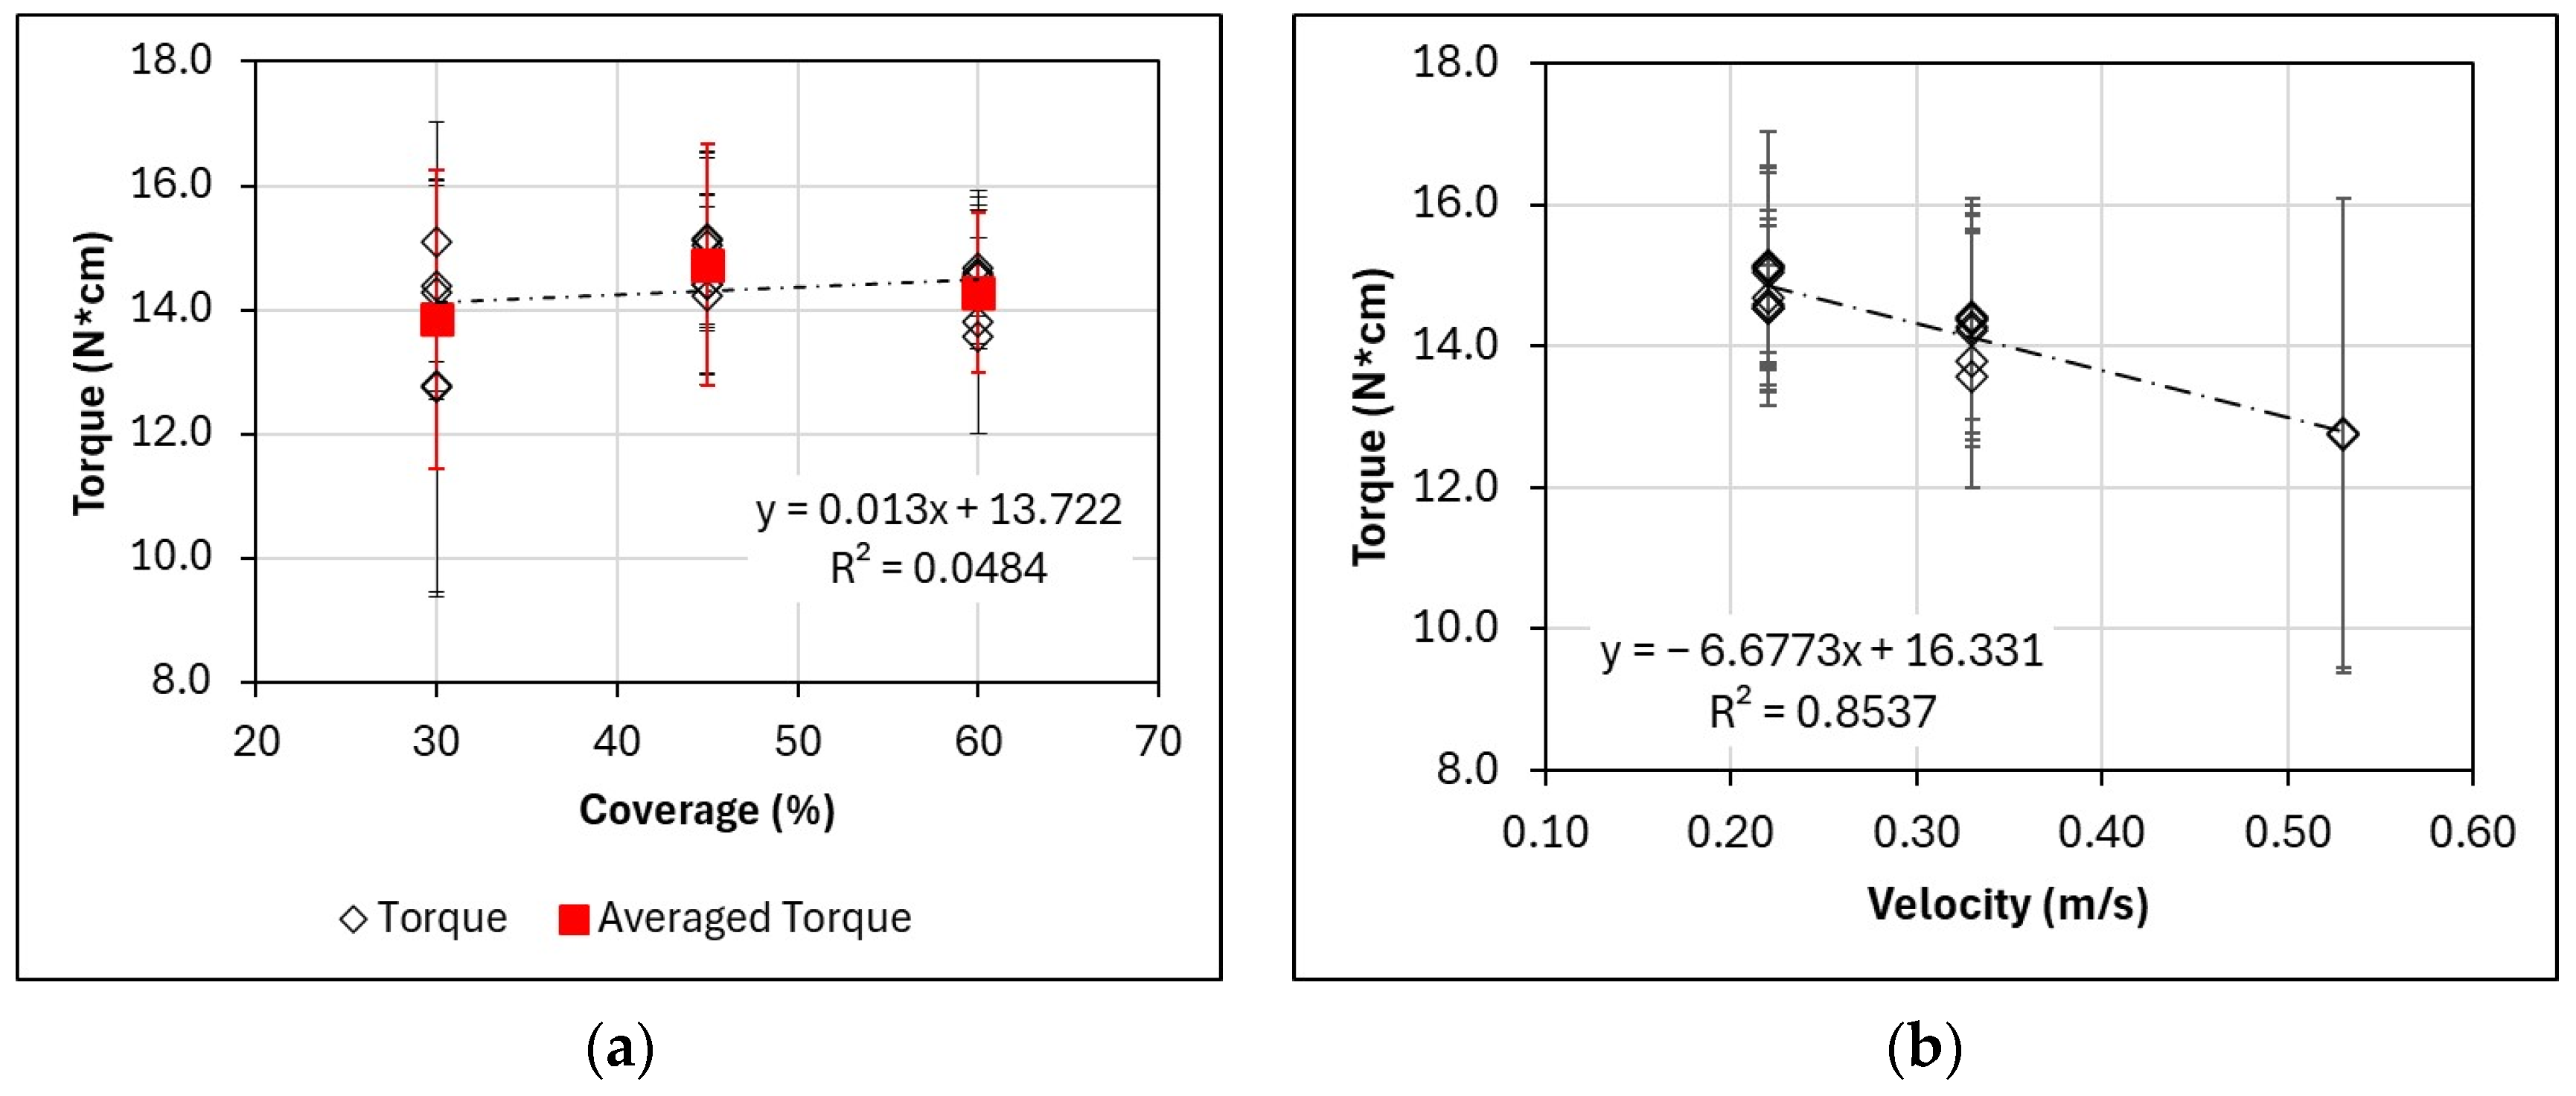
4.2. Torque (Q) Analysis

Similarly, the mean torque values obtained during the tests for different coverages are shown next. Figure 10 shows the mean torque values for each test and the mean value per percentage of coverage.
As was true with the thrust force, lower coverage trends toward higher dispersion of the obtained results. The variance per percentage of coverage is 7.02 N·cm for lower coverage, 2.40 N for 45% of coverage, and 0.47 N for 60% of coverage.
There is a high correlation between the values of mean thrust and mean torque (see Figure 11) for the whole range of speeds and coverages that have been tested.

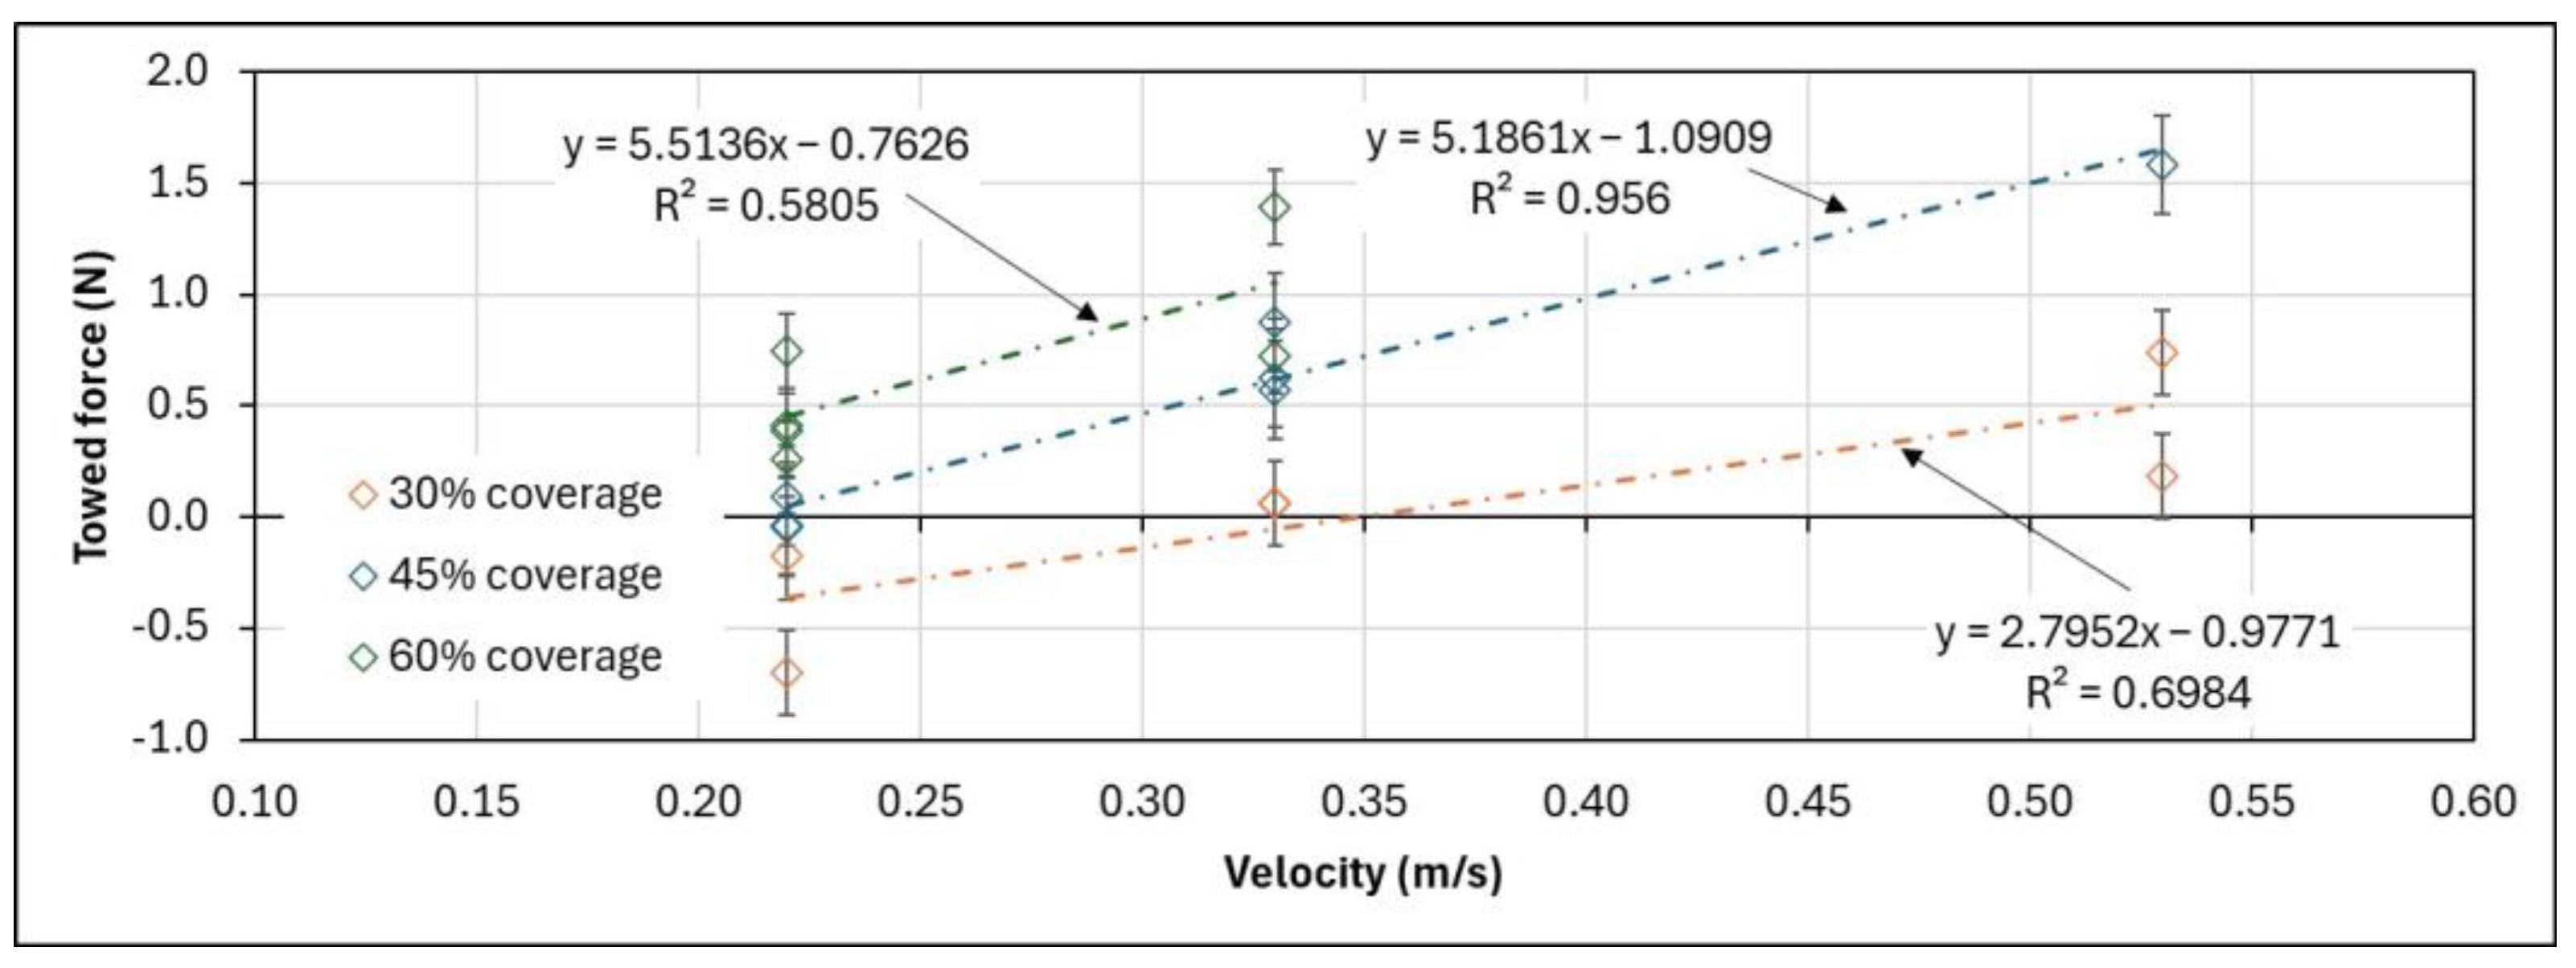
4.3. Towing Force (Fx) Analysis

As pointed out in the previous sections of this paper, towed self-propulsion tests were performed through towing of the scaled model. From these tests, the relationship between towing force, total resistance, and thrust can be related as
F x = R I + R O W T e f f
in which Fx is the towing force, RI is the clearance resistance of the blocks, ROW is the calm water or open water resistance, and Teff is the effective thrust during the tests.
Table 10 shows the mean values of total resistance to motion per free surface coverage and model speed, as well as the resistance uncertainty. In Figure 12, the obtained values of towing force (Fx) versus the coverage percentage and the model speed are shown. It can be observed that low values of coverage provide poor results. It is only at speeds over 0.3 m/s and medium-to-high coverage that the towing force shows values above zero.

4.4. Delivered Power (PD)

Next, the results of the power delivered during the towed self-propulsion tests are shown. These values can be calculated as
P D = 2 π   n   Q t e s t ,
where n is the propeller’s rotational speed (in r.p.s.) and Qtest is the mean torque measured during the test (in N·m) for each conducted test.
From Figure 13, a decrease in PD is observed as the percentage of coverage increases at different speeds. The propeller revolutions by speed and advance number are 2.12, 3.26, and 5.32 r.p.s., respectively.

5. Testing Methodology

In this section, the methodology that was followed to conduct the tests is described. An introduction to it was given by Gutierrez-Romero et al. [6]. They performed experimental tests to estimate the influence of blocks floating on the free surface on the ship’s resistance to motion. For this, they simulated the effect of broken ice (managed ice) in traditional towing tanks [6]. In addition, towed self-propulsion tests were also proposed to analyze the effect of these blocks on ship propulsion. The test methodology and observations are further described below.
Initially, ITTC recommendations [36,45] were followed as a reference to establish the features of the tests, although these were not specifically designed for broken ice but for level ice. Three different free surface coverages were chosen, as mentioned before, as well as three different testing speeds. At least five tests were carried out for each combination of speed and coverage in order to reduce uncertainty in the analysis of block clearance resistance. Various tests were performed on the ship model prior to the performance of the towing tank tests with artificial ice: open water towing tank tests, open water propulsion tests, and towed self-propulsion tests.
It must be noted that in traditional towing tanks, it is a common practice to install a calibrated spring that acts as a physical signal filter for measuring the ship’s resistance to motion (see Figure 14a). However, the tests presented in this paper with blocks floating on the free surface did not allow the aforementioned configuration of the spring, since the higher magnitude orders of the measured values of total ship resistance make it inappropriate.
For the selected model, calm water resistance (without artificial ice blocks) at a Froude number equal to 0.090 is 193 g, while at the same speed, total resistance increases, reaching a value of 668 g for 30% coverage and up to 2236 g for 60% coverage. The high variability in these results required the design of a new procedure that consisted of coupling a rigid joint through a load cell that was properly calibrated and placed (see Figure 14b).
Following ITTC procedures, a sketch, as shown in Figure 15, was used to conduct the tests. The model is fixed to the towing carriage. A load cell is located inside the model and the ship is pulled by a rod [36].
Before each test, artificial ice blocks made of paraffin wax were distributed over the free surface manually to obtain a configuration as random and homogeneous as possible.
With the aim of confining the blocks within the testing zone, physical limits consisting of metallic fences were installed to define this region. From the observations of the tests, it is deduced that, especially at the end of the testing zone, these devices should be flexible or removed to avoid local increments in this part of the confined zone because of the push movement of the ship model.
The selected type of experiment was the towed self-propulsion test since it has been proven to be an effective method for studying the influence of the blocks in ship propulsion [45].
Regarding suction effects and the ship model’s propeller–rudder block interaction, it is advisable to constantly observe the stern of the model. The thrust force exerted by the propeller creates a suction effect that drags the floating blocks towards it, colliding with the appendages (rudders) and the propeller (see Figure 16). This situation is likely to propitiate the breaking of the rudders and the whole propulsion system if no actions are taken in time during the test.
Figure 16 shows the process in which a block collides with one of the rudders of the ship model during a test. To avoid engine overloading due to torque because one of the blocks intercepts the propeller, the propulsion system was stopped any time that a block was in the vicinity of the propeller. This procedure avoided the breaking of the propulsion system through real-time continuous monitoring of the aft of the ship model with underwater cameras. Since the propeller was stopped and the model lost its propulsion speed, the model was held together with the carriage with a gripper to avoid hitting the carriage. When the danger was over, the propeller was set at the proper speed again and the ship model was free to advance, restarting the test.
It is observed from the tests that low coverage of blocks on the free surface produces great uncertainty in the measurements. This occurs because the presence of blocks is random and happens in different parts of the test length. It is not recommended to perform the tests at Froude numbers above 0.1, since the order of magnitude of the total resistance increases significantly.
From the results previously shown, it is noticed that a decrease in thrust and torque occurs as speed increases, and there is a high correlation between thrust and torque. In Figure 12, it is shown that a high towing force is required, which increases as speed and coverage grow.
The complexity of this phenomenon induces high variability in the results, requiring numerous tests to narrow down uncertainties [40]. This, together with time signals of appropriate recording length, allows us to ascertain the values of thrust and torque for each analyzed situation.

6. Conclusions

In this work, the results obtained from the experimental campaign performed in traditional testing facilities with floating blocks simulating managed ice are presented. These tests consisted of a series of towed self-propulsion tests and towing tank tests to measure ship resistance to motion.
It has been shown that these tests can be conducted to obtain results that are similar to those achieved by other authors. The methodology that was followed has been described in detail, and the most relevant observations have been discussed. Next, the main findings and recommendations are highlighted:
It is recommended that the model is pulled by a rod with a load cell placed inside it.
Increased coverage percentage reduces the variability of the results, for which it is advisable to perform tests within the range of medium-to-high coverage (40–65% coverage).
Removable front upper bounds should be installed to avoid an increase in coverage percentage in the final part of the tests, producing floe jams.
The length of the test channel can be reduced to increase the number of tests, significantly reducing the raw material needed to carry out the experimentation, as well as test costs. For instance, up to five ship lengths can be enough to recover valuable data.
High speeds are not recommended, since they significantly increase the order of magnitude of the towing force, leading to problems in the data collection system.
The segmentation hypothesis, combined with a large number of tests, is highly recommended to bound random uncertainties.
Paraffin wax can act as managed ice to model complex environments in ice experimentation, and it is suitable for numerical validation.
Attention to the trajectory of the blocks in the stern is a must when performing such tests, avoiding the collapse of the propulsion system, and the breaking of appendages. The suction effect can be fatal for the performance of the tests.
Thrust and torque show a high correlation between themselves and with model speed. However, their values show high dispersion versus the studied coverage percentages. This is not the case with the block clearance resistance, which presents values similar to those of other authors (see comparisons in the previous works of authors [6]). Delivered power has been analyzed and shows decreasing values as the free surface coverage increases.
In the case presented in this paper, since special ice-making facilities are not required, it is advantageous to systematically perform these tests several times without incurring significant augmentation of related costs.

Author Contributions

Conceptualization, all authors; methodology, J.E.G.-R., B.Z.-P. and S.R.-C.; software, J.E.G.-R., J.E.-P. and S.R.-C.; validation, J.E.G.-R., B.Z.-P. and S.R.-C.; formal analysis, J.E.G.-R. and A.L.-B.; investigation, J.E.G.-R., B.Z.-P., S.R.-C., A.J.L.-L. and P.R.-T.; writing—original draft preparation, J.E.G.-R., S.R.-C., A.J.L.-L. and P.R.-T.; writing—review and editing, B.Z.-P., J.E.G.-R. and J.E.-P.; funding acquisition, J.E.G.-R. All authors have read and agreed to the published version of the manuscript.

Funding

This research was funded by the Minister of Science and Innovation, the State Research Agency, and the European Regional Development Fund under Grants RTI2018-094744-A-C22 (NICESHIP).

Institutional Review Board Statement

Not applicable.

Informed Consent Statement

Not applicable.

Data Availability Statement

Research data can be found in Gutiérrez Romero, J. E., Zamora-Parra, B., Esteve-Perez, J., Ruíz-Capel, S., & Luna-Abad, J. P. (2022). Dataset from the Towing Tank Test of the model of Spanish Army’s Research Vessel Hespérides, conducted at the CEHINAV Towing Tank, in the presence of simulated broken ice [Data set]. Zenodo: https://doi.org/10.5281/zenodo.12793313.

Acknowledgments

The authors acknowledge CEHINAV, whose facilities made this work possible. Thanks to Juan-Luís Chacón, Antonio Souto Iglesias, Luís Perez-Rojas, the CEHINAV research group, and the CIMNE naval research group for providing their knowledge and support to carry out this experimentation. Thanks to Carlos López-Pavón for providing their assistance during the experimentation.

Conflicts of Interest

The authors declare no conflicts of interest.

References

  1. GISTEMP Team. GISS Surface Temperature Analysis (GISTEMP). NASA Goddard Inst. Sp. Stud. Available online: https://data.giss.nasa.gov/gistemp/ (accessed on 28 August 2024).
  2. Comiso, J.C.; Bliss, A.C.; Gersten, R.; Parkinson, C.L.; Markus, T. Current state of sea ice cover. Available online: https://earth.gsfc.nasa.gov/cryo/data/current-state-sea-ice-cover (accessed on 28 August 2024).
  3. Corbett, J.J.; Lack, D.A.; Winebrake, J.J.; Harder, S.; Silberman, J.A.; Gold, M. Arctic shipping emissions inventories and future scenarios. Atmos. Chem. Phys. 2010, 10, 9689–9704. [Google Scholar] [CrossRef]
  4. Valsson, T.; Ulfarsson, G.F. Adaptation and change with global warming: Emerging spatial world structure and transportation impacts. Transp. Res. Rec. 2009, 2139, 117–124. [Google Scholar] [CrossRef]
  5. Cao, Y.; Liang, S.; Sun, L.; Liu, J.; Cheng, X.; Wang, D.; Feng, K. Trans-Arctic shipping routes expanding faster than the model projections. Glob. Environ. Chang. 2022, 73, 102488. [Google Scholar] [CrossRef]
  6. Gutiérrez-Romero, J.E.; Ruiz-Capel, S.; Esteve-Pérez, J.; Zamora-Parra, B.; Luna-Abad, J.P. Methodology Based on Photogrammetry for Testing Ship-Block Resistance in Traditional Towing Tanks: Observations and Benchmark Data. J. Mar. Sci. Eng. 2022, 10, 246. [Google Scholar] [CrossRef]
  7. Zong, Z.; Yang, B.Y.; Sun, Z.; Zhang, G.Y. Experimental study of ship resistance in artificial ice floes. Cold Reg. Sci. Technol. 2020, 176, 103102. [Google Scholar] [CrossRef]
  8. Jeong, S.Y.; Lee, C.J.; Cho, S.R. Ice resistance prediction for standard icebreaker model ship. In Proceedings of the Twentieth International Offshore and Polar Engineering Conference (ISOPE 2010), Beijing, China, 20–25 June 2010. [Google Scholar]
  9. Jeong, S.Y.; Choi, K.; Kim, H.S. Investigation of ship resistance characteristics under pack ice conditions. Ocean Eng. 2021, 219, 108264. [Google Scholar] [CrossRef]
  10. Jeong, S.Y.; Choi, K.; Kang, K.J.; Ha, J.S. Prediction of ship resistance in level ice based on empirical approach. Int. J. Naval Archit. Ocean Eng. 2017, 9, 613–623. [Google Scholar] [CrossRef]
  11. Lindqvist, G. A straightforward method for calculation of ice resistance of ships. In Proceedings of the 10th International Conference on Port and Ocean Engineering under Arctic Conditions (POAC’89), Lulea, Sweden, 12–16 June 1989; pp. 722–735. [Google Scholar]
  12. Riska, K. Performance of Merchant Vessels in Ice in the Baltic; Research Report/Winter Navigation Research Board, 52; Helsinki University of Technology, Ship Laboratory: Helsinki, Finland, 1997. [Google Scholar]
  13. WMO. Sea Ice Nomenclature. Volume 1—Terminology and Codes. In Proceedings of the 5th Session of JCOMM Expert Team on Sea Ice, Ottawa, ON, Canada, 25–28 March 2014; World Meteorological Organization: Geneva, Switzerland, 2014. [Google Scholar]
  14. Tan, X.; Riska, K.; Moan, T. Effect of dynamic bending of level ice on ship’s continuous-mode icebreaking. Cold Reg. Sci. Technol. 2014, 106, 82–95. [Google Scholar] [CrossRef]
  15. Zhou, L.; Riska, K.; von Bock und Polach, R.; Moan, T.; Su, B. Experiments on level ice loading on an icebreaking tanker with different ice drift angles. Cold Reg. Sci. Technol. 2013, 85, 79–93. [Google Scholar] [CrossRef]
  16. Huang, Y.; Sun, J.; Ji, S.; Tian, Y. Experimental study on the resistance of a transport ship navigating in level ice. J. Mar. Sci. Appl. 2016, 15, 105–111. [Google Scholar] [CrossRef]
  17. Dong, W.; Zhou, L.; Ding, S.; Ma, Q.; Li, F. Fast and Intelligent Ice Channel Recognition Based on Row Selection. J. Mar. Sci. Eng. 2023, 11, 1652. [Google Scholar] [CrossRef]
  18. Zhang, J.; Zhang, Y.; Shang, Y.; Jin, Q.; Zhang, L. CFD-DEM based full-scale ship-ice interaction research under FSICR ice condition in restricted brash ice channel. Cold Reg. Sci. Technol. 2022, 194, 103454. [Google Scholar] [CrossRef]
  19. Sun, H.; Ni, X.; Zhang, Y.; Chen, K.; Ni, B. A Numerical Prediction of the Resistance of Bulk Carriers in Brash Ice Channels. J. Mar. Sci. Eng. 2023, 11, 1425. [Google Scholar] [CrossRef]
  20. Tian, Y.; Yang, D.; Gang, X.; Yu, C.; Ji, S.; Yue, Q. Development of a Numerical Ice Tank Based on DEM and Physical Model Testing: Methods, Validations and Applications. J. Mar. Sci. Eng. 2023, 11, 1455. [Google Scholar] [CrossRef]
  21. Wang, J. Prediction of Propeller Performance on a Model Podded Propulsor in Ice (Propeller-Ice Interaction). Ph.D. Thesis, Memorial University of Newfoundland, St. John’s, NL, Canada, 2007. [Google Scholar]
  22. Bach, C.; Myland, D. An experimental method for model propeller-ice interaction in air. Concept and first results. In Proceedings of the ASME 2017 36th International Conference on Ocean, Offshore and Arctic Engineering, OMAE 2017, Trondheim, Norway, 25–30 June 2017. [Google Scholar]
  23. Sampson, R.; Atlar, M.; Sasaki, N. Propeller ice interaction–effect of blockage proximity. In Proceedings of the First International Symposium on Marine Propulsors Smp’09, Trondheim, Norway, 22–24 June 2009. [Google Scholar]
  24. Xie, C.; Zhou, L.; Ding, S.; Lu, M.; Zhou, X. Research on self-propulsion simulation of a polar ship in a brash ice channel based on body force model. Int. J. Nav. Arch. Ocean Eng. 2023, 15, 100557. [Google Scholar] [CrossRef]
  25. Yang, D.; Liu, L.; Ji, S. Numerical analysis of interaction between sea ice and propeller based on coupled DEM-FEM model. Ocean Eng. 2023, 268, 113469. [Google Scholar] [CrossRef]
  26. Khan, A.G.; Hisette, Q.; Streckwall, H.; Liu, P. Numerical investigation of propeller-ice interaction. Ocean Eng. 2020, 216, 107716. [Google Scholar] [CrossRef]
  27. Huisman, T.J.; Bos, R.W.; Brouwer, J.; Hagesteijn, G.; de Koning-Gans, H.J. Interaction between warm model ice and a propeller. In Proceedings of the 33rd International Conference on Ocean, Offshore and Arctic Engineering, OMAE 2014, San Francisco, CA, USA, 13 June 2014. [Google Scholar] [CrossRef]
  28. Xiong, W.P.; Wang, C.; Wu, S.; Ye, L.Y.; Xu, P. Study of different load components during the propeller-ice interaction process. Ocean Eng. 2022, 247, 110787. [Google Scholar] [CrossRef]
  29. Tian, Y.F.; Huang, Y. Non-Frozen Model Ice Preparation Method with Columnar Texture Features. China Patent No. 110779250B, 10 October 2019. [Google Scholar]
  30. Van der Werff, S.; Brouwer, J.; Hagesteijn, G. Ship resistance validation using artificial ice. In Proceedings of the ASME 34th International Conference on Ocean, Offshore and Arctic Engineering, OMAE 2015, St. John’s, NL, Canada, 31 May–5 June 2015. [Google Scholar]
  31. Kim, M.-C.; Lee, S.-K.; Lee, W.-J.; Wang, J.-Y. Numerical and experimental investigation of the resistance performance of an icebreaking cargo vessel in pack ice conditions. Int. J. Nav. Archit. Ocean Eng. 2013, 5, 116–131. [Google Scholar] [CrossRef]
  32. Kim, M.-C.; Lee, W.-J.; Shin, Y.-J. Comparative study on the resistance performance of an icebreaking cargo vessel according to the variation of waterline angles in pack ice conditions. Int. J. Nav. Archit. Ocean Eng. 2014, 6, 876–893. [Google Scholar] [CrossRef]
  33. Xie, C.; Zhou, L.; Ding, S.; Liu, R.; Zheng, S. Experimental and numerical investigation on self-propulsion performance of polar merchant ship in brash ice channel. Ocean Eng. 2023, 269, 113424. [Google Scholar] [CrossRef]
  34. Wang, J.; Jones, S.J. Resistance and propulsion of CCGS Terry Fox in ice from model tests on full-scale correlation. In Proceedings of the 8th International Conference and Exhibition on Performance of Ships and Structures in Ice (ICETECH 2008), Banff, AB, Canada, 2–23 July 2008. [Google Scholar]
  35. Hellmann, J.H.; Rupp, K.H.; Kuehnlein, W.L. Model tests in brash ice channels. In Proceedings of the 24th International Conference on Offshore Mechanics and Arctic Engineering, OMAE 2005, Halkidiki, Greece, 12–17 June 2005. [Google Scholar] [CrossRef]
  36. ITTC Recommended Procedures and Guidelines. Testing and Extrapolation Methods Ice Testing Resistance Test in Level Ice. In Proceedings of the International Towing Tank Conference, Venice, Italy, 8–14 September 2002.
  37. CSIC. Unidad de Tecnología Marina. Consejo Superior de Investigación Científica. 2020. Available online: www.utm.csic.es (accessed on 15 July 2024).
  38. IACS. UR I1: Polar Class Descriptions and Application. Requirements Concerning Polar Class. International Association of Classification Societies. 2016. Available online: https://iacs.org.uk/resolutions/unified-requirements/ur-i (accessed on 30 August 2024).
  39. IACS. UR I2: Structural Requirements for Polar Class Ships. Requirements Concerning Polar Class. International Association of Classification Societies. 2019. Available online: https://iacs.org.uk/resolutions/unified-requirements/ur-i (accessed on 30 August 2024).
  40. ITTC Recommended Procedures and Guidelines. Experimental Uncertainty Analysis for Ship Resistance in Ice Tank Testing. In Proceedings of the International Towing Tank Conference, Edinburgh, UK, 4–10 September 2005.
  41. Timco, G.W. EG/AD/S: A new type of model ice for re-frigerated towing tanks. Cold Reg. Sci. Technol. 1986, 12, 175–195. [Google Scholar] [CrossRef]
  42. Zhang, Q.; Skjetne, R.; Metrikin, I.; Løset, S. Image Processing for Ice Floe Analyses in Broken-ice Model Testing. Cold Reg. Sci. Technol. 2015, 111, 27–38. [Google Scholar] [CrossRef]
  43. TRAFI. Ice Class Regulations and the Application Thereof. Finnish Transport Safety Agency, 2016. Available online: https://www.traficom.fi/en/transport/maritime/ice-classes-ships (accessed on 30 August 2024).
  44. Mas-Soler, J.; Uzunoglu, E.; Bulian, B.; Guedes Soares, C.; Souto-Iglesias, A. An experimental study on transporting a free-float capable tension leg platform for a 10 MW wind turbine in waves. Renew. Energy 2021, 179, 2158–2173. [Google Scholar] [CrossRef]
  45. ITTC Recommended Procedures and Guidelines. Propulsion test in ice. In Proceedings of the International Towing Tank Conference, Wuxi, China, 17–22 September 2017.
Figure 1. Scheme of the configuration in the testing zones.
Jmse 12 01691 g001
Figure 2. (a) Zoomed-in detail of the propeller and double-rudder configuration; (b) Image of the scaled model used during the experimentation.
Jmse 12 01691 g002
Figure 3. Plan of hull lines for the side and top view of the Spanish Army’s Research Vessel Hespérides, for which the calculations are conducted in this work.
Jmse 12 01691 g003
Figure 4. (a) Propeller used during the experimental tests with paraffin wax blocks; (b) Propeller installed at the vessel stern.
Jmse 12 01691 g004
Figure 5. (a) Top view of the 30% coverage; (b) Top view of the 45% coverage; (c) Top view of the 60% coverage.
Jmse 12 01691 g005
Figure 6. Obtained values of thrust and torque coefficients (KT, KQ), and propeller open water efficiency (η0), as a function of the advance coefficient (J).
Jmse 12 01691 g006
Figure 7. Comparison between thrust and torque at different speeds and the same coverage (C1 = 30%): (a) Test speed of 0.22 m/s; (b) Test speed of 0.33 m/s; (c) Test speed of 0.53 m/s.
Jmse 12 01691 g007
Figure 8. (a) Comparison of thrust at 0.53 m/s for the three studied free surface coverages (C1 = 30%; C2 = 45%; C3 = 60%); (b) Comparison of torque at 0.53 m/s for the three studied free surface coverages (C1 = 30%; C2 = 45%; C3 = 60%).
Jmse 12 01691 g008
Figure 9. (a) Thrust versus percentage of block coverage. Thrust mean values are represented by the red squares, while the black hollow diamonds represent individual tests; (b) Mean thrust versus model speed.
Jmse 12 01691 g009
Figure 10. (a) Mean torque over coverage percentage. Mean torque values are represented by the red squares, while individual tests are represented by the black hollow diamond markers. (b) Mean torque versus model speed.
Jmse 12 01691 g010
Figure 11. Mean thrust in Newtons (N) versus mean torque (N·cm).
Jmse 12 01691 g011
Figure 12. Towing force values Fx as a function of model speed and the percentage of coverage.
Jmse 12 01691 g012
Figure 13. Delivered power PD values as a function of the coverage percentage and model speed.
Jmse 12 01691 g013
Figure 14. (a) Usual configuration for a towing tank test to measure ship resistance to motion in calm water. (b) Redesigned configuration to perform towing tank tests with artificial ice blocks on the free surface.
Jmse 12 01691 g014
Figure 15. Resistance set-up used during experimental tests. Adapted from [36].
Jmse 12 01691 g015
Figure 16. Sequence of a block colliding with one of the rudders during a test. (a) Block near the port side of the model. (b) Block under the model’s hull on the port side. (c) Block colliding with port rudder of the model.
Jmse 12 01691 g016
Table 1. Main features of the full-scale vessel on which the testing model is based.
ParameterValueUnit
Length overall, LOA82.588m
Length between perpendiculars, Lpp 76.791m
Breadth14.591m
Draught4.421m
Displacement2725.86tons
Vertical position of the gravity center of the ship3.28m
Pitch radius of gyration, Ryy0.21 Lppm
Table 2. Main features of the installed propeller (R is the radius).
ParameterValueUnit
Scale factor23.71
Diameter, D0.14m
Number of blades4
Pitch at 0.75 R0.11m
Cord length at 0.75 R0.0365m
Maximum thickness1.6mm
Blade ratio area0.437
Table 3. Number of paraffin wax blocks by percentage of studied coverage.
Coverage (%)Number of Blocks
30207
45291
60876
Table 4. Values for the parameters of the propeller obtained from the self-propulsion tests, for different values of speed.
Speed VA (Knots)
at Full-Scale
Advance
Coefficient (J)
Wake Fraction
Coefficient (w)
Thrust
Deduction
Coefficient (t)
Relative Rotative Efficiency (ηR)
5.340.5730.2370.2850.8553
6.940.5810.2260.2410.8680
8.000.5680.2510.2460.9233
9.340.5580.2480.2560.9364
Table 5. Full-scale values of power delivered to the propeller (Pd), effective power (Pe), propulsive efficiency (η0), thrust force (T), torque (Q), and brake horsepower (BHP) for different speed values VA and for the parameters of the propeller obtained from the self-propulsion tests.
VA (Knots)Pd (kW)n (r.p.m.)Pe (kW)η0T (kg)Q (kg·m)BHP (kW)
5.3460.773.130.10.471560808.064
6.94129.595.168.50.5025761325.0136
8.00186.7108.6107.30.5535221673.0197
9.34319.8129.5180.60.5451502403.0337
Table 6. Values for the parameters of the propeller obtained from the self-propulsion tests, for different free surface coverages.
Test NumberModel Speed, VA
(m/s)
Coverage, C
(%)
Mean   Torque ,   Q ¯
(N·cm)
Mean   Thrust ,   T ¯
(N)
10.22308.646615.0913
20.22458.608815.1304
30.22458.609815.1587
40.22458.623415.0548
50.22608.377516.1102
60.22608.683514.5292
70.22608.775914.6831
80.22608.682414.5889
90.33307.715214.3823
100.33307.707014.2823
110.33458.018514.4034
120.33458.113414.2220
130.33458.105814.4216
140.33608.241713.7984
150.33608.015213.5812
160.53306.841012.7680
170.53306.828012.7449
180.53456.932412.5047
Table 7. Values of root mean square (RMS) and uncertainty for self-propulsion tests at 0.22 m/s.
Test NumberRMS Torque, Q
(N·cm)
RMS Thrust, T
(N)
Torque
Uncertainty ,   U Q (N·cm)
Thrust
Uncertainty ,   U T (N)
115.92508.70831.94230.3845
215.93018.66031.40820.2831
315.96318.68221.39610.2770
415.86718.71671.39380.2813
516.16308.56610.62030.4245
615.33878.74371.16770.2432
715.48878.83611.23240.2574
815.38318.74041.21960.2512
Table 8. Values of root mean square (RMS) and uncertainty for self-propulsion tests at 0.33 m/s.
Test NumberRMS Torque, Q
(N·cm)
RMS Thrust, T
(N)
Torque
Uncertainty ,   U Q (N·cm)
Thrust
Uncertainty ,   U T (N)
915.38318.74041.70190.3347
1015.38318.74041.71240.3332
1115.05258.01361.43910.2795
1215.00208.16771.43950.2834
1315.20348.16071.45090.2848
1414.61928.30041.70750.3480
1514.50158.10881.79730.4343
Table 9. Values of root mean square (RMS) and uncertainty for self-propulsion tests at 0.53 m/s.
Test NumberRMS Torque, Q
(N·cm)
RMS Thrust, T
(N)
Torque
Uncertainty ,   U Q (N·cm)
Thrust
Uncertainty ,   U T (N)
1613.60476.89473.32160.6074
1713.60006.88393.35620.6192
1813.33796.98275.13112.6219
Table 10. Mean values of the total resistance in the presence of blocks (RI +ROW) and average random uncertainty per coverage and velocity.
Coverage (%)VA (m/s)RI + ROW (N)Resistance
Uncertainty ,   U R (N)
300.222.750.983
0.334.880.952
0.536.550.791
450.225.390.952
0.339.691.134
0.5314.401.896
600.2210.171.734
0.3318.142.303
0.5321.932.707
Disclaimer/Publisher’s Note: The statements, opinions and data contained in all publications are solely those of the individual author(s) and contributor(s) and not of MDPI and/or the editor(s). MDPI and/or the editor(s) disclaim responsibility for any injury to people or property resulting from any ideas, methods, instructions or products referred to in the content.

