Article

Experimental Study of Omnidirectional Scattering Characteristics of Complex Scale Targets Based on Coded Signals

1
College of Naval Architecture and Ocean Engineering, Naval University of Engineering, Wuhan 430033, China
2
Qingdao Innovation and Development Base, Harbin Engineering University, Qingdao 266000, China
*
Author to whom correspondence should be addressed.
J. Mar. Sci. Eng. 2024, 12(9), 1590; https://doi.org/10.3390/jmse12091590
Submission received: 14 August 2024 / Revised: 4 September 2024 / Accepted: 6 September 2024 / Published: 8 September 2024

Abstract

:
To investigate the omnidirectional geometric scattering characteristics of an underwater vehicle and the target detection performance of phase coded (BPSK) signals, acoustic scattering tests were carried out in an anechoic chamber using the Suboff scale model. To mitigate the overlapping interference of the direct wave on the scattering wave in the limited test space, physical suppression with an “anechoic cloak” and direct wave cancellation were proposed. Target echo and reflection wave tests at different offset angles were carried out, and the accuracy of the BPSK signal in acquiring highlight features and the feasibility of anechoic chamber tests were verified through comparison with theoretical range profiles. A series of echo and omnidirectional scattering characteristics were obtained through the experiment and simulation, which verified the effectiveness of the low-frequency submarine model detection (there were still strong scattering waves at the dimensionless frequency ka = 1.88). Comparison tests of CW, LFM, and BPSK signals were carried out, and the measured data proved that the BPSK signal had the advantages of low sidelobe, high resolution, and noise resistance in target detection. The acoustic scattering test method designed in this study and the omnidirectional scattering characteristics obtained can be used as a reference for semi-physical target acoustic scattering simulations and practical multistatic detection.

1. Introduction

The acoustic scattering characteristics of complex underwater targets are important for target detection and identification [1,2]. Tests on real targets in open waters in the external field are a direct means to obtain their acoustic scattering characteristics and evaluate the signal detection performance. However, large-scale target testing in the external field is susceptible to non-cooperative interference and requires a large test space, which results in high experimental costs and long experimental cycles [3].
The scale model test in an anechoic water tank or reservoir is an effective method to study the acoustic scattering of targets. Complex underwater targets generally have cylindrical shell structures. Many studies and experiments have investigated the acoustic scattering of single/double layered cylindrical shells [4,5,6]. Reference [7] applied the geometric highlights and frequency-domain features of monostatic echoes obtained from water tank experiments to acoustic coding. The Workshop on Target Strength of Benchmark Submarines [8,9] released a Kirchhoff calculation case for the benchmark model. However, the intriguing scattering characteristics were not further discussed or reported. Fan et al. [10] studied the time-domain highlight characteristics as well as the azimuth characteristics of monostatic echoes of the benchmark scale model through a plate element simulation and reservoir experiments. Reference [11] verified the accuracy of the parameterised highlight model in predicting the echo intensity in the frequency domain through on-lake experiments. Although the test band was relatively low, the dimensionless frequency was still much larger than 1 (ka > 50), which belonged to the high-frequency geometric scattering region. Wang et al. [12] investigated the multiple geometric scattering characteristics of the X-rudder echo of an unmanned underwater vehicle (UUV) through a water tank test. Regarding the bistatic and multistatic acoustic scattering, Said et al. [13] conducted experimental studies on the wave components of cylindrical elastic scattering in the bistatic mode. In addition, Said also investigated the bistatic evolution of cylindrical shell scattering through a time–frequency analysis [14]. Fischell [15] estimated the azimuth of cylindrical shells in the bistatic mode using a machine learning method. More in-depth studies should be based on detailed bistatic scattering characteristics. Wang et al. [16] extended the high-frequency Kirchhoff method to solve the bistatic geometric acoustic scattering. Zhao et al. [17] used the time-domain finite difference method to simulate and analyse the directivity of the 2D-Suboff scattering field at different incidence angles. However, a 2D model cannot accurately reflect all the 3D features. Overall, few public reports are available on the omnidirectional scattering characteristics of complex targets and submarine model experiments, and they are not sufficiently systematic.
The above acoustic scattering tests mainly used two conventional sonar waveforms, continue wave (CW) pulse and linear frequency modulation (LFM), as the transmission signals. As conventional waveforms cannot have both time and frequency high-resolution, combined and complex waveforms have been used for waveform design [18]. The ambiguity function of the encoded waveform, the binary phase shift keying (BPSK) waveform, is in the shape of a thumb tack, which is a potential ideal sonar waveform [19]. Direct sequence spread spectrum (DSSS)-BPSK was first used in the communication field, with good time–frequency resolution and high gain [20,21,22,23]. The sea trial by Colin [24] demonstrated that the BPSK waveform could reduce false alarms by low-frequency active sonars. The work of Li [25] showed that BPSK and its combined waveforms had excellent target detection performance. However, the waveform design usually only focuses on the characteristics of the signal itself. Due to the scale expansion of complex targets [26,27], it is necessary to combine waveform performance analysis with acoustic scattering.
In addition, to achieve the complete separation of direct waves, reflected interference, and echoes in the time domain, the water tank test mainly uses high-frequency short pulses [28]. Due to the limited accumulated energy of short pulses over time, the high propagation loss of high-frequency acoustic waves, and the application of anechoic coatings, target detection has gradually evolved to lower frequencies. However, the long duration of low-frequency long pulses can easily lead to the aliasing of echoes and direct waves. A similar problem existed in acquiring target electromagnetic scattering characteristics in a microwave anechoic chamber. Liu et al. [29,30,31] proposed an intermittent sampling strategy to avoid the echo aliasing of long pulse signals, and realised echo reconstruction and false target elimination. Intermittent sampling relies on the precise design of the reception interval and cannot be used in practical detection scenarios where the echo time is unknown. The aliasing problem is essentially related to the signal resolution. A higher time-domain resolution can distinguish the echo from the direct wave. CW signals can only increase the resolution by increasing the frequency or narrowing the pulse width. The resolution of BPSK signals is dependent on the width of the code slice and is not contradictory to the signal duration. Thus, BPSK signals can be used in low- and medium-frequency acoustic scattering experiments.
No reports are currently available on the use of BPSK signals for scattering feature extraction. In this paper, BPSK signals were used for acoustic scattering experiments. The omnidirectional scattering features of the 3D-Suboff model and the detection performance of BPSK signals were investigated by simulation and experiment on the basis of solving the aliasing problem. Generally, the rigid scattering components can provide relatively stable characteristic information for underwater target detection and recognition [32]. However, as the impedance difference between steel and water is much smaller than that between air and steel, the extraction of underwater geometric acoustic scattering features will be interfered by elastic effects. For example, the elastic component and the rigid component may overlap in the time domain and the frequency domain, so it is difficult to directly determine which highlights belong to rigid components, and then estimate the geometric characteristic of the target. Steel targets in air are approximately equivalent to rigid scatterers, and the geometric scattering features of these targets can be obtained in air. When the Helmholtz numbers are equal, the geometric scattering of targets in air and water satisfy acoustic similarity. Compared to the underwater test, the anechoic chamber test is more convenient to operate as many tests can be carried out in a short period of time. Thus, it can be used as an exploratory scheme to study the scattering characteristics of complex targets.

2. Theory and Experimental Method

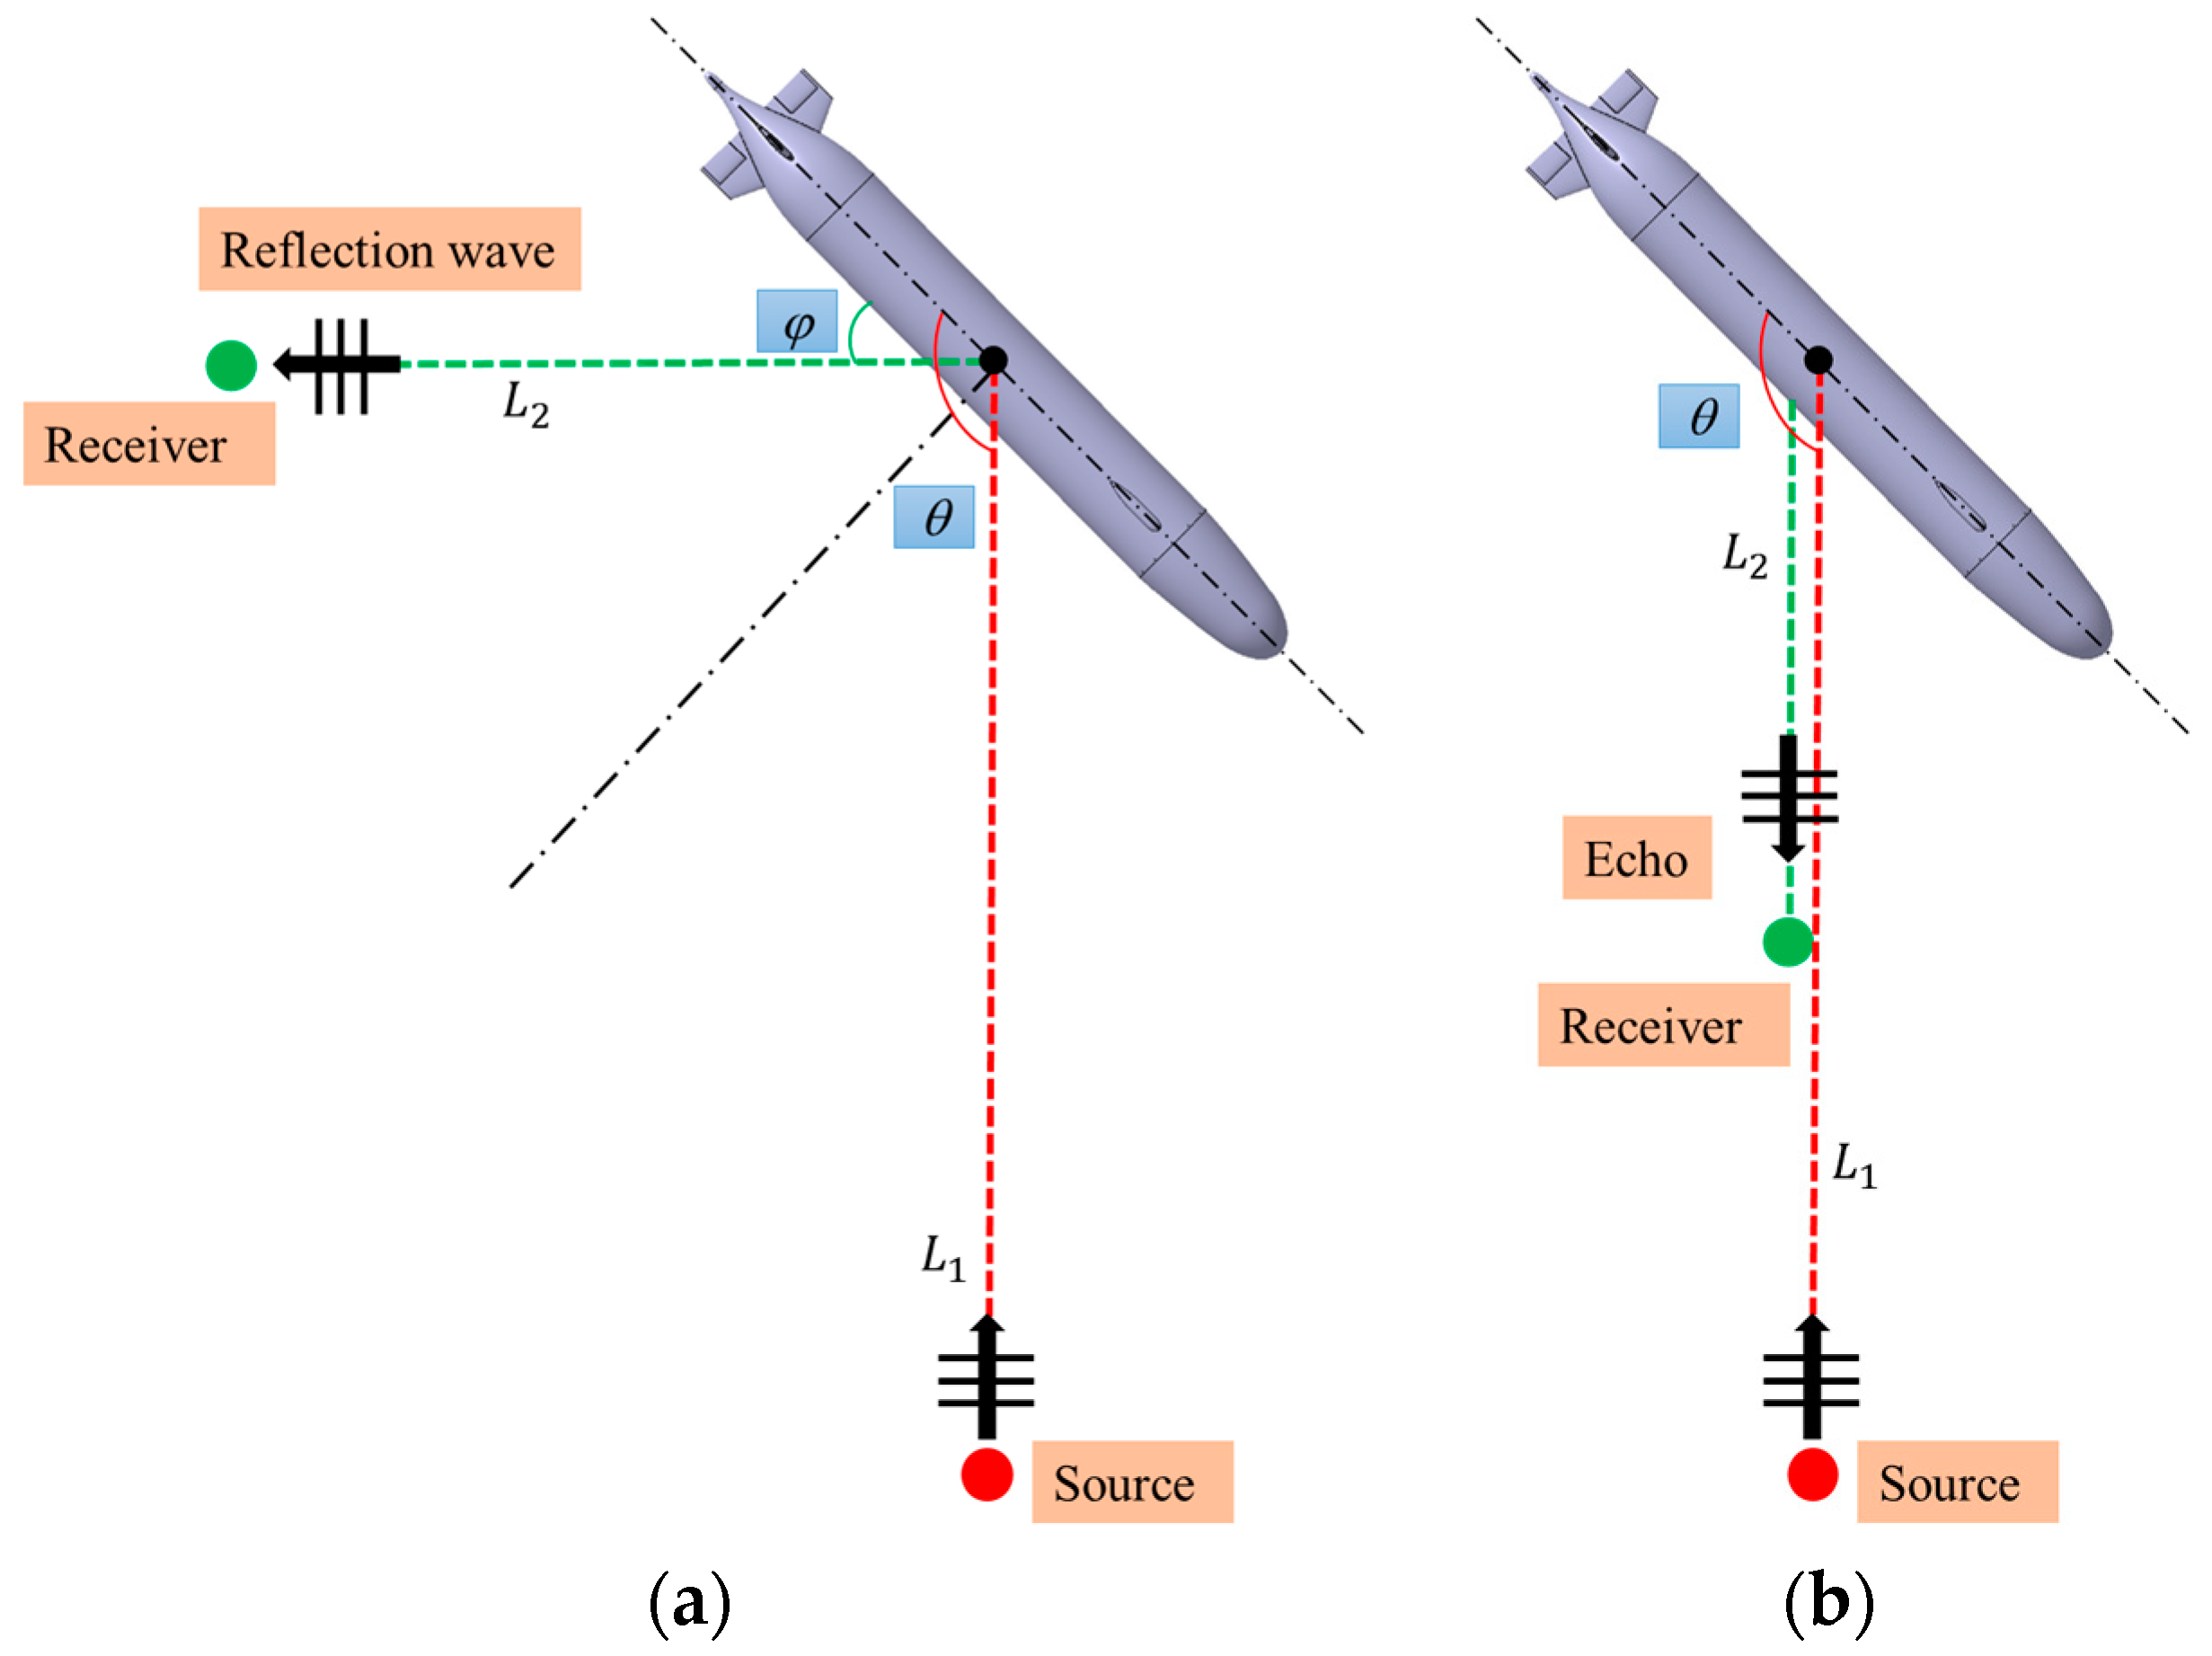
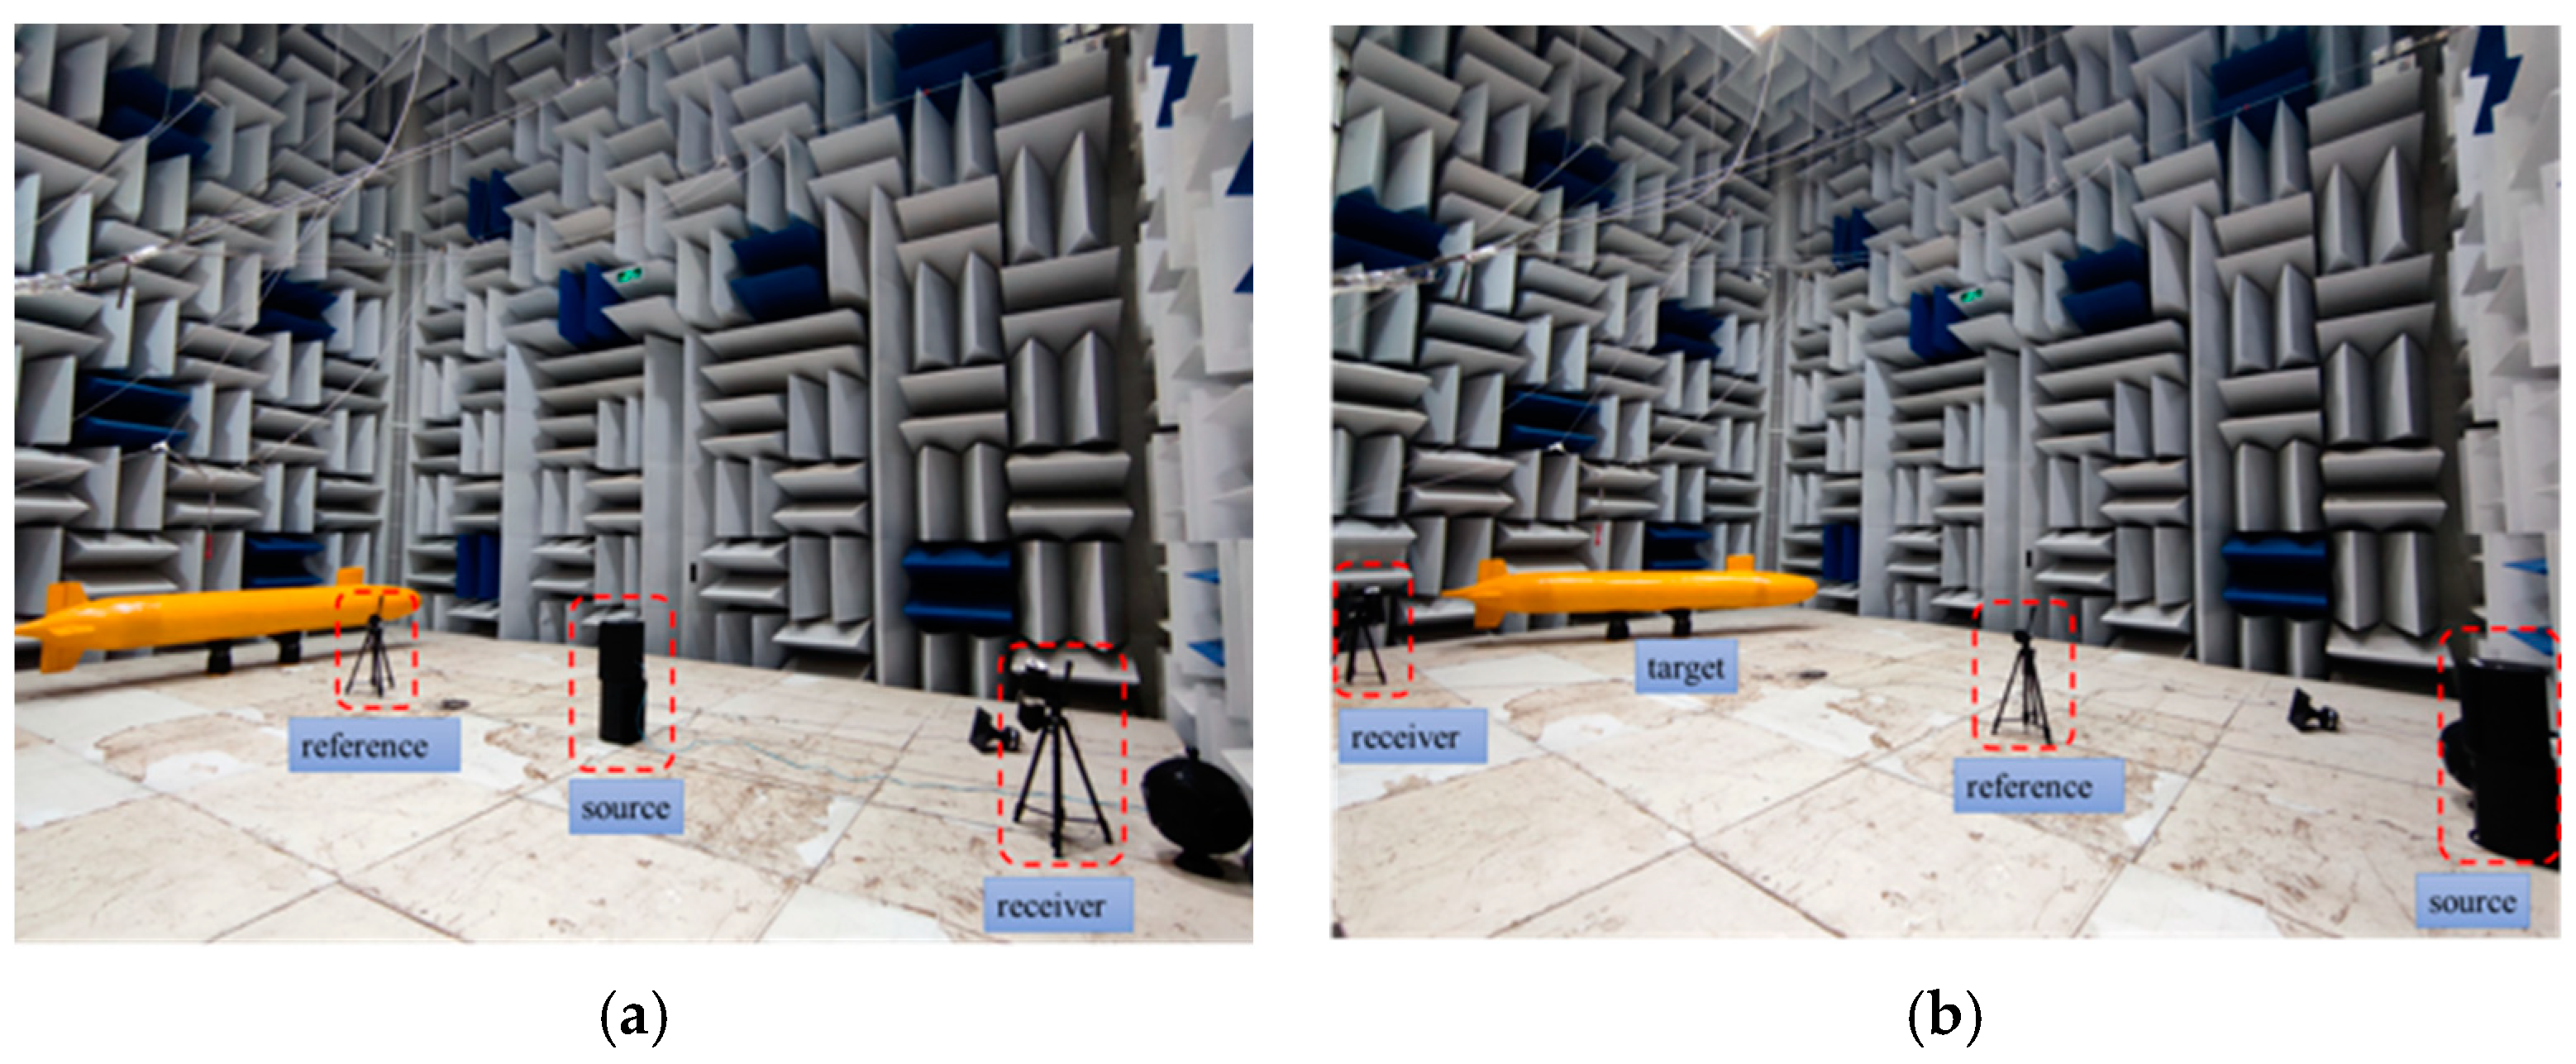
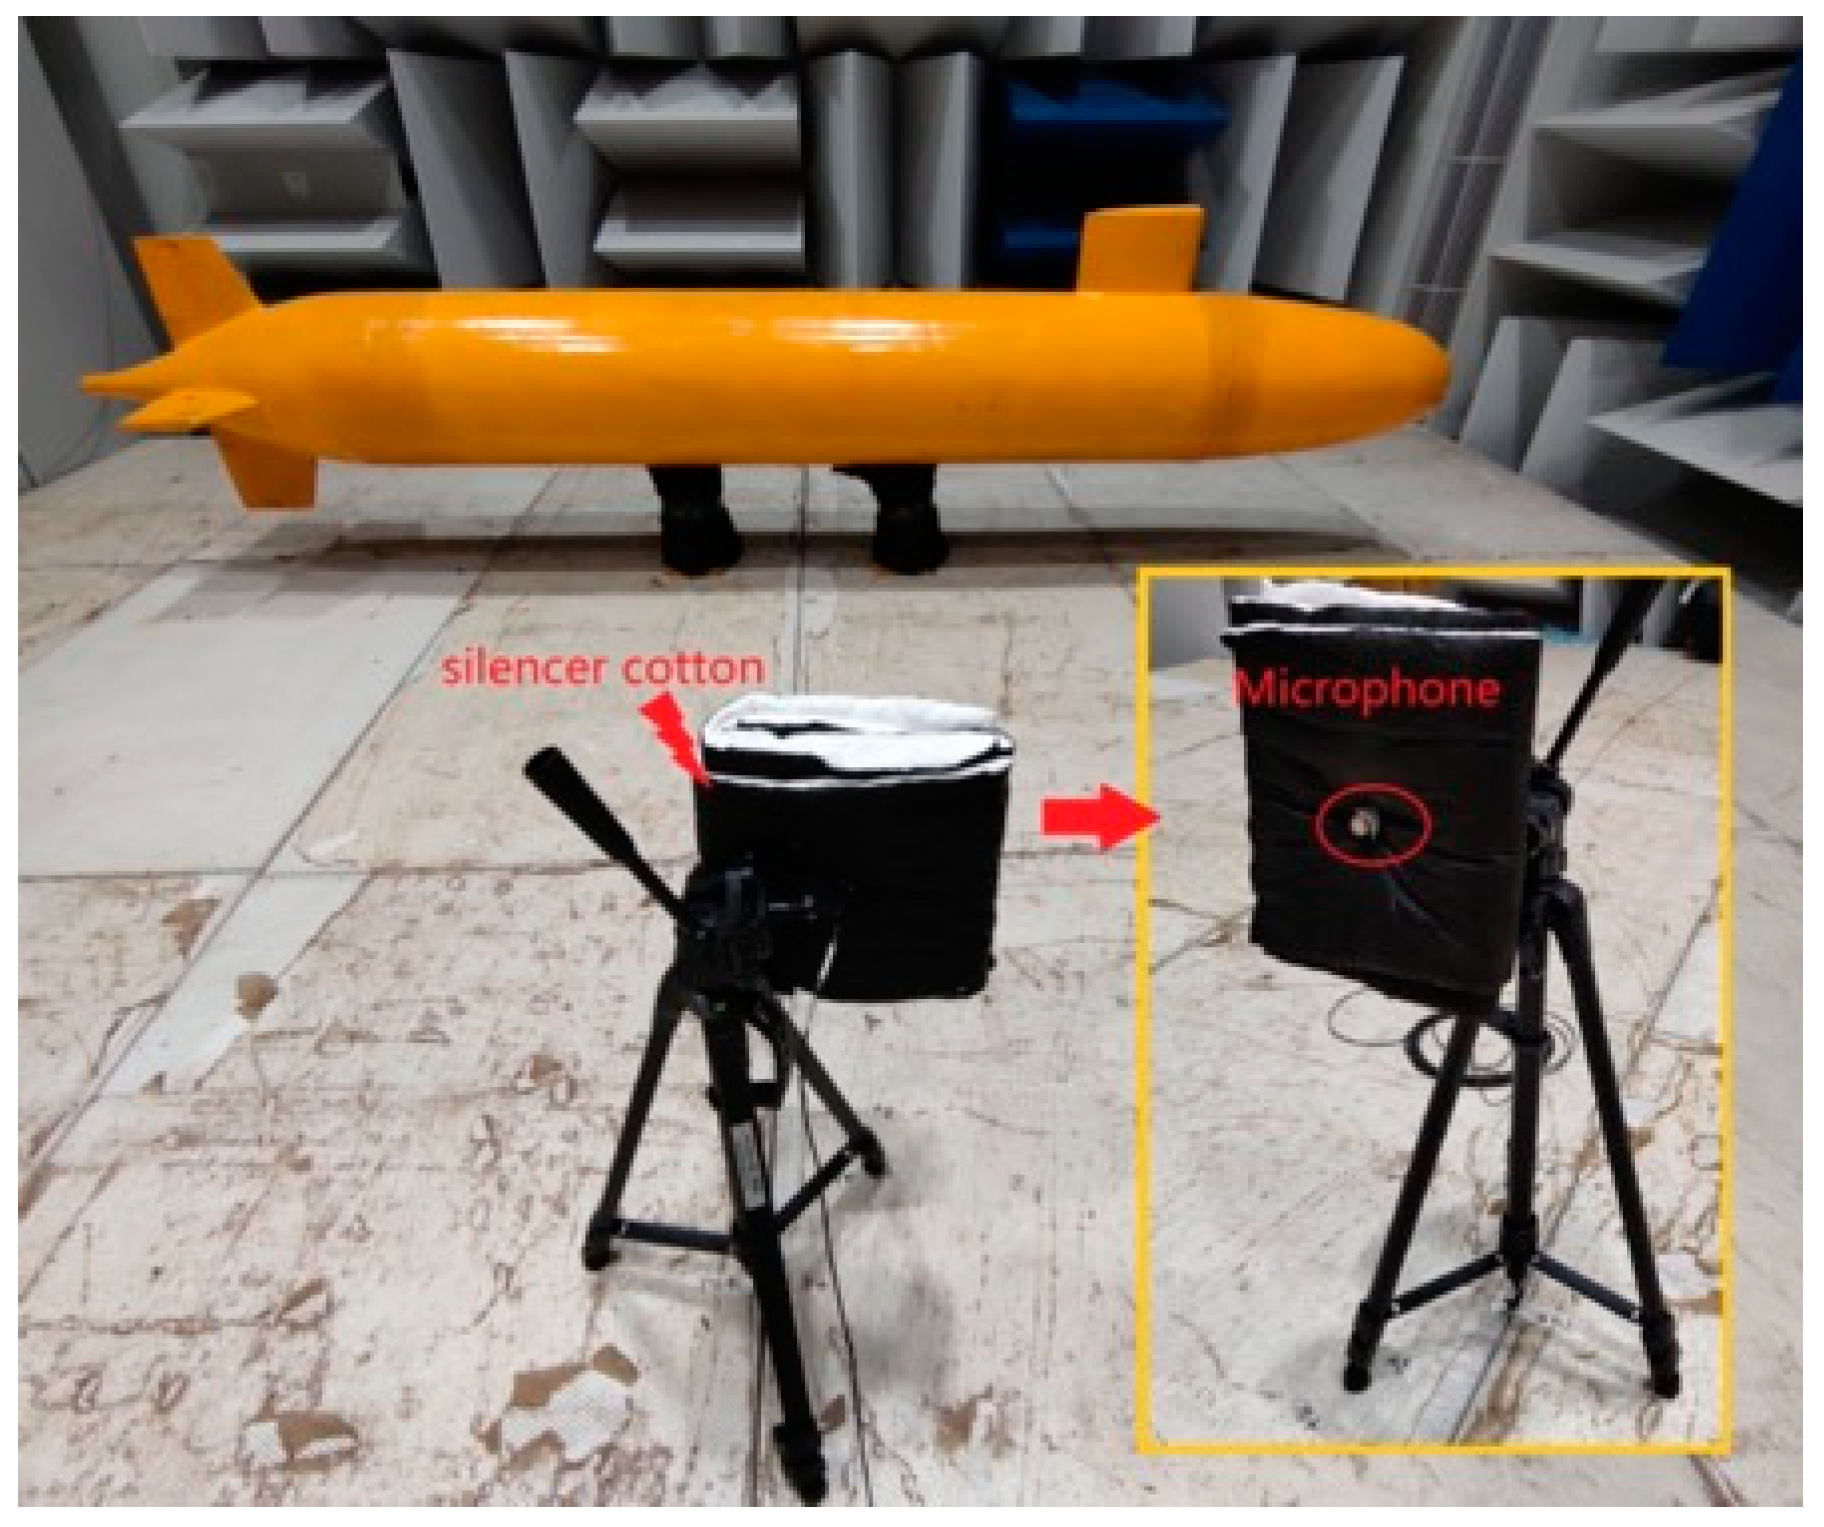
2.1. Experimental Layout and Plan

In the experiment, the sound source and signal receivers were separated. Two measurement modes were used: echo testing and reflection testing, as shown in Figure 1. In reflection testing, the direction of the incident wave is not the same as that of the receiving position, and it is used to simulate the bistatic detection modes. In echo testing, the direction of the incident wave is the same as that of the receiving position, but the receiving end and sound source are not at the same point. In addition, measurements can be categorised into far-end and near-end ones based on the comparison of the source-target distance (L1) and receiver-target distance (L2), that is, L2 > L1 for far-end measurements, and L2 < L1 for near-end measurements. In the echo testing mode, the near-end measurement has the strongest direct path interference, which can be used to verify the effect of direct path interference suppression. A reference microphone placed between the source and the target in the test indirectly measures the incident sound pressure at the target surface, and is used to calculate the scattering strength. According to the Suboff [33] parameters designed by DARPA, the scale submarine model in this study had a total length of 3.4 m, a parallel midbody radius of 0.204 m, and a hull shell thickness of 1.5 mm.
Figure 1a shows the geometric relationship between the incidence angle and the acceptance angle. The incidence angle (azimuth) is θ, the acceptance angle is φ, and the offset angle is θφ. When θ + φ = 180°, the received signal is the mirror reflection wave of the incident wave. When θ = φ, it is the echo wave, corresponding to the echo testing mode in Figure 1b. Figure 2 presents the actual scene in the test. Figure 2a shows the far-end received echo testing. The receiving microphone was the farthest away from the target, the sound source was located between the receiving end and the target, and the reference microphone was located between the target and the sound source, with L2 = 5 m and L1 = 3 m. Figure 2b shows the near-end received reflection testing, with L2 = 1.7 m, L1 = 6.3 m, θ = 135°, and φ = 45°. The reference microphone was 2 m directly in front of the sound source. The BPSK signals (m-sequence phase modulation) were used as the transmission signals. The echoes of the signals with different frequencies were measured by changing the incidence angle. The reflection waves at different offset angles were obtained by changing the acceptance angle. In addition, the performance of the BPSK signals was investigated by adding noise as well as changing the signal type (CW, LFM). The design index for the anechoic chamber indicates that it was well anechoic above 100 Hz. However, because the bottom anechoic plate’s performance may be slightly inferior to the sound absorbing wedges on the wall and at the top, there may be a bottom reflection effect in the low-frequency test, which would be considered in the error analysis of the experimental results.

2.2. Simulation Method and Broadband Scattering Strength

The time-domain simulation can be solved by Fourier synthesis based on the frequency-domain steady state results. Accurate results can be obtained by the boundary element method in the low-frequency band, while the highlight method and the plate element method were used in the high-frequency band. As the Suboff submarine contains complex structural components such as the rudder and the sail, the conventional boundary element method needs to generate complex boundary element meshes. This paper adopted the artificial boundary element method, which constructed a simple shaped artificial boundary outside the submarine, and filled fluid finite element meshes between the artificial boundary and the surface of the Suboff structure. This method can reduce the number and complexity of boundary cells to some extent and obtain the near field (inner domain) scattering sound pressure distribution. The method is similar to the infinite element and perfectly matched layer (PML) techniques. The main difference is that the acoustic conditions on the artificial boundaries are accurately decoupled by the boundary element method, instead of mathematically constructing approximate reflection-free conditions. In addition, there is no restriction on the shape of the artificial boundary. The artificial boundary cells and the internal finite elements were bi-directionally coupled [34]. By solving the dynamic equations of the fluid and structure in the inner domain, the scattering sound pressure on the artificial boundary can be obtained.
[ M s 0 ρ 1 A 1 M f + M f a ] { u ¨ p ¨ 1 } + [ B s 0 0 B f a ] { u ˙ p ˙ 1 } + [ K s A 1 T 0 K f ] { u p 1 } = { F G C 1 p i n c } ,
where Ms, Bs, and Ks are the structural mass matrix, damping matrix, and stiffness matrix, respectively; u is the structural surface displacement; F is the load on the structure, which is currently taken as 0 for the pure scattering problem; Mf and Kf are the fluid mass matrix and stiffness matrix in the inner domain, respectively; M f a is the additional fluid mass at the artificial boundary; B f a is the additional fluid damping at the artificial boundary; G is the transformation matrix of the boundary elements; C is the coefficient matrix of the artificial boundary; A1 is the structural surface coupling coefficient matrix; p1 is the sound pressure in the inner domain; and pinc is the incident sound pressure. Using the integral equation, the scattering sound pressure in the external field can be calculated.
p s ( x ) = Γ p 1 ( y ) G ( x , y ) n d S Γ p 1 ( y ) n G ( x , y ) d S ,
Γ denotes the artificial boundary. With r denoting the distance from the field point to the target, the scattering strength of the frequency-domain steady-state solution can be expressed as
20 log 10 ( p s r p i n c a )
Methods for calculating the target strength of time-domain pulse signals in experiments include the effective value, maximum value, and integral value methods [28]. All of these methods require the separation of pure echo signals, that is, there is no overlap between the echo and direct wave in the time domain, which is difficult to realise for long signals such as BPSK and LFM at low and medium frequencies in a limited space. Although a resolution smaller than the echo delay can avoid interference from the correlation peaks between the echo and direct wave, the time-domain waveforms of the two signals still overlap, making it impossible to calculate the scattering strength using the above method. The correlation value target scattering strength (CTS) was defined to represent the strength of the scattering signal in the test:
CTS = 20 log 10 [ s ( τ 1 ) L 2 I ( τ 2 ) a ]
s ( τ ) = 0 T 1 s 1 ( t ) C ( t + τ ) d t
I ( τ ) = d L 1 0 T 2 s 2 ( t ) C ( t + τ ) d t
where ℜs denotes the result of the correlation calculation between the scattering signal s1(t) and the local spreading code C(t + τ), and τ1 is the captured target phase delay; ℜI denotes the result of the correlation calculation between the incident signal arriving at the surface of the target and the local spreading code, and τ2 is the captured direct wave phase delay at the reference position, s2(t) denotes the signal received by the reference microphone, and d denotes the distance of the reference microphone from the sound source.
When the transmission signal comprises several cycles of BPSK, the fast Fourier transform (FFT) cyclic correlation capture scheme can be used. The correlation is calculated as follows:
s ( τ ) = IDFT [ DFT ( s 1 ) D F T ( C ) ]
where DFT is the discrete Fourier transform and IDFT is the inverse discrete Fourier transform.

2.3. Direct Path Interference Suppression Method

Direct path interference suppression is an issue that must be addressed for target characterisation and true multistatic detection. Mutual coupling between the direct wave and the scattering acoustic wave from the target can result in undetected or “false” target features. Mutual coupling manifests itself in two ways. One is that the resolution is insufficient to distinguish between the two signals, and the signal resolution depends on the signal length, which leads to, for example, the aliasing of direct waves and echoes of CW signals. Another is that the time-domain waveforms of direct waves and echoes may still overlap, while the resolution can distinguish the correlation peaks. However, as the direct wave signal is much stronger than the echo, the sidelobes output by the direct wave correlation will submerge the echo or interfere with the echo, which is the case for signals such as BPSK and LFM. Methods such as direct wave cancellation, beamforming, and spatial suppression have been developed [35,36].
In light of the actual conditions of the anechoic chamber measurements, utilising the “anechoic cloak” combined with direct wave cancellation has been proposed to eliminate the direct path interference. As shown in Figure 3, the microphone is embedded in the “anechoic cloak”, and the front end of the microphone is exposed to the air. The anechoic cloak is a cloak constructed with anechoic cotton that blocks the incident sound from entering the microphone directly. The cloak attenuates the incident wave entering the receiving end but it does not prevent the echo from entering the microphone. Due to its small area, the cloak has almost no effect on the sound field incidence on the target surface. The direct wave cancellation method is based on the received signal when there is no target. The use of BPSK signals can accurately capture such characteristics of direct waves. The direct wave signals when there is no target can be used to directly eliminate the direct wave in the received signal when there is a target. Regardless of the experiment or actual scenario, the clocks of the receiving end and the transmitting end can be synchronised, and it is not difficult to accurately capture the arrival time of the direct wave.
Figure 4 shows the correlation curves of the received signals before and after direct path interference suppression in the near-end echo testing mode (6000 Hz). Figure 4a presents the result of the BPSK received signal correlation calculation without any means of direct path interference suppression. The strength of the direct wave correlation peak is much larger than that of the echo. Although the echo correlation peak is slightly higher than the direct wave sidelobes, the echo features have been interfered by the sidelobes and it is difficult to accurately distinguish weak echo highlights from sidelobes. Figure 4b is the echo correlation curve with the “anechoic cloak”. The results show that the direct wave was significantly suppressed, and its strength was smaller than that of the echo. Compared to that in Figure 4a, the maximum strength of the echo highlight did not decrease. Thus, the cloak had no effect on the incidence field near the target and the echo reception. Figure 4c presents the result of direct wave cancellation. The direct wave was significantly suppressed, and its strength was much smaller than the echo strength. At this point, the echo highlight information could be clearly distinguished and extracted. Through actual testing, it was found that when the frequency was high (above 2000 Hz), so the “anechoic cloak” method can basically meet the requirements of feature acquisition. When the frequency was low (below 2000 Hz), the acoustic wavelength of the transmission signal was no longer much smaller than the size of the cloak, and the suppression effect of the “anechoic cloak” on direct waves deteriorated. At this point, the cancellation method was necessary.

3. Test Results and Discussion

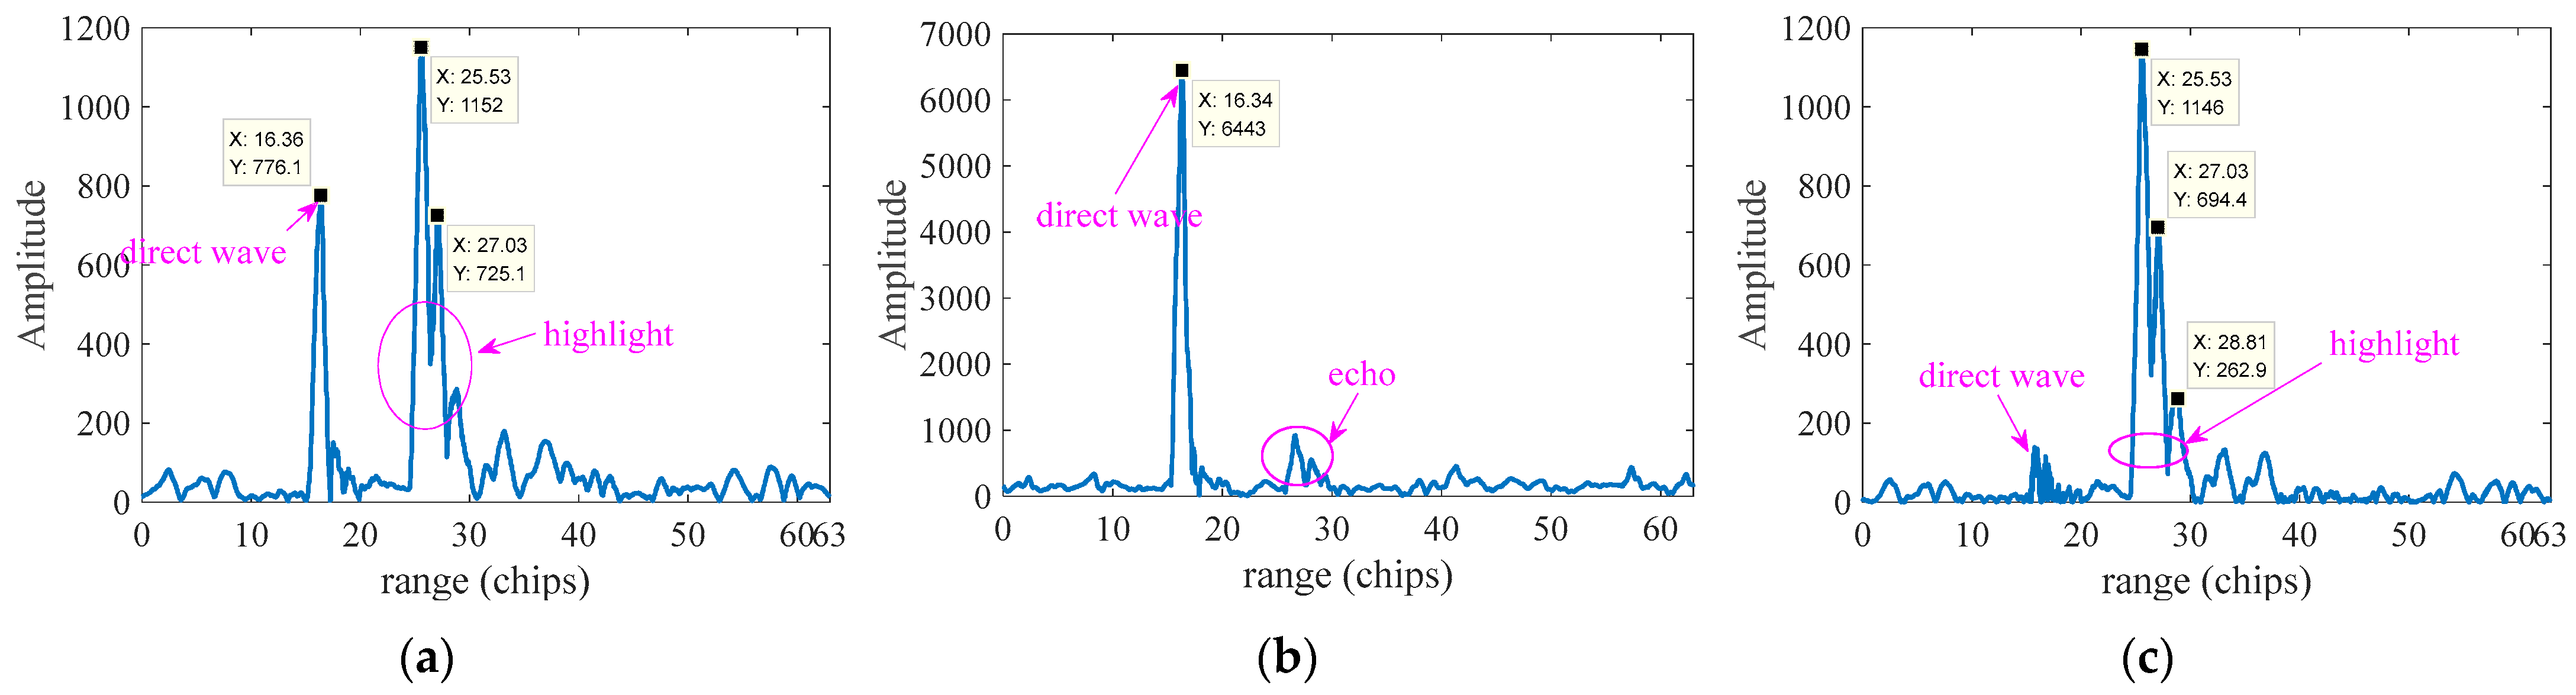
3.1. Verification of BPSK Signal Highlight Feature Acquisition

Figure 5 shows the acoustic path relationship for a plane wave incident on the Suboff surface producing a geometric highlight. d1 is the acoustic path between the incident wave arriving at the highlight and arriving at the receiving position, and d2 is the acoustic path of the scattering acoustic wave from the highlight to the receiving position. d1 + d2 is the difference in the acoustic path between the direct wave arriving at the receiving position and the scattering wave from the highlight. From the perspective of the echo effect, the echo may be formed with a finite number of highlights superimposed on each other. These highlights generally appear in positions where the target shape changes such as the sail and rudder with fixed highlights. In addition, with the change in incidence angle, some highlights may change their positions on the target, forming moving highlights. For example, the positions of the highlights with the smallest and largest (d1 + d2) on the target surface changed with the incidence angle. It should be pointed out that both geometric highlights were equivalent highlights. The presence of highlights did not necessarily mean that only the positions of the highlights contributed to the scattering wave. From the perspective of boundary integral equations, each part of the target contributed to the echo.
Figure 6 shows the echo range profile at different incidence angles (azimuth) when the incident wave was BPSK signals with a centre frequency of 6000 Hz. The results showed that the position of the direct wave was the same at each azimuthal angle. Moreover, multiple highlights were successfully detected. However, the number, strength, and position of the bright spots were different at different azimuthal angles. A further comparison was made between the echo range profile in the experiment and the theoretical acoustic path difference of the highlight at the corresponding angle. In Figure 6a, the three echo correlation peaks in the positive horizontal direction were basically consistent with the smallest acoustic path highlight (min(d1 + d2)), the sail highlight, and the largest acoustic path highlight on the submarine. In Figure 6b, the correlation peaks of the 135° azimuth echo corresponded in sequence to the direct wave, minimum acoustic path highlight, sail highlight, pillar 1 highlight, and pillar 2 highlight. Table 1 indicates that when the azimuths were 90° and 135°, the difference between the acoustic path of echo highlights in the experiment and the theoretical value obtained based on geometric relationships was less than 3%. Therefore, the BPSK signals can discriminate the direct wave from the echo and accurately obtain the range profile of the highlight after correlation processing when the time-domain waveforms of the direct wave and the echo overlapped.
Figure 7 shows the distance–azimuth distribution of the echo highlights at all azimuths. The results showed that four types of highlights, namely, the shortest acoustic path highlight on the hull, the highlight on the sail, the rudder highlight, and the pillar highlight, could be obtained in the experiment. The experimental results of the four types of highlights were in good agreement with the actual geometric acoustic path. Among them, the smallest acoustic path highlight could be measured at most angles. Only within the range of [45°, 60°] did the interference caused by proximity to the rudder highlight make the highlight itself shift or disappear. The sail highlight was missing due to the long acoustic path in the range of [0°, 90°]. Within the range of [90°, 180°], the highlight echo of the rudder was weak due to the long acoustic path and large reflection angle. The farthest acoustic path highlights were only detected at a few angles due to their low strength. The theoretical values of the farthest acoustic path highlights are not displayed in the figure. The unrecognised highlights were the moving highlights on the hull, and some sidelobe interference was included because of the low threshold setting of the echo highlight capture algorithm. Overall, phase-coded signals can be successfully used for target scattering highlight feature extraction in the presence of strong direct wave interference and echo aliasing. The temporal resolution of the highlight can reach cycle/fc (cycle can be taken as small as 2). Compared with the high-frequency short-pulse signals used to obtain target scattering highlight features, BPSK can achieve high resolution and high processing gain at the same time. Therefore, BPSK can be used at a lower test frequency while ensuring the resolution.

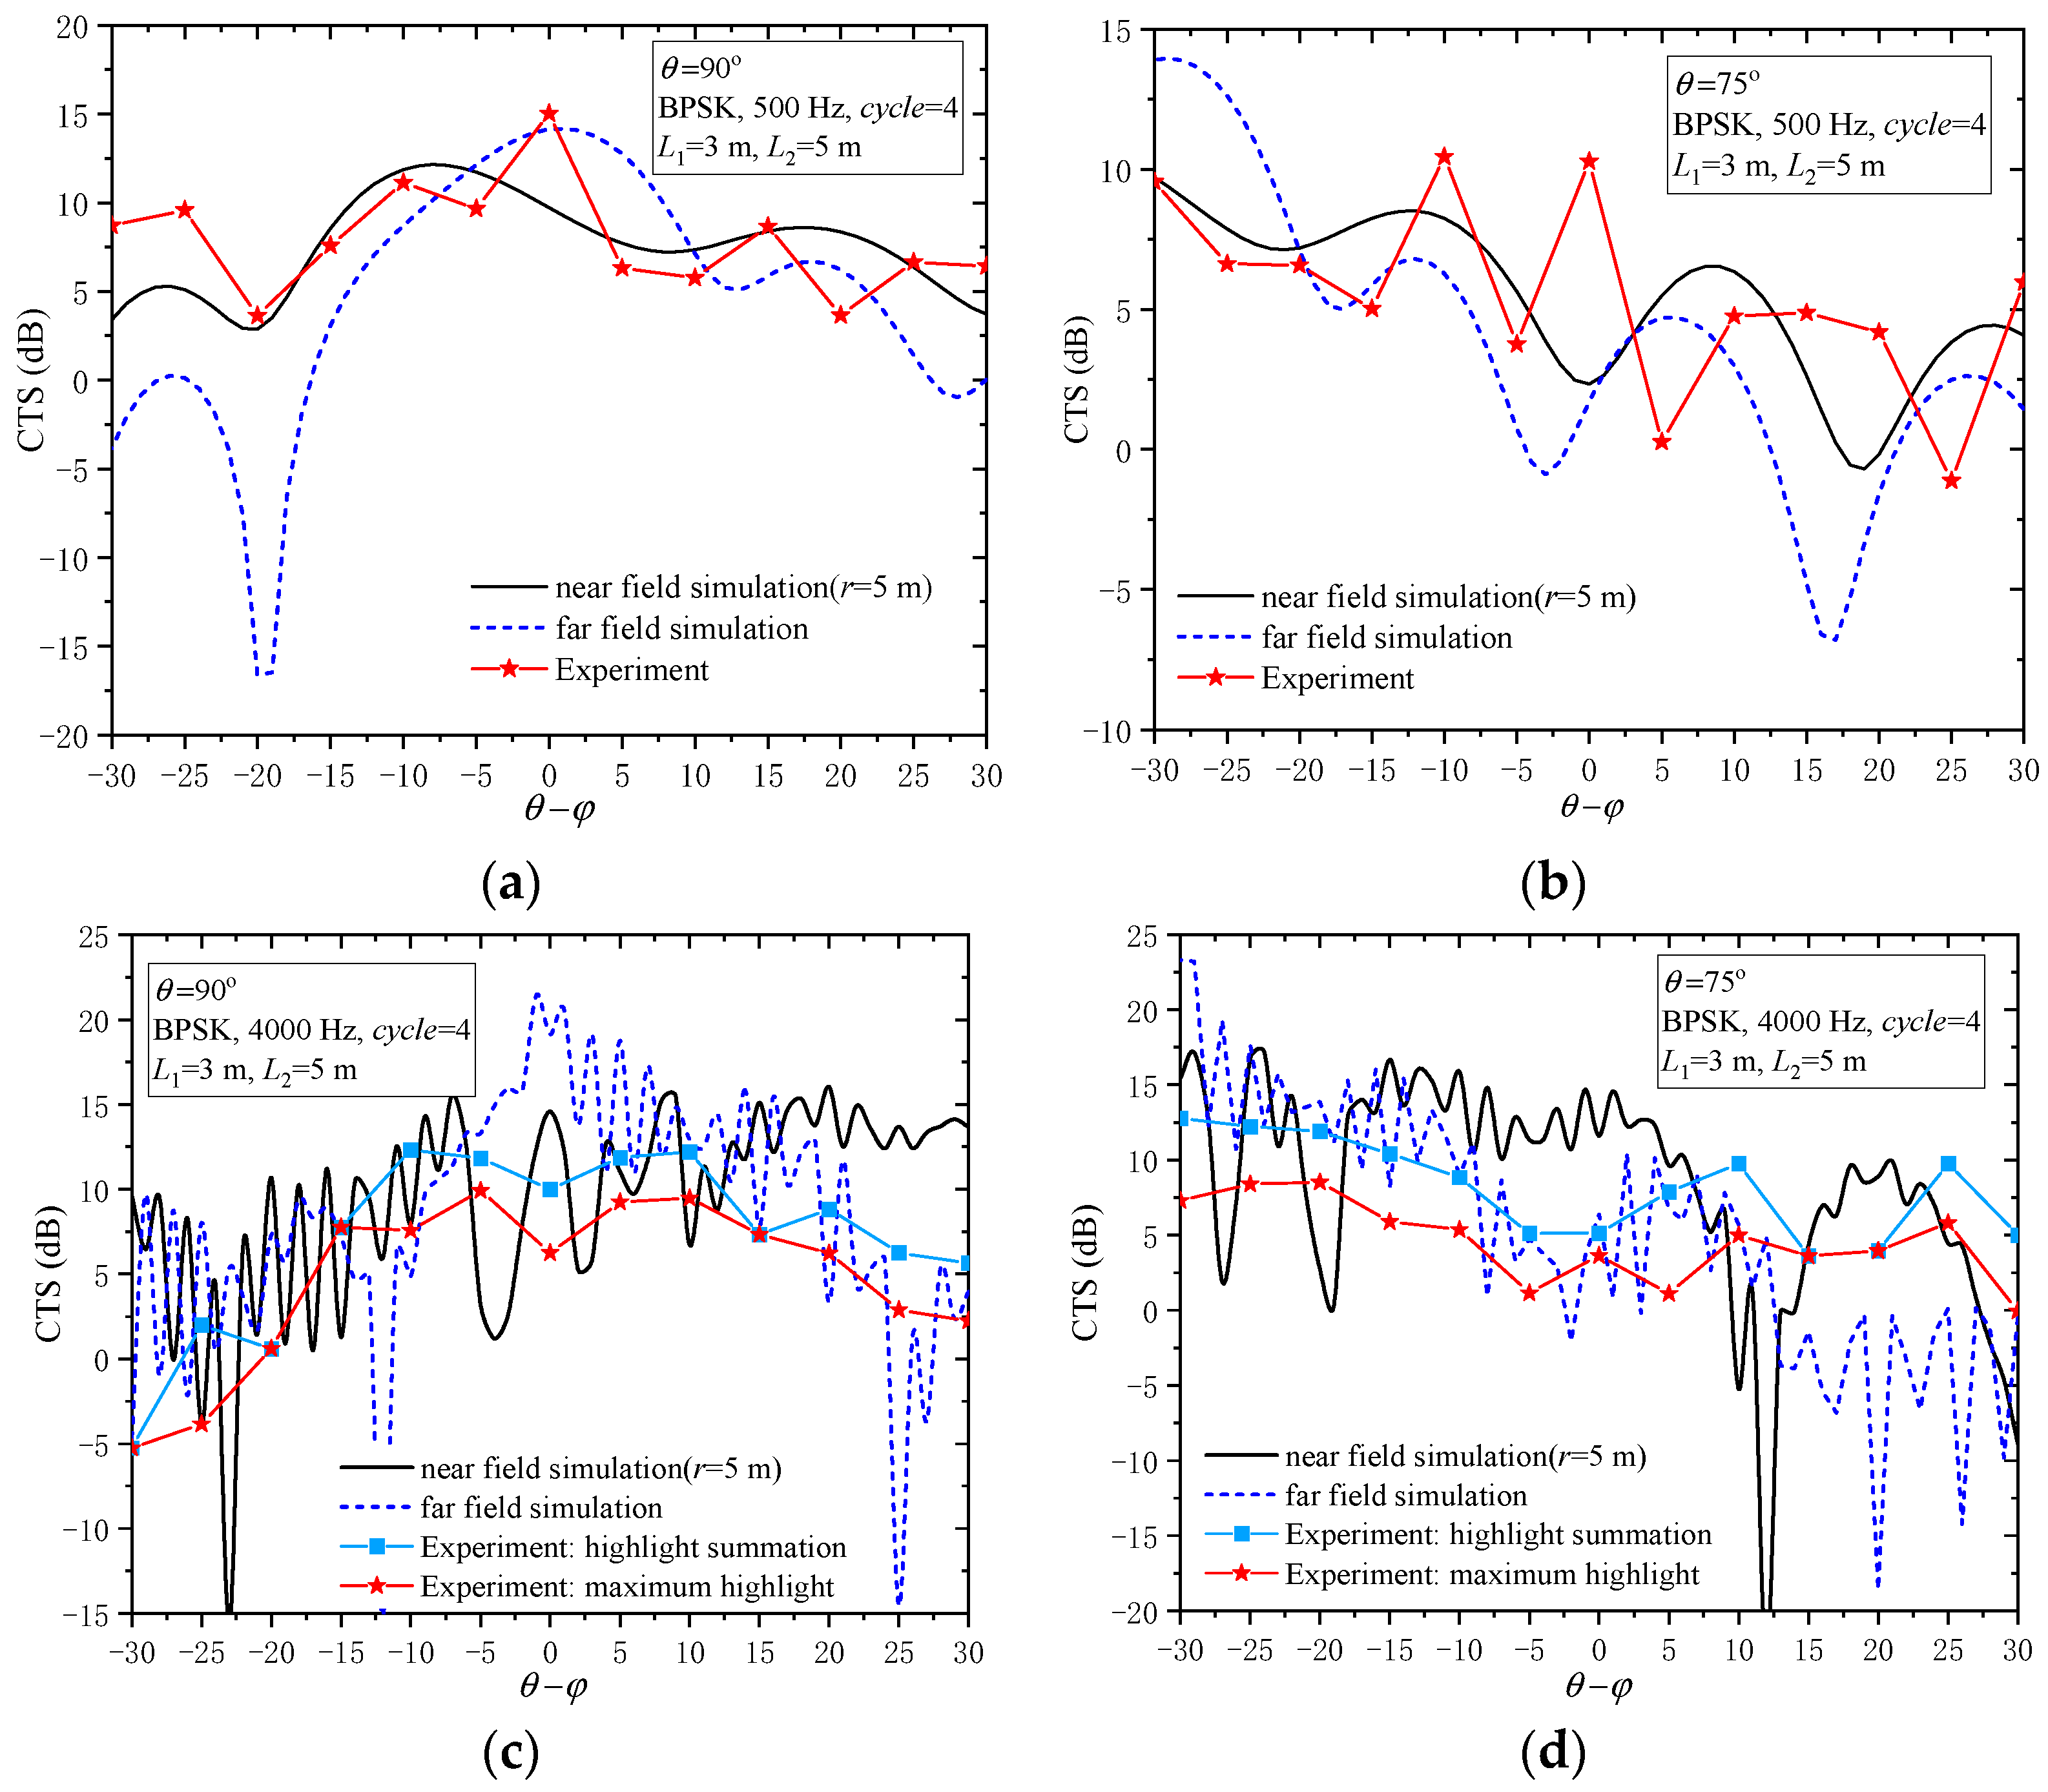
3.2. Echo Azimuth Characteristics of BPSK Signals

The frequency-domain steady-state characterisation of monostatic echoes has been extensively studied. The focus herein was placed on the echo strength and features of the BPSK broadband signals. Although anechoic cotton had been laid on the pillars in the test, the pillar highlight could still be recognised in the echo range profile. Therefore, when calculating the echo strength, it was necessary to exclude the pillar highlights. Figure 8 shows the frequency-domain simulation and test results under different incidence angles. The variation pattern of the scattering strength of the largest highlight in the experiment was similar to that in the simulation. However, in the experiment, the variation with angle was more gradual. This occurred because the broadband signals played a smoothing role within a certain frequency band. As shown in Figure 8a, the echo strength near the positive horizontal direction was smaller than that in the simulation result, which was caused by the masking of the echo by the sound source in the far-end receiving test. Comparing the echo strength curves at different frequencies, it was observed that the higher the frequency, the “sharper” the azimuthal curve of echo strength. Due to the near-field interference, both the test and simulation results showed that the echo in the positive horizontal direction was not the strongest echo. The incidence angle of the strongest echo slightly deviated from the positive horizontal direction, but the strong echoes were still concentrated near the positive horizontal direction. The echo strength in the rudder direction was more than 15 dB smaller than that in the positive horizontal direction. It was difficult for the monostatic sonar to provide a sufficient signal-to-noise ratio for target echoes deviating from the positive horizontal direction, which was one of the reasons why it was difficult for it to achieve better detection. Although the Suboff submarine echo features were characterised by multiple highlights, the detection of the echo in the noise background depended on the echo strength of the largest highlight. Figure 8 shows that the angular distribution curve of the largest highlight echo strength was consistent with the single-frequency simulation results, and the highlight summation was higher than that in the simulation result. This indicates that when the BPSK coded signal is used for active target detection, the single-frequency steady-state scattering strength can be used to estimate the largest highlight echo strength of the actual signal.

3.3. Multistatic Scattering Feature Acquisition of BPSK Signals

According to the above echo azimuth characteristics, the strength of the echo deviating from the positive horizontal direction decreases dramatically. The adoption of multistatic detection is an important means to improve the performance of active detection. Therefore, the magnitude and distribution of multistatic scattering strength are of fundamental guiding significance for multistatic sonar detection. The multistatic measurement model is shown in Figure 1a. A total of three centre frequencies (500, 1500, 4000 Hz) were set for the experiment. The near-end experiments were carried out at the incidence angles of 135° and 150°, whereas the far-end experiments were set at two incidence angles, 90° and 75°, with an offset angle step interval of 5°.
The reflection waves obtained from the near-end experiments are shown in Figure 9. The near-field and far-field simulation results with the same receiving distance under different offset angles are presented in the same figure. Taking Figure 9a as an example, when the incidence angle was 135°, the reflection wave appeared to be extremely small near the offset angle of 0° (echo). The strength of the reflection wave tended to increase with the increase in the offset angle. Although the simulation results oscillated with the angle, the variation pattern of scattering strength (solid line) in the near-field simulation was overall consistent with that of the maximum highlight strength (line with solid triangles) obtained in the experiment. An extreme value occurred near the offset angle of 70°, and the strength of the mirror reflection wave (θφ = 90°) exceeded the echo strength by more than 8 dB. In the far-field simulation, the strength of the scattering wave in the mirror reflection direction exceeded the echo strength by more than 15 dB. Figure 9b–d shows the same results as the above pattern, proving that the strength of the multistatic reflection wave was larger than that of the echo over a wide range of offset angles.
Figure 10 shows the variation curve of the strength difference between the mirror reflection wave and the echo with frequency. The test results showed consistency with the near-field simulation results. As the broadband BPSK signals had an averaging effect in a certain frequency band, the experimental results did not oscillate as violently as the simulation results. The curve of the test results was within the oscillation range of the simulation results. Overall, the mirror reflection wave was 5–10 dB stronger than the echo in the near-field receiving test, whereas it was 15–30 dB stronger in the far-field test. This can provide a physical basis for multistatic detection and indicates that the potential advantage of multistatic active detection is that the reflection wave is much stronger than the echo.
The strength of the reflection wave was tested at the far-end at two incidence angles, 90° and 75°. The experimental results obtained from the far-end receiving tests with different offset angles for multiple bases as well as the simulation results are shown in Figure 11. Unlike the near-end test, multiple highlights were not observed at 500 Hz. This occurred because the time delay of the reflection wave highlights near the positive horizontal direction in the far-field test became smaller. The time difference between the largest and the smallest acoustic paths was less than 1 chip width of the BPSK signal. The experimental results were basically consistent with the near-field simulation results in variation tendency and intensity level. For the low frequency results (500 Hz), some experimental values fluctuated significantly near the simulation results. The reason may be that the low-frequency sound absorption performance of the anechoic panel at the bottom was slightly poor, and the ground reflection interfered with the echo. At 4000 Hz, the deviation between the experimental and simulation results in some receiving angles was due to the fact that the sound source used in the experiment had certain directivity in the high frequency band and could not irradiate the target approximately evenly.
The comparison of Figure 11a,c showed that at an incidence angle of 90°, the echo at the positive horizontal direction was a mirror reflection wave. The reflection wave near the offset angle of 0° was the strongest. The strength of the reflection wave decreased as the offset angle became larger. The higher the frequency, the stronger the exhibited directivity, and the smaller the angular range of the strong reflection wave distribution. In the results with lower frequencies, both the simulation and experimental curves were relatively smooth and had considerable reflection wave strength over a large angular range. This implies that low-frequency acoustic waves have lower requirements for the multistatic detection offset angle, but the scattering strength is slightly reduced. Frequency selection for multistatic detection is probably a compromise between scattering strength and distribution angle. It is worth mentioning that the acoustic wavelength at 500 Hz was 1.67 times the diameter of the Suboff submarine. At this point, strong echoes and reflection waves could still be obtained. This directly proves the feasibility of low-frequency active detection. In addition, the results at an incidence angle of 75°, as shown in Figure 11b,d, further confirmed the basic fact that the strength of the mirror reflection wave was greater than that of the echo in both low and high frequencies. The strength difference between these two was more pronounced in the far-field (up to 10 dB), but was slightly smaller than that at incidence angles of 135° and 150°. As the difference may be related to the incidence angle, the simulation calculated the strength curves of the echo and mirror reflection waves at different incidence angles, as shown in Figure 12.
Figure 12 shows that the strong mirror reflection was maintained at most incidence angles. The difference between the reflection wave and echo was more pronounced in the ranges of incidence angles of [15°, 60°] and [120°, 165°]. For the echo, the maximum value was obtained in the positive horizontal direction and the echo strength decreased with the change of angle from both sides of the positive horizontal direction. The reflection wave remained at a high scattering strength at any angle at high frequencies. When the incident wave was at low frequencies and the grazing angle was small, the strength of the mirror reflection wave was weak, and the strength increased with the increase in the angle. The strength was basically stable in the range of [30°, 150°]. In fact, the angular range of strong reflection was related to the effective length of the submarine and the frequency, which can be estimated by the formula to determine the geometric scattering area (kLsinθ > 2π). As the diameter of the tail section was much smaller than that of the midbody section, the effective length was approximately 3 m.
Multistatic sonar detection requires simultaneous attention to the distribution of strong scattering waves throughout the scattering plane. As shown in Figure 13, the scattering sound pressure field in the XOY-plane was further simulated and the output was the sound pressure level (dB). Overall, the strong scattering regions were mainly concentrated in the fan-shaped area on one side of the mirror reflection direction as well as in the forward scattering direction. As forward scattering was a steady state assuming that the incident wave was distributed throughout the entire space around the target, it was still difficult to distinguish the direct wave from the forward scattering in the time domain [37]. Forward scattering is not discussed in depth in this paper, and details can be found in the literature [38]. In the fan-shaped areas where the echo direction was located, there were also widespread scattering waves that were stronger than the echo. This indicates that even if the multistatic sonar was deployed in the fan-shaped areas where the echoes were located, there was still a high probability improving the detection performance.
In addition, frequency was the dominant factor in the scattering strength distribution. For high-frequency scattering, the direction of the strongest reflection waves at all incidence angles coincided with the mirror reflection direction. For low-frequency scattering, the strongest reflection wave deviated from the mirror reflection direction due to the strong interference between the parts of the submarine only at small grazing angles. However, the higher the frequency, the smaller the beam angle at which the reflection wave energy was concentrated. Therefore, the choice of frequency may be a compromise between the scattering intensity and distribution angle size of a strong scattering region.

3.4. Active Detection Performance of BPSK Signals

Figure 14 shows the range profiles of echoes from signals with different BPSK parameters in the far-end test. In Figure 14a–c, signals with different centre frequencies were used, whereas the spreading code length and number of carriers within the code chip were the same. In Figure 14b,d, the number of carriers within the code chip (cycle) was different, whereas the rest of the parameters were the same. The results show that two echo highlights could be clearly distinguished in the 5000 Hz signal in Figure 14a. The highlight distance difference was 1.72 chips (0.4678 m). The prominent correlation peaks between the direct wave and the echo were due to reflections from the reference microphone mount. Interference only occurred at high frequencies. The two highlights of the 4000 Hz signal echo in Figure 14b almost merged into one correlation peak. The 600 Hz signal in Figure 14c exhibited only one echo highlight. The 4000 Hz signal in Figure 14d used a much smaller number of carriers within the code chip (cycle = 2), so two highlights could be distinguished. Therefore, a higher signal time-domain resolution was required to better extract the target highlight features. A higher carrier frequency or larger bandwidth (smaller cycle) was required for the BPSK signals.
Figure 15 shows the range profiles from the echo tests with different types of signals. Figure 15a,b shows the correlation calculation results of the far-end echoes in the positive horizontal direction using CW and BPSK signals. Both had a centre frequency of 6000 Hz and the same signal bandwidth (cycle = 4). Figure 15c,d shows the echoes after adding the same white noise. For the noise-free echoes, both the CW and BPSK signals could accurately obtain the echo highlight information. The bandwidths were the same, and the main lobe widths of the two signals were the same. However, the correlation peaks of the BPSK signals were sharper, and thus, better resolution of the highlights could be achieved. In addition, because the BPSK signal was a long signal, a larger correlation processing gain could be obtained. From the results with noisy echoes, the CW echoes under the current noise level could generally find the highlights, but there were missing highlights and “false highlights” caused by the noise. The BPSK echoes could still accurately capture all of the highlights after the correlation calculation. Therefore, the BPSK signal can guarantee high resolution and good noise immunity compared with the traditional pulse signal.
Figure 16 shows the autocorrelation curves of the BPSK and LFM signals. For the BPSK signal, the m-sequence length was N = 63, the number of carriers within the code chip was cycle = 4, and the bandwidth was 4/fc. For the LFM signal, the duration and bandwidth were the same as those of the BPSK signal. The simulation results showed that the widths of the main lobes of both signals were equal to 1/B. The BPSK sidelobe was horizontal with a height of −36 dB. The LFM signal exhibited multiple sidelobes, and the strongest sidelobe was only 13.5 dB weaker than the main lobe, which was much stronger than the sidelobe of the BPSK signal. In addition, the sidelobes near the main lobe of the LFM signal were significantly higher than those of the BPSK signal, and the range of the LFM higher than the sidelobes of the BPSK accounted for approximately 30% of the signal length. The LFM signal had low sidelobes far from the main lobe, which were much weaker than those of the BPSK signal. Figure 17 shows the correlation calculation curves of the received echoes of the BPSK and LFM signals in the experiment. Both signals had the same length and bandwidth, and both signals could accurately detect the target echo. However, the BPSK signal could simultaneously obtain the weak highlight at 36.19 chips, which corresponded to the farthest highlight of the echo in the positive horizontal direction, whereas the LFM signal could not recognise the weak highlight due to the impact of the sidelobes. In addition, the sidelobe level of the BPSK echo was below −30 dB, except for the highlight. Although the sidelobes of the LFM echoes were far from the main lobe and slightly lower than those of the BPSK, the high sidelobe level near the main lobe was easily confused with weak highlights, leading to missing or the incorrect capture of highlights. Both signals had high time-domain resolution and correlation gain, and the BPSK signals had a higher sidelobe level and correlation peak sharpness.

4. Conclusions

An acoustic scattering test of the Suboff submarine model was carried out in an anechoic chamber, and the test results were consistent with the theoretical range profiles. This proved the feasibility of obtaining the target geometric scattering characteristics with BPSK signals in the anechoic chamber as well as the validity of the direct path interference suppression method. The comparison with CW and LFM signals verified that the use of BPSK signals for low- and medium-frequency target detection had the advantages of low sidelobe level, high resolution, and noise resistance. The omnidirectional scattering characteristics of the Suboff submarine model were investigated through a frequency-domain simulation with the artificial boundary element method and an acoustic scattering test with the broadband BPSK signals. The potential advantages of the bistatic and multistatic detection were proven from the scattering mechanism. The conclusions are as follows:
  • The echo azimuth characteristics of broadband BPSK signals were generally consistent with the steady-state characteristics in the frequency domain. In the time domain, the correlation scattering strength of the maximum highlight in the echo was roughly equal to that in the frequency domain. Due to the averaging effect of broadband, the interference of the echo strength curve of BPSK signals was smaller.
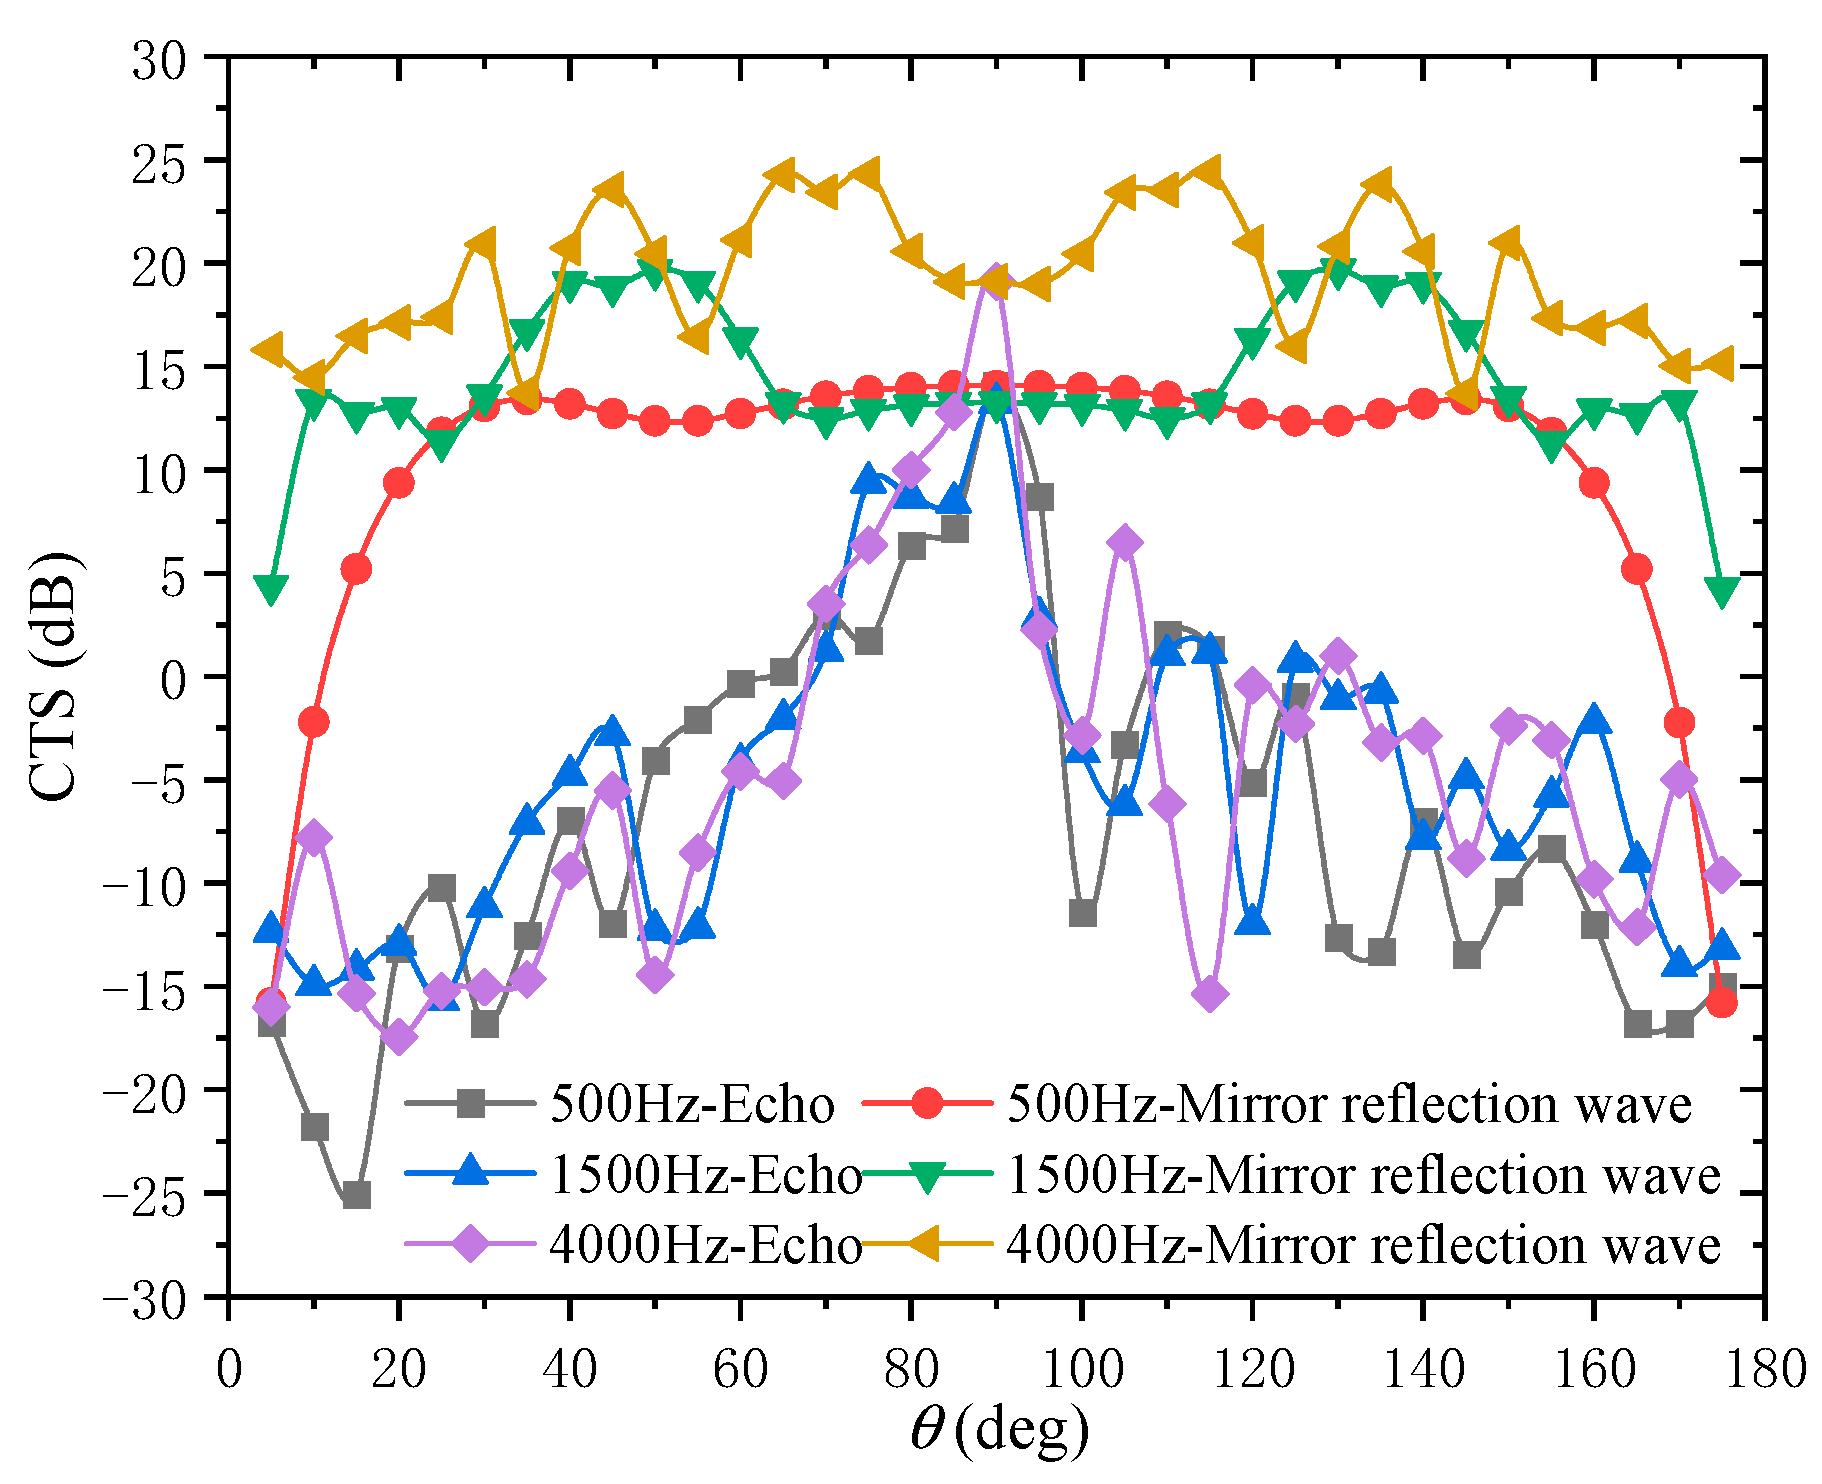
  • The strength of mirror reflection and its scattering in the nearby directions was much greater than that of the echo. The difference in the far-field strength between these two could reach 15–30 dB. Moreover, strong mirror reflection was maintained at most incidence angles. This was the most prominent feature of multistatic scattering. At high frequencies, the scattering strength in the mirror reflection direction reached its maximum value. Only at low frequencies and small grazing angles, the maximum angle shifted due to interference.
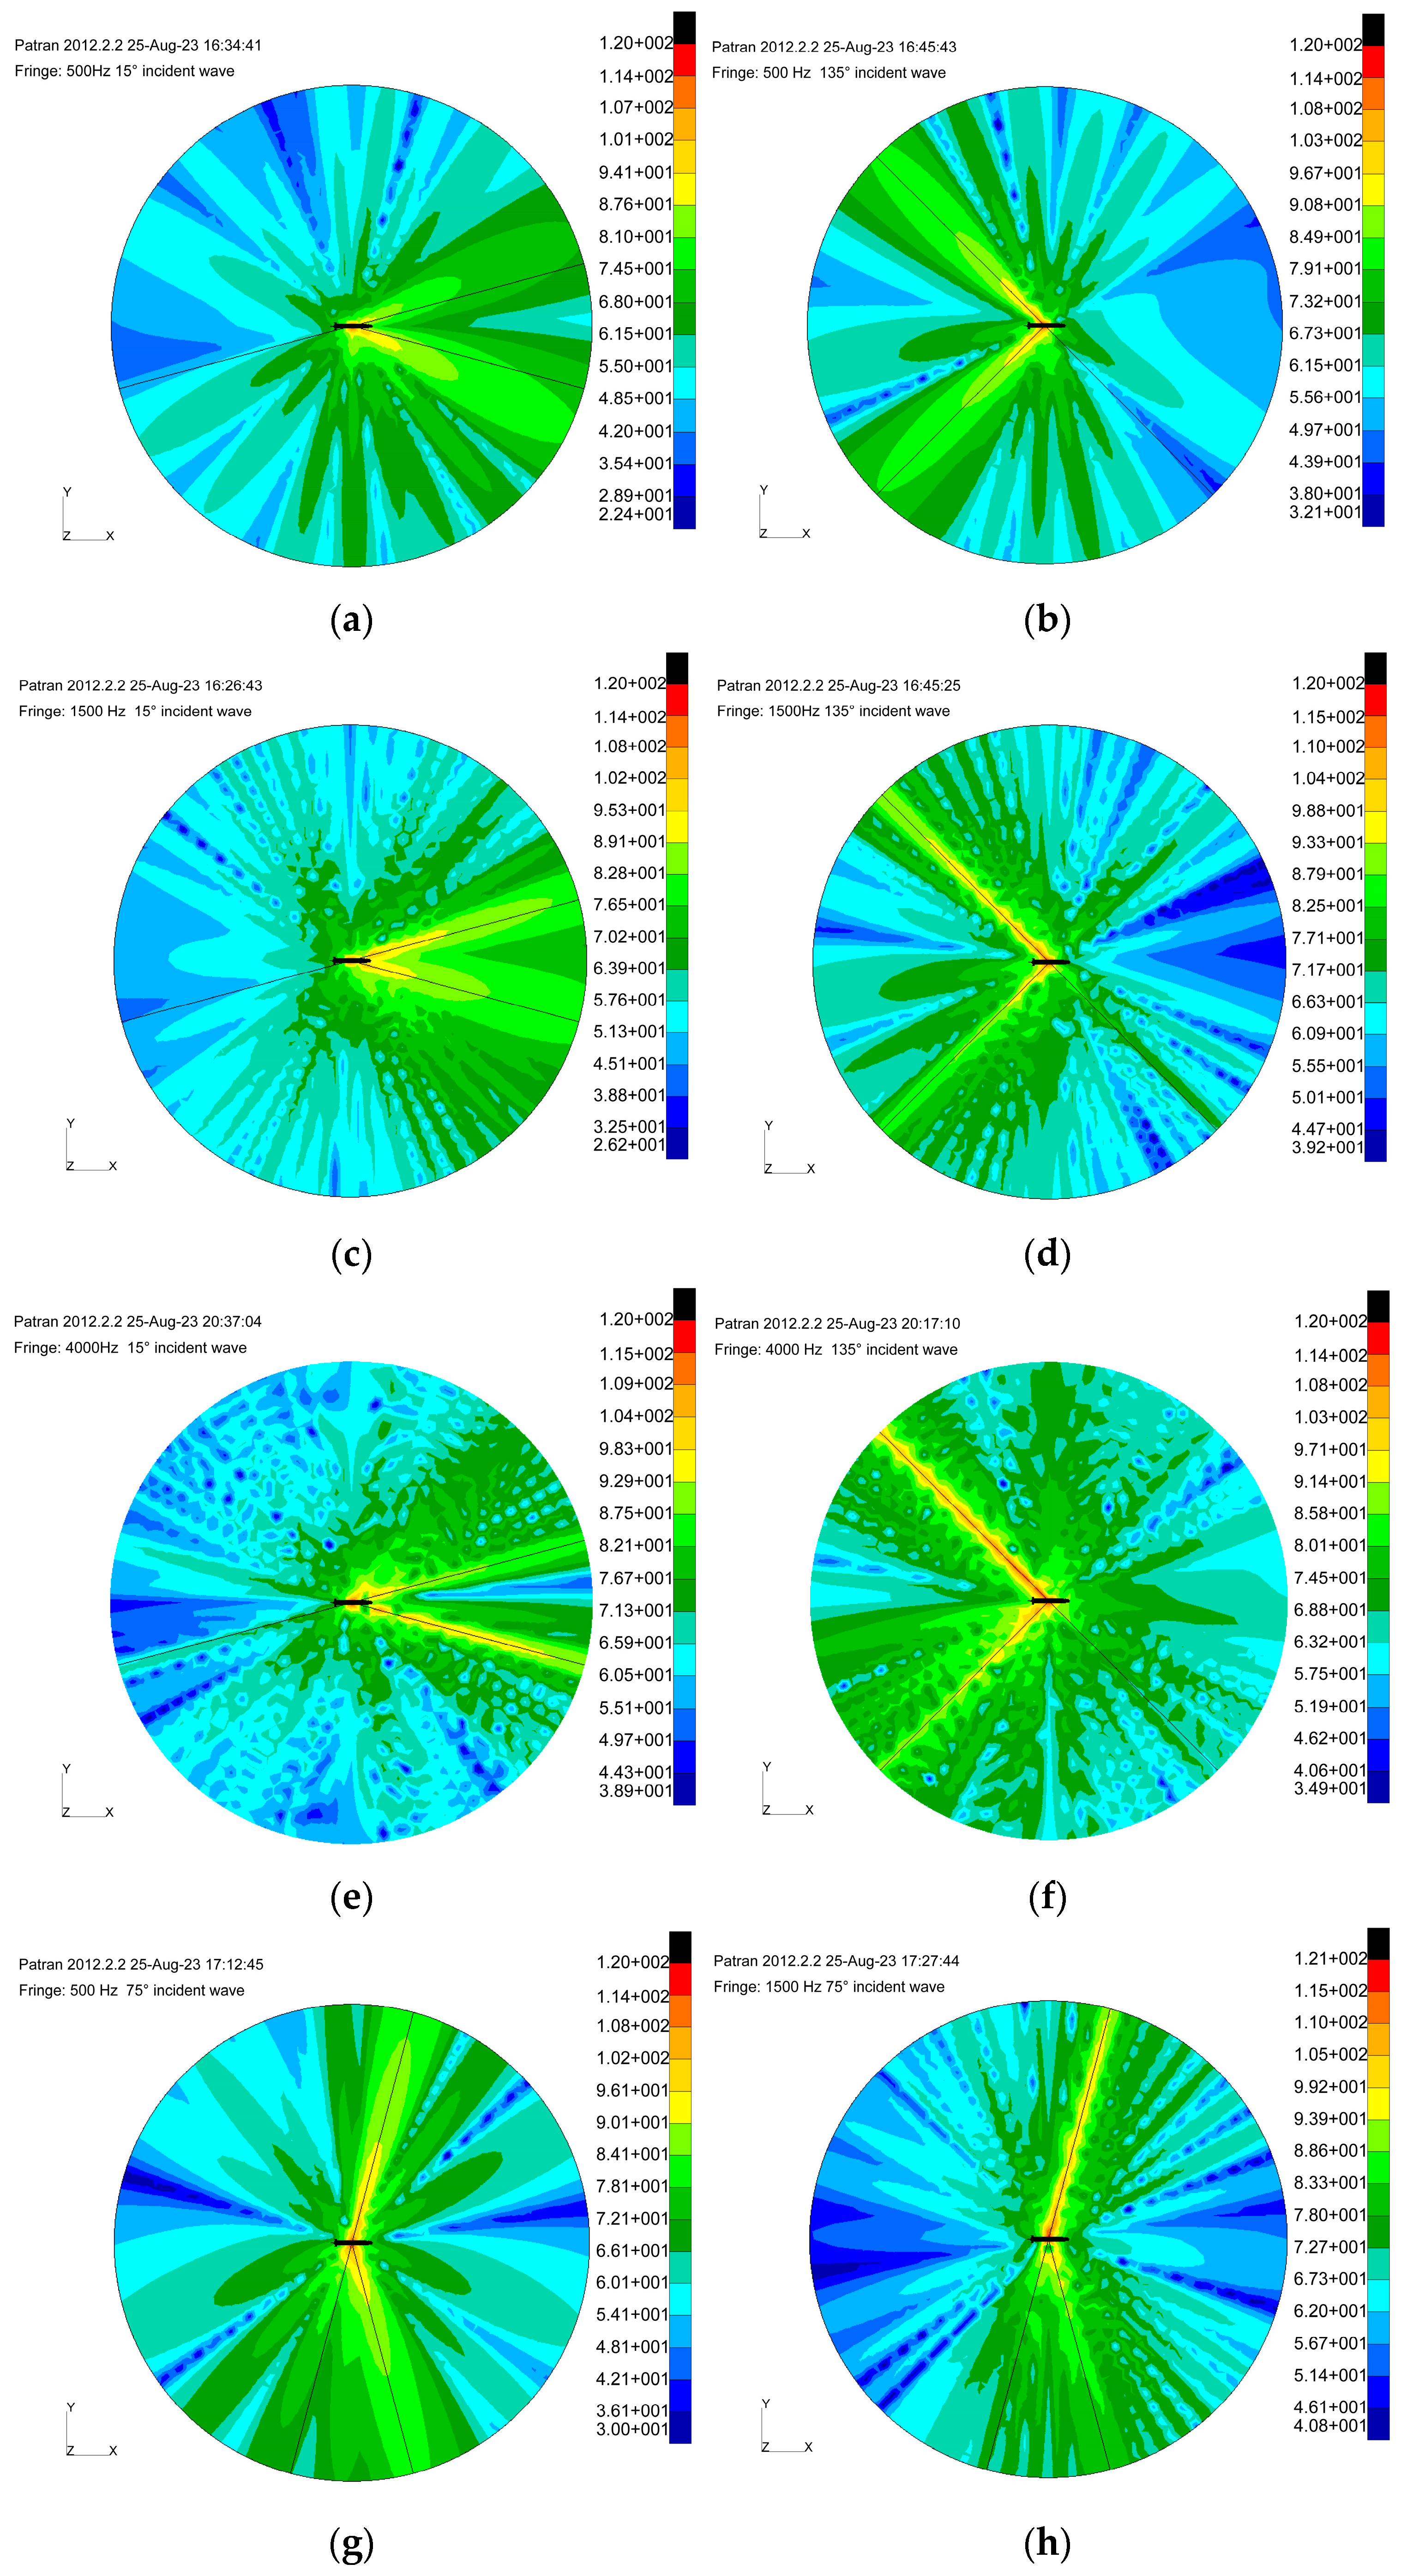
  • A high proportion of scattering waves were found in the fan-shaped area where the mirror reflection direction was located. These scattering waves were much stronger than the echo. Scattering waves stronger than the echo were also observed within the fan-shaped area where the echo direction was located.
  • Frequency was the dominant factor in the scattering strength distribution. The higher the frequency, the smaller the beam angle of the strong scattering distribution in the mirror reflection direction. At low frequencies, strong scattering had a wider distribution and slightly lower strength, but the reflection wave strength was still significantly greater than the echo strength.
  • The effective dimensionless frequency of the submarine model detected by low-frequency BPSK signals could reach ka = 1.88.
The above conclusions can provide theoretical support and guidance for bistatic and multistatic target detection.

Author Contributions

Conceptualisation, Y.T. and Q.Z.; Methodology, Q.Z.; Software, Y.T.; Resources, Y.P. and X.L.; Writing—original draft preparation, Y.T. and X.L.; Writing—review and editing, Q.Z. and X.W.; Funding acquisition, Y.P. All authors have read and agreed to the published version of the manuscript.

Funding

This research was funded by National Natural Science Foundation grant number 52071334.

Institutional Review Board Statement

Not applicable.

Informed Consent Statement

Not applicable.

Data Availability Statement

Data are contained within the article.

Conflicts of Interest

The authors declare no conflict of interest.

References

  1. Li, X.; Hou, H.; Wang, K.; Meng, C. Overview of Underwater Target Feature Extraction Methods. In Proceedings of the 6th International Conference on Mechatronics and Intelligent Robotics (ICMIR2022), Kunming, China, 20–22 May 2022; SPIE: Paris, France, 2022; Volume 12301, pp. 678–686. [Google Scholar]
  2. Wu, Y.; Li, X.; Wang, Y. Extraction and classification of acoustic scattering from underwater target based on Wigner-Ville distribution. Appl. Acoust. 2018, 138, 52–59. [Google Scholar] [CrossRef]
  3. Wang, J.; Lin, H.; Zhang, Q.; Guo, H.; Ge, J. Acoustic compact test range system for large-scale target characteristic testing in a shorter distance. Appl. Acoust. 2023, 206, 109307. [Google Scholar] [CrossRef]
  4. Tran-Van-Nhieu, M. Scattering from a ribbed finite cylindrical shell. J. Acoust. Soc. Am. 2001, 110, 2858–2866. [Google Scholar] [CrossRef]
  5. Gong, Z.; Li, W.; Chai, Y.; Zhao, Y.; Mitri, F.G. T-matrix method for acoustical Bessel beam scattering from a rigid finite cylinder with spheroidal endcaps. Ocean Eng. 2017, 129, 507–519. [Google Scholar] [CrossRef]
  6. Pan, A.; Fan, J.; Wang, B.; Chen, Z.G.; Zheng, G.Y. Acoustic scattering from the finite periodically ribbed two concentric cylindrical shells. Acta Phys. Sin. 2014, 63, 214301. [Google Scholar] [CrossRef]
  7. Zhou, F.; Fan, J.; Wang, B.; Zhou, Y.; Huang, J. Acoustic barcode based on the acoustic scattering characteristics of underwater targets. Appl. Acoust. 2022, 189, 108607. [Google Scholar] [CrossRef]
  8. Maxit, L.; Oudot, G.; Audoly, C. Target Strength Modeling of Submarines. In Proceedings of the Undersea Defence Technology Conference (UDT 2004), Nice, France, 22–25 June 2004. [Google Scholar]
  9. Nijhofa, M.; Fillingera, L.; Gilroyb, L.; Ehrlichc, J.; Schäferc, I. BETSSI IIB: Submarine Target Strength Modeling Workshop. In Proceedings of the 4th Underwater Acoustics Conference and Exhibition, Skiathos, Greece, 3–8 September 2017. [Google Scholar]
  10. Sun, X.; Fan, W.; Fan, J. Simulation and experimental verification of acoustic image of echo bright spots for single hull submarine targets. J. Nav. Univ. Eng. 2012, 24, 26–31. [Google Scholar]
  11. Liu, J.; Peng, Z.; Fan, J. Acoustic Scattering Prediction Method of Underwater Vehicles Based on Slice-parameterized Multi-highlight Model. Acta Armamentarii 2023, 44, 517–525. [Google Scholar]
  12. Wang, W.; Wang, B.; Fan, J.; Zhou, F.; Zhao, K.; Jiang, Z. A simulation method on target strength and circular SAS imaging of X-rudder UUV including multiple acoustic scattering. Def. Technol. 2023, 23, 214–228. [Google Scholar] [CrossRef]
  13. Agounad, S.; Décultot, D.; Chati, F.; Léon, F.; Khandouch, Y. Experimental study of the bistatic acoustic scattering from cylindrical shell. Mech. Syst. Signal Process. 2023, 186, 109892. [Google Scholar] [CrossRef]
  14. Agounad, S.; Aassif, E.H.; Khandouch, Y.; Maze, G.; Décultot, D. Investigation into the bistatic evolution of the acoustic scattering from a cylindrical shell using time-frequency analysis. J. Sound Vib. 2018, 412, 148–165. [Google Scholar] [CrossRef]
  15. Fischell, E.M.; Schmidt, H. Supervised machine learning for estimation of target aspect angle from bistatic acoustic scattering. IEEE J. Ocean. Eng. 2017, 42, 759–769. [Google Scholar] [CrossRef]
  16. Wang, B.; Wang, W.H.; Fan, J.; Zhao, K.Q.; Zhou, F.L.; Tan, L.W. Modeling of bistatic scattering from an underwater non-penetrable target using a Kirchhoff approximation method. Def. Technol. 2022, 18, 1097–1106. [Google Scholar] [CrossRef]
  17. Zhao, C.; Zhang, T.; Hou, G.X. Finite-difference time-domain modeling for underwater acoustic scattering applications based on immersed boundary method. Appl. Acoust. 2022, 193, 108764. [Google Scholar] [CrossRef]
  18. Pakdel Azar, O.; Amiri, H.; Razzazi, F. Enhanced target detection using a new combined sonar waveform design. Telecommun. Syst. 2021, 77, 317–334. [Google Scholar] [CrossRef]
  19. DeFerrari, H.; Wylie, J. Ideal signals and processing for continuous active sonar. In Proceedings of the Meetings on Acoustics, Montreal, QC, Canada, 2–7 June 2013; AIP Publishing: Melville, NY, USA, 2013; Volume 19. [Google Scholar]
  20. DeFerrari, H.; Birdsall, T. The application of M sequences to sonar. J. Acoust. Soc. Am. 2001, 109, 2418. [Google Scholar] [CrossRef]
  21. DeFerrari, H.A. The application of m-sequences to bi-static active sonar. J. Acoust. Soc. Am. 2003, 114, 2399–2400. [Google Scholar] [CrossRef]
  22. Jourdain, G.; Henrioux, J.P. Use of large bandwidth-duration binary phase shift keying signals in target delay Doppler measurements. J. Acoust. Soc. Am. 1991, 90, 299–309. [Google Scholar] [CrossRef]
  23. Jobst, W.; Whited, L.; Smith, D.W. Acoustic clutter removal. IEEE J. Ocean. Eng. 2021, 46, 1000–1007. [Google Scholar] [CrossRef]
  24. Colin, M.E.G.D.; Beerens, S.P. False-alarm reduction for low-frequency active sonar with BPSK pulses: Experimental results. IEEE J. Ocean. Eng. 2011, 36, 52–59. [Google Scholar] [CrossRef]
  25. Jiang, L.; Yan, S.; Wu, Y.; Ma, X. Sonar Detection Performance with LFM-BPSK Combined Waveforms. In Proceedings of the OCEANS 2016-Shanghai, Shanghai, China, 10–13 April 2016; IEEE: New York, NY, USA, 2016; pp. 1–4. [Google Scholar]
  26. Wang, Z.S. Statistical feature of underwater target echo highlight. Acta Phys. Sin. 2013, 62, 084302. [Google Scholar]
  27. Urick, R.J. Principles of Underwater Sound; Peninsula Publishing: Westport, CT, USA, 1975; p. 1083. [Google Scholar]
  28. Tang, W.L.; Fan, J.; Ma, Z.C. Acoustic Scattering of Underwater Target; Science Press: Beijing, China, 2018. [Google Scholar]
  29. Xie, A.; Liu, X.; Zhao, F.; Liu, Z.; Xiao, S. Waveform design and processing method of pulse signal in anechoic chamber measurement. Measurement 2022, 203, 111938. [Google Scholar] [CrossRef]
  30. Liu, X.; Zhao, F.; Xu, Z.; Ai, X.; Xiao, S. Design and experimental research of precession target micro-Doppler measurement using pulse signal in anechoic chamber. Measurement 2021, 184, 109948. [Google Scholar] [CrossRef]
  31. Liu, X.; Liu, J.; Zhao, F.; Ai, X.; Wang, G. An equivalent simulation method for pulse radar measurement in an anechoic chamber. IEEE Geosci. Remote Sens. Lett. 2017, 14, 1081–1085. [Google Scholar] [CrossRef]
  32. Jia, H.; Li, X.; Meng, X.; Yang, Y. Extraction of echo characteristics of underwater target based on cestrum method. J. Mar. Sci. Appl. 2017, 16, 216–224. [Google Scholar] [CrossRef]
  33. Groves, N.C.; Huang, T.T.; Chang, M.S. Geometric Characteristics of DARPA SUBOFF Models; David Taylor Research Center: Bethesda, MD, USA, 1989. [Google Scholar]
  34. Tang, Y.; Zhou, Q.; Lü, X.; Ji, G.; Tan, L. A Numerical Method for Scattering from Multi-domain Structures Based on Near-Field Artificial Boundary. J. Vib. Eng. Technol. 2024, 12, 7021–7033. [Google Scholar] [CrossRef]
  35. Ginolhac, G.; Jourdain, G. Principal component inverse algorithm for detection in the presence of reverberation. IEEE J. Ocean. Eng. 2022, 27, 310–321. [Google Scholar] [CrossRef]
  36. Fan, Z.; Liang, G.L.; Wang, Y.L. Robust adaptive beamforming with null widening. J. Electron. Inf. Technol. 2013, 35, 2764–2770. [Google Scholar] [CrossRef]
  37. He, C.; Zheng, Y.; Ma, Y. Analysis and application of the acoustic interfered field distortion for acoustic forward-scattering detection of underwater targets. Acta Acust. 2021, 46, 939–949. [Google Scholar]
  38. Feng, B.; Xu, W.; Cai, J.; Wu, R.; Wang, H. Phase-preserving theory and its linearization approximation for forward scattering field of scalar acoustic wave equation. Acta Phys. Sin. 2023, 72, 159101. [Google Scholar] [CrossRef]
Figure 1. Suboff measurement models: (a) reflection model; (b) echo model.
Jmse 12 01590 g001
Figure 2. Photographs of actual experimental scenarios: (a) far-end echo measurement; (b) near-end reflection measurement.
Jmse 12 01590 g002
Figure 3. Direct path interference suppression using the “anechoic cloak”.
Jmse 12 01590 g003
Figure 4. Comparison before and after direct path interference suppression: (a) no suppression; (b) suppression by physical means of the “anechoic cloak”; (c) combined with direct wave suppression method.
Jmse 12 01590 g004
Figure 5. Geometry of the echo highlight.
Jmse 12 01590 g005
Figure 6. Echo range profiles at different incidence angles.
Jmse 12 01590 g006
Figure 7. Distribution of echo highlights: distance–azimuth.
Jmse 12 01590 g007
Figure 8. Echo azimuth characteristic curves comparison of the BPSK echo test results with the frequency-domain steady-state solution: (a) 4000 Hz far-end receiving; (b) 4000 Hz near-end receiving; (c) 1500 Hz near-end receiving; (d) 6000 Hz near-end receiving.
Jmse 12 01590 g008
Figure 9. Multistatic scattering strength characterisation: near-end receiving test at the 135° and 150° incidence angles: (a) 1500 Hz, θ = 135°; (b) 1500 Hz, θ = 150°; (c) 4000 Hz, θ = 135°; (d) 4000 Hz, θ = 150°.
Jmse 12 01590 g009
Figure 10. Difference between mirror reflection strength and echo strength (near-end receiving test): (a) θ = 135°; (b) θ = 150°.
Jmse 12 01590 g010
Figure 11. Multistatic scattering strength characterisation: far-end receiving test at the 90° and 75° incidence angles: (a) 500 Hz, θ = 90°; (b) 500 Hz, θ = 75°; (c) 4000 Hz, θ = 90°; (d) 4000 Hz, θ = 75°.
Jmse 12 01590 g011
Figure 12. Mirror reflection wave and echo strength at different incidence angles.
Jmse 12 01590 g012
Figure 13. Simulation results of the far-field scattering pattern: (a) 500 Hz, θ = 15°; (b) 500 Hz, θ = 135°; (c) 1500 Hz, θ = 15°; (d) 1500 Hz, θ = 135°; (e) 4000 Hz, θ = 15°; (f) 4000 Hz, θ = 135°; (g) 500 Hz, θ = 75°; (h) 1500 Hz, θ = 75°.
Jmse 12 01590 g013
Figure 14. Range profiles of echoes from the BPSK signals with different parameters.
Jmse 12 01590 g014
Figure 15. Comparison of highlight acquisition by BPSK and CW.
Jmse 12 01590 g015
Figure 16. Transmission signal autocorrelation curves: (a) m-sequence BPSK; (b) LFM signal.
Jmse 12 01590 g016
Figure 17. Test echo signal correlation calculation results: (a) BPSK, 1500 Hz, N = 63, cycle = 4; (b) LFM, B = 375 Hz, T = 0.168 s.
Jmse 12 01590 g017
Table 1. Error between the theoretical geometric highlights and experimental highlights.
θHighlight Positiond1 (m)d2 (m)Direct Wave and Highlight Echo Acoustic Path (m)Test Value (m)Error
90°Nearest hull highlight1.561.563.123.140.6%
Sail1.751.9773.7273.6222.8%
Farthest hull highlight1.7642.484.2444.260.4%
135°Nearest hull highlight0.5781.1681.7461.771.4%
Sail1.1441.3172.4612.412.1%
Pillar 11.5611.5743.1353.072.0%
Pillar 21.9862.03.9863.950.9%
Disclaimer/Publisher’s Note: The statements, opinions and data contained in all publications are solely those of the individual author(s) and contributor(s) and not of MDPI and/or the editor(s). MDPI and/or the editor(s) disclaim responsibility for any injury to people or property resulting from any ideas, methods, instructions or products referred to in the content.

