Article

Study on the Factors Influencing the Amplitude of Local Ice Pressure on Vertical Structures Based on Model Tests

School of Chemical Engineering, Ocean and Life Sciences, Dalian University of Technology, Panjin 124221, China
*
Author to whom correspondence should be addressed.
J. Mar. Sci. Eng. 2024, 12(9), 1634; https://doi.org/10.3390/jmse12091634
Submission received: 20 August 2024 / Revised: 6 September 2024 / Accepted: 9 September 2024 / Published: 13 September 2024
(This article belongs to the Special Issue Advances in Ships and Marine Structures)

Abstract

:
Local ice pressure refers to the ice pressure exerted on a very small area of a structure during ice failure. The existence of high-pressure zones may lead to local deformation and damage to ice-resistant structures, posing a serious threat to the overall structural stability. This study simulates the interaction between sea ice and structures through model tests, analyzing the timing of extreme local ice pressures. The results show that at low loading speeds, there is a 50% probability that the extreme local ice pressure occurs at the peak of the global ice force, while at high loading speeds, this probability drops to around 25%. Further investigation into the relationship between the global ice force peak, ice thickness, loading speed, and local area with local ice pressure amplitude reveals that the local ice pressure amplitude decreases with increasing loading speed and increases with ice thickness. Based on the area averaging method for square regions, the relationship between local ice pressure amplitude and local area is studied, showing that ice thickness, local width, and loading speed all influence the pressure–area relationship. Based on the square area averaging method, the relationship between the local ice pressure amplitude and the local area was studied. It was found that a linear relationship exists between the power function coefficient of local ice pressure–area and the thickness-to-width ratio. Compared to brittle failure, the local ice pressure amplitude under ductile failure of the ice sheet is more significantly affected by ice thickness. This study provides a foundation and reference for the analysis of ice-resistant performance and structural design of polar marine engineering structures.

1. Introduction

With the growing global demand for energy and the deepening exploration of polar resources, the ice-resistant design of polar ships and offshore platforms has garnered increasing attention. However, global climate change and the increasing complexity of ice conditions in the Arctic and Antarctic regions have heightened the uncertainties and risks associated with the design and safe operation of marine structures. Ice loads are one of the primary factors affecting the safe operation of polar marine structures. Therefore, in-depth research on the characteristics and influencing factors of ice loads is crucial for enhancing the safety and sustainability of polar marine engineering.
In the design of ice-resistant vertical structures, researchers need to focus on both the global and local ice loads on the structure, i.e., the global and local ice pressures. Global ice pressure represents the average pressure across the entire contact surface when sea ice interacts with the structure, reflecting the structural load state as a whole. Local ice pressure, on the other hand, characterizes the ice pressure exerted on a very small local area of the structure during ice failure. The stress concentration areas generated by asynchronous failure of ice and structure are known as high-pressure zones [1,2]. Due to the unique properties of sea ice materials and the complexity of field ice conditions, the interaction process between ice and vertical structures is highly complex. As illustrated in Figure 1 [3], when an ice sheet interacts with a vertical structure, the middle layer of the ice sheet remains in a triaxial stress state, maintaining high compressive strength and resisting failure. As the ice sheet is continuously compressed, the middle layer bears most of the load, causing the initial internal cracks to extend toward the free surfaces on both sides, resulting in significant spalling and crushing of the ice sheet’s middle damage zone and flanks. The spalled ice is extruded, further reducing the actual contact area between the ice and the structure, leading to the formation of “line-shaped” high-pressure zones on the contact surface. Extensive measurement data and model tests have shown that the maximum local ice pressure can exceed 60 MPa, far surpassing the global ice pressure of the structure [4,5]. Therefore, the presence of local high-pressure zones may cause localized deformation and damage to the structure, posing a serious threat to the stability of the overall structure. In 1990, pressure panel data provided by the Finnish icebreaker I.B. Sampo [6] during its transit through the Baltic Sea indicated that as ice thickness increased, high-pressure zones would randomly move within a certain vertical range, directly affecting the reinforcement and installation positions of vertical structure panels, frames, and stiffeners. As a critical parameter of ice loads, the magnitude of local ice pressure directly impacts the stability and safety of the structure. The magnitude of local ice pressure refers to the maximum pressure exerted on a localized area of the structure during the interaction between ice and the structure, and its accurate prediction is essential for the design of polar marine equipment. Therefore, the ice-resistant design of vertical structures must consider the magnitude of local ice pressure and the distribution characteristics of high-pressure zones.
The study of local ice loads on vertical structures has a long history, with various research methods, including field monitoring, model tests, and numerical simulations. Overseas, the field measurement of ice loads on ship and offshore platform structures started early, accumulating a large amount of ice load data under complex ice conditions. Through the study of local ice pressure, it has been found that its magnitude is directly related to the contact area with the structure. The exponential relationship fitting local ice pressure and contact area has gained widespread recognition. Timco and Sudom summarized a large amount of experimental and field data, showing that ice pressure significantly decreases with increasing contact area [7]. Frederking et al. [8] and other scholars used the measurement data from the Molikpaq platform to establish a method for calculating local ice pressure based on contact area, clarifying the vertical and horizontal distribution characteristics of ice pressure. Masterson [9] analyzed a large number of measured ice load data and confirmed that an increase in contact area leads to a decrease in ice pressure. Based on measured data (contact area greater than 100 m2), they fitted a local ice pressure–contact area curve and proposed a calculation method for local ice pressure. Masterson et al. [10] considered the impact of ship collisions and Molikpaq platform measurements to revise the local pressure–contact area curve proposed in 1993, making it more specific in its applicability. Sanderson [11] analyzed data from indentation tests, impact hammers, offshore platforms, and medium-scale model tests and proposed that the average ice force decreases with increasing contact area between ice and the structure, a conclusion that has become a cornerstone of ice mechanics research. Kärnä, based on measured data from lighthouses in the Baltic Sea, found that ice pressure caused by ice fragmentation decreases with increasing ice thickness [12]. When ice floes are thicker, due to changes in the ice failure mode, the distribution of local ice pressure is no longer concentrated along the centerline, and multiple high-pressure zones may appear [13,14]. Sodhi also pointed out that the loading rate affects the failure mode and pressure distribution of sea ice [15]. Frederking, based on field data, found that the variation in local ice pressure tends to synchronize with the global ice load variation [4]. Palmer made new assumptions about the stress of high-pressure zones during the ice crushing process and redefined the local ice pressure region [16]. Su used numerical methods to analyze the characteristics of local ice loads during ship navigation [17]. Timco analyzed the effects of ice speed, width-to-thickness ratio, ice failure mode, and ice mechanical properties on local pressure, in addition to area, and found that not all data conform to the pressure–area curve [7]. Taylor proposed a probabilistic model for simulating local high-pressure zone loads [18]. Shamaei, based on ship-measured data, studied the negative correlation between the peak local ice pressure and ice thickness [19]. Long, using numerical analysis, proposed that the effect of loading rate on local ice pressure is caused by changes in sea ice failure modes [20]. Wang, through model tests, suggested that under different ice speeds, the local ice pressure exceeding three times the uniaxial compressive strength accounts for less than 2% of the nominal contact area [21]. Zhao, using numerical methods, found that ship speed has a significant impact on local ice loads [22]. The ISO 19906 standard [23] provides some guidance in the assessment of local ice pressure; however, its methods and parameter selection still have limitations in practical applications.
In summary, recent years have seen numerous studies on the relationship between local ice pressure and local contact area, based on numerical simulations and full-scale measurements. These studies include the distribution characteristics of high-pressure areas and the influence of various factors on local ice pressure, resulting in calculation methods for local ice pressure under single-factor or dual-factor conditions. However, there is a lack of research that analyzes the failure mechanism and the conditions under which the maximum local ice pressure occurs, particularly focusing on the regularity of changes in local ice pressure caused by variations in ice speed and ice thickness.
In recent years, many scholars have conducted extensive ice load research based on field prototype testing, model testing, numerical simulation, and other methods [24,25,26,27]. Field monitoring can obtain real ice load data, which has good reliability; however, it is difficult to analyze the influence of various parameters finely due to the impact of natural conditions in actual sea ice conditions [28]. Numerical simulations can model various conditions in a relatively short time and avoid some uncertainties present in field measurements. However, the accuracy of the simulation results depends on the precision of input parameters, and the random nature of defects within sea ice introduces some errors in the outcomes [27,29]. Model testing, as a research method, can precisely control experimental conditions, simulate the interaction between sea ice and structures, and intuitively observe the process of ice load application, providing verification for theoretical analysis and prototype experiments.
To clarify the main factors influencing the magnitude of local ice pressure, this study conducted research on the interaction between sea ice and structures under different conditions based on model tests. By collecting local ice pressure data, this study provides an in-depth analysis of the conditions under which maximum local ice pressure occurs and investigates the regularity of changes in local ice pressure caused by load speed and ice thickness. This research offers valuable data references for ice-resistant design in polar marine engineering.

2. Model Tests

2.1. Sea Ice Loading Model Test

This study investigates the factors influencing local ice pressure amplitude based on the ice loading device in the low-temperature environment laboratory of Dalian University of Technology.
The interaction between ice and structures in model tests can be categorized into active and passive loading methods. Passive loading involves driving the structure against a stationary ice sheet or large iceberg, similar to ice–ship interactions. Active loading, on the other hand, uses hydraulic actuators to push the ice against the structure, making it more suitable for studying the interaction between fixed structures and ice.
The model test apparatus for the interaction between sea ice and vertical structures, as shown in Figure 2, is located in a low-temperature laboratory where the lowest controlled temperature is −28 °C with a control accuracy of ±0.1 °C. The test procedures is as follows:
  • Model Ice Preparation: To obtain low-strength sea ice that meets the experimental requirements, high-salinity seawater was prepared using sea salt within the loading device. The ice sheet froze from top to bottom, forming columnar ice. The laboratory temperature was set to −20 °C for rapid freezing, followed by a temperature recovery process to control the internal temperature of the sea ice.
  • Sensor Installation: After calibrating thin-film pressure transducer, they are installed on the model structure.
  • Test Loading: Different loading speeds are set, and the support platform pushes the sea ice at the corresponding speed to interact with the vertical steel plate (vertical structure model). Loading continues to a specific displacement before automatic unloading and returning to the initial position.
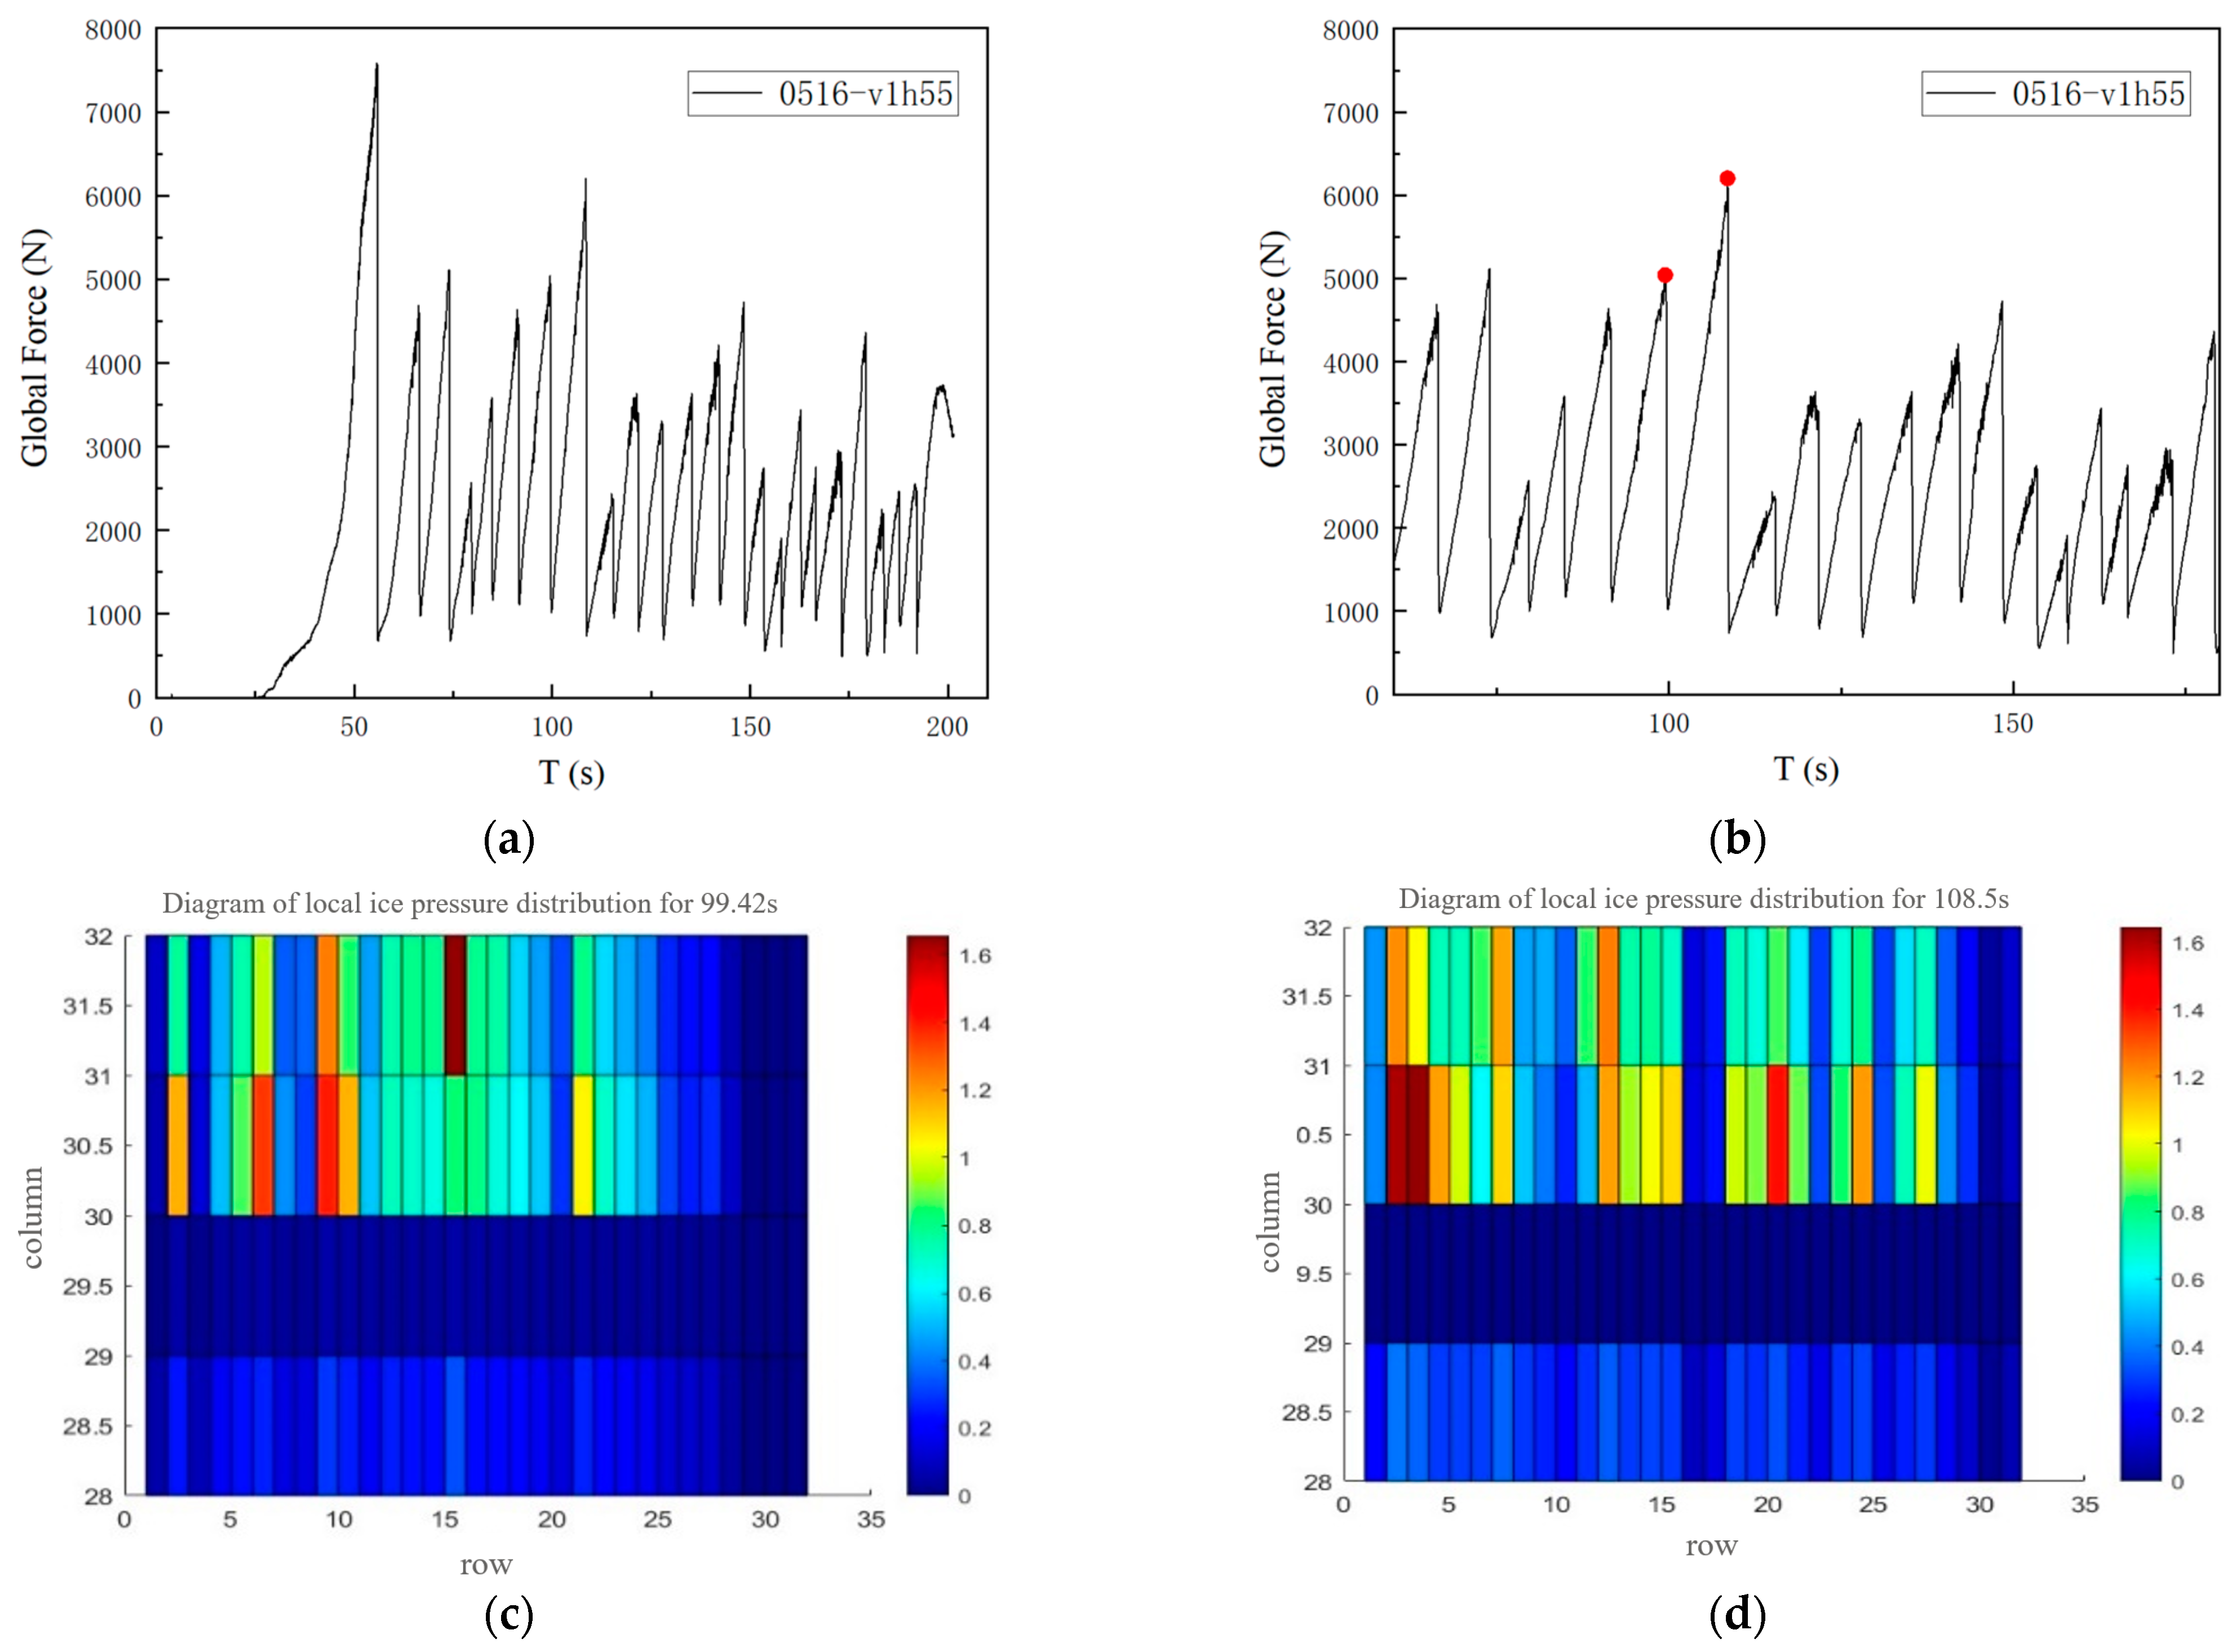
  • Data Extraction: Using imaging software and a MATLAB-based data processing program (MATLAB R2021a (9.10)), the experimental data were processed to obtain time-history graphs of local and overall ice forces at each moment. The peak points of each force measurement unit were extracted, and the relevant data were exported.

2.2. Test Data

The ice failure mode is mainly influenced by ice speed. Different loading speeds and varying thicknesses of model ice were used to study local ice pressure under different failure modes. The test conditions and main parameters are shown in Table 1.
A thin-film pressure transducer installed on the outside of the structure measured and recorded the local ice pressure data during the ice-structure interaction process. The sensors divided the structure’s width into 32 columns, with each 10 mm along the ice thickness direction constituting a collection unit, allowing for the collection of local ice pressure data across 32 × h local regions. The local ice pressure data were analyzed using a MATLAB-based data processing program.
During the preparation of the model ice, the front end was constrained by a smooth baffle, freezing into a relatively flat and smooth surface. As a result, at the initial stage of loading, the flat ice sheet came into full contact with the structure, causing the ice sheet to break simultaneously. This led to the first peak value being significantly higher than subsequent breaking peaks, as shown in Figure 3a. With continued loading, the ice sheet’s section was no longer flat, and the ice force peak gradually decreased. Excluding the first peak in the initial loading stage, the remaining data was selected for analysis. The local ice pressure data at the global ice force peak (as shown in Figure 3b, where the red dot represents the selected ice force peak moment) was used to create local ice force distribution maps (as shown in Figure 3c,d). The results indicate that the locations of extreme local ice pressures (the brown areas in Figure 3c,d) varied across different global ice force peaks, with larger local ice pressure areas distributed more randomly. Extreme local ice pressures could occur at various locations across the contact surface.

3. Study on Factors Influencing Local Ice Pressure Amplitude

3.1. Analysis of the Timing of Local Ice Pressure Occurrence

To investigate the relationship between the timing of extreme local ice pressure and the global ice force loading-unloading cycle, the extreme local ice pressure data at each moment were extracted and compared with the global ice force curve. Considering that the ice failure mode varies with different loading rates, the timing of the maximum local ice pressure p T max within one global ice force loading cycle differs. To account for both ductile and brittle failure modes of sea ice, loading rates of 1 mm/s, 4 mm/s, 7 mm/s, 10 mm/s, and 15 mm/s were set in this study. As shown in Figure 4a, the red dashed box represents a loading cycle, and the red cross marks the moment when p T max occurs. The probability of p T max occurring at different stages (loading stage, peak moment, unloading stage) of the ice force variation is presented in Table 2. From Figure 4a–c, it can be seen that when ductile failure dominates, the waveform is a rectangular wave, and p T max has about a 50% probability of occurring at the peak moment of the global ice force, with the remainder occurring mainly in the loading stage, particularly as the global ice force approaches its peak. In contrast, as shown in Figure 4d, when brittle failure dominates, the waveform is a triangular wave, and p T max has about a 25% probability of occurring at the peak moment, with the remainder mainly occurring in the loading or unloading stages.
The above analysis shows that during the unloading stage of ductile ice failure, localized loading across the contact surface is rare. However, during the loading and unloading stages of brittle ice failure, there is a certain amount of localized loading across the contact surface, leading to a difference in the distribution probability of p T max across different stages under high and low ice speeds. Nonetheless, p T max occurring at the global ice force peak poses the greatest threat to the structure. Therefore, this study selects the moment of the global ice force peak to study local ice pressure amplitude.
The region where the ice pressure exceeds one time the uniaxial compressive strength is defined as the local high-pressure zone. The location of the local ice pressure is within the local region [1,30].
Multiple global ice force peak moments were selected; the local area ratio q A at each moment is defined as the ratio of the total area a of the local region to the nominal contact area A. The maximum local area ratio q A max at the peak moment of the total ice force under each condition is calculated, and the results are shown in Figure 5. The results indicate that under all conditions, the ratio q A max of the high-pressure local area is less than 0.375, which means that the area of the local region should not exceed 37.5% of the nominal contact area.

3.2. Influence of Loading Speed on Local Ice Pressure Amplitude

To study the influence of loading speed on local ice pressure amplitude, four loading speeds of 1 mm/s, 4 mm/s, 7 mm/s, and 15 mm/s were selected for analysis. For each scenario, the local ice pressure data at three global ice force peak moments was considered. The local region size was defined by taking continuous 1 × n units (n = 1, 2, 4, 8) in a single row, with the maximum average ice pressure in the local region representing the local ice pressure amplitude p L max . The maximum value of the average local ice pressure over the nominal contact area represents the local ice pressure amplitude. By normalizing the local ice pressure amplitude, the ratio of the local ice pressure amplitude to the average ice pressure over the nominal contact area at the corresponding moment is defined as the local ice pressure amplitude ratio, calculated as follows:
R p = p L max p T ave ,
where p L max is the local ice pressure amplitude, p T ave is the average ice pressure over the nominal contact area at the corresponding moment, and Rp is the local ice pressure amplitude ratio.
After normalization, the relationship between the local ice pressure ratio (Rp) and different loading speeds is shown in Figure 6. The results indicate that Rp generally decreases as the loading speed increases, with a more significant drop when the loading speed is ≤7 mm/s. However, when the loading speed exceeds 7 mm/s, the decline becomes relatively gradual. The primary reason for this behavior is that at lower loading speeds (≤7 mm/s), the ice failure mode is ductile, resulting in relatively smooth fracture surfaces. Multiple regions of the ice undergo simultaneous compressive failure, leading to higher synchronicity in local ice pressure. In this case, changes in loading speed significantly affect the simultaneous failure characteristics of local ice pressure, causing a noticeable decrease in Rp. Conversely, at higher loading speeds (≥7 mm/s), the ice failure mode shifts to brittle failure, producing uneven fracture surfaces. The synchronicity of local ice pressure is reduced, and more non-simultaneous compressive failures occur in the local regions. The ice failure process becomes more random, and changes in loading speed have a lesser impact on the simultaneity of local failure, resulting in a more gradual decrease in Rp.

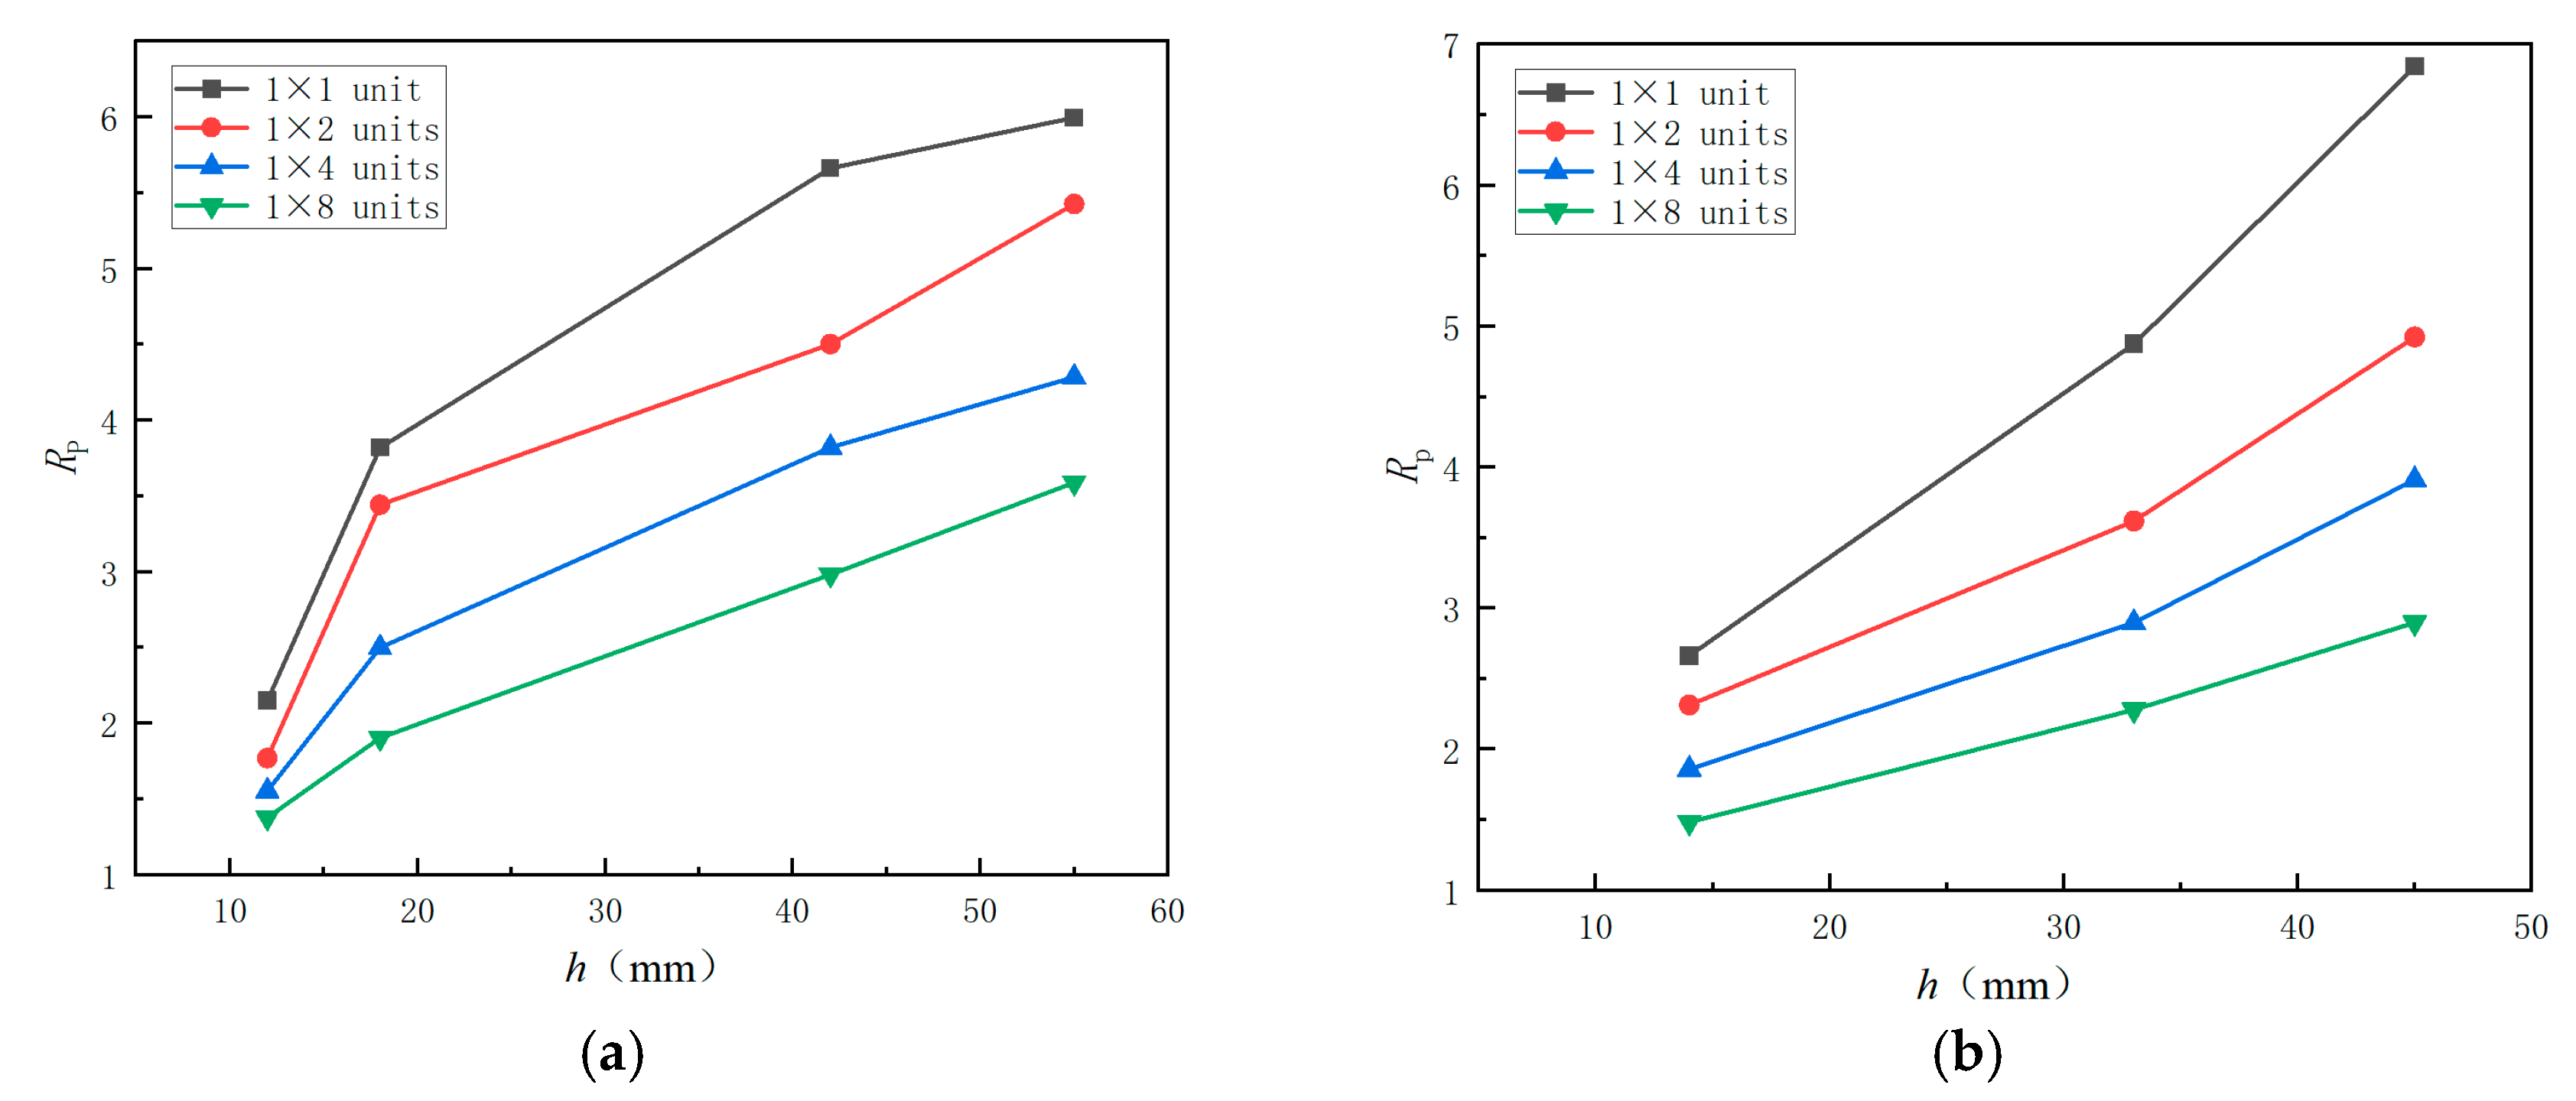
3.3. Influence of Ice Thickness on Local Ice Pressure Amplitude

According to the above analysis, an increase in loading speed leads to a decrease in the local ice pressure amplitude ratio. To study the impact of ice thickness on local ice pressure amplitude, this study analyzes a total of seven conditions under low and high loading speeds. The selected conditions include a constant loading speed of 1 mm/s with four different ice thicknesses (12 mm, 18 mm, 42 mm, and 55 mm), as well as a loading speed of 10 mm/s with three different ice thicknesses (14 mm, 33 mm, and 45 mm).
As shown in Figure 7, the local ice pressure amplitude increases with the increase in ice sheet thickness. This occurs because, during the fracturing of the ice sheet, the maximum average ice pressure in the local region typically appears in the middle layer of the ice sheet. Since the middle layer is in a triaxial stress state, it maintains a higher compressive strength, making it relatively more resistant to failure. As the ice sheet thickness increases, the boundary constraints on the middle layer strengthen, allowing the local region to bear greater loads, leading to an increase in the local ice pressure amplitude, and a more pronounced rise in the pressure ratio (Rp).
Compared to high loading speeds, the upward trend of Rp with increasing ice thickness is more significant at low loading speeds, consistent with the results mentioned earlier. This is because, at a low loading speed of v = 1 mm/s, the ice failure mode is ductile, leading to simultaneous failures; whereas, at a high loading speed of v = 10 mm/s, the ice failure mode is brittle, resulting in non-simultaneous failures.

4. Study on the Influencing Factors of Local Ice Pressure–Area Relationship

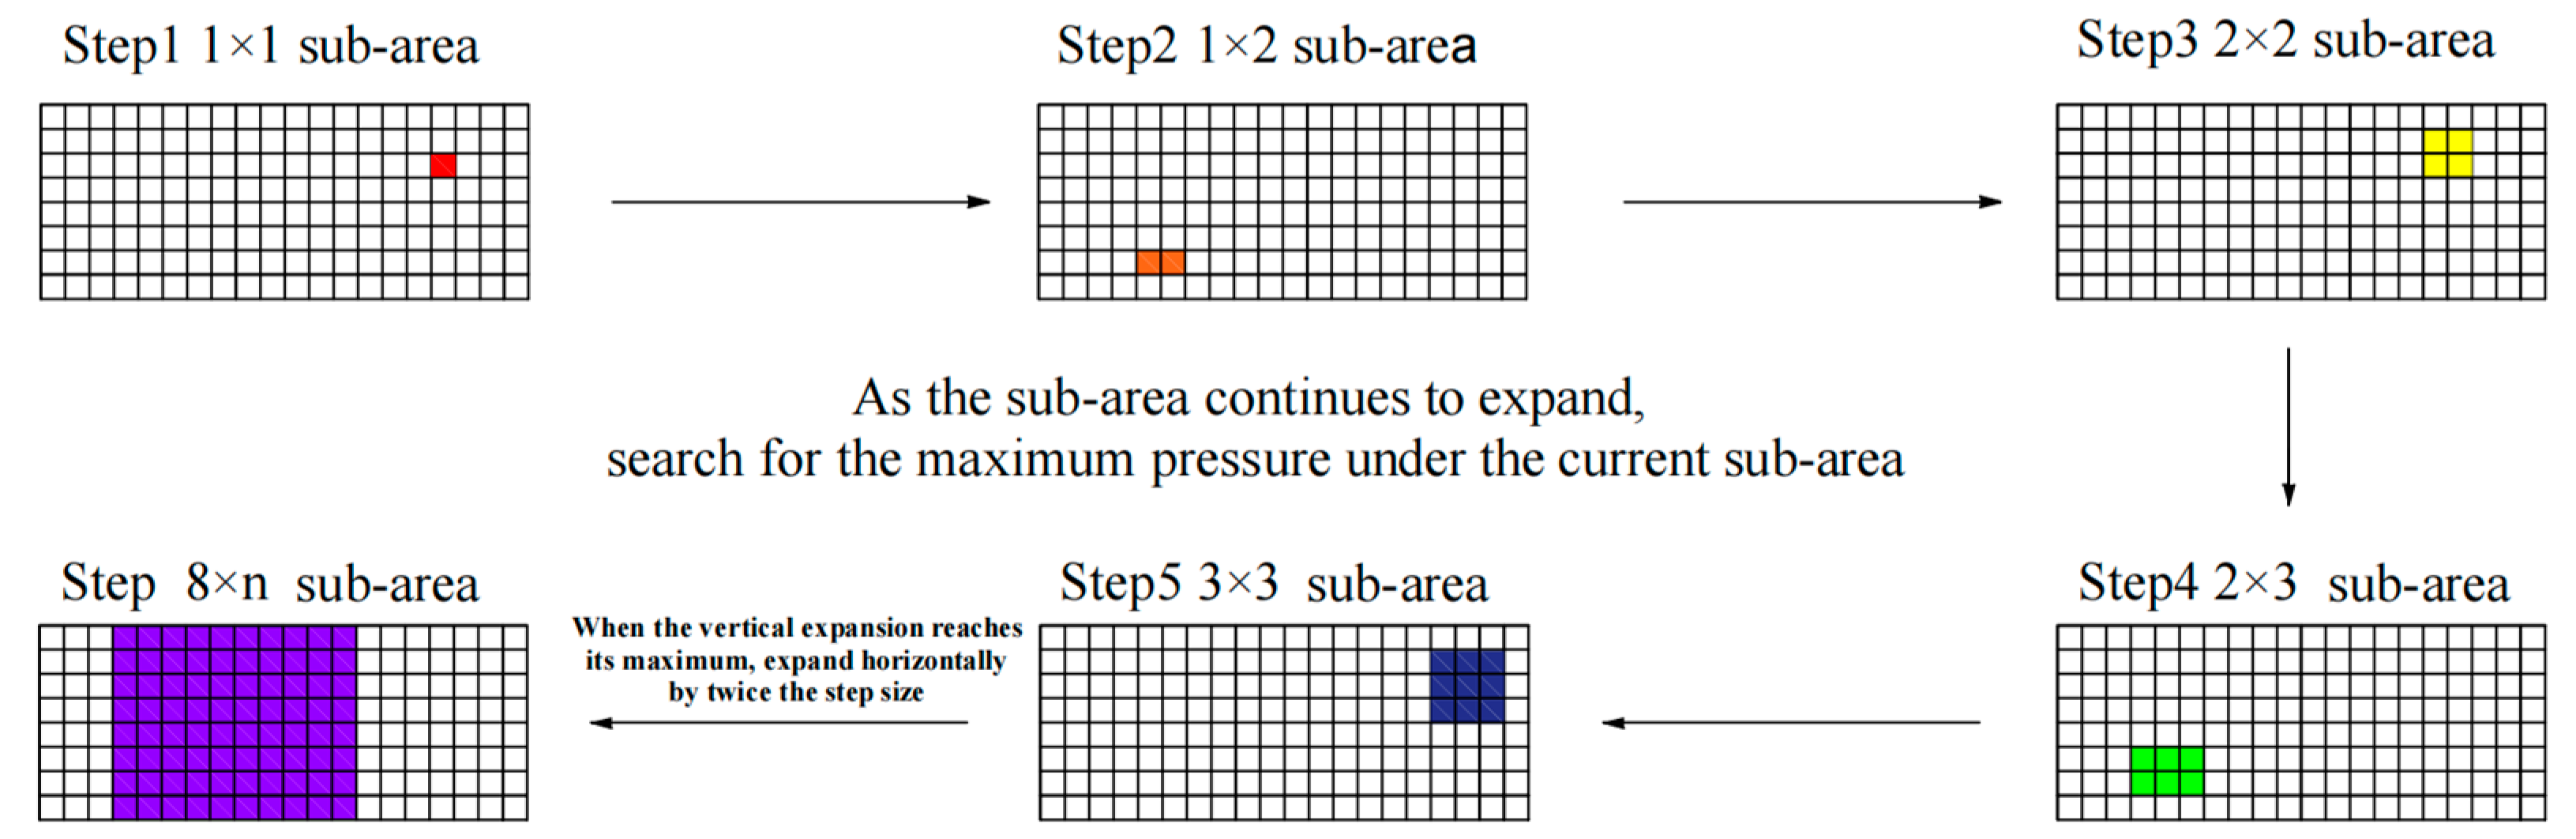
4.1. Local Area Calculation

In the study of the relationship between local ice pressure and local area, there is currently no unified standard. Daley [31], while analyzing the measurement data from the “Polar Sea”, utilized a method that starts from the point of highest pressure and gradually expands the local area within a continuous region to investigate the local ice pressure–area relationship. This method is suitable for handling a single high-pressure area but is not applicable when multiple high-pressure areas are distributed separately. Kim [1,32] proposed the contour-averaging method (CAM) in his stepped crushing test, as shown in Figure 8. This method starts from the point of highest pressure, with the average pressure in area S1 as the starting point of the curve. The second point is the average pressure in areas S1 and S2, and it progressively includes the average pressure of adjacent areas until the entire contact area is covered. However, this method is primarily suitable for studying local ice pressure in cone-shaped ice compression tests.
Based on the analysis methods mentioned above, this study proposes a new method for selecting local areas—the continuous maximum method (CMM), as shown in Figure 9.
The CMM method begins with the highest pressure value in the smallest unit, first expanding the subarea laterally with a specific step size and selecting the maximum pressure value under the expanded subarea within the nominal contact area. Then, the subarea is expanded vertically with the same step size, and the maximum pressure value within the expanded subarea is selected again. If the vertical expansion exceeds the nominal contact area, the vertical expansion stops, and the lateral expansion continues with double the step size. Figure 9 details the steps of the CMM method. The CMM method ensures that each selected subarea is the maximum value under the corresponding area within the entire pressure sensor area, while maintaining the continuity of the area, ensuring that the pressure–area curve shows a decreasing trend.

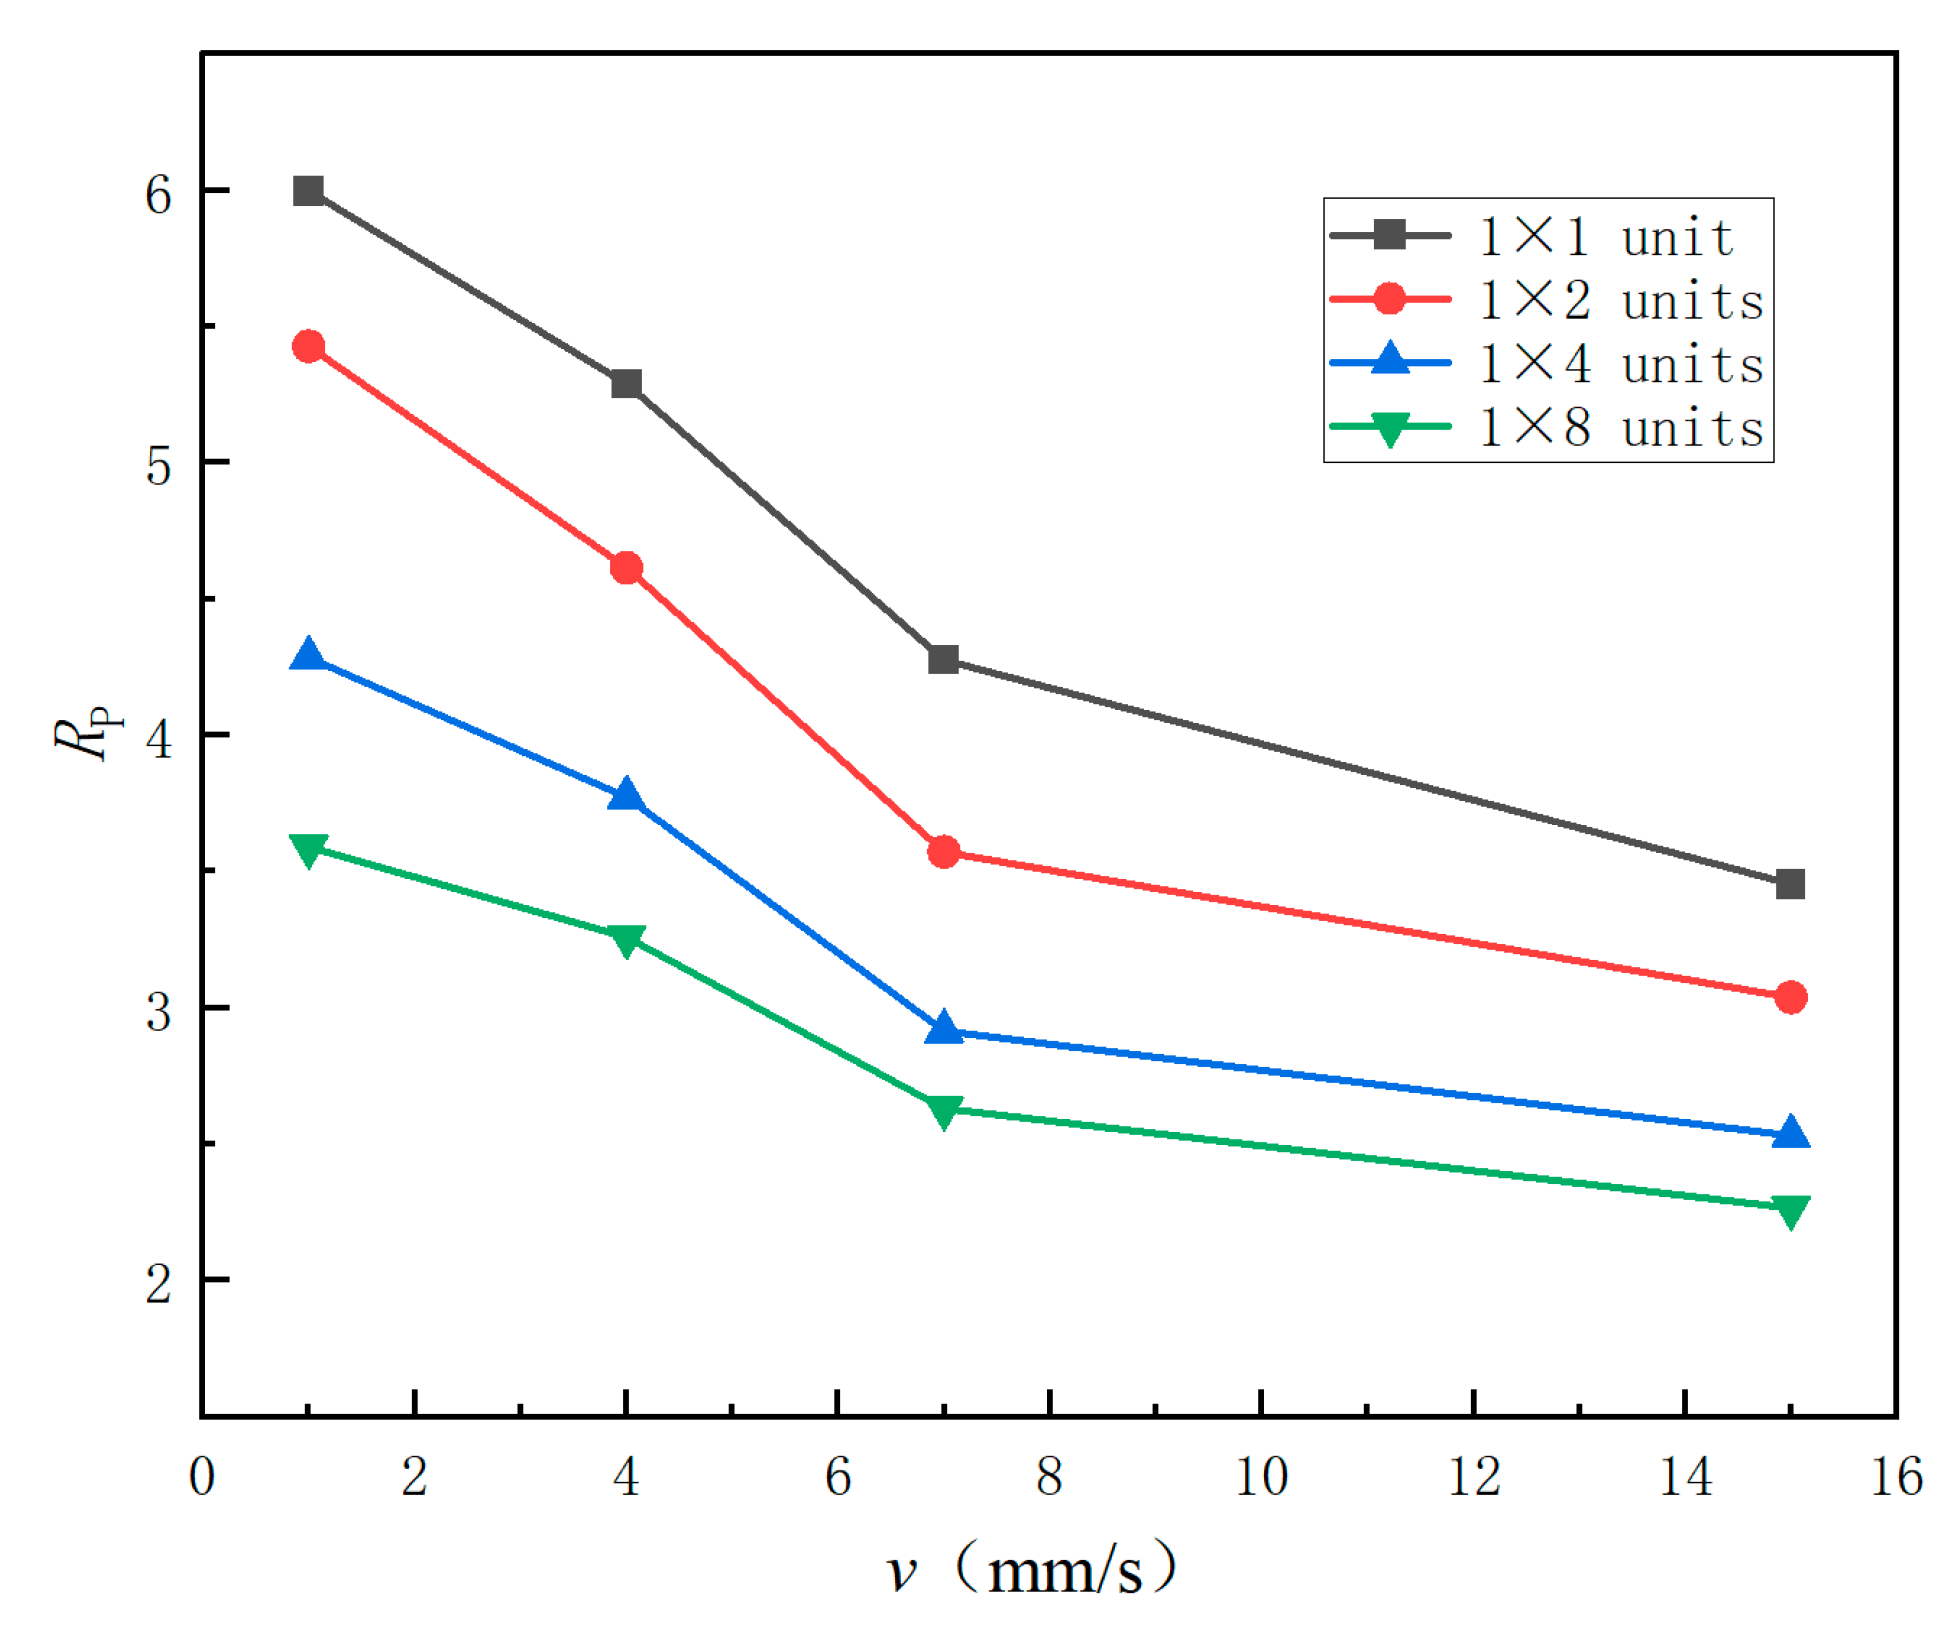
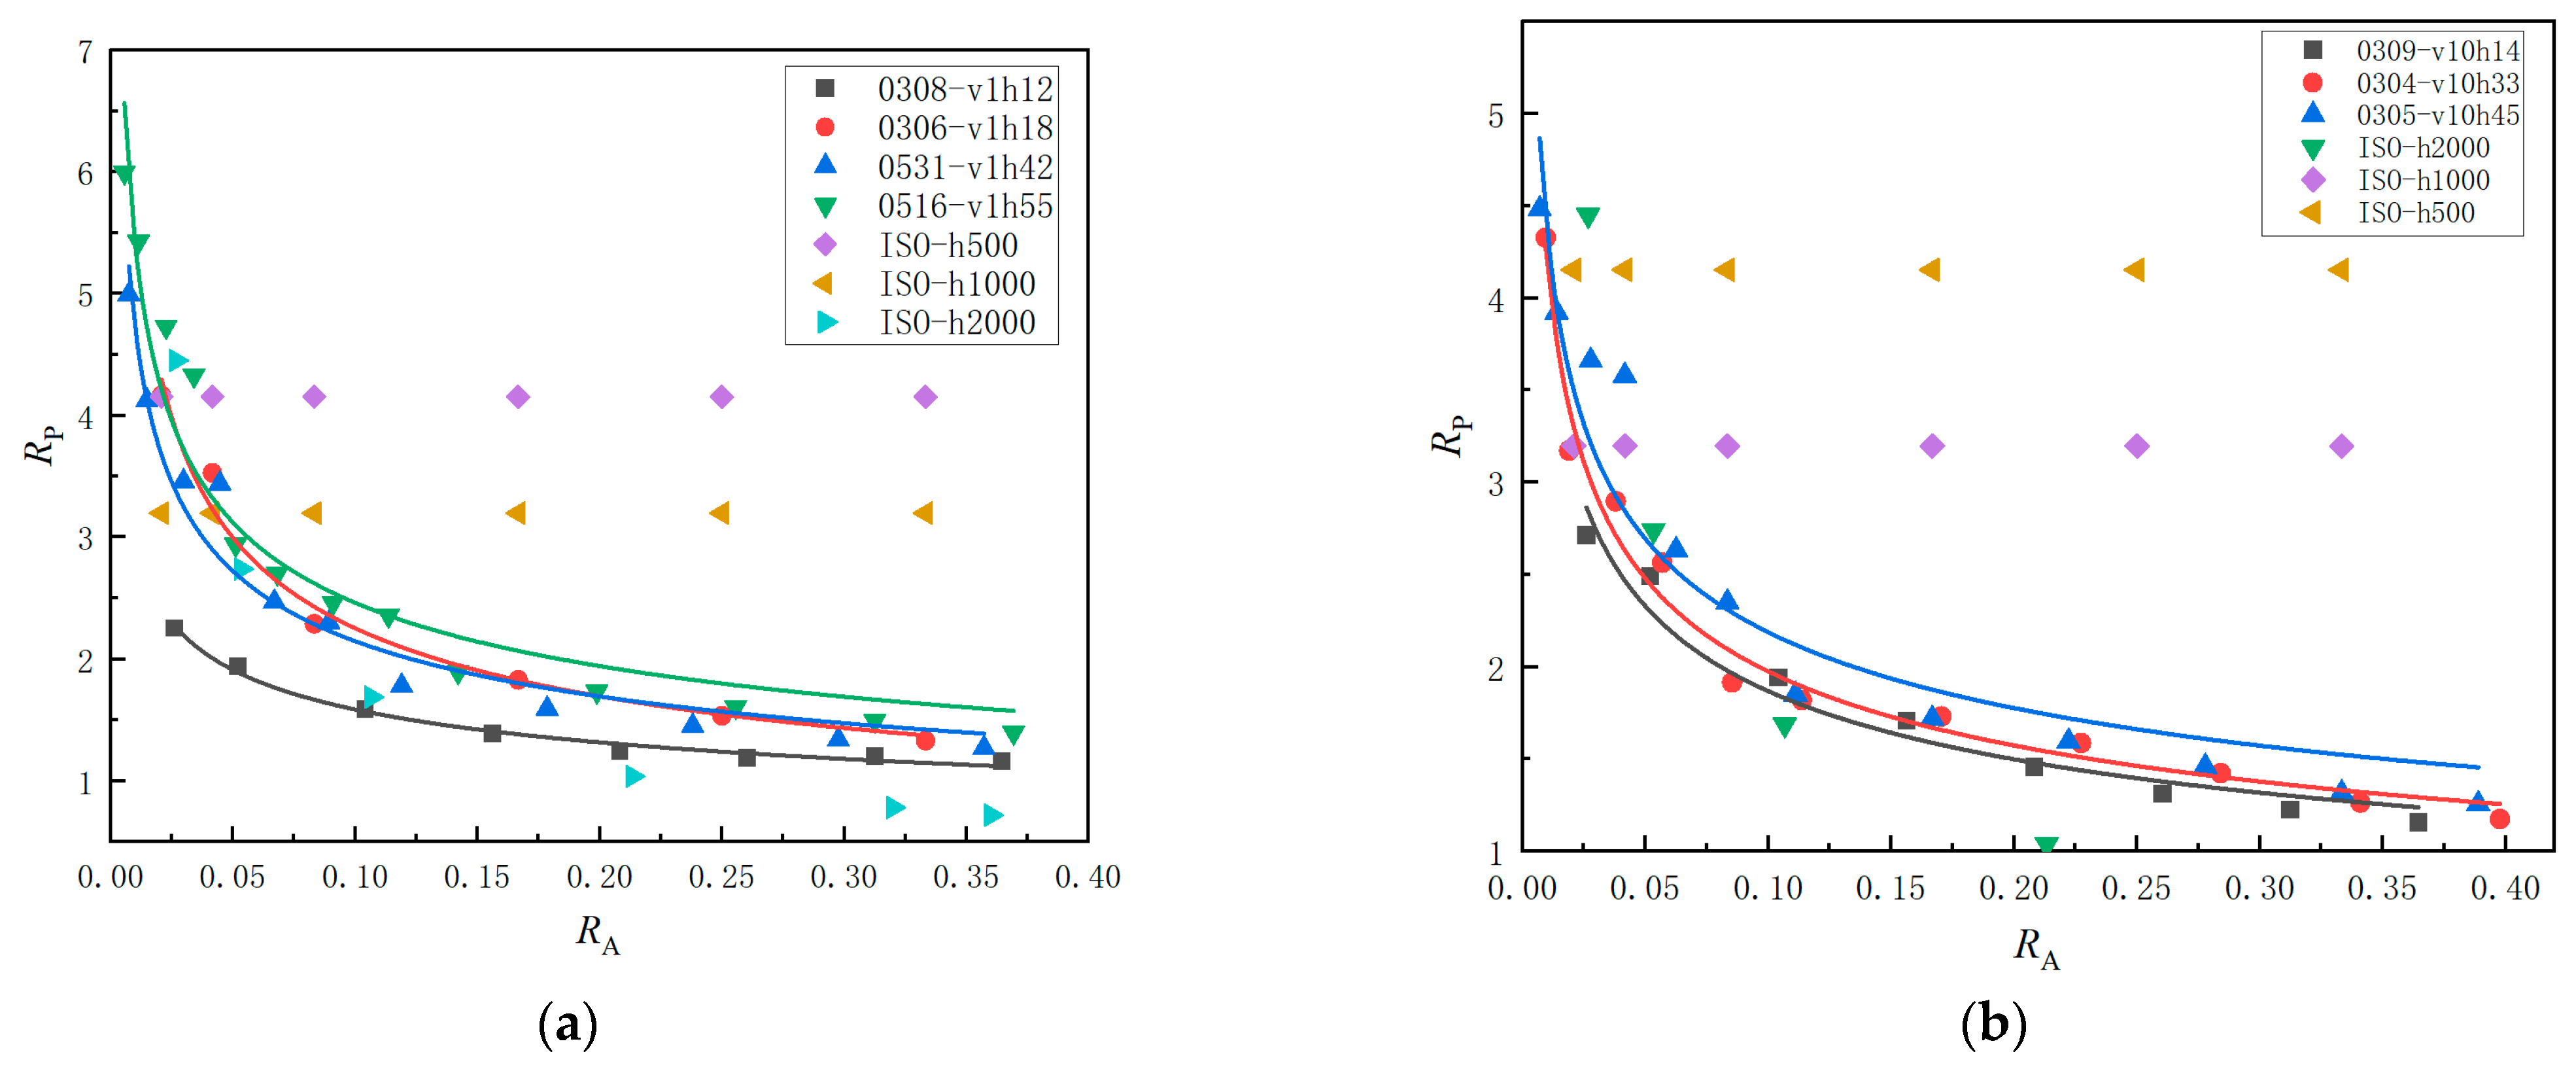
4.2. Factors Affecting the Local Ice Pressure–Area Relationship

Existing studies suggest that local ice pressure and area generally follow a power law relationship, which can be expressed as p = kA−α.
The above studies indicate that the magnitude of local ice pressure is influenced by loading speed and ice thickness. To further analyze the impact of these factors on the local ice pressure–area relationship, this study selected different combinations of loading speed and ice thickness for analysis. Four sets of ice thickness (12 mm, 18 mm, 42 mm, 55 mm) were chosen for a loading speed of 1 mm/s, and three sets of ice thickness (14 mm, 33 mm, 45 mm) were selected for a loading speed of 10 mm/s, making a total of seven conditions.
Three moments of peak global ice force were selected, and the CMM method was used to expand the local area and obtain the maximum average ice pressure p L max under different local areas. The normalized local ice pressure amplitude ratio Rp was calculated. Simultaneously, the ratio of the local area a to the nominal contact area A was calculated to obtain the normalized area ratio RA, ensuring that RA is less than 0.4.
In the model tests, under two different ice velocities (1 mm/s, 10 mm/s), Rp increased with the increase in ice thickness, and the Rp–curves generally showed a trend of first decreasing and then stabilizing. The power law function-fitting formula of the RpRA curve under different ice thicknesses is shown in Equation (2):
At three peak moments of the total ice force, the CMM method was used to expand the local area and obtain the maximum average ice pressure p L max for different local area sizes. The normalized local ice pressure amplitude ratio Rp was calculated, along with the normalized local area ratio RA using the ratio of the local area to the nominal contact area, ensuring that RA is less than 0.4.
In the model tests, under two different loading speeds (1 mm/s and 10 mm/s), Rp increased with the increase in ice thickness, and the RpRA curves generally showed a trend of first decreasing and then stabilizing. The power law function-fitting formula for the RpRA curves under different ice thicknesses is shown in Equation (2):
R p   =   k R A α ,
where k is the coefficient, α is the exponent of the power law function, RA is the local area ratio, and Rp is the local ice pressure amplitude ratio.
The fitted parameters of the power law fitting curve are shown in Table 3, where the coefficient k increases with the increase in ice thickness. This is because under large ice thickness conditions, the central part of the ice sheet is more constrained, leading to higher local ice pressure. Under high loading speed conditions, the range of variation of the coefficient k is smaller with increasing ice thickness; under low-loading-speed conditions, the range of variation of k is larger compared to high-loading-speed conditions. This is because, under low loading speed, sea ice undergoes ductile failure, with better synchronization during the failure process, resulting in a wider range of local ice pressure variation.
The ISO 19906 standard [23] provides the following formula for calculating local ice pressure.
Based on the ice thickness, there are two formulae for calculating local ice pressure [25].
(1) Formula for calculating ice pressure over the full ice thickness:
p F = 2.35 h 0.50 ,
where pF is the average ice pressure over the full ice thickness, h is the ice thickness; when h > 0.35 m, this formula is used; and when h ≤ 0.35 m, pF = 4.0 MPa. Ice pressure is mainly distributed in the central region of the ice sheet, and the local ice pressure can be calculated using Equation (3):
p L   = γ L p F ,
where pL is the local ice pressure, and γL is taken as 2.5.
(2) If the ice thickness is greater than 1.5 m, the formula for calculating local ice pressure is as follows:
p L   = 7.40 A 0.70 ,
where A is the local area; and when A ≤ 10 m², this formula is used; and when A > 10 m², pL = 1.48 MPa.
The local ice pressure pL calculated based on the ISO 19906 standard [23] is divided by the global effective ice pressure pG to obtain the pressure ratio Rp. The global effective ice pressure is calculated as follows [25]:
p G = C R h h 1 n w h m + f AR ,
f AR = e w 3 h 1 + 5 h w ,
where pG is the global effective ice pressure; C R is the strength of the ice; w is the width of the structure in meters; h is the sea ice thickness in meters; h1 is the reference ice thickness, h1 = 1.0; m is an empirical coefficient, taken as −0.16; n is an empirical coefficient, when h < 1.0 m, n = −0.5 + h/5; when h ≥ 1.0 m, n = −0.3. This formula is applicable to rigid structures with a width-to-thickness ratio w/h > 1. The standard recommends that the ice strength σ c be taken as 2.8 MPa for Arctic regions, 2.4 MPa for sub-Arctic regions, and 1.8 MPa for temperate ice zones.
The local ice pressure amplitude data from the tests were compared with the method recommended by the standards (as shown in Figure 10). The normalized RARp curves obtained from the model test data and the ISO 19906 standard [23] calculations under different ice thicknesses are shown in Figure 10. The comparison reveals that the ISO 19906 standard [23] maintains a constant pressure ratio Rp under conditions where the ice thickness is less than 1.5 m (ice thicknesses of 0.5 m and 1 m), considering primarily the effect of ice thickness while ignoring the impact of local width and loading speed. For conditions with an ice thickness greater than 1.5 m (ice thickness of 2 m), the pressure ratio Rp calculation results are the same under two different ice velocities, indicating that the ISO 19906 standard [23] fails to consider the impact of loading speed adequately. To address the inadequacies of the ISO 19906 standard [23] in assessing local area and fully considering the impact of loading speed when calculating local ice pressure, this study conducts an in-depth study based on model test data.

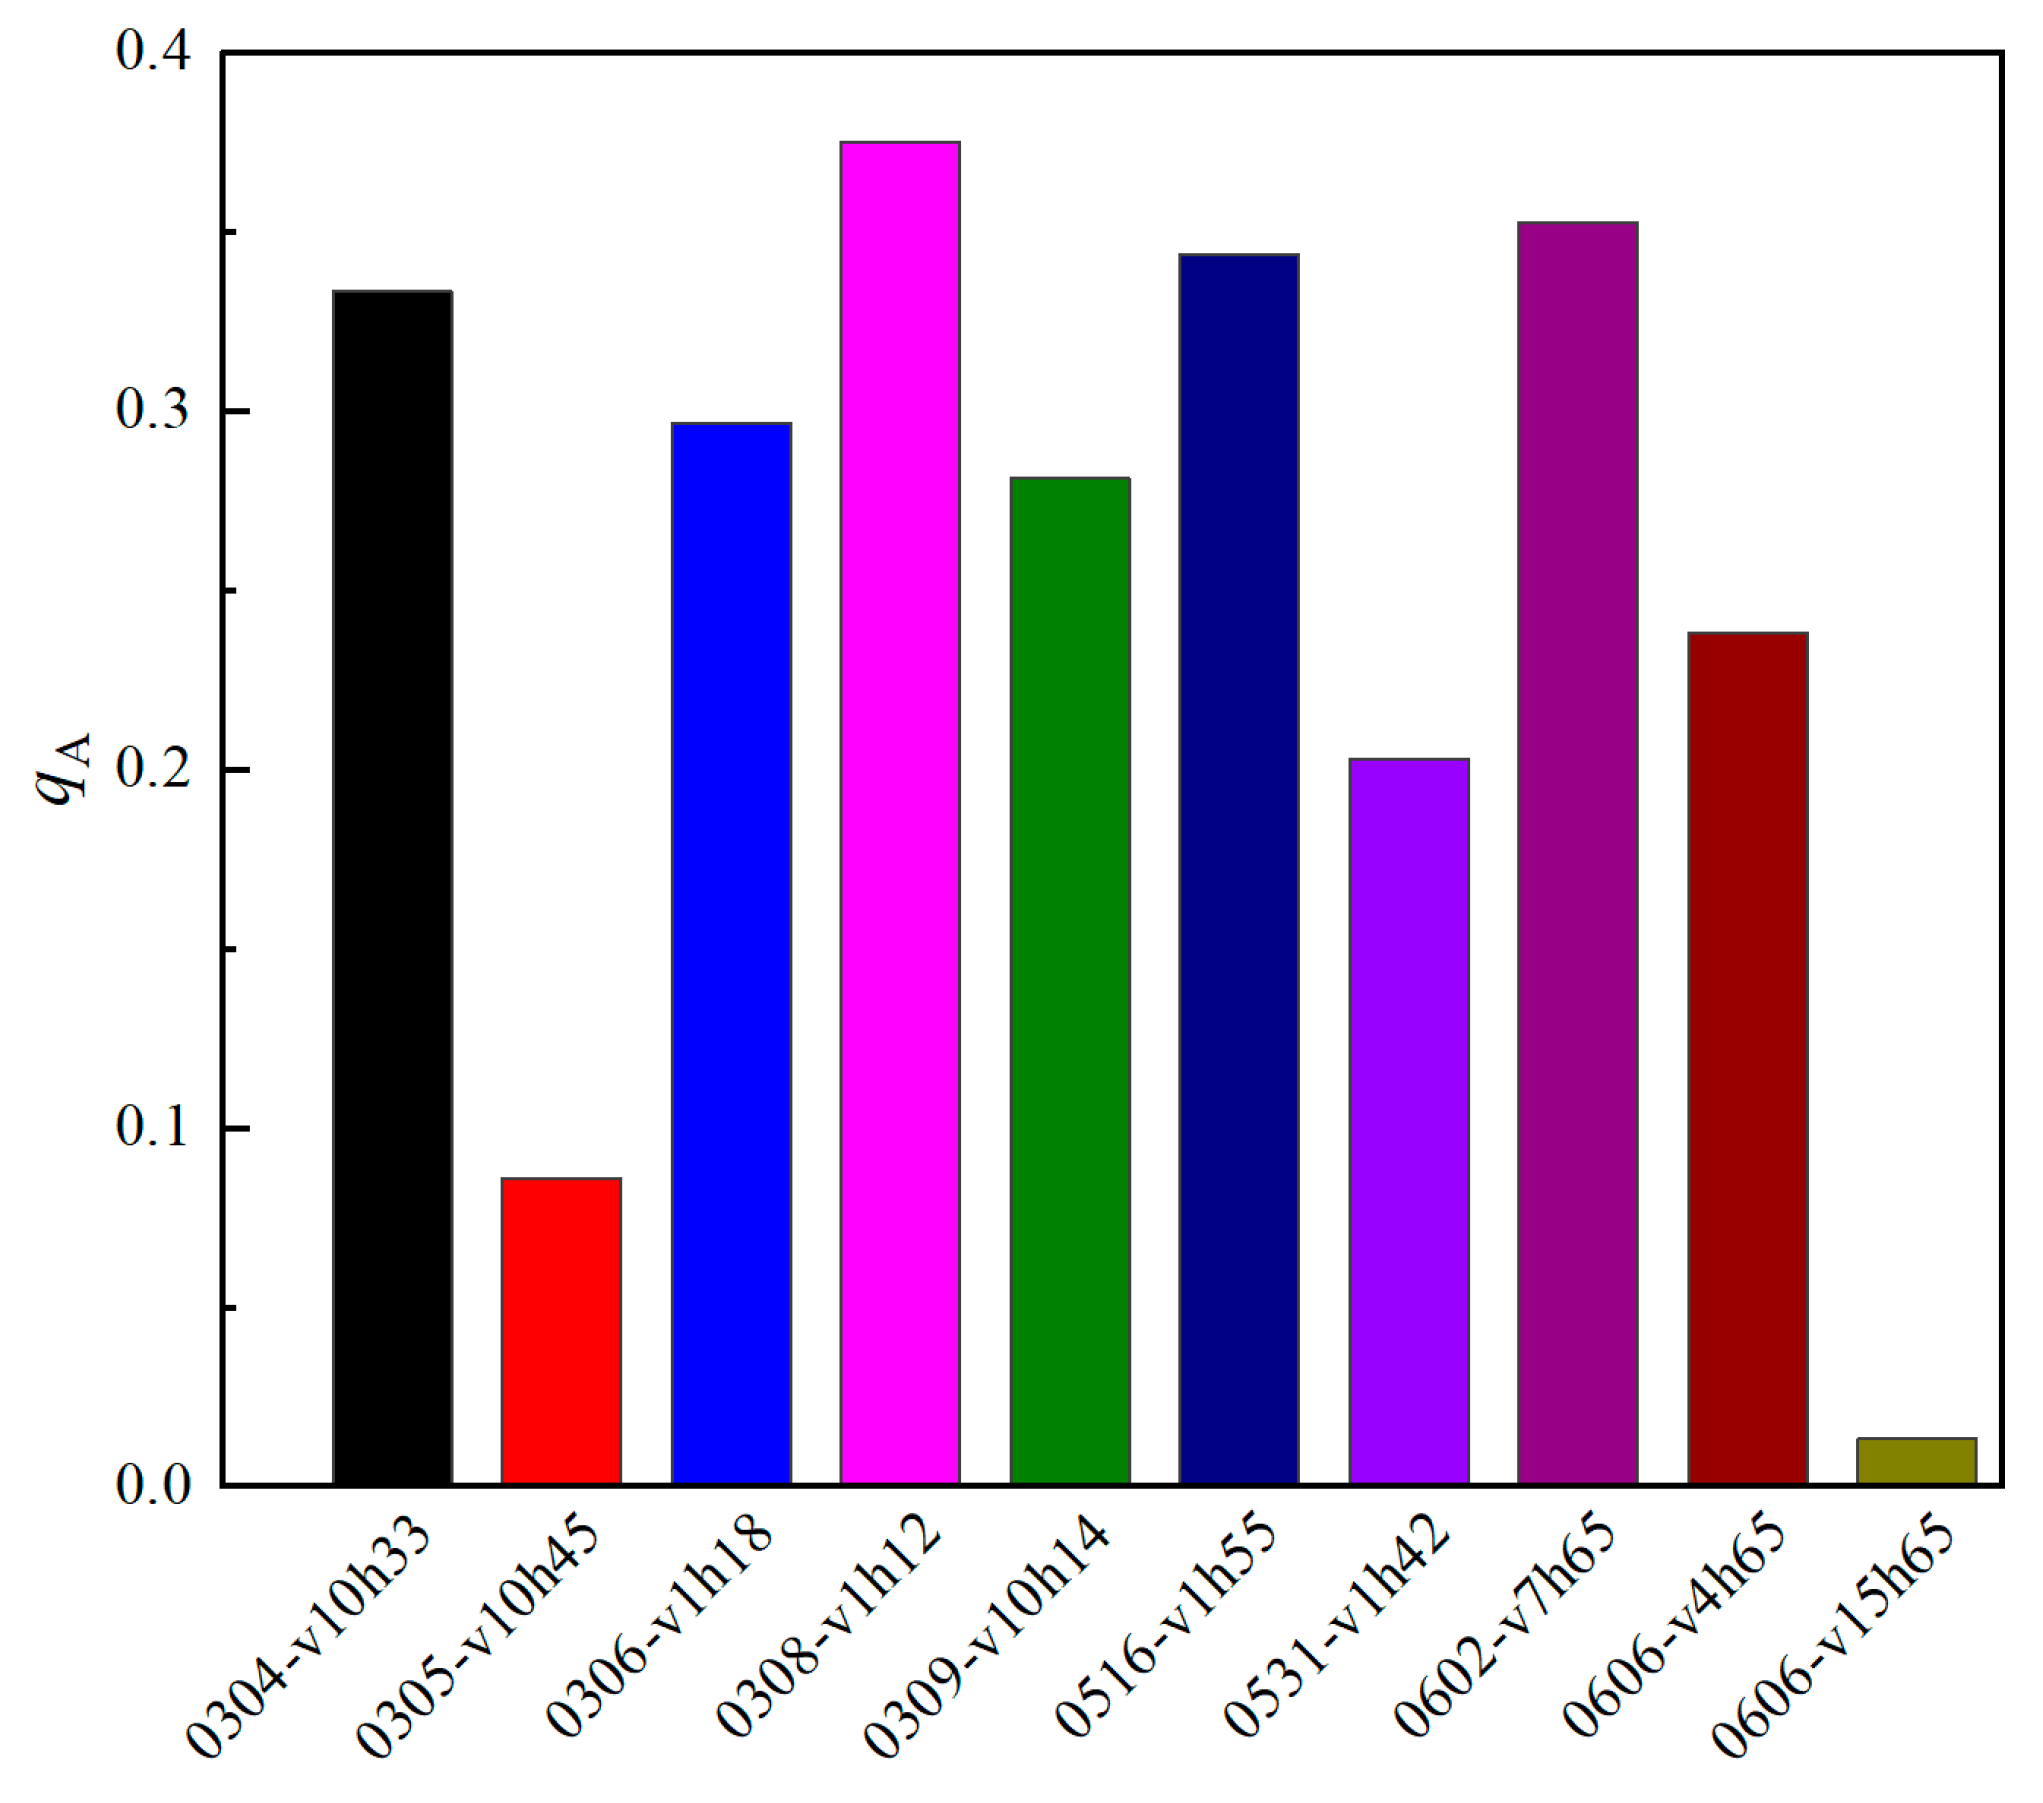
4.3. Distribution Pattern of Local Ice Pressure–Area Curve Coefficients

From the above analysis, it can be seen that both ice thickness and loading speed affect the pressure–area curve. This study investigates the relationship between local ice pressure–area curves and ice thickness under two loading speeds: slow (v = 1 mm/s) and fast (v = 10 mm/s).
The two loading speeds represent primarily ductile failure (1 mm/s) and primarily brittle failure (10 mm/s) of the ice sheet, respectively. As noted from Table 3, the exponent α fluctuates within the ranges of −0.411 to −0.269 and −0.327 to −0.300 under the two loading speeds. To analyze the effect of the thickness-to-width ratio on ice pressure, the average values of these two intervals, −0.341 and −0.315, were taken as the fixed exponent α. The coefficients k for different thickness-to-width ratios were then calculated, with specific parameters shown in Table 4.
Analysis of Figure 11 shows that under both failure modes, there is a linear relationship between the local ice pressure–area curve and the thickness-to-width ratio. The coefficient k of the local ice pressure–area relationship increases with the ice thickness, and the mathematical expression can be represented as follows:
(1) For ductile failure:
k l = 1.912 R h + 0.784 ;
(2) For brittle failure:
k h = 1.354 R h + 0.841 ,
where Rh represents the thickness-to-width ratio, k l is the function of thickness-to-width ratio under ductile failure, and k h is the function under brittle failure.
Further analysis reveals that the slope under ductile failure of the ice sheet is greater than that under brittle failure. The local ice pressure amplitude is more significantly influenced by ice thickness in the case of ductile failure. Under conditions of greater ice thickness, the constraint effect on the center of the ice sheet is stronger, leading to higher local ice pressure. This study indicates that the power law relationship between local ice pressure and area is affected by ice thickness and sea ice failure mode. A single local ice pressure–area calculation model cannot accurately represent the local ice pressure magnitude under different conditions. Therefore, the effects of ice thickness and loading speed should be considered comprehensively.

5. Discussion

Local ice pressure data obtained from indoor model tests and tactile pressure sensors were used to investigate the amplitude of local ice pressure and its influencing factors thoroughly. Due to the characteristics of sea ice failure, the timing of the maximum local ice pressure differs under different failure modes. Only some of the maximum local ice pressure occur at the peak of the overall ice force. When the ice sheet experiences ductile failure, there is an approximately 50% chance that the maximum local ice pressure occurs at the peak of the overall ice force. In contrast, when the ice sheet experiences brittle failure, the probability is about 25%. The threat to the structure is greatest when the local ice pressure occurs at the peak of the overall ice force. Although the occurrence probability under brittle failure is lower, the maximum local ice pressure in this condition should be considered in structural design. The overall ice force on the structure is primarily contributed by high-pressure zones, which have a small proportion of the total contact area. Johnston et al. [30] found that the critical area for local ice pressure (i.e., the high-pressure zone) occupies only 10% of the total contact area, and the ISO 19906 standard [23] suggests that the distribution of local ice pressure is within 0.4 times the ice thickness from the centerline of the ice thickness. The distribution area of the high-pressure zone is related to the selected threshold coefficient. Using the uniaxial compression strength of the ice sheet as the threshold coefficient, it was found that the proportion of the high-pressure zone’s distribution area to the total contact area is less than 37.5% under all conditions, with the proportion under brittle failure being smaller than that under ductile failure.
There is a power law relationship between local ice pressure amplitude and local area. Masterson et al. [10] developed local ice pressure–area power law curves with different parameters based on field measurement data. Analysis of the local ice pressure test data revealed that ice thickness and the failure mode of the ice sheet both influence the local ice pressure–area curve. Based on the model test data analyzed in this study, it was found that there is a linear relationship between the power law coefficient of local ice pressure–area and the thickness-to-width ratio. The slope of the linear relationship differs under different failure modes of the ice sheet, primarily due to more complete contact between the ice and the structure under ductile failure. When the ice is under a triaxial stress state at the center of the ice thickness, changes in ice thickness have a more pronounced effect on the local ice pressure at the center.

6. Conclusions

Through model tests and theoretical analysis, this study conducted an in-depth study on the magnitude of local ice pressure and its influencing factors. The study found that the magnitude of local ice pressure is closely related to ice thickness and loading speed. The local ice pressure magnitude decreases with increasing loading speed and increases with increasing ice thickness, which is related to the failure mode of sea ice. From the perspective of failure mechanisms and the conditions under which the maximum local ice pressure occurs, the effects of ice thickness and loading speed on the local ice pressure-local area relationship were analyzed. A comparative analysis with the ISO 19906 standard [23] revealed certain limitations in the standard’s assessment of local region areas. The main conclusions of this study are as follows:
1. At low loading speed, there is a 50% probability that the local ice pressure extreme occurs at the peak of global ice forcel; while at high loading speed, there is only about a 25% probability that it occurs at the peak of global ice force.
2. When the ice pressure exceeds one time the uniaxial compressive strength, the proportion of the local high-pressure area q A is less than 0.4, and the local area should not exceed 40% of the nominal contact area.
3. As the loading speed decreases, the normalized local ice pressure amplitude ratio (Rp) shows a decreasing trend. When the test loading speed is ≥7 mm/s, changes in loading speed significantly impact the local ice pressure, leading to a noticeable decrease in Rp. When the test loading speed is <7 mm/s, the effect of loading speed changes on local ice pressure is minimal.
4. As ice thickness increases, the upward trend in the normalized local ice pressure amplitude ratio becomes more pronounced. This upward trend is more significant at lower loading speeds compared to higher loading speeds.
5. There is a linear relationship between the power function coefficient of local ice pressure–area and the thickness-to-width ratio. Compared to brittle failure, the local ice pressure amplitude under ductile failure of the ice plate is more significantly influenced by ice thickness.
This study is based on model test measurement data, where the test involves pushing an ice plate to interact with a rigid plate of fixed dimensions. The study analyzes the effects of loading speed and ice thickness on the characteristics of local ice pressure caused by non-simultaneous failure of the flat ice plate. The structure scale considered in the test is fixed, and the focus is on investigating the regularity of factors influencing the local ice pressure amplitude. Future work can expand to tests with different structural sizes and develop predictive models for local ice pressure amplitude considering multiple factors, combining field measurements and numerical simulations.
The above research results provide important theoretical support and data references for ice-resistant design of polar offshore structures.

Author Contributions

Y.X.: formal analysis, data curation, and investigation writing—original draft; D.Z.: funding acquisition, project administration and supervision; K.W.: writing—review and editing, visualization; X.P.: resources; X.J.: software, validation; G.W.: conceptualization, methodology. All authors have read and agreed to the published version of the manuscript.

Funding

This work was funded by the National Natural Science Foundation of China (Grant No. 52071055), the National Key Research and Development Program of China (Grant No. 2023YFC2809104), and the Liaoning Provincial Natural Science Foundation Joint Fund (Grant No. DUT24BS031).

Institutional Review Board Statement

Not applicable.

Informed Consent Statement

Not applicable.

Data Availability Statement

The data presented in this study are available on request from the corresponding author. The data are not publicly available due to some of the data will be used in future research projects.

Conflicts of Interest

The authors declare no conflicts of interest.

References

  1. Kim, H.; Ulan-Kvitberg, C.; Daley, C. Evaluation of spatial pressure distribution during ice-structure interaction using pressure indicating film. Int. J. Nav. Archit. Ocean Eng. 2014, 6, 578–597. [Google Scholar] [CrossRef]
  2. Jordaan, I.; Li, C.; Sudom, D.; Stuckey, P.; Ralph, F. Principles for local and global ice design using pressure-area relationships. In Proceedings of the 18th International Conference on Port and Ocean Engineering Under Arctic Conditions, Potsdam, NY, USA, 26–30 June 2005; Volume 1, pp. 375–386. [Google Scholar]
  3. Jordaan, I.J.J.C.R.S. Mechanics of ice–structure interaction. Eng. Fract. Mech. 2001, 68, 1923–1960. [Google Scholar] [CrossRef]
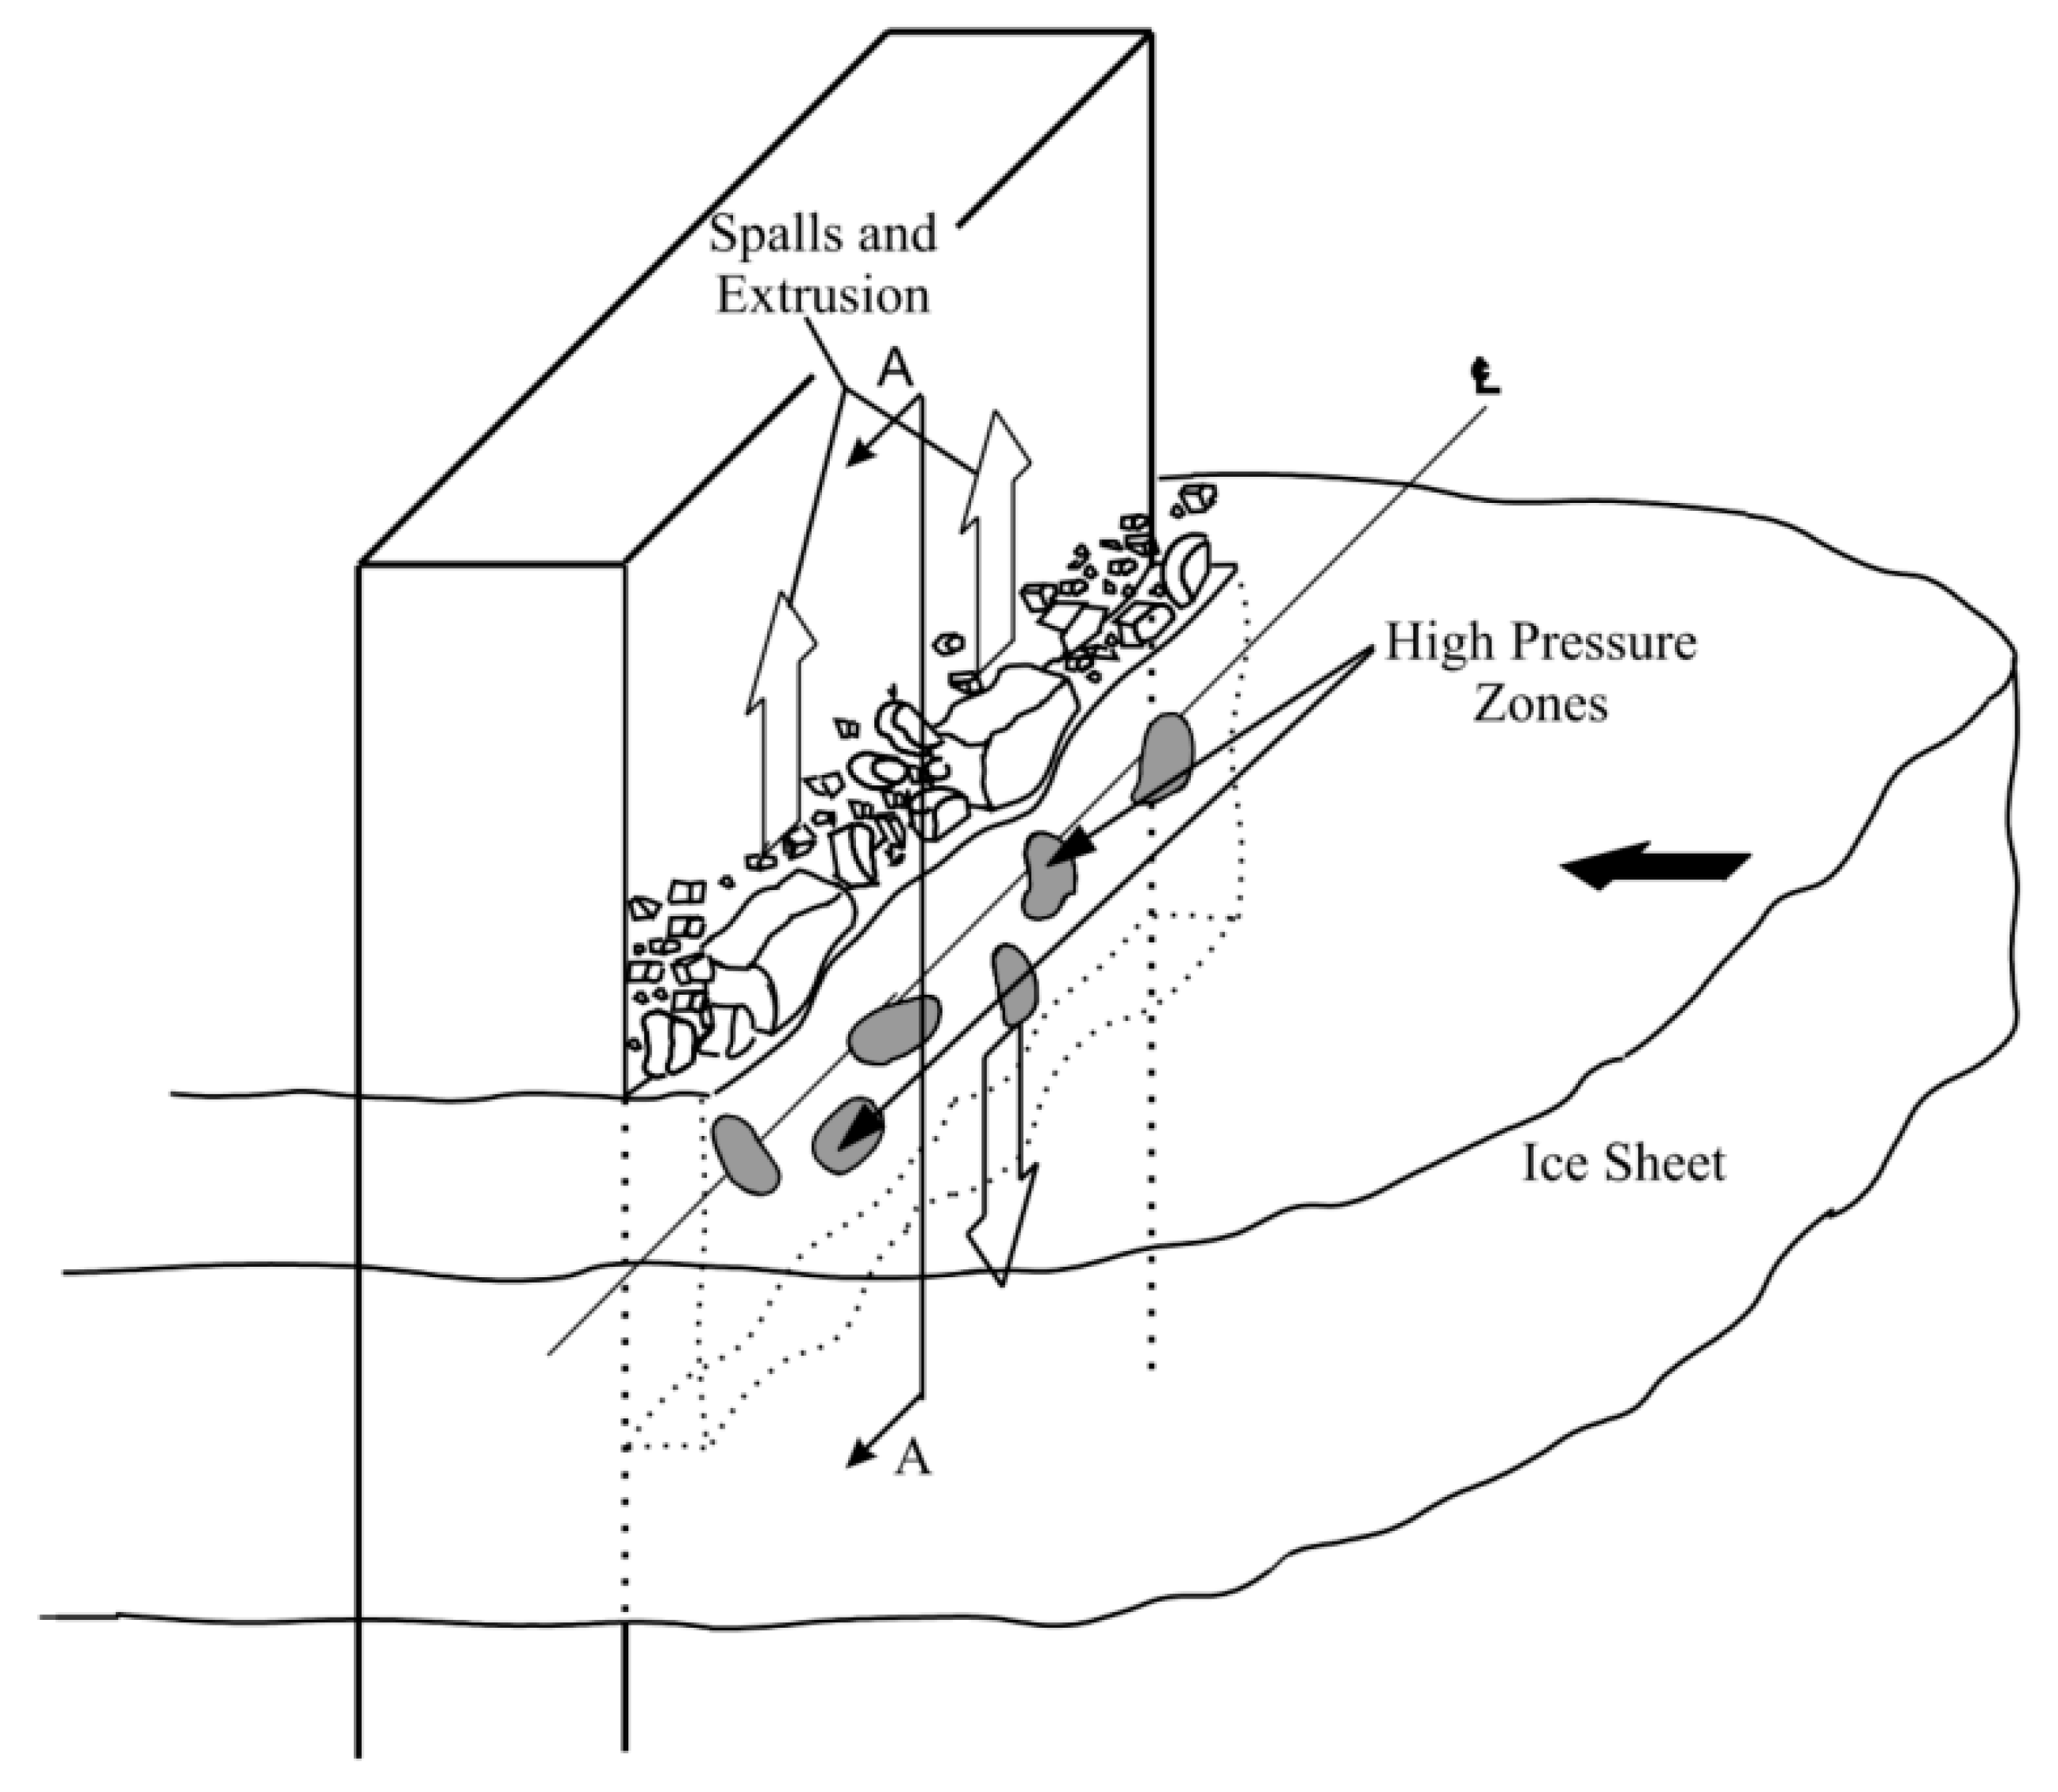
  4. Taylor, R.; Frederking, R.; Jordaan, I. The nature of high pressure zones in compressive ice failure. In Proceedings of the 19th International Symposium on Ice, Vancouver; IAHR: Beijing, China, 2008; pp. 1001–1010. [Google Scholar]
  5. Frederking, R. Ice pressure variations during indentation. In Proceedings of the International Association of Hydraulic Research Symposium on Ice, Saint Petersburg, Russia, 21–25 June 2004. [Google Scholar]
  6. Riska, K.; Rantala, H.; Joensuu, A. Full Scale Observations on Ship-Ice Contact Results from Tests Series Onboard IB Sampo, Winter 1989; Report M-97; Helsinki University of Technology, Laboratory of Naval Architecture and Marine Engineering: Espoo, Finland, 1990. [Google Scholar]
  7. Timco, G.; Sudom, D. Revisiting the Sanderson pressure–area curve: Defining parameters that influence ice pressure. Cold Reg. Sci. Technol. 2013, 95, 53–66. [Google Scholar] [CrossRef]
  8. Frederking, R.; Timco, G.; Wright, B. Ice Pressure Distributions from First-Year Sea Ice Features Interacting with the Molikpaq in the Beaufort Sea. In Proceedings of the The Ninth International Offshore and Polar Engineering Conference, Brest, France, 30 May–4 June 1999. [Google Scholar]
  9. Masterson, D.M.; Frederking, R.M.W. Local contact pressures in ship/ice and structure/ice interactions. Cold Reg. Sci. Technol. 1993, 21, 169–185. [Google Scholar] [CrossRef]
  10. Masterson, D.; Frederking, R.; Wright, B.; Kärnä, T.; Maddock, W.P. A Revised Ice Pressure-Area Curve. In Proceedings of the 19th International Conference on Port and Ocean Engineering under Arctic Conditions, Dalian, China, 27–30 June 2007. [Google Scholar]
  11. Sanderson, T.J. Ice Mechanics and Risks to Offshore Structures; Graham & Trotman: Barnet, UK, 1988. [Google Scholar]
  12. Kärnä, T.; Qu, Y.; Yue, Q. An Extreme Value Analysis of Local Ice Pressures. In SNAME International Conference and Exhibition on Performance of Ships and Structures in Ice; SNAME: Attica, Greece, 2006. [Google Scholar]
  13. Wells, J.; Jordaan, I.; Derradji-Aouat, A.; Taylor, R. Small-scale laboratory experiments on the indentation failure of polycrystalline ice in compression: Main results and pressure distribution. Cold Reg. Sci. Technol. 2011, 65, 314–325. [Google Scholar] [CrossRef]
  14. Kuutti, J.; Kolari, K.; Marjavaara, P. Simulation of ice crushing experiments with cohesive surface methodology. Cold Reg. Sci. Technol. 2013, 92, 17–28. [Google Scholar] [CrossRef]
  15. Sodhi, D.S. Crushing failure during ice–structure interaction. Eng. Fract. Mech. 2001, 68, 1889–1921. [Google Scholar] [CrossRef]
  16. Palmer, A.C.; Dempsey, J.P.; Masterson, D.M. A revised ice pressure-area curve and a fracture mechanics explanation. Cold Reg. Sci. Technol. 2009, 56, 73–76. [Google Scholar] [CrossRef]
  17. Su, B.; Riska, K.; Moan, T. Numerical simulation of local ice loads in uniform and randomly varying ice conditions. Cold Reg. Sci. Technol. 2011, 65, 145–159. [Google Scholar] [CrossRef]
  18. Taylor, R.S.; Richard, M.; Hossain, R. A probabilistic high-pressure zone model for local and global loads during ice-structure interactions. J. Offshore Mech. Arct. Eng. 2019, 141, 051604. [Google Scholar] [CrossRef]
  19. Shamaei, F.; Bergström, M.; Li, F.; Taylor, R.; Kujala, P. Local pressures for ships in ice: Probabilistic analysis of full-scale line-load data. Mar. Struct. 2020, 74, 102822. [Google Scholar] [CrossRef]
  20. Long, X.; Liu, L.; Liu, S.W.; Ji, S. Discrete Element Analysis of High-Pressure Zones of Sea Ice on Vertical Structures. J. Mar. Sci. Eng. 2021, 9, 348. [Google Scholar] [CrossRef]
  21. Wang, G.; Yue, Q.; Zhang, D.; Fu, Y.; Peng, X.; Dong, R. Distribution analysis of local ice pressures in the indentation test at various velocities. J. Mar. Sci. Eng. 2022, 10, 433. [Google Scholar] [CrossRef]
  22. Zhao, W.D.; Leira, B.J.; Hoyland, K.V.; Kim, E.; Feng, G.; Ren, H. A Framework for Structural Analysis of Icebreakers during Ramming of First-Year Ice Ridges. J. Mar. Sci. Eng. 2024, 12, 611. [Google Scholar] [CrossRef]
  23. International Organization for Standardization. Petroleum and Natural Gas Industries: Arctic Offshore Structures; Canadian Standards Association: Toronto, ON, Canada, 2020. [Google Scholar]
  24. Rong, L.; Jiao, J. Computational Fluid Dynamics (CFD)-Finite Element Analysis (FEM)-Discrete Element Method (DEM) Simulation Method for Flow-Fixing Coupling of Ships Sailing in Ice Areas. CN 115081349-A, 12 May 2022. [Google Scholar]
  25. He, S.; Chen, X.; Cui, H.; Ji, S. A study on ice induced vibration of a ship structure based on full scale measurement. J. Vib. Shock 2023, 42, 319–326. [Google Scholar]
  26. Lemström, I.; Polojärvi, A.; Puolakka, O.; Tuhkuri, J. Load distributions in the ice-structure interaction process in shallow water. Ocean Eng. 2022, 258, 111730. [Google Scholar] [CrossRef]
  27. Wang, C.; Gong, J.J.; Zhang, Y.; Liu, L.; Lou, M. Investigating Load Calculation for Broken Ice and Cylindrical Structures Using the Discrete Element Method. J. Mar. Sci. Eng. 2024, 12, 395. [Google Scholar] [CrossRef]
  28. Liu, L.; Yin, Z.; Ji, S. High-performance dilated polyhedral based DEM for ice loads on ship and offshore platform structures. Chinese. J. Theor. Appl. Mech. 2019, 51, 1720–1739. [Google Scholar]
  29. Erceg, S.; Erceg, B.; Polach, F.V.U.; Ehlers, S. A simulation approach for local ice loads on ship structures in level ice. Mar. Struct. 2022, 81, 103117. [Google Scholar] [CrossRef]
  30. Johnston, M.; Croasdale, K.R.; Jordaan, I.J. Localized pressures during ice–structure interaction: Relevance to design criteria. Cold Reg. Sci. Technol. 1998, 27, 105–117. [Google Scholar] [CrossRef]
  31. Daley, C. A Study of the Process-Spatial Link in Ice Pressure-Area Relationships; PERD, Memorial University of Newfoundland: St. John, NL, Canada, 2004. [Google Scholar]
  32. Kim, H.; Daley, C.; Ulan-Kvitberg, C. Reappraisal of Pressure Distribution Induced by Ice-Structure Interaction using High-precision Pressure Measurement Film. In SNAME International Conference and Exhibition on Performance of Ships and Structures in Ice; SNAME: Attica, Greece, 2012. [Google Scholar]
Disclaimer/Publisher’s Note: The statements, opinions, and data contained in all publications are solely those of the individual author(s) and contributor(s) and not of MDPI and/or the editor(s). MDPI and/or the editor(s) disclaim responsibility for any injury to people or property resulting from any ideas, methods, instructions, or products referred to in the content.
Figure 1. Diagram of interaction progress between sea ice and structure from Jordaan [3].
Jmse 12 01634 g001
Figure 2. Model test system in laboratory.
Jmse 12 01634 g002
Figure 3. Analysis of global ice force and local ice pressure data for 0516-v1h55: (a) time history diagram of global ice force; (b) processed history diagram of global ice force; (c) diagram of local ice pressure distribution for 99.42 s; (d) diagram of local ice pressure distribution for 108.5 s.
Jmse 12 01634 g003
Figure 4. Relationship between local ice pressure distribution and time history of global ice force: (a) v = 1 mm/s; (b) v = 4 mm/s; (c) v = 7 mm/s; (d) v = 15 mm/s.
Jmse 12 01634 g004
Figure 5. Proportion of local ice pressure high-pressure zone.
Jmse 12 01634 g005
Figure 6. Relationship between local ice pressure amplitude ratio Rp and loading speed.
Jmse 12 01634 g006
Figure 7. Relationship between local ice pressure amplitude ratio Rp and ice thickness: (a) V = 1 mm/s; (b) V = 10 mm/s.
Jmse 12 01634 g007
Figure 8. Concept diagram of CAM method [1,32].
Jmse 12 01634 g008
Figure 9. Local area selection method.
Jmse 12 01634 g009
Figure 10. RpRA curves of tests and ISO [23] under different ice thicknesses: (a) V = 1 mm/s; (b) V = 10 mm/s.
Jmse 12 01634 g010
Figure 11. The relationship between thickness-to-width ratio Rh and coefficient k: (a) the relationship between thickness-to-width ratio Rh and coefficient k under ductile failure; (b) the relationship between thickness-to-width ratio Rh and coefficient k under brittle fracture.
Jmse 12 01634 g011
Table 1. Key parameters for discrete element calculations.
Test Number Start Time (s)End Time (s)Ice Sheet Thickness (mm)Loading Speed (mm/s)
0304-v10h3313333310
0305-v10h4513334510
0306-v1h18752801810
0308-v1h1275280121
0309-v10h141333141
0516-v1h5560200551
0531-v1h4260200421
0602-v7h652252657
0606-v4h652275654
0606-v15h658226515
Table 2. Probability of p T max occurring in three stages.
Loading Speed (mm/s)Loading StagePeak TimeUnloading Stage
ProportionNumber of OccurrencesProportionNumber of OccurrencesProportionNumber of Occurrences
152.9%947.1%800
445.5%1040.9%913.6%3
730.0%665.0%135.0%1
1016.7%333.3%650.0%9
1546.2%623.1%330.8%4
Table 3. Fitting parameters of local ice pressure area curve under different ice thicknesses.
Loading Speed (mm/s)Ice Thickness (mm²)Coefficient kExponent α
1120.854−0.2690.99
180.874−0.4110.98
420.976−0.3420.96
551.120−0.3420.94
10140.900−0.3170.96
330.930−0.3270.98
451.097−0.3000.92
Table 4. Simplified RpRA local ice pressure–area curve parameters.
Loading Speed (mm/s)Ice Thickness (mm²)Coefficient kExponent α
1120.8540.711 −0.341
180.8741.078 −0.341
420.9760.981 −0.341
551.1201.124 −0.341
10140.9000.905 −0.315
330.9300.968 −0.315
451.0971.039 −0.315
Disclaimer/Publisher’s Note: The statements, opinions and data contained in all publications are solely those of the individual author(s) and contributor(s) and not of MDPI and/or the editor(s). MDPI and/or the editor(s) disclaim responsibility for any injury to people or property resulting from any ideas, methods, instructions or products referred to in the content.

